Risk Score to Predict Dental Caries in Adult Patients for Use in the Clinical Setting


Abstract
:1. Introduction
2. Materials and Methods
2.1. Sample Size Calculation and Sampling
2.2. Variables Definition
2.3. Statistical Analysis
2.3.1. Assessment of Risk Factors
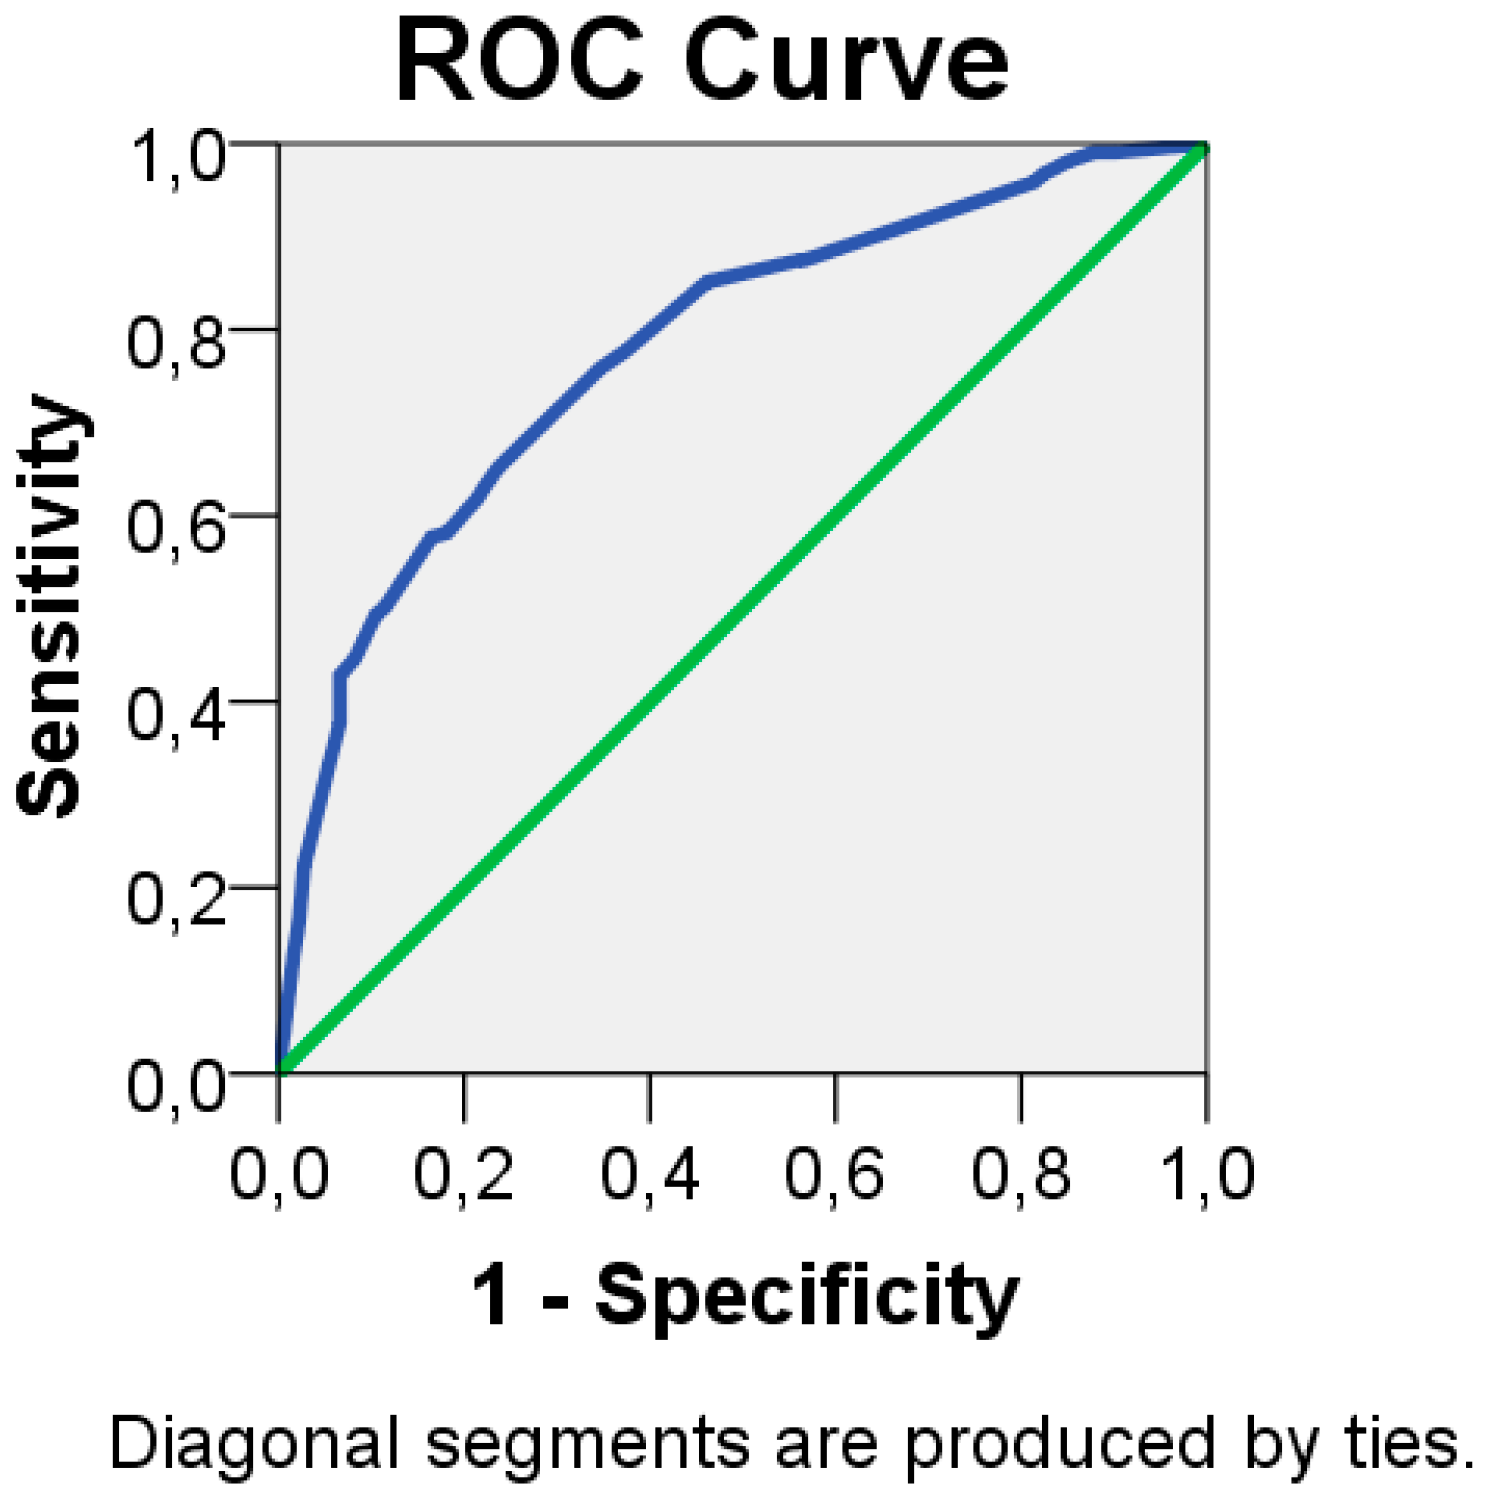
2.3.2. Development of a Risk Score
3. Results
3.1. Participants
3.2. Risk Model
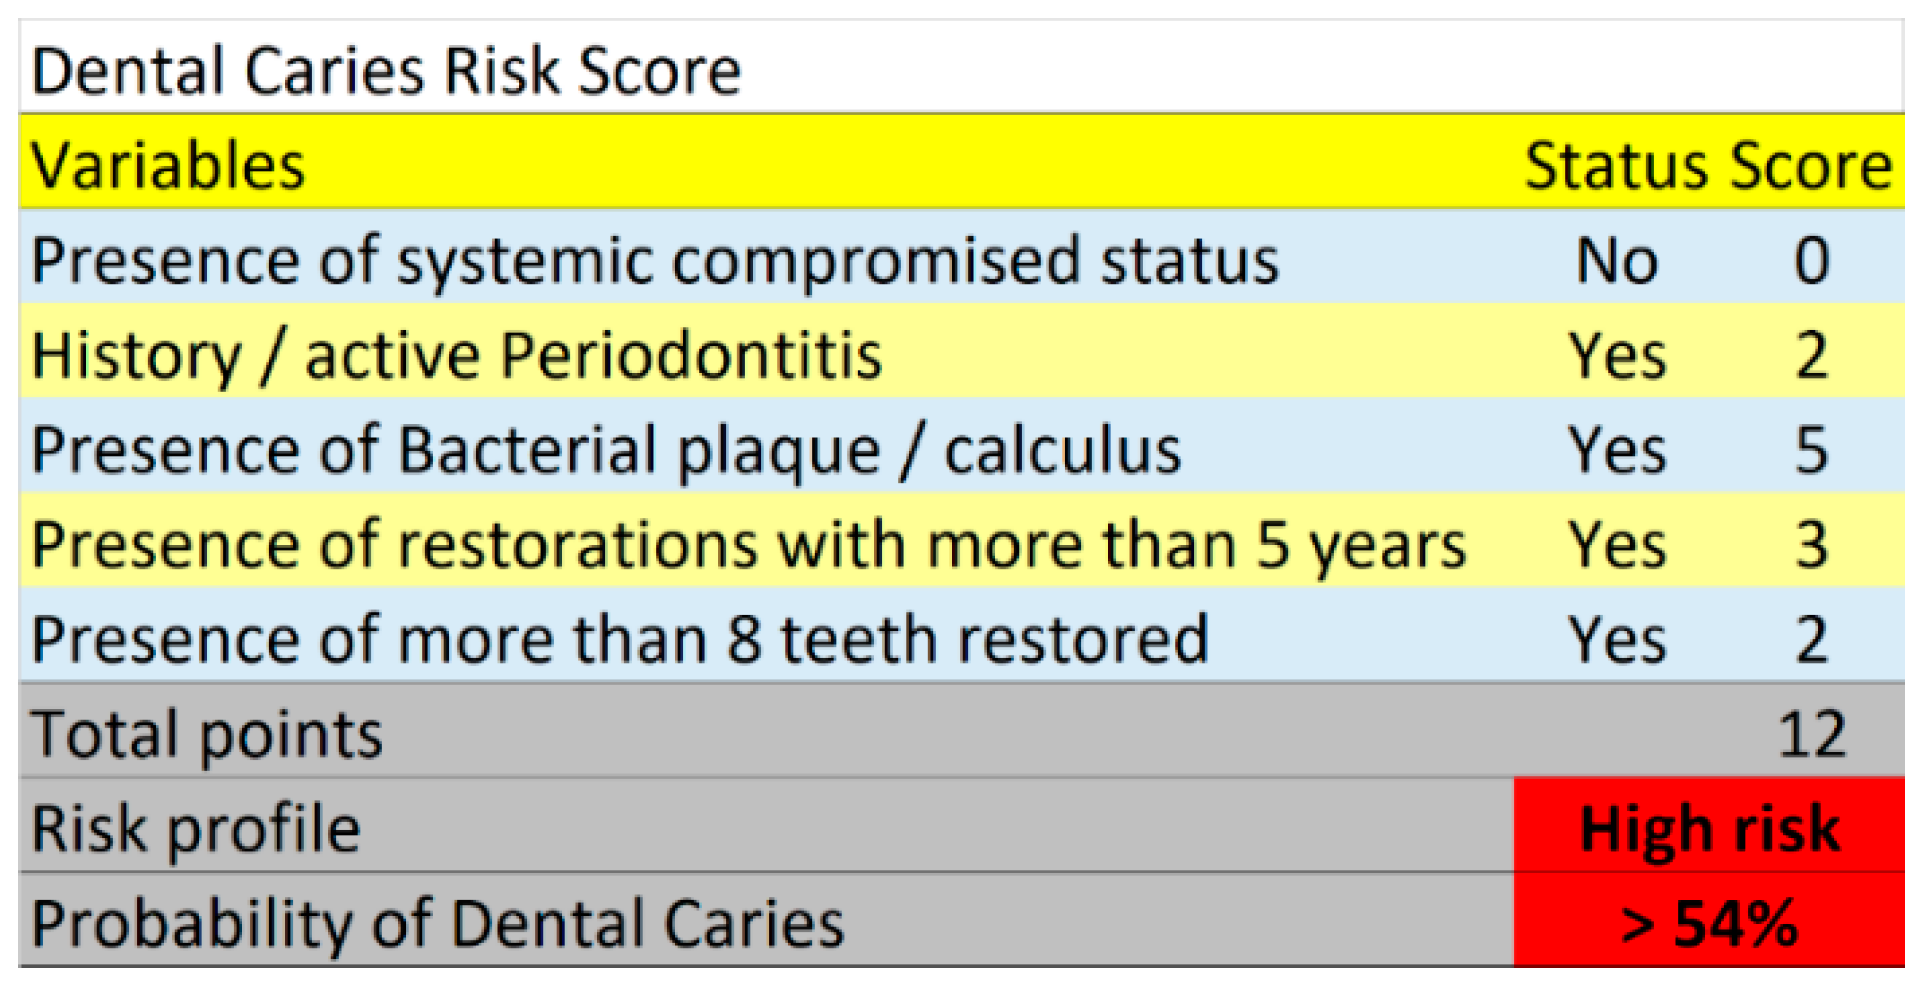
3.3. Risk Score
4. Discussion
5. Conclusions
Author Contributions
Acknowledgments
Conflicts of Interest
References
- Petersen, P.E.; Bourgeois, D.; Ogawa, H.; Estupinan-Day, S.; Ndiaye, C. The global burden of oral diseases and risks to oral health. Bull. World Health Organ. 2005, 83, 661–669. [Google Scholar] [PubMed]
- Jin, L.; Lamster, I.; Greenspan, J.; Pitts, N.; Scully, C.; Warnakulasuriya, S. Global burden of oral diseases: Emerging concepts, management and interplay with systemic health. Oral Dis. 2016, 22, 609–619. [Google Scholar] [CrossRef] [PubMed]
- Ng, A.J.; Vieira, A.R. Pittsburgh as a High Risk Population: The Potential Savings of a Personalized Dental Care Plan. Intern. J. Dent. 2016, 2016, 1–3. [Google Scholar] [CrossRef] [PubMed]
- Sheiham, A.; James, W.P. Diet and dental caries: The pivotal role of free sugars reemphasized. J. Dent. Res. 2015, 94, 1341–1347. [Google Scholar] [CrossRef] [PubMed]
- Chapple, I.I.; Bouchard, M.G.; Cagetti, G.; Campus, C.; Carra, F.; Cocco, I.; Nibali, L.; Hujoel, P.; Laine, M.L.; Lingstrom, P.; et al. Interaction of lifestyle, behavior or systemic diseases with dental caries and periodontal diseases: Consensus report of group 2 of the joint EFP/ORCA workshop on the boundaries between caries and periodontal diseases. J. Clin. Periodontol. 2017, 44, 39S–51S. [Google Scholar] [CrossRef] [PubMed]
- Ritter, A.V.; A Shugars, D.; Bader, J.D. Root caries risk indicators: A systematic review of risk models. Commun. Dent. Oral Epidemiol. 2010, 38, 383–397. [Google Scholar] [CrossRef] [PubMed]
- Genco, R.J.; Genco, F.D. Common Risk Factors in the Management of Periodontal and Associated Systemic Diseases: The Dental Setting and Interprofessional Collaboration. J. Evid. Based Dent. Pract. 2014, 14, 4–16. [Google Scholar] [CrossRef]
- Zweig, M.H.; Campbell, G. Receiver-operating characteristic (ROC) plots: A fundamental evaluation tool in clinical medicine. Clin. Chem. 1993, 39, 561–577. [Google Scholar]
- Nobre, M.D.A.; Maló, P. Prevalence of periodontitis, dental caries, and peri-implant pathology and their relation with systemic status and smoking habits: Results of an open-cohort study with 22009 patients in a private rehabilitation center. J. Dent. 2017, 67, 36–42. [Google Scholar] [CrossRef]
- Dupont, W.D.; Plummer, W.D. ·P-58 Power and sample size calculations: A review and computer program. Control. Clin. Trials 1990, 11, 301. [Google Scholar] [CrossRef]
- Rothen, M.; Cunha-Cruz, J.; Zhou, L.; Mancl, L.; Jones, J.S.; Berg, J.; Cunha-Cruz, J. Oral hygiene behaviors and caries experience in Northwest PRECEDENT patients. Commun. Dent. Oral Epidemiol. 2014, 42, 526–535. [Google Scholar] [CrossRef] [PubMed]
- Waroux, O.L.P.D.; Maguire, H.; Moren, A. The case-cohort design in outbreak investigations. Eurosurveillance 2012, 17, 20202. [Google Scholar]
- World Health Organization. Oral Health Surveys: Basic Methods; World Health Organization: Geneva, Switzerland, 2013. [Google Scholar]
- Evans, R.W.; Pakdaman, A.; Dennison, P.J.; Howe, E.L. The Caries Management System: An evidence-based preventive strategy for dental practitioners. Application for adults. Aust. Dent. J. 2008, 53, 83–92. [Google Scholar] [CrossRef] [PubMed]
- Goldthorpe, J.H. On Sociology; Goldthorpe, J.H., Ed.; Stanford University Press: Stanford, MT, USA, 2000. [Google Scholar]
- Parameter on Plaque-Induced Gingivitis. J. Periodontol. 2000, 71, 851–852. [CrossRef] [PubMed]
- Gurel, G.; Chu, S.; Kim, J. Restorative space management. In Aesthetic Restorative Dentistry Principles and Practice; Tarnow, D., Chu, S., Kim, J., Eds.; Quintessence: Mahwah, NJ, USA, 2008; pp. 405–425. [Google Scholar]
- Silness, J.; Löe, H. Periodontal disease in pregnancy. 3. Response to local treatment. Acta Odontol. Scand. 1966, 24, 747–759. [Google Scholar] [CrossRef] [PubMed]
- Bronkhorst, E.; Pallesen, U.; Gaengler, P.; Opdam, N.; Van De Sande, F.; Cenci, M.; Bottenberg, P.; Lindberg, A.; Huysmans, M.; Van Dijken, J. Longevity of Posterior Composite Restorations. J. Dent. Res. 2014, 93, 943–949. [Google Scholar]
- Schouten, E.G.; Dekker, J.M.; Kok, F.J.; Le Cessie, S.; Van Houwelingen, H.C.; Pool, J.; Vandnbroucke, J.P. Risk ratio and rate ratio estimation in case-cohort designs: Hypertension and cardiovascular mortality. Statist. Med. 1993, 12, 1733–1745. [Google Scholar] [CrossRef]
- Sullivan, L.M.; Massaro, J.M.; D’Agostino, R.B. Presentation of multivariate data for clinical use: The Framingham Study risk score functions. Statist. Med. 2004, 23, 1631–1660. [Google Scholar] [CrossRef]
- Mrdovic, I.; Savic, L.; Krljanac, G.; Asanin, M.; Lasica, R.; Djuricic, N.; Brdar, N.; Marinkovic, J.; Kocev, N.; Perunicic, J. Simple risk algorithm to predict serious bleeding in patients with ST-segment elevation myocardial infarction undergoing primary percutaneous coronary intervention: RISK-PCI bleeding score. Circ. J. 2013, 77, 1719–1727. [Google Scholar] [CrossRef]
- Nobre, M.D.A.; Azul, A.M.; Rocha, E.; Maló, P.; Salvado, F.J. Attributable fractions, modifiable risk factors and risk stratification using a risk score for peri-implant pathology. J. Prosthodont. Res. 2017, 61, 43–53. [Google Scholar] [CrossRef]
- Casagrande, L.; Seminario, A.T.; Corrêa, M.B.; Werle, S.B.; Maltz, M.; Demarco, F.F.; De Araujo, F.B. Longevity and associated risk factors in adhesive restorations of young permanent teeth after complete and selective caries removal: A retrospective study. Clin. Oral Investig. 2016, 21, 847–855. [Google Scholar] [CrossRef] [PubMed]
- Chaffee, B.W.; Cheng, J.; Featherstone, J.D. Baseline caries risk assessment as a predictor of caries incidence. J. Dent. 2015, 43, 518–524. [Google Scholar] [CrossRef] [PubMed]
- Prentice, R.L. A case-cohort design for epidemiologic cohort studies and disease prevention trials. Biometrika 1986, 73, 1–11. [Google Scholar] [CrossRef]
- Fontana, M.; Young, D.A.; Wolff, M.S. Evidence-Based Caries, Risk Assessment, and Treatment. Dent. Clin. N. Am. 2009, 53, 149–161. [Google Scholar] [CrossRef] [PubMed]
- Tellez, M.; Gomez, J.; Pretty, I.; Ellwood, R.; Ismail, A.I. Evidence on existing caries risk assessment systems: Are they predictive of future caries? Community. Dent. Oral. Epidemiol. 2013, 41, 67–78. [Google Scholar] [CrossRef] [PubMed]
- Scheinin, A.; Pienihäkkinen, K.; Tiekso, J.; Holmberg, S.; Fukuda, M.; Suzuki, A. Multifactorial modeling for root caries prediction: 3-year follow-up results. Commun. Dent. Oral Epidemiol. 1994, 22, 126–129. [Google Scholar] [CrossRef]
- Doméjean, S.; White, J.M.; Featherstone, J.D.B. Validation of the CDA CAMBRA caries risk assessment—A six-year retrospective study. J. Calif. Dent. Assoc. 2011, 39, 709–715. [Google Scholar]
- Jepsen, S.; Blanco, J.; Buchalla, W.; Carvalho, J.C.; Dietrich, T.; Dörfer, C.; Eaton, K.A.; Figuero, E.; Frencken, J.E.; Graziani, F.; et al. Prevention and control of dental caries and periodontal diseases at individual and population level: Consensus report of group 3 of joint EFP/ORCA workshop on the boundaries between caries and periodontal diseases. J. Clin. Periodontol. 2017, 44, S85–S93. [Google Scholar] [CrossRef]
- Hermann, P.; Borbély, J.; Gera, I.; Fejérdy, P.; Soós, B.; Madléna, M. [Risk assessment of periodontal disease in Hungary]. Fogorv. Szle. 2011, 104, 324–328. [Google Scholar]
- Johnston, L.; Vieira, A.R. Caries experience and overall health status. Oral Health Prev. Dent. 2014, 12, 163–170. [Google Scholar]
- Zero, D.; Fontana, M.; Lennon, A.M. Clinical applications and outcomes of using indicators of risk in caries management. J. Dent. Educ. 2001, 65, 1126–1132. [Google Scholar] [PubMed]
- Mejàre, I.; Axelsson, S.; Dahlén, G.; Espelid, I.; Norlund, A.; Tranæus, S.; Twetman, S. Caries risk assessment. A systematic review. Acta Odontol. Scand. 2014, 72, 81–91. [Google Scholar]
- Takano, N.; Ando, Y.; Yoshihara, A.; Miyazaki, H. Factors associated with root caries incidence in an elderly population. Commun. Dent Health 2003, 20, 217–222. [Google Scholar]
- Mattila, P.T.; Niskanen, M.C.; Vehkalahti, M.M.; Nordblad, A.; Knuuttila, M.L.E. Prevalence and simultaneous occurrence of periodontitis and dental caries. J. Clin. Periodontol. 2010, 37, 962–967. [Google Scholar] [CrossRef] [PubMed]
- Vieira, A.R.; Modesto, A.; Marazita, M.L. Caries: Review of Human Genetics Research. Caries Res. 2014, 48, 491–506. [Google Scholar] [CrossRef] [PubMed]
- Rothman, K.J.; Greenland, S. Causation and Causal Inference in Epidemiology. Am. J. Public. Health 2005, 95, S144–S150. [Google Scholar] [CrossRef] [PubMed]
- Bretz, W.A.; Corby, P.M.A.; Costa, S.; Quadros, M.; Tavares, V.S.; Moreira, G.; Filho, M.R.M.; Weyant, R.J. Microbial acid production (Clinpro Cario L-Pop) and dental caries in infants and children. Quintessence Int. 2007, 38, e213–e217. [Google Scholar] [PubMed]


| Total (%) | Cases (% Total) | Controls (% Total) | |
|---|---|---|---|
| Number | 397 (100%) | 177 (44.6%) | 220 (55.4%) |
| Age average (standard deviation) | 51 (14.9) | 52 (15.6) | 51 (14.4) |
| Gender | |||
| Female | 226 (100%) | 93 (41.2%) | 133 (58.8%) |
| Male | 171 (100%) | 84 (49.1%) | 87 (50.9%) |
| Systemic conditions * | |||
| Absent | 288 (100%) | 120 (41.7%) | 168 (58.3%) |
| Present | 109 (100%) | 57 (52.3%) | 52 (47.7%) |
| Smoking | |||
| Non-smoker | 295 (100%) | 134 (45.4%) | 161 (54.6%) |
| Smoker | 102 (100%) | 43 (42.2%) | 59 (57.8%) |
| Antidepressant medication | |||
| Absent | 371 (100%) | 162 (43.7%) | 209 (56.3%) |
| Present | 26 (100%) | 15 (57.7%) | 11 (42.3%) |
| Periodontitis (history or active) | |||
| Absent | 252 (100%) | 97 (38.5%) | 155 (61.5%) |
| Present | 145 (100%) | 80 (55.2%) | 65 (44.8%) |
| Dental Crowding | |||
| Absent | 288 (100%) | 124 (43.1%) | 164 (56.9%) |
| Present | 109 (100%) | 53 (48.6%) | 56 (51.4%) |
| Average number of teeth present | 20.6 (7.1%) | 21.2 (7.0%) | 20.2 (7.2%) |
| Bacterial Plaque/Calculus | |||
| Absent | 259 (100%) | 83 (32.0%) | 176 (68.0%) |
| Present | 138 (100%) | 94 (68.1%) | 44 (31.9%) |
| Previous caries experience | |||
| Absent | 16 (100%) | 5 (31.2%) | 11 (68.8%) |
| Present | 381 (100%) | 172 (45.1%) | 209 (54.9%) |
| Restoration > 5 years | |||
| Absent | 67 (100%) | 17 (25.4%) | 50 (74.6%) |
| Present | 330 (100%) | 160 (48.5%) | 170 (51.5%) |
| Number of restored teeth | |||
| </=8 teeth | 226 (100%) | 80 (35.4%) | 146 (64.6%) |
| >8 teeth | 171 (100%) | 97 (56.7%) | 74 (43.3%) |
| Socioeconomic status ** | |||
| 1st category | 108(100%) | 43(39.8%) | 65(60.2%) |
| 2nd category | 204(100%) | 96(47.1%) | 108(52.9%) |
| 3rd category | 48(100%) | 23(47.9%) | 25(52.1%) |
| Variables | Univariable Risk Ratio (95% Confidence Intervals) | Univariable p-Value | Multivariable Risk Ratio (95% Confidence Intervals) * | Multivariable p-Value | Multivariable β Coefficient after Validation (Standard Error) | Risk Score Points |
|---|---|---|---|---|---|---|
| Age | 1.0 (0.99;1.02) | 0.522 | ||||
| Gender | ||||||
| Female | 1.0 (reference) | |||||
| Male | 1.38 (0.93;2.06) | 0.114 | ||||
| Systemic condition | ||||||
| Absent | 1.0 (reference) | 1.0 (reference) | ||||
| Present | 1.54 (0.99;2.39) | 0.058 | 1.35 (0.83;2.22) | 0.224 | 0.306 (0.251) | 1 |
| Smoking | ||||||
| Non-smoker | 1.0 (reference) | |||||
| Smoker | 0.88 (0.56;1.38) | 0.567 | ||||
| Antidepressant medication | ||||||
| Absent | 1.0 (reference) | |||||
| Present | 1.76 (0.79;3.93) | 0.169 | ||||
| Periodontitis | ||||||
| Absent | 1.0 (reference) | 1.0 (reference) | ||||
| Present | 1.97 (1.30;2.98) | 0.001 | 1.69 (1.07;2.66) | 0.024 | 0.523 (0.232) | 2 |
| Dental crowding | ||||||
| Absent | 1.0 (reference) | |||||
| Present | 1.25 (0.80;1.95) | 0.320 | ||||
| Bacterial plaque/calculus | ||||||
| Absent | 1.0 (reference) | 1.0 (reference) | ||||
| Present | 4.53 (2.91;7.06) | <0.001 | 4.12 (2.59;6.55) | <0.001 | 1.415 (0.237) | 5 |
| Previous experience of caries | ||||||
| Absent | 1.0 (reference) | |||||
| Present | 1.81 (0.62;5.31) | 0.280 | ||||
| Restorations > 5 years | ||||||
| Absent | 1.0 (reference) | 1.0 (reference) | ||||
| Present | 2.77 (1.53;5.0) | 0.001 | 2.30 (1.21;4.37) | 0.011 | 0.834 (0.327) | 3 |
| Number of restored teeth | ||||||
| </=8 teeth | 1.0 (reference) | 1.0 (reference) | ||||
| >8 teeth | 2.39 (1.59;3.6) | <0.001 | 2.03 (1.3;3.19) | 0.002 | 0.710 (0.229) | 2 |
| Number of teeth present | 1.02 (0.99;1.05) | 0.198 | ||||
| Socioeconomic status | 0.431 | |||||
| 1st category | 1.0 (reference) | |||||
| 2nd category | 1.34 (0.84;2.16) | 0.221 | ||||
| 3rd category | 1.39 (0.7;2.76) | 0.345 | ||||
| Risk Score (Sum of Points) | Risk Group and Predicted Probability Estimated from the Risk Score | Within Group Incidence of Dental Caries | Observed Incidence of Dental Caries |
|---|---|---|---|
| 0–3 points | <27%-low risk (<0.5 pre-analysis risk) | 27/107 = 25.2% | 27/397 = 6.8% |
| 4–7 points | 27%–54%-moderate risk (0.5 to < 1 times pre-analysis risk) | 81/163 = 49.7% | 81/397 = 20.4% |
| >/=8 points | >54%-high risk (>1 times pre-analysis risk) | 107/127 = 84.3% | 107/397 = 27.0% |
© 2019 by the authors. Licensee MDPI, Basel, Switzerland. This article is an open access article distributed under the terms and conditions of the Creative Commons Attribution (CC BY) license (http://creativecommons.org/licenses/by/4.0/).
Share and Cite
de Araújo Nobre, M.; Sezinando, A.; Fernandes, I.; Maló, P. Risk Score to Predict Dental Caries in Adult Patients for Use in the Clinical Setting. J. Clin. Med. 2019, 8, 203. https://doi.org/10.3390/jcm8020203
de Araújo Nobre M, Sezinando A, Fernandes I, Maló P. Risk Score to Predict Dental Caries in Adult Patients for Use in the Clinical Setting. Journal of Clinical Medicine. 2019; 8(2):203. https://doi.org/10.3390/jcm8020203
Chicago/Turabian Stylede Araújo Nobre, Miguel, Ana Sezinando, Inês Fernandes, and Paulo Maló. 2019. "Risk Score to Predict Dental Caries in Adult Patients for Use in the Clinical Setting" Journal of Clinical Medicine 8, no. 2: 203. https://doi.org/10.3390/jcm8020203
APA Stylede Araújo Nobre, M., Sezinando, A., Fernandes, I., & Maló, P. (2019). Risk Score to Predict Dental Caries in Adult Patients for Use in the Clinical Setting. Journal of Clinical Medicine, 8(2), 203. https://doi.org/10.3390/jcm8020203