Assessment of Renal Dysfunction Improves the Simplified Pulmonary Embolism Severity Index (sPESI) for Risk Stratification in Patients with Acute Pulmonary Embolism

Abstract
1. Introduction
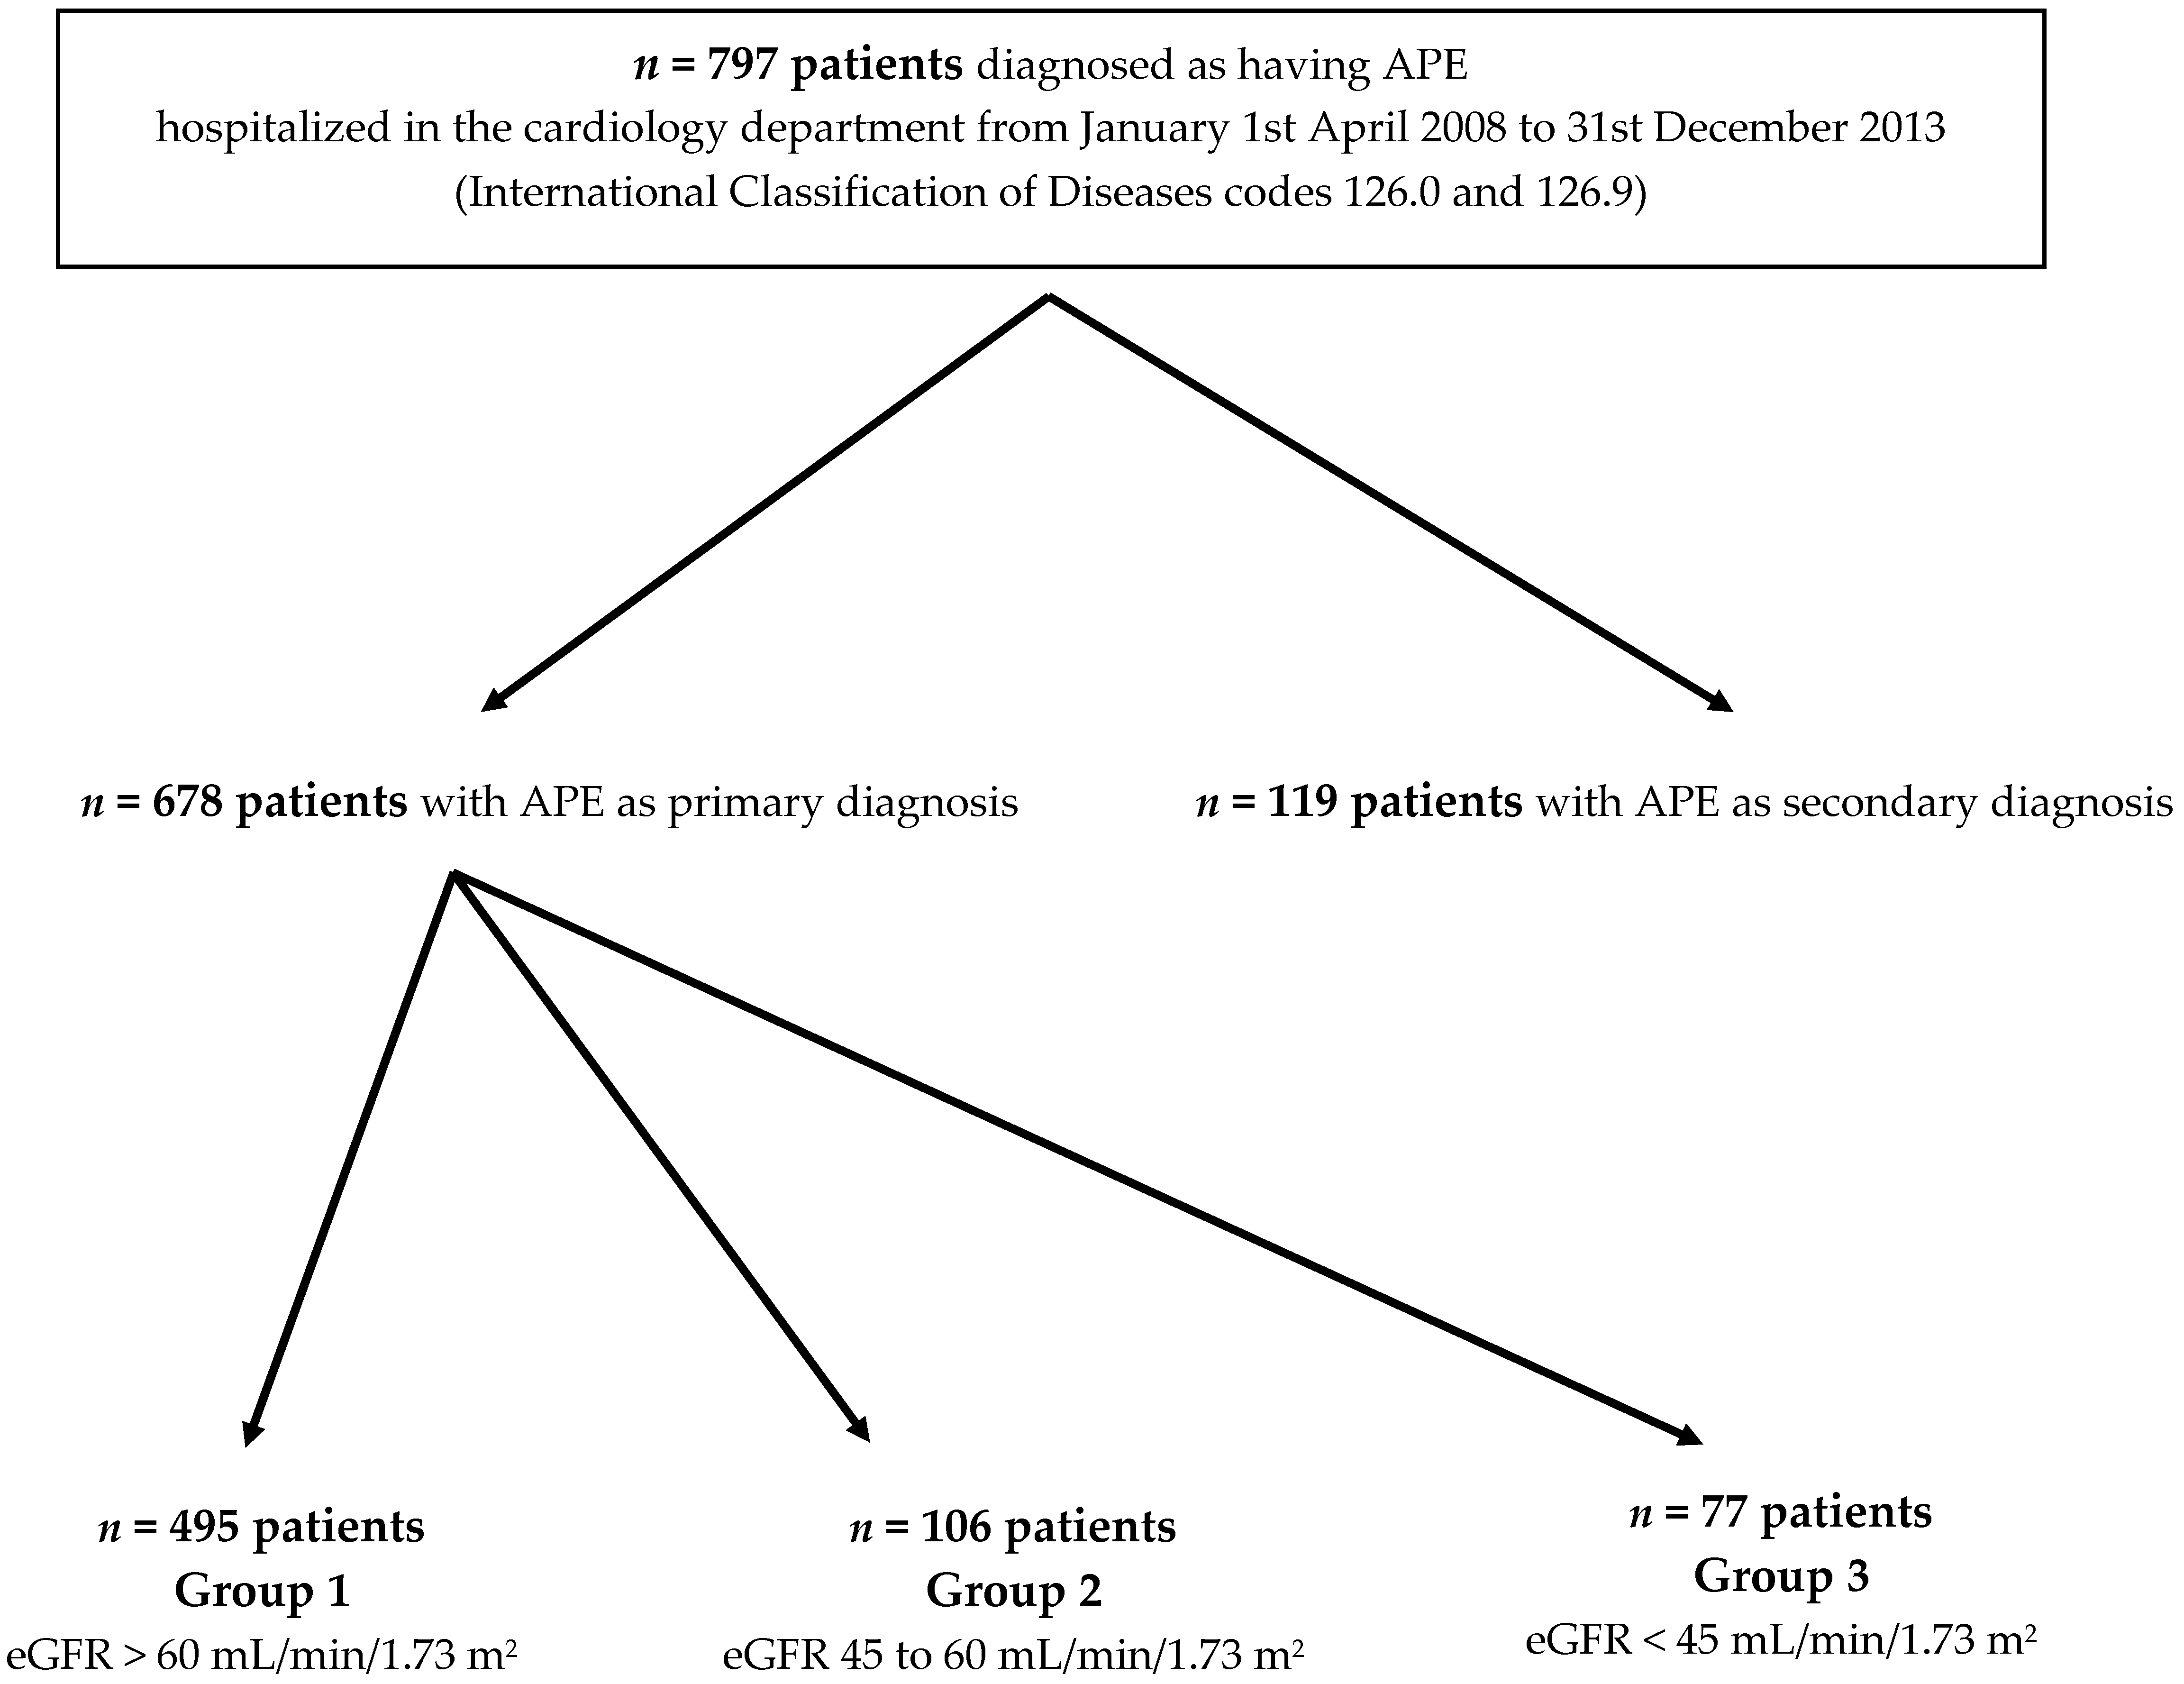
2. Methods
2.1. Staging of Renal Function
2.2. Endpoints
2.3. Statistical Analysis
3. Results
3.1. Acute Kidney Injury
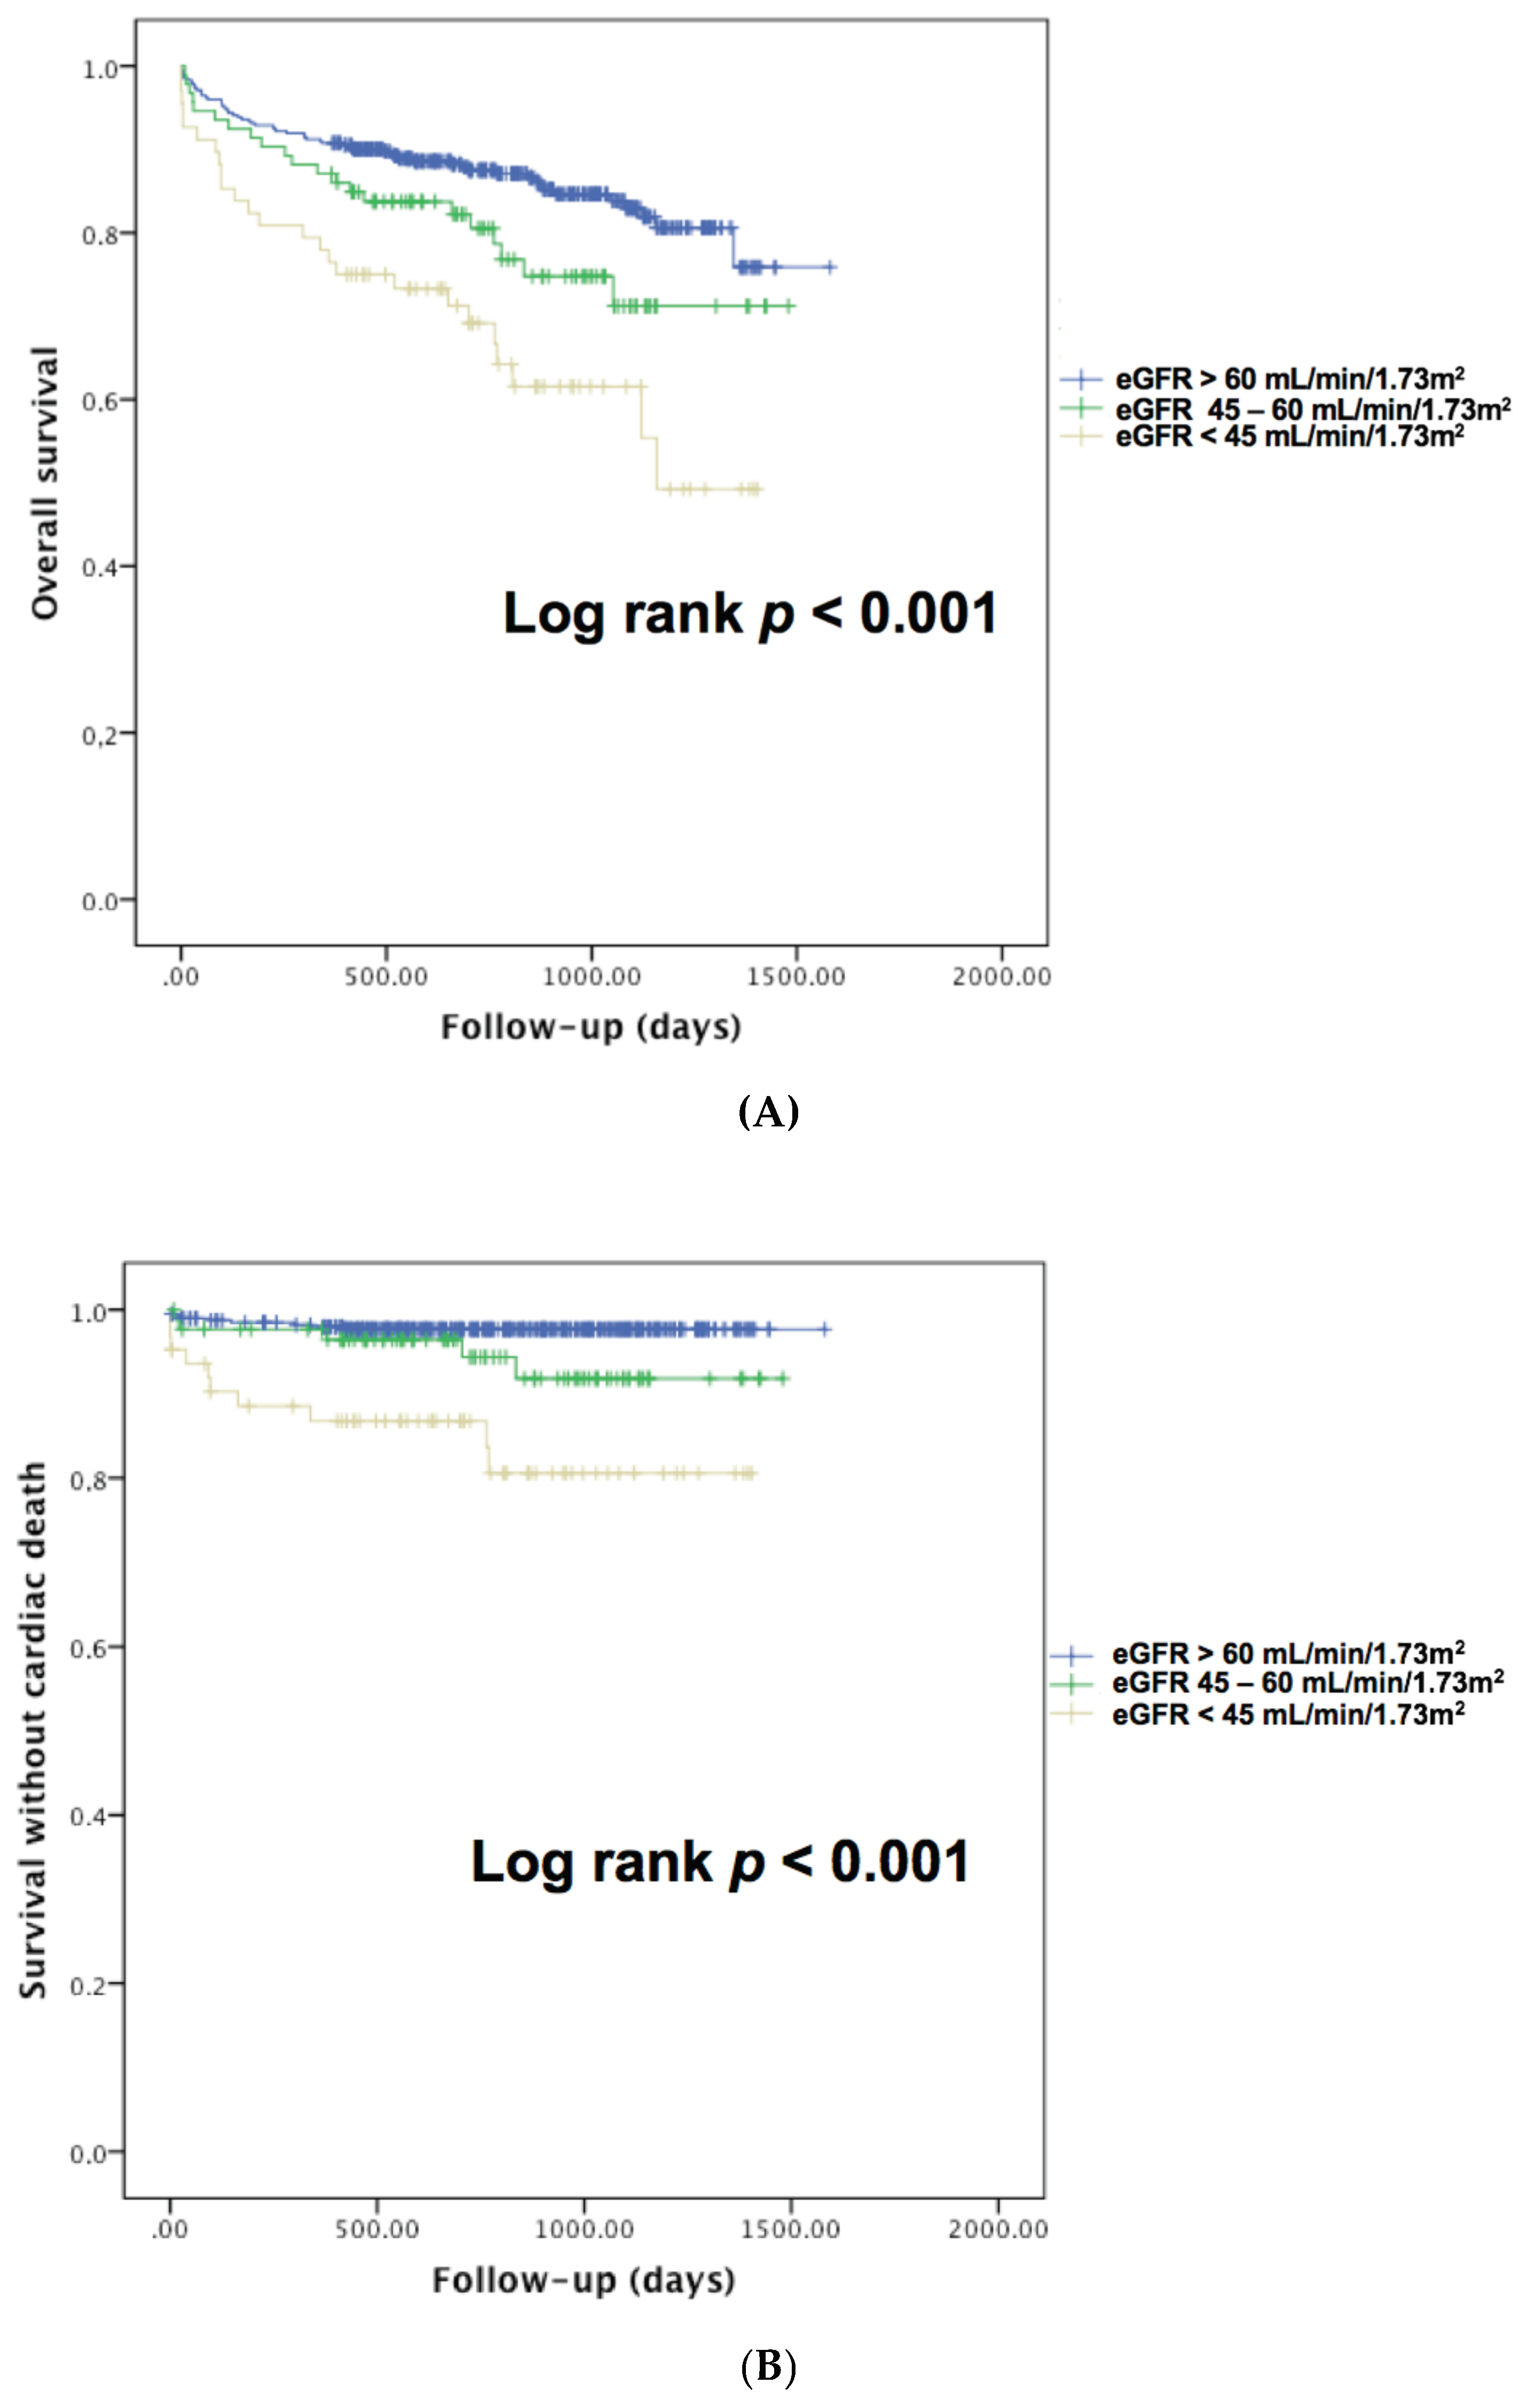
3.2. Impact of Renal Dysfunction on Overall and Cardiovascular Mortality
3.3. Predictors of 30-Day Mortality
3.4. Predictors of Overall Mortality during Follow-Up
3.5. Predictors of Cardiovascular Mortality during Follow-Up
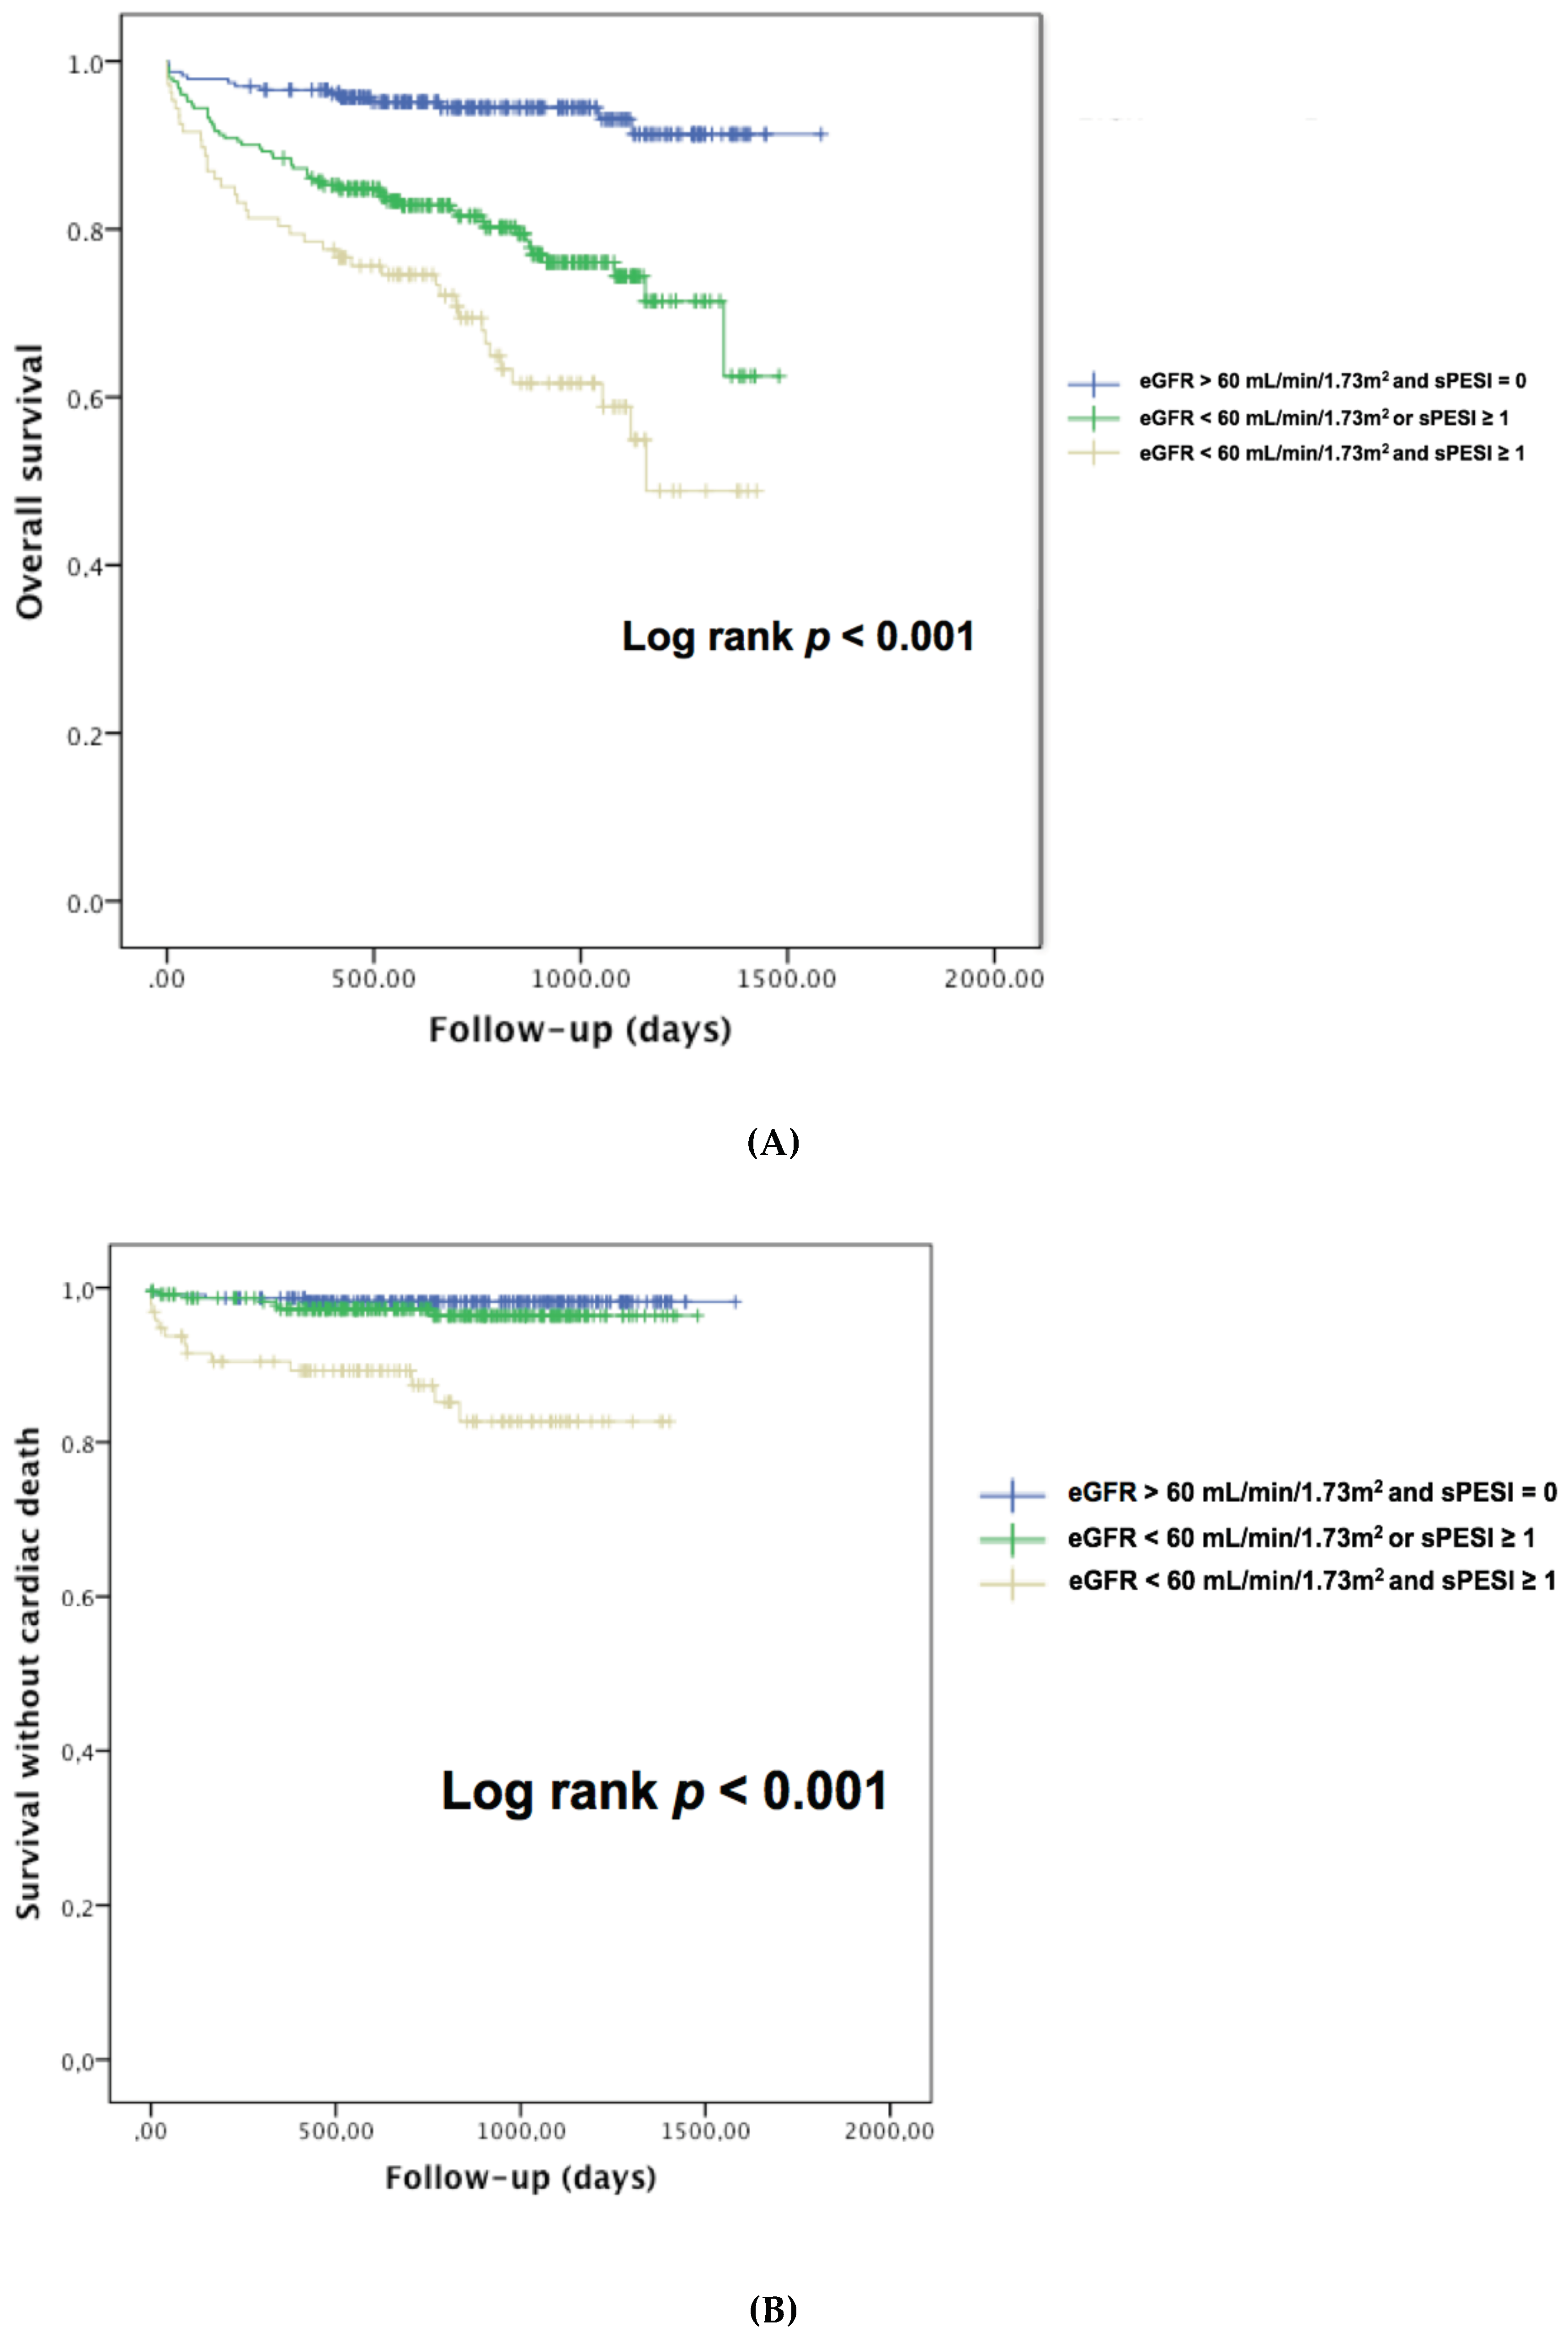
3.6. Renal Dysfunction and Simplified Pulmonary Embolism Severity Index (sPESI) for Prognostic Assessment of Acute Pulmonary Embolism (APE) Patients
4. Discussion
4.1. High Prevalence of Renal Dysfunction in APE Patients
4.2. Impact of Renal Dysfunction on Mortality in APE Patients
4.3. Assessment of Renal Function Improves sPESI Risk Stratification
4.4. Study Limitations
5. Conclusions
Author Contributions
Conflicts of Interest
References
- Konstantinides, S.; Goldhaber, S.Z. Pulmonary embolism: Risk assessment and management. Eur. Heart J. 2012, 33, 3014–3022. [Google Scholar] [CrossRef] [PubMed]
- Konstantinides, S.V.; Barco, S.; Lankeit, M.; Meyer, G. Management of Pulmonary Embolism: An Update. J. Am. Coll. Cardiol. 2016, 67, 976–990. [Google Scholar] [CrossRef] [PubMed]
- Aujesky, D.; Roy, P.M.; Le Manach, C.P.; Verschuren, F.; Meyer, G.; Obrosky, D.S.; Stone, R.A.; Cornuz, J.; Fine, M.J. Validation of a model to predict adverse outcomes in patients with pulmonary embolism. Eur. Heart J. 2006, 27, 476–481. [Google Scholar] [CrossRef] [PubMed]
- Mizuno, A.; Yamamoto, T.; Tanabe, Y.; Obayashi, T.; Takayama, M.; Nagao, K.; Tokyo CCU Network Scientific Committee. Pulmonary embolism severity index and simplified pulmonary embolism severity index riskscores are useful to predict mortality in Japanese patients with pulmonary embolism. Circ. J. 2015, 79, 889–891. [Google Scholar] [CrossRef] [PubMed]
- Jiménez, D.; Aujesky, D.; Moores, L.; Gómez, V.; Lobo, J.L.; Uresandi, F.; Otero, R.; Monreal, M.; Muriel, A.; Yusen, R.D.; et al. Simplification of the pulmonary embolism severity index for prognostication in patients with acute symptomatic pulmonary embolism. Arch. Intern. Med. 2010, 170, 1383–1389. [Google Scholar] [CrossRef] [PubMed]
- Lankeit, M.; Gómez, V.; Wagner, C.; Aujesky, D.; Recio, M.; Briongos, S.; Moores, C.L.K.; Yusen, R.D.; Konstantinides, S.; Jiménez, D.; et al. A strategy combining imaging and laboratory biomarkers in comparison witha simplified clinicalscore for risk stratification of patients with acute pulmonary embolism. Chest 2012, 141, 916–922. [Google Scholar] [CrossRef]
- Kostrubiec, M.; Łabyk, A.; Pedowska-Włoszek, J.; Pacho, S.; Wojciechowski, A.; Jankowski, K.; Ciurzyński, M.; Pruszczyk, P. Assessment of renal dysfunction improves troponin-based short-term prognosis in patients with acute symptomatic pulmonary embolism. J. Thromb. Haemost. 2010, 8, 651–658. [Google Scholar] [CrossRef]
- Kostrubiec, M.; Łabyk, A.; Pedowska-Włoszek, J.; Dzikowska-Diduch, O.; Wojciechowski, A.; Garlińska, M.; Ciurzyński, M.; Pruszczyk, P. Neutrophil gelatinase-associated lipocalin, cystatin C and eGFR indicate acute kidney injury and predict prognosis of patients with acute pulmonary embolism. Heart 2012, 98, 1221–1228. [Google Scholar] [CrossRef]
- Kumar, G.; Sakhuja, A.; Taneja, A.; Majumdar, T.; Patel, J.; Whittle, J.; Nanchal, R.; Milwaukee Initiative in Critical Care Outcomes Research (MICCOR) Group of Investigators. Pulmonary embolism in patients with CKD and ESRD. Clin. J. Am. Soc. Nephrol. 2012, 7, 1584–1590. [Google Scholar] [CrossRef]
- Dellas, C.; Puls, M.; Lankeit, M.; Schäfer, K.; Cuny, M.; Berner, M.; Hasenfuss, G.; Konstantinides, S. Elevated heart-type fatty acid-binding protein levels on admission predict an adverse outcome in normotensive patients with acute pulmonary embolism. J. Am. Coll. Cardiol. 2010, 55, 2150–2157. [Google Scholar] [CrossRef]
- Tatebe, S.; Sugimura, K.; Aoki, T.; Miura, M.; Nochioka, K.; Yaoita, N.; Suzuki, H.; Sato, H.; Yamamoto, S.; Satoh, K.; et al. Multiple Beneficial Effects of Balloon Pulmonary Angioplasty in Patients with ChronicThromboembolic Pulmonary Hypertension. Circ. J. 2016, 80, 980–988. [Google Scholar] [CrossRef] [PubMed]
- Folsom, A.R.; Lutsey, P.L.; Astor, B.C.; Wattanakit, K.; Heckbert, S.R.; Cushman, M.; Atherosclerosis Risk in Communities Study. Chronic kidney disease and venous thromboembolism: A prospective study. Nephrol. Dial. Transplant. 2010, 25, 3296–3301. [Google Scholar] [CrossRef] [PubMed]
- Al-Dorzi, H.M.; Al-Heijan, A.; Tamim, H.M.; Al-Ghamdi, G.; Arabi, Y.M. Renal failure as a risk factor for venous thromboembolism in critically Ill patients: A cohort study. Thromb. Res. 2013, 132, 671–675. [Google Scholar] [CrossRef] [PubMed]
- Pollack, C.V.; Schreiber, D.; Goldhaber, S.Z.; Slattery, D.; Fanikos, J.; O’Neil, B.J.; Thompson, J.R.; Hiestand, B.; Briese, B.A.; Pendleton, R.C.; et al. Clinical characteristics, managementand outcomes of patients diagnosed with acute pulmonaryembolism in the emergency department: Initial report of EMPEROR (Multicenter Emergency Medicine Pulmonary Embolism in the Real World Registry). J. Am. Coll. Cardiol. 2011, 57, 700–706. [Google Scholar] [CrossRef] [PubMed]
- Goldhaber, S.Z.; Visani, L.; De Rosa, M. Acute pulmonary embolism: Clinical outcomes in the International Cooperative Pulmonary Embolism Registry (ICOPER). Lancet 1999, 353, 1386–1389. [Google Scholar] [CrossRef]
- Conget, F.; Otero, R.; Jiménez, D.; Martí, D.; Escobar, C.; Rodríguez, C.; Uresandi, F.; Cabezudo, M.A.; Nauffal, D.; Oribe, M.; et al. Shortterm clinical outcome after acute symptomatic pulmonary embolism. Thromb. Haemost. 2008, 100, 937–942. [Google Scholar] [CrossRef] [PubMed]
- Kostrubiec, M.; Łabyk, A.; Pedowska-Włoszek, J.; Pacho, S.; Dzikowska-Diduch, O.; Dul, P.; Ciurzyński, M.; Bienias, P.; Pruszczyk, P. Rapid improvement of renal function in patients with acute pulmonary embolism indicates favorable short term prognosis. Thromb. Res. 2012, 130, e37–e42. [Google Scholar] [CrossRef] [PubMed]
- Lankeit, M.; Jiménez, D.; Kostrubiec, M.; Dellas, C.; Hasenfuss, G.; Pruszczyk, P.; Konstantinides, S. Predictive value of the high-sensitivity troponin T assay and the simplified Pulmonary EmbolismSeverity Index in hemodynamically stable patients with acute pulmonary embolism: A prospective validation study. Circulation 2011, 124, 2716–2724. [Google Scholar] [CrossRef]
- Kooiman, J.; Klok, F.A.; Mos, I.C.; van der Molen, A.; de Roos, A.; Sijpkens, Y.W.; Huisman, M.V. Incidence and predictors of contrast-induced nephropathy following CT-angiography for clinicallysuspected acute pulmonary embolism. J. Thromb. Haemost. 2010, 8, 409–411. [Google Scholar] [CrossRef]
- Mitchell, A.M.; Jones, A.E.; Tumlin, J.A.; Kline, J.A. Prospective study of the incidence of contrast-induced nephropathy among patients evaluatedfor pulmonary embolism by contrast-enhanced computed tomography. Acad. Emerg. Med. 2012, 19, 618–625. [Google Scholar] [CrossRef]
- Kooiman, J.; Sijpkens, Y.W.; van Buren, M.; Groeneveld, J.H.; Ramai, S.R.; van der Molen, A.J.; Aarts, N.J.; van Rooden, C.J.; Cannegieter, S.C.; Putter, H.; et al. Randomised trial of no hydration vs. sodium bicarbonate hydration in patients with chronic kidney disease undergoing acute computed tomography-pulmonary angiography. J. Thromb. Haemost. 2014, 12, 1658–1666. [Google Scholar] [CrossRef] [PubMed]
- Aujesky, D.; Obrosky, D.S.; Stone, R.A.; Auble, T.E.; Perrier, A.; Cornuz, J.; Roy, P.M.; Fine, M.J. Derivation and validation of a prognostic model for pulmonary embolism. Am. J. Respir. Crit. Care Med. 2005, 172, 1041–1046. [Google Scholar] [CrossRef] [PubMed]
- Altınsoy, B.; İbrahim, İ.; Örnek, T.; Erboy, F.; Tanrıverdi, H.; Uygur, F.; Altintas, N.; Atalay, F.; Tor, M.M. Prognostic Value of Renal Dysfunction Indicators in Normotensive Patients with Acute Pulmonary Embolism. Clin. Appl. Thromb. Hemost. 2017, 23, 554–561. [Google Scholar] [CrossRef] [PubMed]


| Group 1 (gr1) | Group 2 (gr2) | Group 3 (gr3) | p | |
|---|---|---|---|---|
| eGFR > 60 mL/min/1.73 m2 (n = 495) | eGFR 45–60 mL/min/1.73 m2 (n = 106) | eGFR <45 mL/min/1.73 m2 (n = 77) | ||
| Age (yr) | 62 ± 18 | 78 ± 10 | 77 ± 11 | <0.001 #, β |
| Female Gender | 274 (55.4) | 62 (58.5) | 48 (62.3) | 0.473 |
| Weight (kg) | 82 ± 20 | 77±17 | 81±18 | 0.069 |
| Height (cm) | 169 ± 11 | 166 ± 8 | 165 ± 8 | 0.006 β |
| Systolic Arterial pressure (mmHg) | 132 ± 23 | 133 ± 24 | 131 ± 24 | 0.823 |
| Diastolic arterial pressure (mmHg) | 75 ± 13 | 74 ± 13 | 72 ± 12 | 0.249 |
| Heart rate (bpm) | 89 ± 25 | 90 ± 22 | 88 ± 22 | 0.882 |
| Malignancy | 62 (12.6) | 17 (16) | 6 (7.8) | 0.252 |
| Diabetes Mellitus | 70 (14.2) | 18 (17) | 23 (30.3) | 0.002 |
| Dyslipidemia | 160 (32.5) | 44 (41.5) | 37 (48.1) | 0.011 |
| Arterial hypertension | 227 (46) | 80 (75.5) | 62 (80.5) | < 0.001 |
| Smoker | 132 (26.8) | 27 (25.5) | 23 (29.9) | 0.795 |
| sPESI | 0.52 ± 0.65 | 0.81 ± 0.64 | 0.74 ± 0.67 | <0.001 |
| Creatine at diagnosis (μmol/L) | 69 ± 16 | 102 ± 15 | 162 ± 65 | <0.001 #, β |
| eGFR at diagnosis (mL/min/1.73 m2) | 97 ± 8 | 53 ± 8 | 33 ± 8 | <0.001 #, β |
| Troponine (μg/L) | 0.85 ± 0.8 | 0.60 ± 1 | 0.87 ± 2 | 0.956 |
| BNP (ng/L) | 235 ± 377 | 314 ± 296 | 561 ± 736 | <0.001 β |
| CRP (mg/L) | 50 ± 75 | 53 ± 56 | 46 ± 5 | 0.294 |
| Haemoglobin (g/dL) | 13.2 ± 1.8 | 13.0 ± 1.7 | 12.8 ± 1.7 | 0.175 |
| PaO2 (mmHg) | 77 ± 24 | 83 ± 40 | 79 ± 27 | 0.180 |
| PaCO2 (mmHg) | 33 ± 6 | 33 ± 5 | 33 ± 7 | 0.630 |
| SaO2 (%) | 94 ± 4 | 93 ± 4 | 93 ± 6 | 0.149 |
| D-Dimers (μg/L) | 6832 ± 6268 | 7865 ± 6878 | 8010 ± 6925 | 0.226 |
| LVEF (%) | 59 ± 9 | 58 ± 9 | 54 ± 13 | 0.001 β |
| Systolic PAP | 40 ± 15 | 44 ± 13 | 45 ± 16 | 0.018 β |
| Univariate Analysis | Multivariate Analysis | |||||
|---|---|---|---|---|---|---|
| Hazard Ratio (HR) | 95% CI | p | Hazard Ratio (HR) | 95% CI | p | |
| Age (years) | 1.028 | 1.015–1.041 | <0.001 | |||
| sPESI | 1.401 | 1.063–1.846 | 0.017 | 1.359 | 1.019–1.814 | 0.037 |
| Overweight | 0.919 | 0.590–1.431 | 0.708 | |||
| SBP (mmHg) | 1.003 | 0.994–1.011 | 0.517 | |||
| DBP (mmHg) | 1.003 | 0.988–1.017 | 0.723 | |||
| Heart rate (bpm) | 1.008 | 0.999–1.017 | 0.082 | |||
| Acitve malignancy | 0.906 | 0.500–1.642 | 0.746 | |||
| Diabetes mellitus | 1.682 | 1.045–2.707 | 0.032 | 1.314 | 0.796–2.171 | 0.286 |
| Dyslipidemia | 1.104 | 0.741–1.644 | 0.628 | |||
| Arterial Hypertension | 1.621 | 1.089–2.414 | 0.017 | 1.325 | 0.867–2.025 | 0.194 |
| Smoker | 1.027 | 0.666–1.582 | 0.905 | |||
| RD at diagnosis (eGFR < 60 mL/min/1.73 m2) | 1.417 | 0.935–2.147 | 0.101 | |||
| CT scan | 0.365 | 0.242–0.551 | <0.001 | 0.394 | 0.258–0.600 | <0.001 |
| Troponine (μg/L) | 0.998 | 0.969–1.027 | 0.870 | |||
| BNP > 400 ng/L | 1.779 | 1.113–2.854 | 0.013 | |||
| CRP (mg/L) | 1.000 | 0.997–1.003 | 0.853 | |||
| PaO2 (mmHg) | 1.003 | 0.996–1.010 | 0.421 | |||
| LVEF < 50% | 2.108 | 1.290–3.446 | 0.003 | |||
| ACE + sartans | 1.373 | 0.921–2.047 | 0.119 | |||
| Univariate Analysis | Multivariate Analysis | |||||
|---|---|---|---|---|---|---|
| Hazard Ratio (HR) | 95% CI | p | Hazard Ratio (HR) | 95% CI | p | |
| Age (years) | 1.040 | 1.002–1.079 | 0.036 | |||
| sPESI | 1.545 | 0.824–2.896 | 0.175 | 1.453 | 0.735–2.871 | 0.282 |
| SBP (mmHg) | 0.973 | 0.948–0.997 | 0.034 | |||
| DBP (mmHg) | 0.970 | 0.928–1.014 | 0.174 | |||
| Heart rate (bpm) | 1.015 | 0.992–1.038 | 0.208 | |||
| Acitve malignancy | 3.149 | 1.094–9.064 | 0.033 | |||
| Diabetes mellitus | 0.716 | 0.163–3.151 | 0.659 | |||
| Dyslipidemia | 0.600 | 0.194–1.861 | 0.377 | |||
| Arterial Hypertension | 1.410 | 0.512–3.879 | 0.506 | |||
| Smoker | 0.901 | 0.291–2.795 | 0.857 | |||
| RD at diagnosis (eGFR < 60 mL/min/1.73 m2) | 2.742 | 1.029–7.305 | 0.044 | 2.771 | 1.007–7.625 | 0.048 |
| AKI | 1.948 | 0.677–5.606 | 0.216 | |||
| CT Scan | 0.792 | 0.261–2.407 | 0.681 | |||
| Troponine (μg/L) | 0.998 | 0.920–1.081 | 0.952 | |||
| BNP > 400ng/L | 2.894 | 1.004–8.342 | 0.049 | |||
| CRP (mg/L) | 1.003 | 1.001–1.005 | 0.011 | 1.004 | 1.001–1.006 | 0.004 |
| PaO2 (mmHg) | 1.008 | 0.995–1.022 | 0.204 | |||
| LVEF <50% | 1.337 | 0.284–6.297 | 0.713 | |||
| Univariate Analysis | Multivariate Analysis | |||||
|---|---|---|---|---|---|---|
| Hazard Ratio (HR) | 95% CI | p | Hazard Ratio (HR) | 95% CI | p | |
| Age (years) | 1.040 | 1.029–1.059 | <0.001 | |||
| sPESI | 2.057 | 1.672–2.531 | <0.001 | 1.895 | 1.520–2.362 | 0.001 |
| SBP (mmHg) | 0.991 | 0.982–1.000 | 0.039 | |||
| DBP (mmHg) | 0.983 | 0.967–0.998 | 0.030 | |||
| Heart rate (bpm) | 1.005 | 0.996–1.013 | 0.308 | |||
| Acitve malignancy | 4.402 | 2.945–6.581 | <0.001 | |||
| Diabetes mellitus | 1.042 | 0.628–1.729 | 0.874 | |||
| Dyslipidemia | 1.142 | 0.774–1.683 | 0.504 | |||
| Arterial Hypertension | 1.936 | 1.279–2.929 | 0.002 | 1.284 | 0.823–2.003 | 0.270 |
| Smoker | 0.967 | 0.628–1.488 | 0.878 | |||
| RD at diagnosis (eGFR < 60 mL/min/1.73 m2) | 2.151 | 1.467–3.155 | <0.001 | 1.772 | 1.188–2.645 | 0.005 |
| AKI | 2.101 | 1.398–3.157 | <0.001 | 1.655 | 1.091–2.510 | 0.018 |
| Troponine (μg/L) | 1.001 | 0.977–1.026 | 0.916 | |||
| BNP > 400 ng/L | 2.235 | 1.471–2.235 | <0.001 | |||
| CRP (mg/L) | 1.002 | 1.000–1.003 | 0.073 | |||
| PaO2 (mmHg) | 1.010 | 1.005–1.016 | <0.001 | |||
| LVEF < 50% | 2.603 | 1.679–4.035 | <0.001 | |||
| Univariate Analysis | Multivariate Analysis | |||||
|---|---|---|---|---|---|---|
| Hazard Ratio (HR) | 95% CI | p | Hazard Ratio (HR) | 95% CI | p | |
| Age (years) | 1.067 | 1.028–1.106 | <0.001 | |||
| sPESI | 1.760 | 1.093–2.833 | 0.020 | 1.607 | 0.946–2.733 | 0.080 |
| SBP (mmHg) | 0.994 | 0.975–1.014 | 0.563 | |||
| DBP (mmHg) | 0.990 | 0.956–1.025 | 0.563 | |||
| Heart rate (bpm) | 1.009 | 0.991–1.028 | 0.338 | |||
| Acitve malignancy | 0.799 | 0.188–3.401 | 0.762 | |||
| Diabetes mellitus | 1.664 | 0.660–4.191 | 0.280 | |||
| Dyslipidemia | 0.933 | 0.453–2.367 | 0.933 | |||
| Arterial Hypertension | 1.427 | 0.625–3.262 | 0.339 | |||
| Smoker | 1.351 | 0.578–3.158 | 0.487 | |||
| RD at diagnosis (eGFR < 60 mL/min/1.73 m2) | 4.718 | 2.064–10.782 | <0.001 | 4.246 | 1.856–9.710 | 0.001 |
| AKI | 2.283 | 0.977–5.336 | 0.057 | 1.953 | 0.835–4.569 | 0.123 |
| Troponine (μg/L) | 1.002 | 0.959–1.047 | 0.926 | |||
| BNP > 400ng/L | 4.791 | 2.033–11.292 | <0.001 | |||
| CRP (mg/L) | 1.002 | 0.999–1.005 | 0.123 | |||
| PaO2 (mmHg) | 1.015 | 1.007–1.024 | 0.001 | |||
| LVEF <50% | 1.483 | 0.495–4.440 | 0.481 | |||
| Group 1 (gr1) | Group 2 (gr2) | Group 3 (gr3) | p | |
|---|---|---|---|---|
| eGFR >60 mL/min/1.73 m2 (n = 423) | eGFR 45–60 mL/min/1.73 m2 (n = 93) | eGFR <45 mL/min/1.73 m2 (n = 68) | ||
| Acute kidney injury, n (%) | 86 (17.4) | 20 (18.9) | 22 (28.6) | 0.065 |
| 30 days mortality, n (%) | 9 (1.8) | 5 (4.7) | 5 (6.5) | 0.030 |
| One year mortality, n (%) | 42 (9.9) | 14 (15.1) | 17 (25) | 0.002 |
| All cause mortality, n (%) | 61 (14.4) | 21 (22.6) | 25 (36.8) | <0.001 |
| Cardiovascular mortality, n (%) | 9 (2.3) | 5 (5.7) | 10 (15.9) | <0.001 |
| Follow-up (days) | 670 ± 405 | 652 ± 397 | 600 ± 417 | 0.372 |
| eGFR > 60 and sPESI = 0 (n = 271) | eGFR < 60 or sPESI ≥ 1 (n = 285) | eGFR < 60 and sPESI ≥ 1 (n = 121) | p | |
|---|---|---|---|---|
| Acute kidney injury, n (%) | 38 (14) | 61 (21.4) | 29 (24) | 0.025 |
| 30 day mortality, n (%) | 4 (1.5) | 7 (2.5) | 8 (6.6) | 0.016 |
| One year mortality, n (%) | 10 (4.4) | 38 (15.3) | 25 (23.4) | <0.001 |
| All cause mortality, n (%) | 14 (6.1) | 54 (21.8) | 39 (36.4) | <0.001 |
| Cardiovascular mortality, n (%) | 4 (1.8) | 7 (3.1) | 13 (13.3) | < 0.001 |
© 2019 by the authors. Licensee MDPI, Basel, Switzerland. This article is an open access article distributed under the terms and conditions of the Creative Commons Attribution (CC BY) license (http://creativecommons.org/licenses/by/4.0/).
Share and Cite
Trimaille, A.; Marchandot, B.; Girardey, M.; Muller, C.; Lim, H.S.; Trinh, A.; Ohlmann, P.; Moulin, B.; Jesel, L.; Morel, O. Assessment of Renal Dysfunction Improves the Simplified Pulmonary Embolism Severity Index (sPESI) for Risk Stratification in Patients with Acute Pulmonary Embolism. J. Clin. Med. 2019, 8, 160. https://doi.org/10.3390/jcm8020160
Trimaille A, Marchandot B, Girardey M, Muller C, Lim HS, Trinh A, Ohlmann P, Moulin B, Jesel L, Morel O. Assessment of Renal Dysfunction Improves the Simplified Pulmonary Embolism Severity Index (sPESI) for Risk Stratification in Patients with Acute Pulmonary Embolism. Journal of Clinical Medicine. 2019; 8(2):160. https://doi.org/10.3390/jcm8020160
Chicago/Turabian StyleTrimaille, Antonin, Benjamin Marchandot, Mélanie Girardey, Clotilde Muller, Han S. Lim, Annie Trinh, Patrick Ohlmann, Bruno Moulin, Laurence Jesel, and Olivier Morel. 2019. "Assessment of Renal Dysfunction Improves the Simplified Pulmonary Embolism Severity Index (sPESI) for Risk Stratification in Patients with Acute Pulmonary Embolism" Journal of Clinical Medicine 8, no. 2: 160. https://doi.org/10.3390/jcm8020160
APA StyleTrimaille, A., Marchandot, B., Girardey, M., Muller, C., Lim, H. S., Trinh, A., Ohlmann, P., Moulin, B., Jesel, L., & Morel, O. (2019). Assessment of Renal Dysfunction Improves the Simplified Pulmonary Embolism Severity Index (sPESI) for Risk Stratification in Patients with Acute Pulmonary Embolism. Journal of Clinical Medicine, 8(2), 160. https://doi.org/10.3390/jcm8020160