Article

Normal Alpha-Fetoprotein Hepatocellular Carcinoma: Are They Really Normal?

1
Division of General Surgery, Department of Surgery, Linkou Chang Gung Memorial Hospital, Taoyuan City 333, Taiwan
2
Graduate Institute of Clinical Medical Sciences, Chang Gung University, Taoyuan City 333, Taiwan
3
College of Medicine, Chang Gung University, Taoyuan City 333, Taiwan
4
Department of Anesthesiology, Linkou Chang Gung Memorial Hospital, Taoyuan City 333, Taiwan
5
Department of Gastroenterology and Hepatology, Linkou Chang Gung Memorial Hospital, Taoyuan City 333, Taiwan
*
Authors to whom correspondence should be addressed.
These authors contributed equally to this work.
J. Clin. Med. 2019, 8(10), 1736; https://doi.org/10.3390/jcm8101736
Submission received: 30 September 2019 / Revised: 12 October 2019 / Accepted: 17 October 2019 / Published: 19 October 2019
(This article belongs to the Section Gastroenterology & Hepatopancreatobiliary Medicine)

Abstract

:
Introduction: serum alpha-fetoprotein (AFP) was routinely employed as a tumor marker for screening, diagnosis, and treatment follow-up of hepatocellular carcinoma (HCC). However, a substantial proportion of HCC patients had normal AFP level even at an advanced disease status. Few studies to date had tried to explore the nature and behavior of this normal AFP HCC (N-HCC). The purpose of this study was to investigate the clinicopathological characteristics and survival outcome of N-HCC after operation. In addition, potential tumor markers for N-HCC were also sought in an attempt to augment diagnostic ability. Methods: between 2005 and 2015, patients with hepatocellular carcinoma who were treated with hepatectomy in Chang Gung Memorial Hospital Linkou branch were divided into two groups according to their preoperative serum AFP level (<15 ng/mL: NHCC; ≥15 ng/mL: abnormal AFP HCC (A-HCC)). Patient demographic data and clinicopathological variables were collected. Kaplan–Meier and Cox regression multivariate analyses were performed to identify significant risk factors for disease-free survival (DFS) and overall survival (OS) for N-HCC. ELISA and immunohistochemical (IHC) studies were employed to determine the diagnostic accuracy of various tumor markers. Results: a total of 1616 patients (78% male) who underwent liver resection for HCC were included in this study. Of them, 761 patients (47.1%) were N-HCC. N-HCC patients were significantly older with more comorbidities and less hepatitis virus infections. Furthermore, N-HCC had fewer early recurrences (49.6% vs. 60.8%, p < 0.001) and better DFS (44.6 months vs. 23.6 months, p < 0.001) and OS (94.5 months vs. 81.7 months, p < 0.001). Both ELISA and IHC studies demonstrated that glypican-3 (GPC3) would be a promising diagnostic tumor marker for N-HCC. Conclusion: N-HCC patients were significantly older and had less hepatitis virus infections or cirrhosis. Their tumors tended to be smaller, less vascular invaded, and well-differentiated. The carcinogenesis of N-HCC may thus not be identical to that of typical HCC. GPC3 would be a promising tumor marker for diagnosing N-HCC. Further study is warranted to validate our findings.

1. Introduction

Hepatocellular carcinoma (HCC) is the most common primary malignancy of the liver with an estimated annual death incidence of approximately 700,000 worldwide [1]. In Taiwan, it is the second most common cause of cancer death and causes more than 8000 deaths each year [2]. Viral hepatitis, chronic liver disease, and liver cirrhosis are most common etiologies of HCC. Although curative treatments for early-stage lesions have been improved dramatically, few alternatives exist for late-stage HCC [3]. The vast majority of HCC, unfortunately, is diagnosed at later stage, resulting in its dismal prognosis [4,5]. Effective screening and accurate early diagnosis, subsequently, are mandatory to optimize the outcome of patients with HCC. The diagnosis of HCC nowadays relies primarily on serum biomarkers and radiologic examinations. Common radiologic examinations employed include ultrasonography (US), computed tomography [6], angiography, and magnetic resonance imaging (MRI). However, the nature of operator-dependence for US and contrast/radiation exposure for CT/Angiography/MRI has limited the value of these tests for regular screening and early diagnosis. Therefore, in order to achieve early diagnosis and improve clinical outcomes, the identification of a reliable serum biomarker or a combination of markers is of paramount importance.
Alpha-fetoprotein (AFP), an oncofetal glycoprotein normally expressed in fetus, is currently the most widely used tumor marker for HCC. Its cellular function in adult humans still remains to be determined. In healthy adults, serum AFP level typically falls into the range of 5–10 ng/mL [7]. On the other hand, an elevated serum level of AFP is frequently associated with HCC or other liver diseases. Studies have shown that an AFP level above 400 ng/mL can generally be considered as diagnostic for HCC [3]. AFP, as a result, is frequently adopted as a diagnostic tool for HCC in high risk patients. However, AFP levels below 100 ng/mL are less specific since slightly elevated AFP can also be observed in patients with chronic hepatitis [4]. Moreover, studies have shown that about 40% of HCC had normal AFP levels [4,8,9]. This striking figure alerts clinicians the necessity to explore a more sensitive and specific biomarker for the early diagnosis of this subset of HCC. In addition, few studies to date had tried to explore the nature and behavior of this normal AFP HCC (N-HCC). Although previous studies have already identified elevated AFP to be a robust predictor of poor survival for HCC [10], and CLIP staging system also allocated AFP > 400 ng/mL to be an independent prognostic indicator [11], no studies so far have analyzed the clinical features or survival outcome of N-HCC after hepatectomy. Whether this “normal” AFP HCC is merely an HCC with “lower” or “normal” AFP production or it actually represents a distinct or “abnormal” subtype of HCC is still undetermined.
Glypican-3 (GPC3) is a member of the heparin sulfate proteoglycans family and bound to the external surface of the plasma membrane by a glycosylphosphatidylinositol bond (GPI) [12]. It is a 70-kDa core protein encoded by the GPC3 gene located on the human X chromosome (Xq26). GPC3, like AFP, is an oncofetal protein expressed only in the placenta and fetal tissues [13]. It regulates cell proliferation and growth by interaction with Wnt signaling and insulin-like growth factor-2 [14,15]. Recently, GPC3 was found to be overexpressed in more than 80% of HCC and was proposed to be a promising tumor marker for the diagnosis of HCC [4,13,16,17]. In addition to GPC3, secreted phophoprotein 1 (SPP1), vascular endothelial growth factor (VEGF), insulin-like growth factor-1 (IGF-1), and hepatocyte growth factor (HGF) have all been implicated as potential serum markers for the diagnosis of HCC [18,19,20,21,22,23]. Nevertheless, despite these remarkable findings, few studies had tried to investigate the diagnostic performance of these markers for HCC with low or normal AFP [24]. Therefore, in addition to investigate the clinicopathological characteristics and survival outcome of N-HCC after the operation, the current study would also compare the diagnostic accuracy of various serum markers for N-HCC.

2. Materials and methods

2.1. Patients

Under the approval of Institutional Review Boards (CGMH IRB No: 100-4268B and 201600359B0) of Chang Gung Memorial Hospital (CGMH), we retrospectively reviewed patients with HCC who were treated with curative hepatectomy by our surgical team at Linkou CGMH between 2005 and 2015. Exclusion criteria were patients who had distant metastases before operation, who underwent only exploratory laparotomy for liver tumor biopsy, who did not have detailed preoperative/intraoperative clinical records, or who did not have regular postoperative out-patient follow-up. A total of 1616 patients were enrolled and divided into two groups according to their preoperative serum AFP level. The AFP levels were determined by the central laboratory of Linkou CGMH. Our lab employed ARCHITECT AFP Reagent Kit (7K67) (Laboratories, Abbott Park, IL 60064 USA) for the measurement of AFP from 2005. In their large scale study, about 99.5% of healthy subjects had their AFP levels less than 13.4 ng/mL; our hospital set the AFP cutoff at 15 ng/mL as a result. The current study adopted this value and categorized HCC into two groups. Patients with normal preoperative AFP level (<15 ng/mL) were classified as normal AFP HCC group (N-HCC) while those with elevated preoperative AFP level (≥15 ng/mL) were considered abnormal AFP HCC group (A-HCC). All of the demographics, surgical, and perioperative data were reviewed and compared. The study end date was 31 December 2015. Tumor staging was based on the American Joint Committee on Cancer (AJCC) TNM staging system for HCC.

2.2. Preoperative Assessment

The diagnosis of HCC was established by characteristic features on imaging by either triphasic computed tomography (CT), magnetic resonance imaging (MRI), hepatic arteriography, and/or a serum α-fetoprotein (AFP) level greater than 200 ng/mL. Resection criteria included absence of distant metastasis, no main trunk portal vein thrombosis, technically operable tumor site and adequate future liver remnant. Child-Pugh classification was routinely evaluated preoperatively. Indocyanine green retention test (ICG-15) was assessed in cirrhotic patients or those who were going to receive major operation. A previous study identified an indocyanine green retention at 15 min (ICG-15) of less than 14% as the safety limit for major hepatic resection [25] In our institute, an ICG-15 ≤ 10% was the prerequisite for major hepatic resection. On the other hand, in patients with higher ICG-15, extensive hepatectomy could also be performed if the liver functional reserve was satisfactory and the size of the future liver remnant was considered adequate according to preoperative CT and intraoperative assessment [26].

2.3. Blood Sampling and Assays

To search for potential serum tumor markers for the detection and diagnosis of N-HCC, 147 HCC patients within this entire cohort were enrolled. Among them, 74 patients (50.3%) had normal AFP levels. Another 10 healthy subjects were recruited as normal control. Under informed consent, their blood samples were drawn preoperatively and centrifuged immediately at 1500× g for 10 min. The sera were aliquoted and stored at −80 °C for batch analysis. Serum biomarkers were measured using an enzyme-linked immunosorbent assay (ELISA) kit (DuoSet ELISA, R&D Systems; Minneapolis, MN, USA).

2.4. Immunohistochemistry

To study the expressions of various markers, formalin-fixed and paraffin-embedded resection specimens of those patients who had their serum examined by ELISA were retrieved, sectioned to 4 μm in thickness and de-paraffininzed, rehydrated, and processed for antigen retrieval. We included 114 patients. The slides were further incubated with appropriate dilutions of the selected antibodies at room temperature for 1 h. After incubation, the slides were washed three times in phosphate-buffered saline (PBS), incubated with a horse reddish peroxidase conjugated antibody polymer (Zymed) at room temperature for 10 min, and were then developed by treatment with 3,3′-diaminobenzidine (Roche) at room temperature for 10 min.

2.5. Definition and Statistical Analysis

Preoperative symptoms included patients presenting with jaundice, anemia, ascites, or palpable mass when establishing the diagnosis. Major operation defined hepatectomy involved three or more liver segments [27]. Major surgical complications comprised grade III and grade IV surgical complications [28]. For statistical analysis, Fisher’s exact test and Pearson’s χ2 test were used to analyze categorical data. Student’s t test and Mann–Whitney U test were used to analyze continuous variables. Significant variables in univariate analysis were then subjected into a stepwise cox regression multivariate analyses. The Kaplan–Meier method was employed for survival analysis and the results were compared with the log-rank test. The receiver operating characteristic (ROC) curve was developed to determine the sensitivity and specificity of individual serum maker. The area under the curve (AUC) value was compared between these markers. All calculations were performed with SPSS for windows (SPSS Inc., Chicago, IL, USA). Two-tailed P-values less than 0.05 were considered statistically significant.

3. Results

3.1. Clinical-Pathological Characteristics of N-HCC Versus A-HCC

A total of 1616 patients with HCC underwent curative hepatectomy during the study period. The median follow-up time was 39.5 months. Among them, 761 (47.1%) patients had AFP levels less than 15 ng/mL (N-HCC), 312 (19.3%) had AFP levels between 15 and 100 ng/mL, 184 (11.4%) had AFP between 100 and 400 ng/mL, and the remaining 359 (22.2%) patients had AFP greater than 400 ng/mL. An elevated AFP (A-HCC) was demonstrated in 855 patients (52.9%) in the current study. After statistical analysis, we found that N-HCC patients were generally older (P = 0.020) with male predominance (P = 0.001), having more co-morbidities such as diabetes mellitus (P < 0.001), and having less hepatitis B virus (HBV) infection (P < 0.001) (Table 1). Interestingly, almost 20% of N-HCC patients had neither HBV nor HCV infections, as compared to only 9% in the A-HCC group (P < 0.001). On the other hand, the ICG-15 level and preoperative symptoms were comparable between N-HCC and A-HCC. As for surgical variables, N-HCC required less major liver resections (P = 0.005), which in turn resulted in less blood loss (P = 0.032). The surgical complication rate and in-hospital mortality rate were equivalent between the two groups. Nevertheless, the 6-month mortality or early mortality rate was significantly lower in N-HCC than in A-HCC (2.8% and 7.7%, respectively, P < 0.001) [29]. Considering pathological features, N-HCC tended to be smaller (P < 0.001), less vascular invaded (P < 0.001), and more well-differentiated (P < 0.001). They had less daughter nodules (P < 0.001), less cirrhosis (P = 0.002), and earlier T stage (P < 0.001) (Table 2).

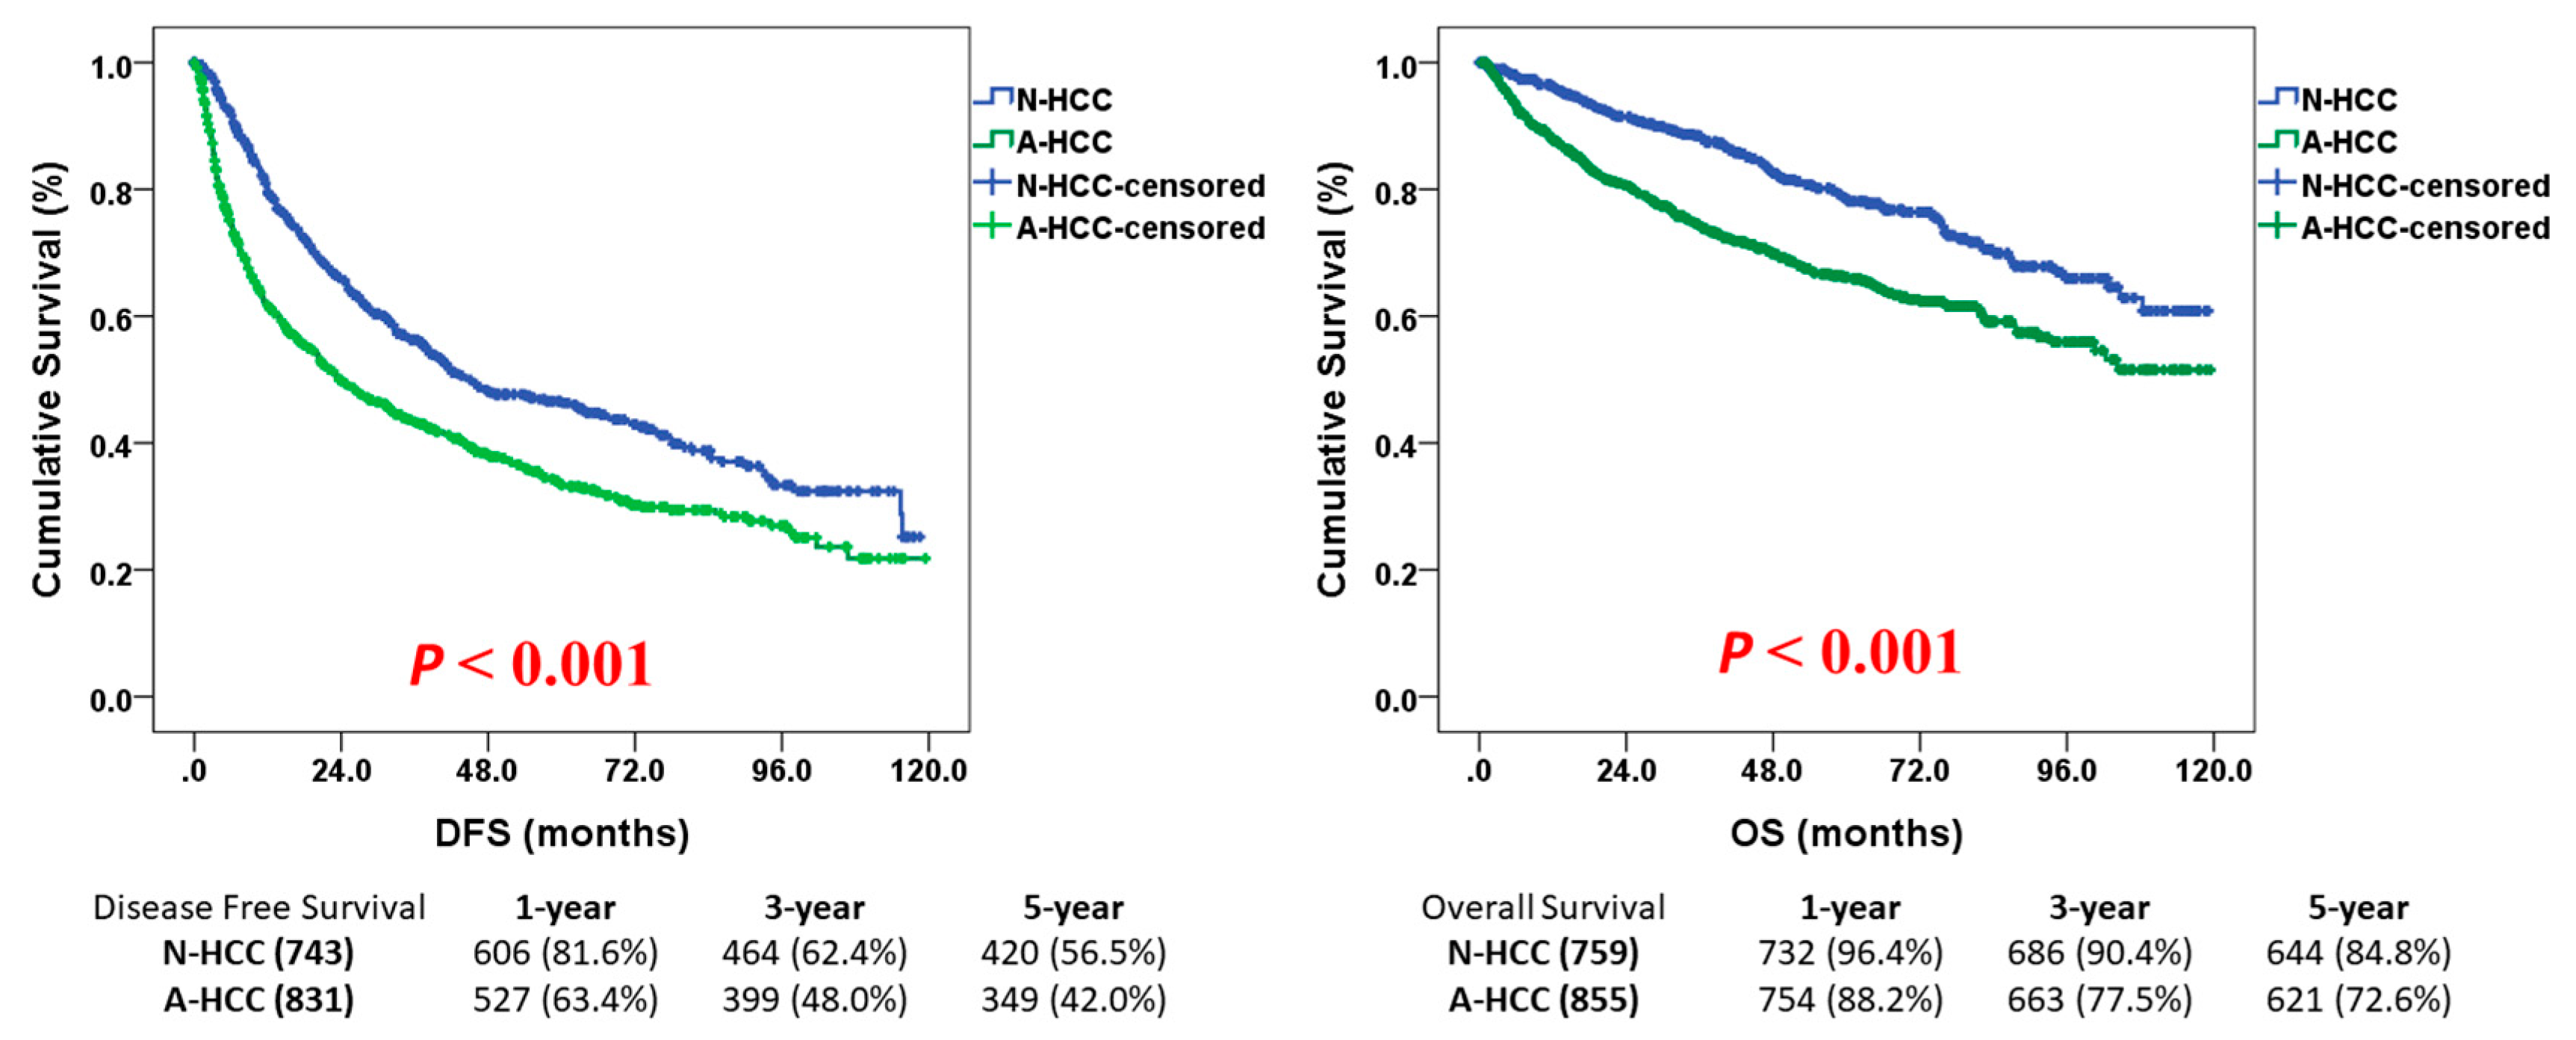
3.2. Survival Outcome of N-HCC After Hepatectomy

As for survival analysis, N-HCC had a significantly better disease-free survival (DFS) than A-HCC after hepatectomy. The median DFS was 44.6 months (95% CI 34.2–54.9) for N-HCC and 23.6 months (95% CI 18.7–28.6) for A-HCC (P < 0.001). The Kaplan-Meier DFS curves were illustrated in Figure 1. As shown in the figure, the one-, three-, and five-year DFS rates were 81.6%, 62.4%, and 56.5%, respectively, for N-HCC and 63.4%, 48.0%, and 42.0%, respectively, for A-HCC. The early recurrence rate was also significantly lower in N-HCC than in A-HCC (49.6% vs. 60.8%, respectively, p < 0.001). After univariate analysis, symptomatic diseases (anemia, jaundice, palpable mass, or ascites), ICG-15 greater than 10%, major liver resection, intraoperative blood loss more than 800 mL, operative duration more than 270 min, major complications, tumor size larger than 5 cm, ruptured tumor, vascular invasion, daughter nodules, and cirrhosis were found to be poor prognostic factors for DFS (all P < 0.05). Cox regression multivariate analysis further demonstrated that ICG-15 greater than 10% (HR 1.520, 95% CI 1.204–1.919, P < 0.001), tumor size larger than 5 cm (HR 1.823, 95% CI 1.366–2.433, P < 0.001), vascular invasion (HR 1.460, 95% CI 1.116–1.910, P = 0.006), daughter nodules (HR 1.565, 95% CI 1.182–2.072, P = 0.002), and histologically-proven cirrhosis (HR 1.272, 95% CI 1.008–1.605, P = 0.043) were independent poor prognostic factors for DFS in N-HCC (Table 3).
As for overall survival (OS), N-HCC still enjoyed a significantly longer OS than A-HCC after the operation. The mean OS was 94.5 months (95% CI 91.0–97.9) for N-HCC and 81.7 months (95% CI 78.0–85.3) for A-HCC (P < 0.001). The Kaplan–Meier OS curves were illustrated in Figure 1. As shown in Figure 1, the 1-, 3-, and 5-year OS rates were 96.4%, 90.4%, and 84.8%, respectively, for N-HCC and 88.2%, 77.5%, and 72.6%, respectively, for A-HCC. Univariate analysis identified that male gender, cigarette smoking, major liver resection, intraoperative blood loss more than 800 mL, operative duration more than 270 min, major complications, tumor size larger than 5 cm, vascular invasion, daughter nodules, cirrhosis, and necrosis were poor prognostic indicators for OS (all P < 0.05). Cox regression multivariate analysis further demonstrated that tumor size larger than 5 cm (HR 1.839, 95% 1.375–2.461, P < 0.001), vascular invasion (HR 1.549, 95% CI 1.190–2.015, P = 0.001), daughter nodules (HR 1.786, 95% CI 1.359–2.348, P < 0.001), and histologically-proven cirrhosis (HR 1.438, 95% CI 1.145–1.805, P = 0.002) were independent poor prognostic factors for OS in N-HCC after surgery (Table 4).

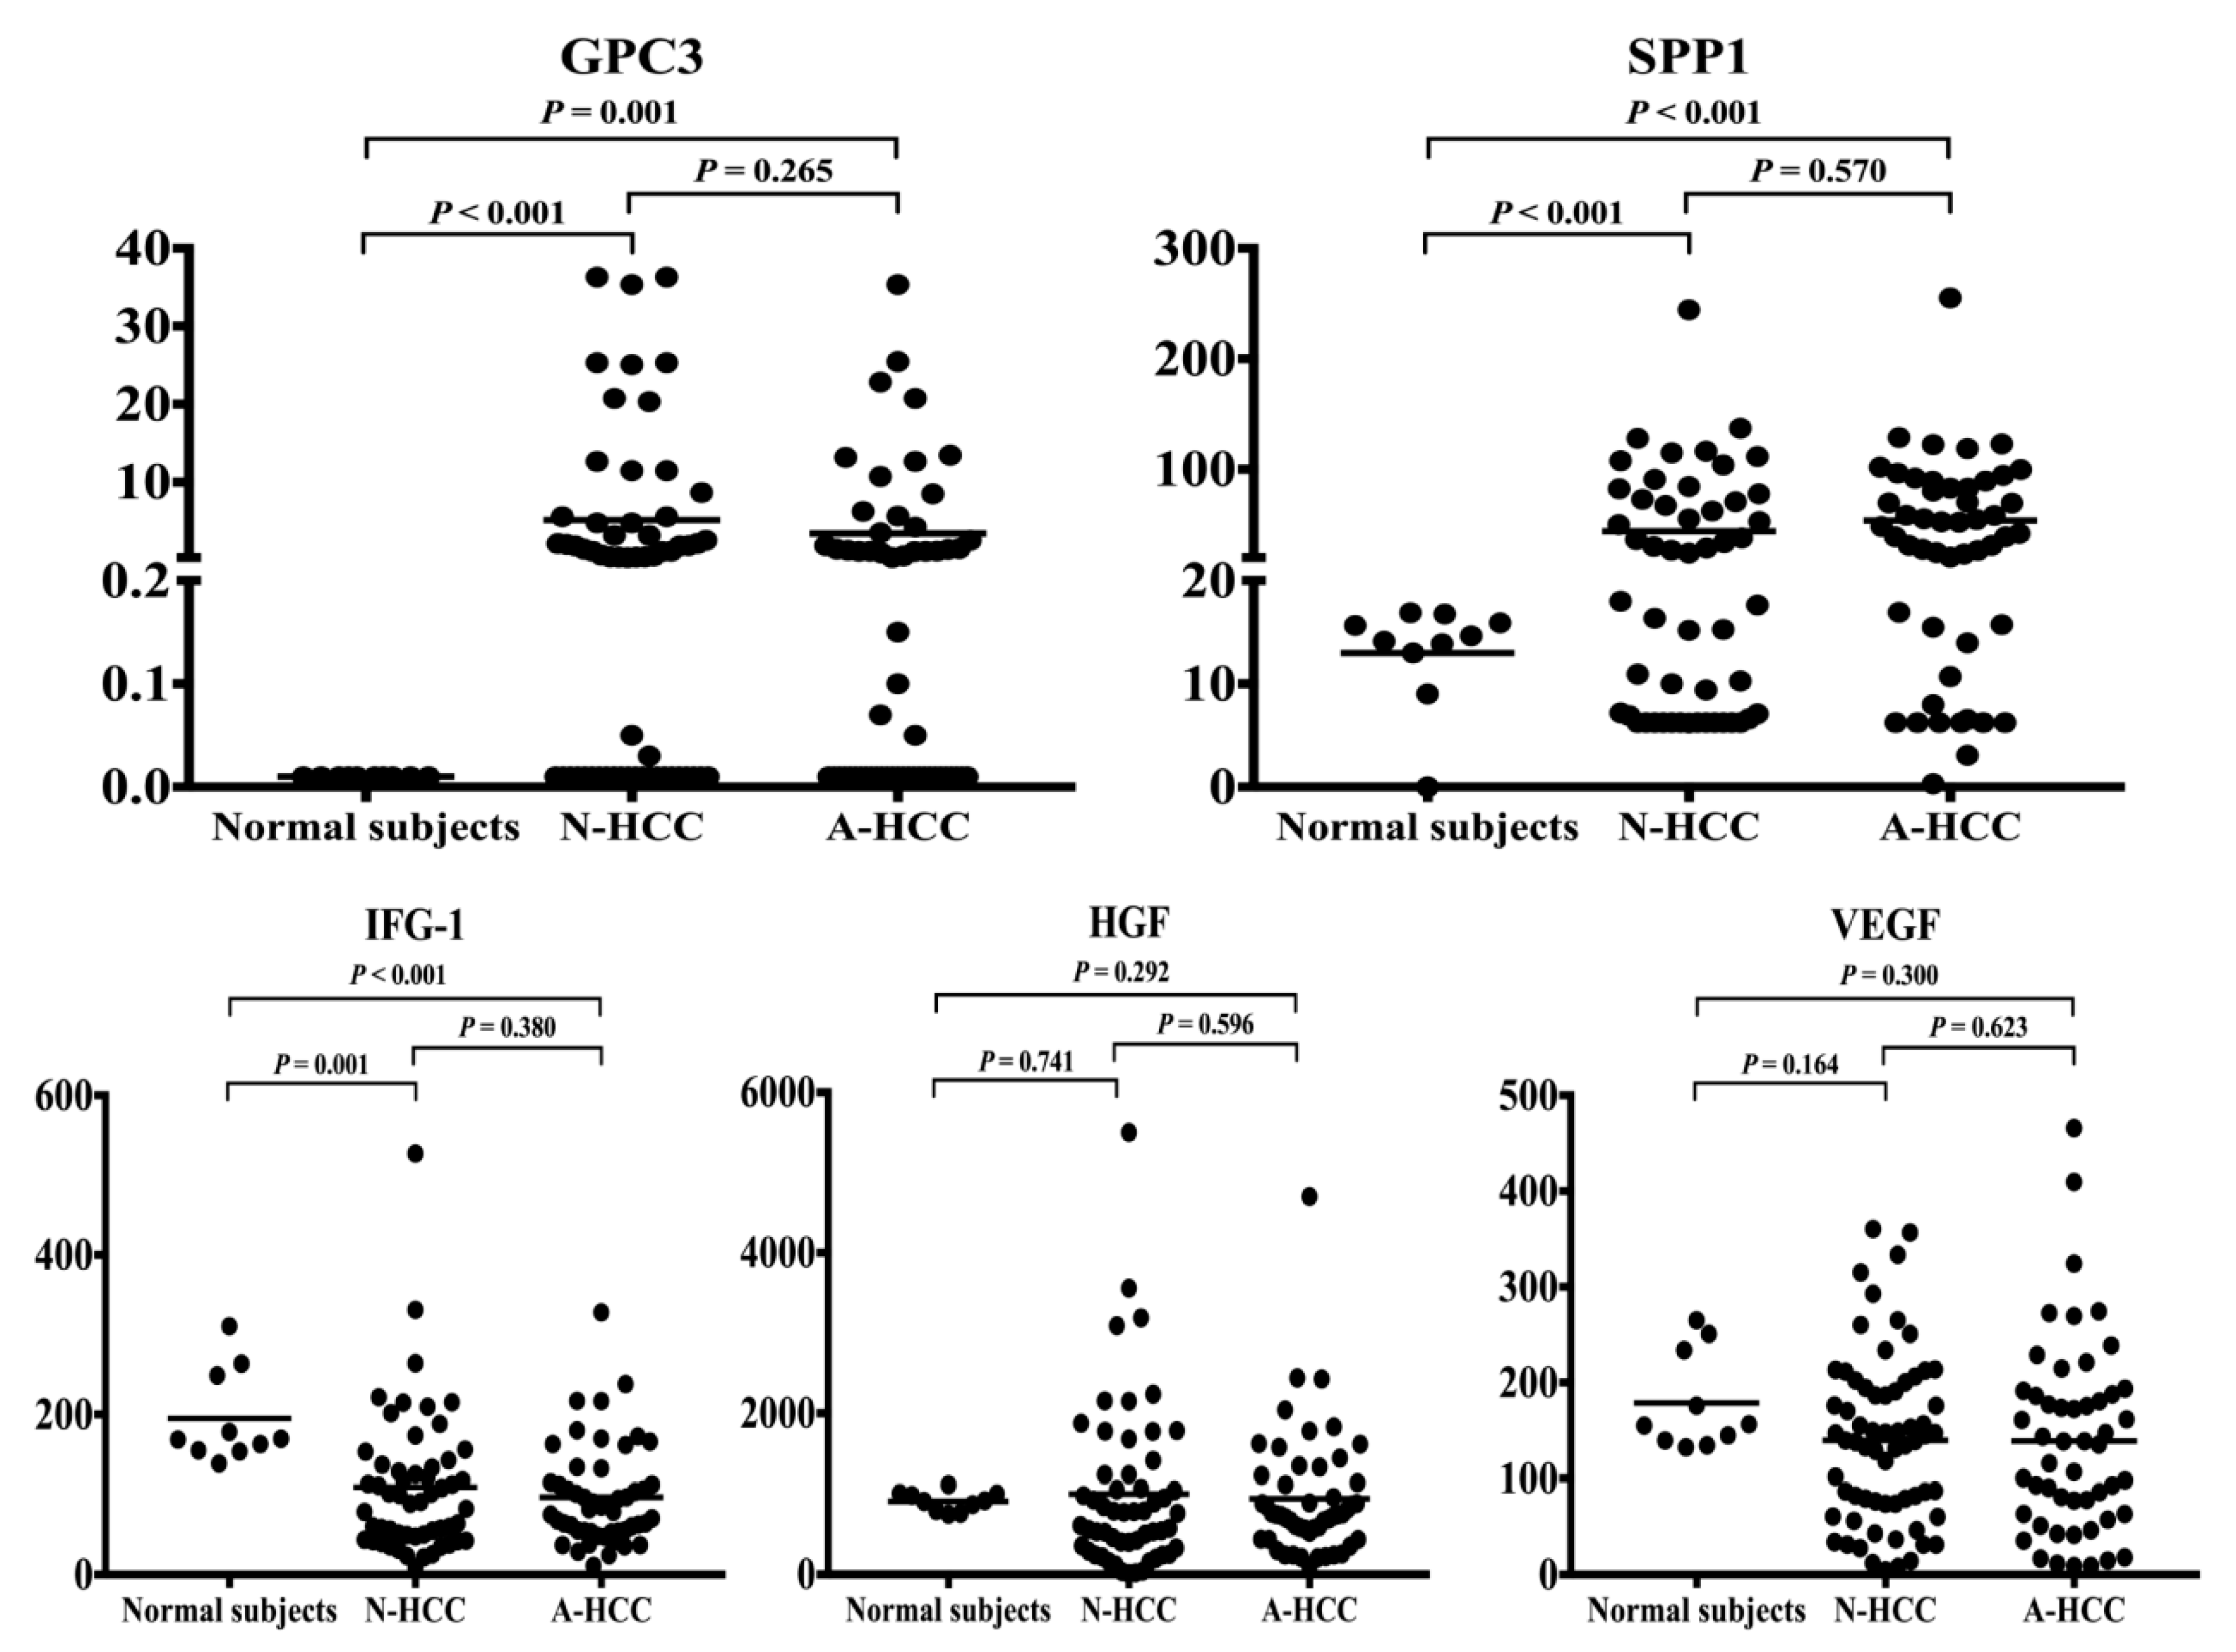
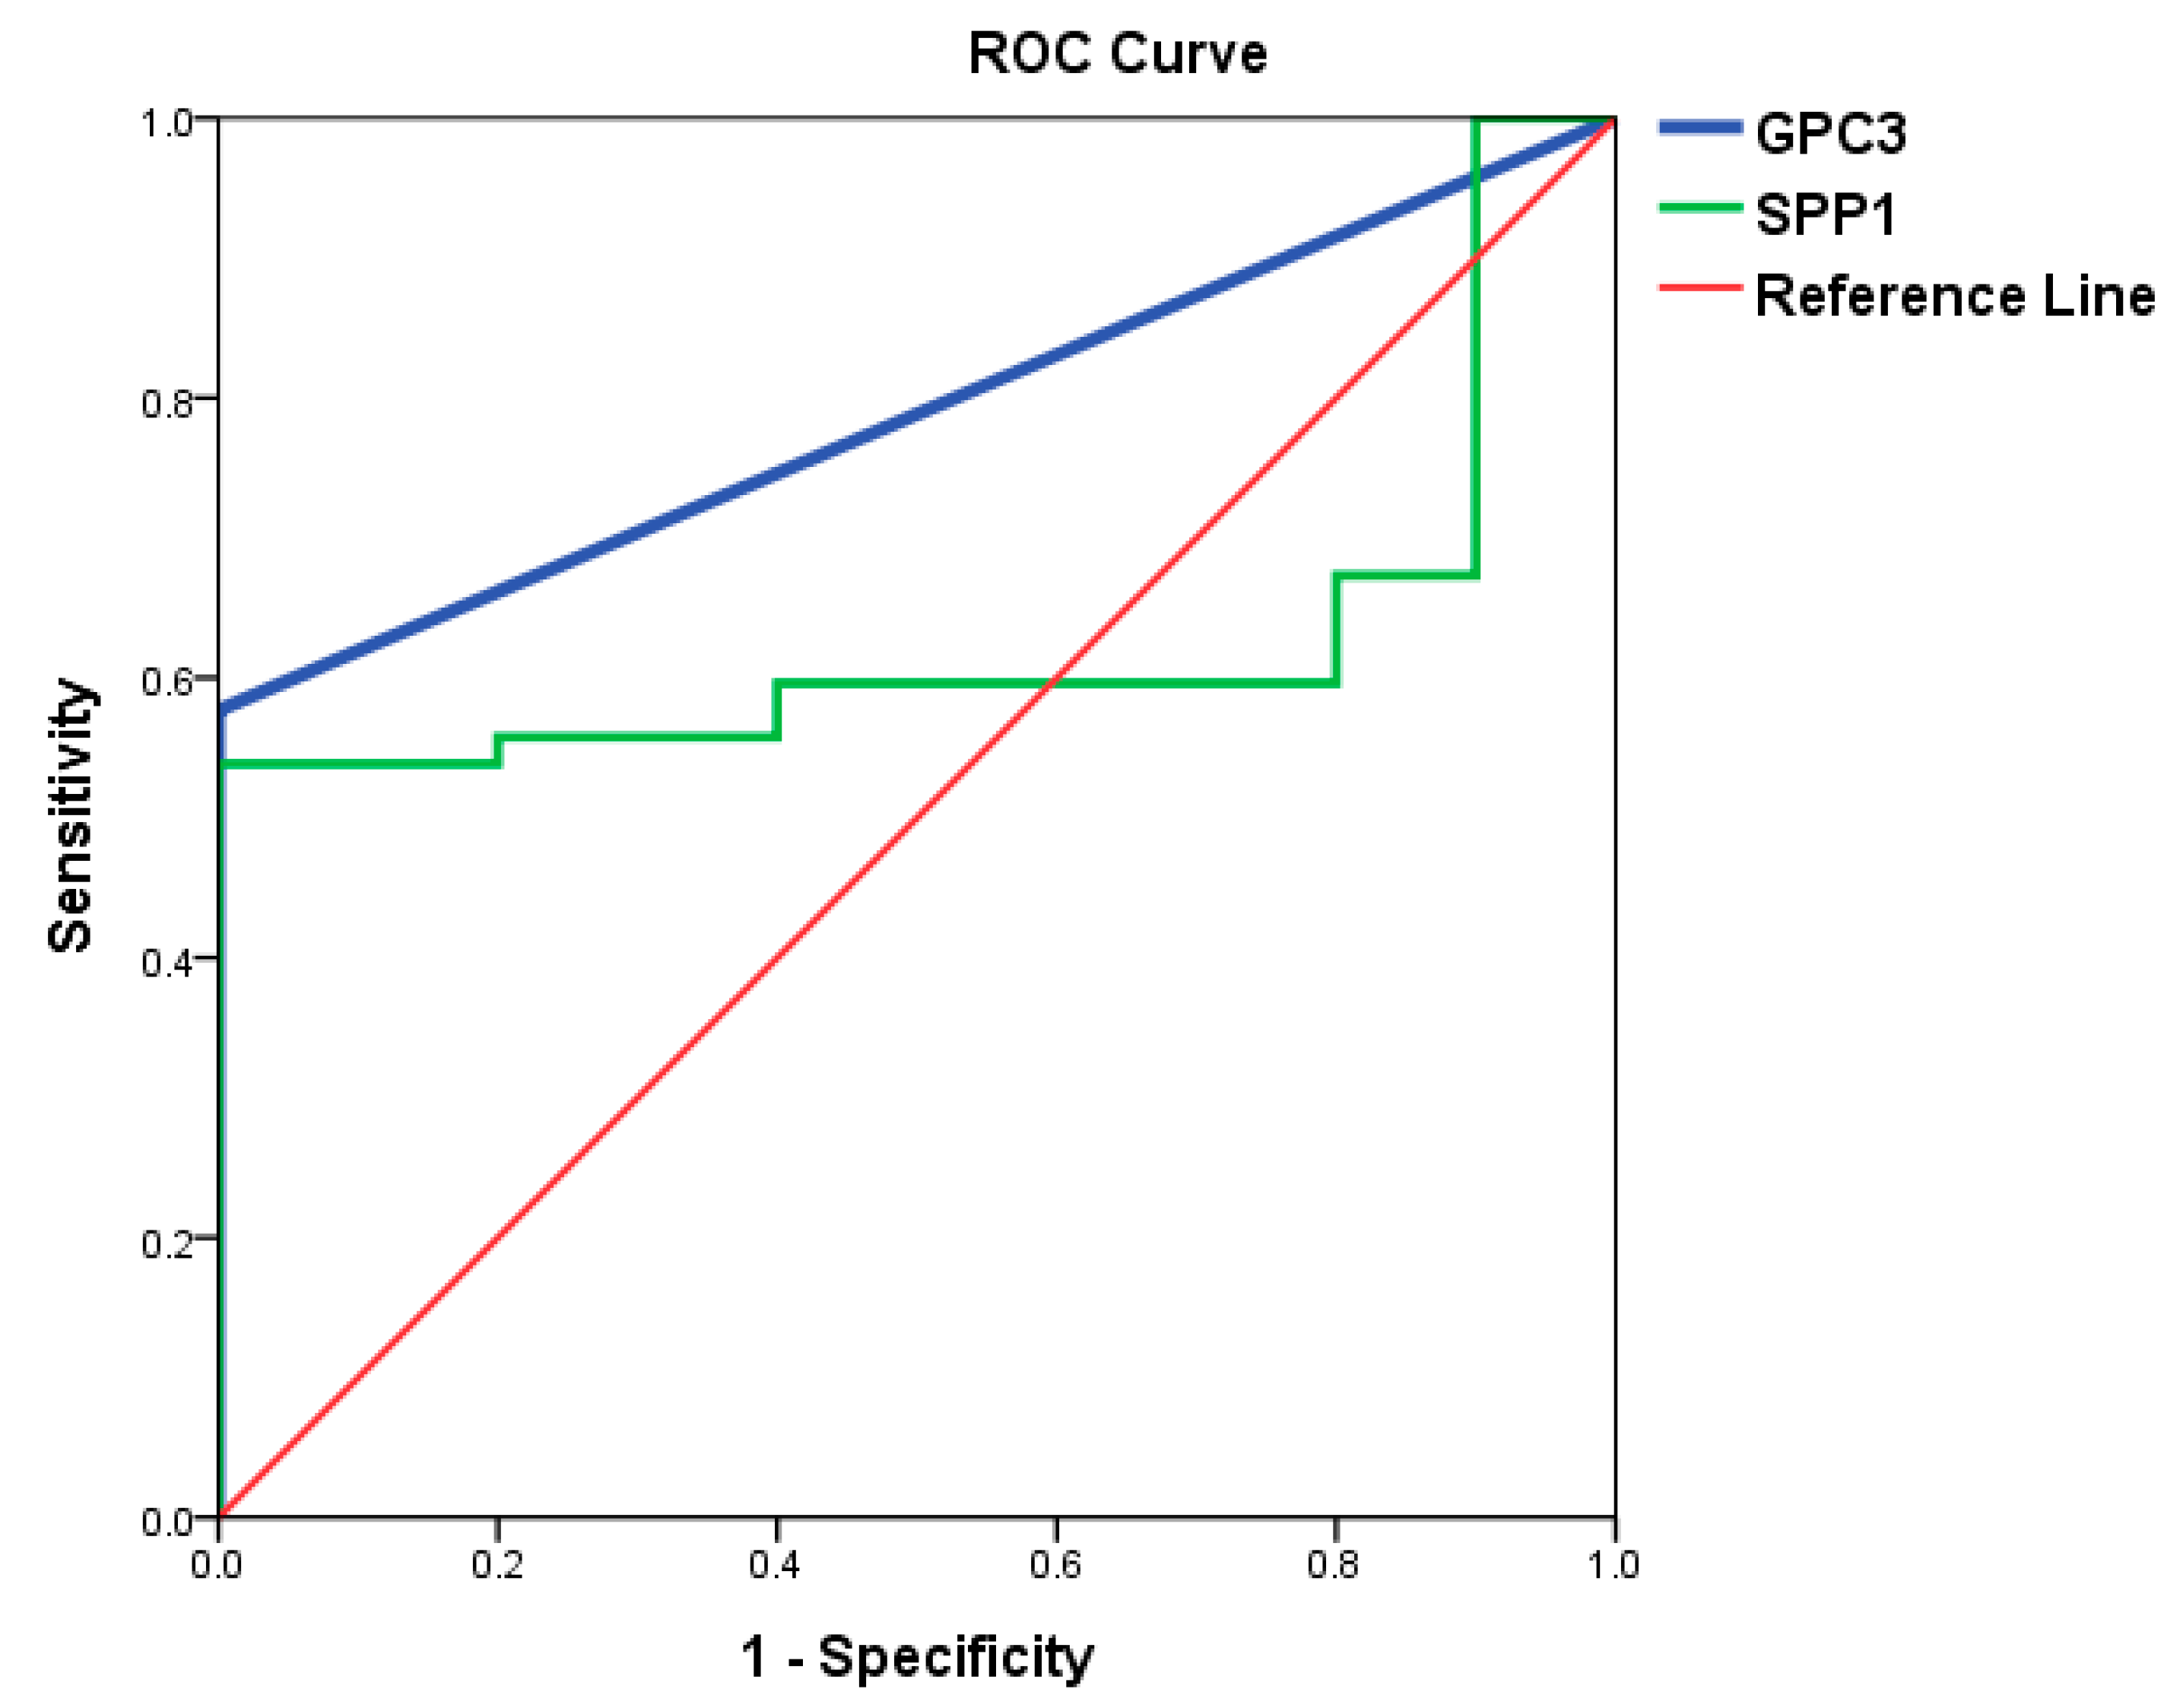
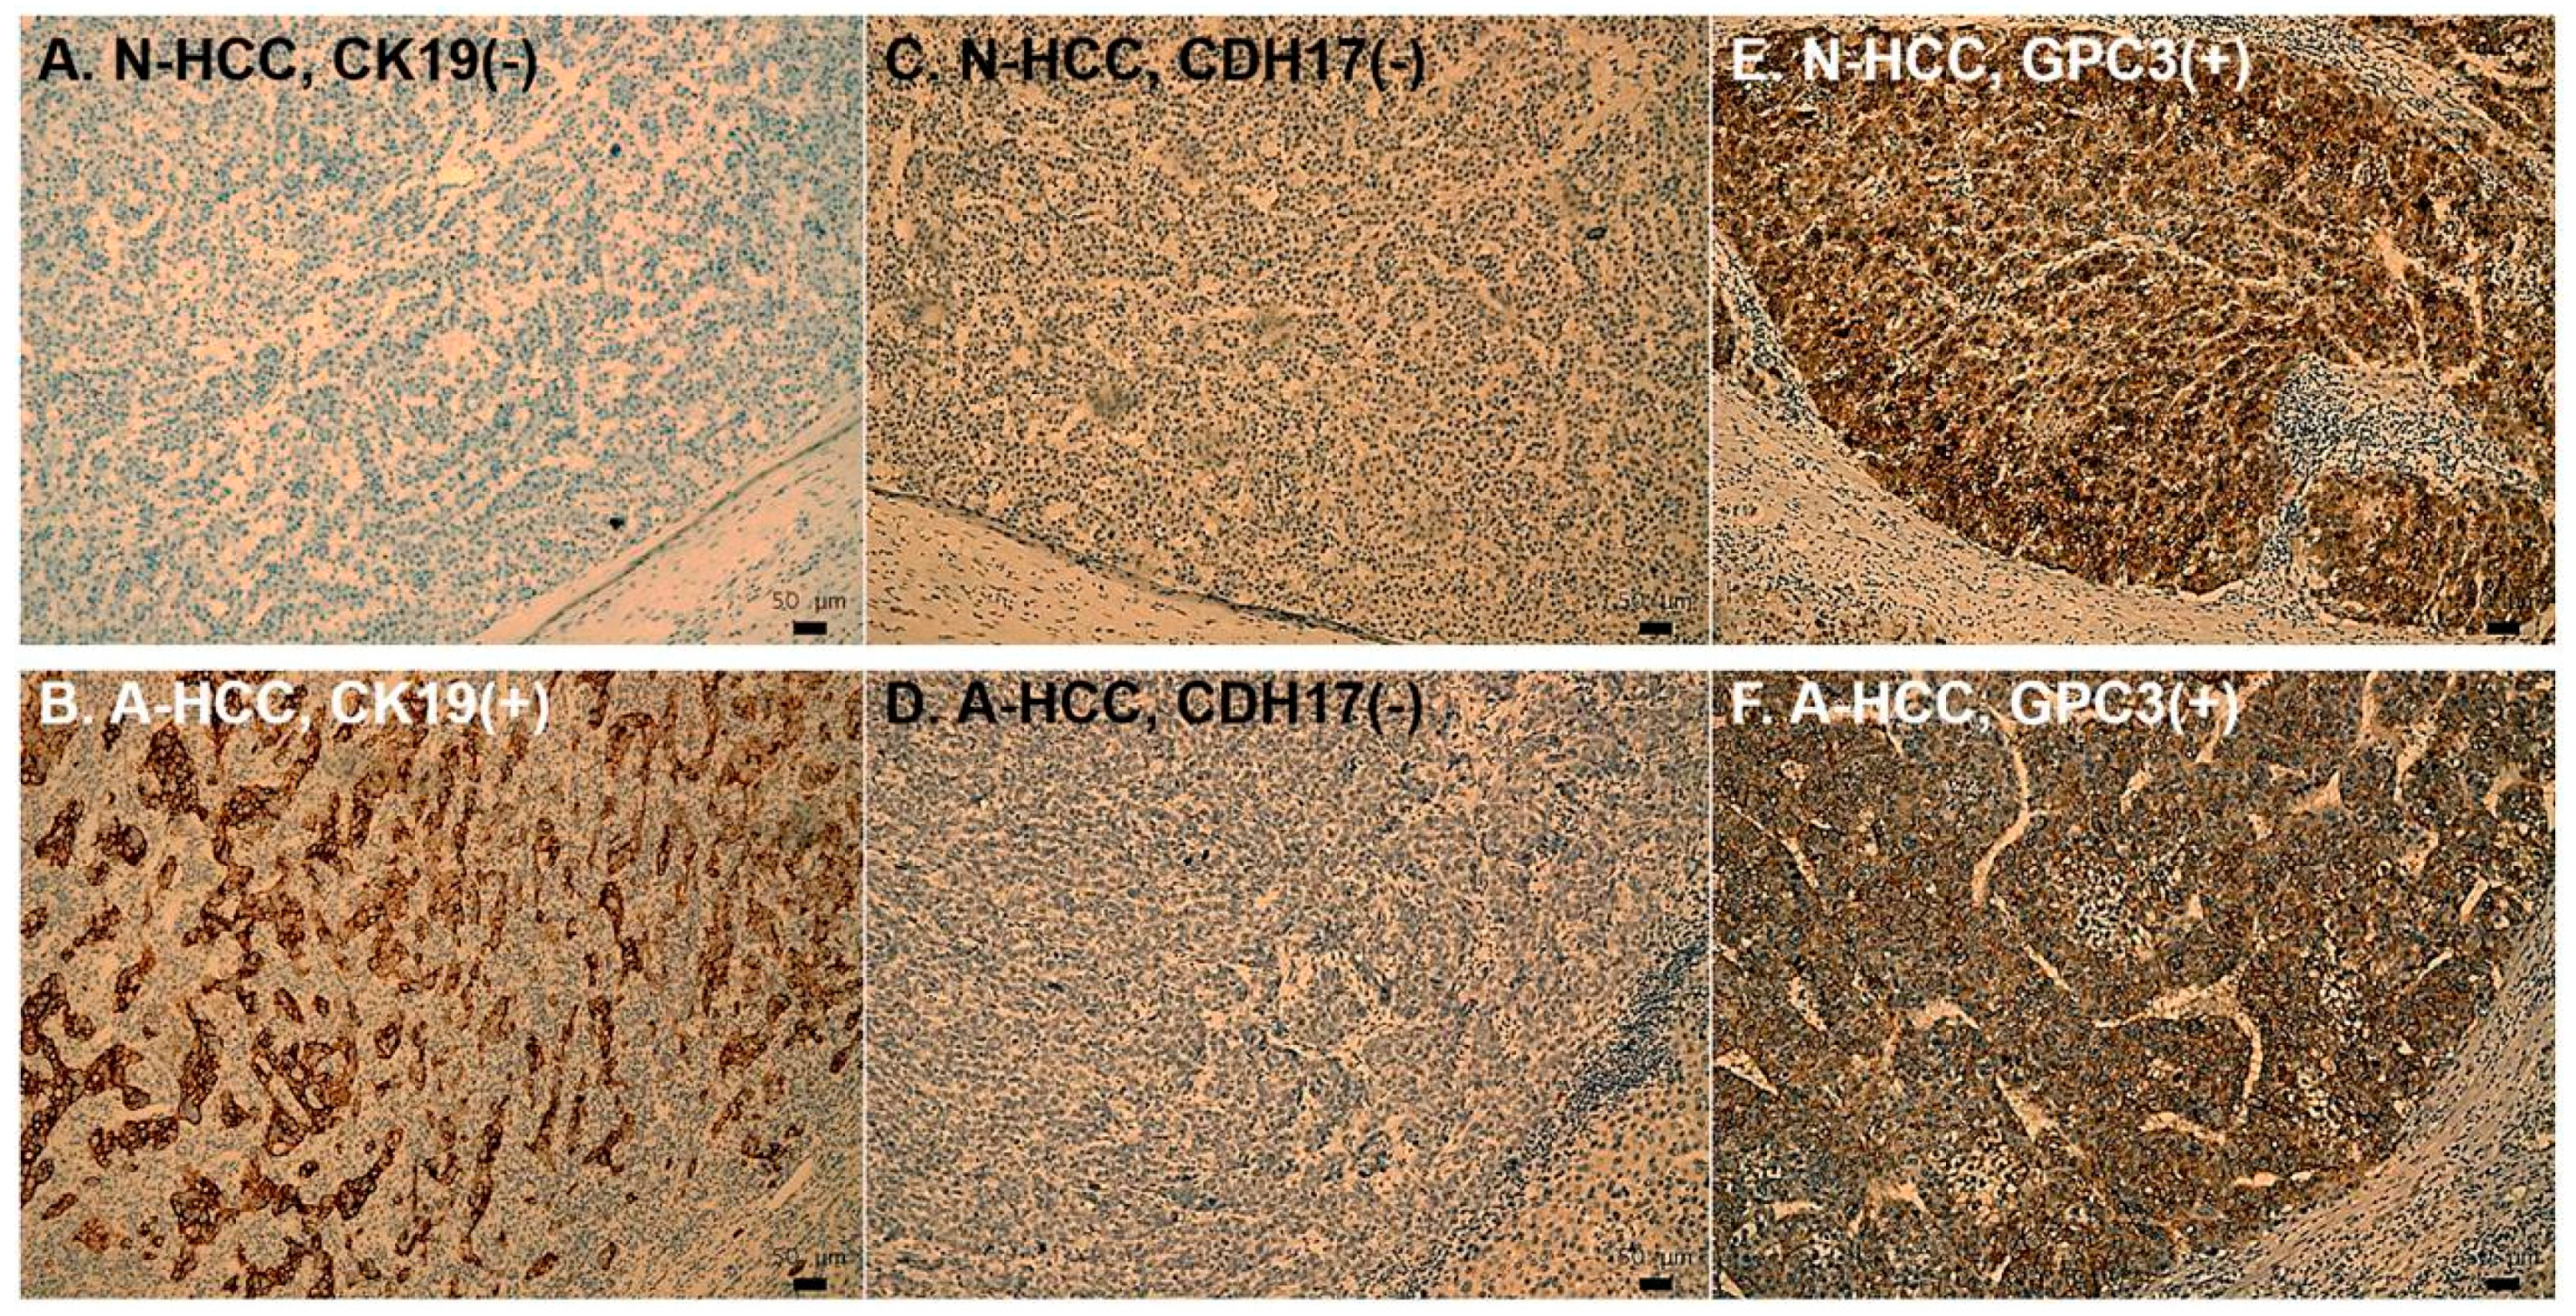
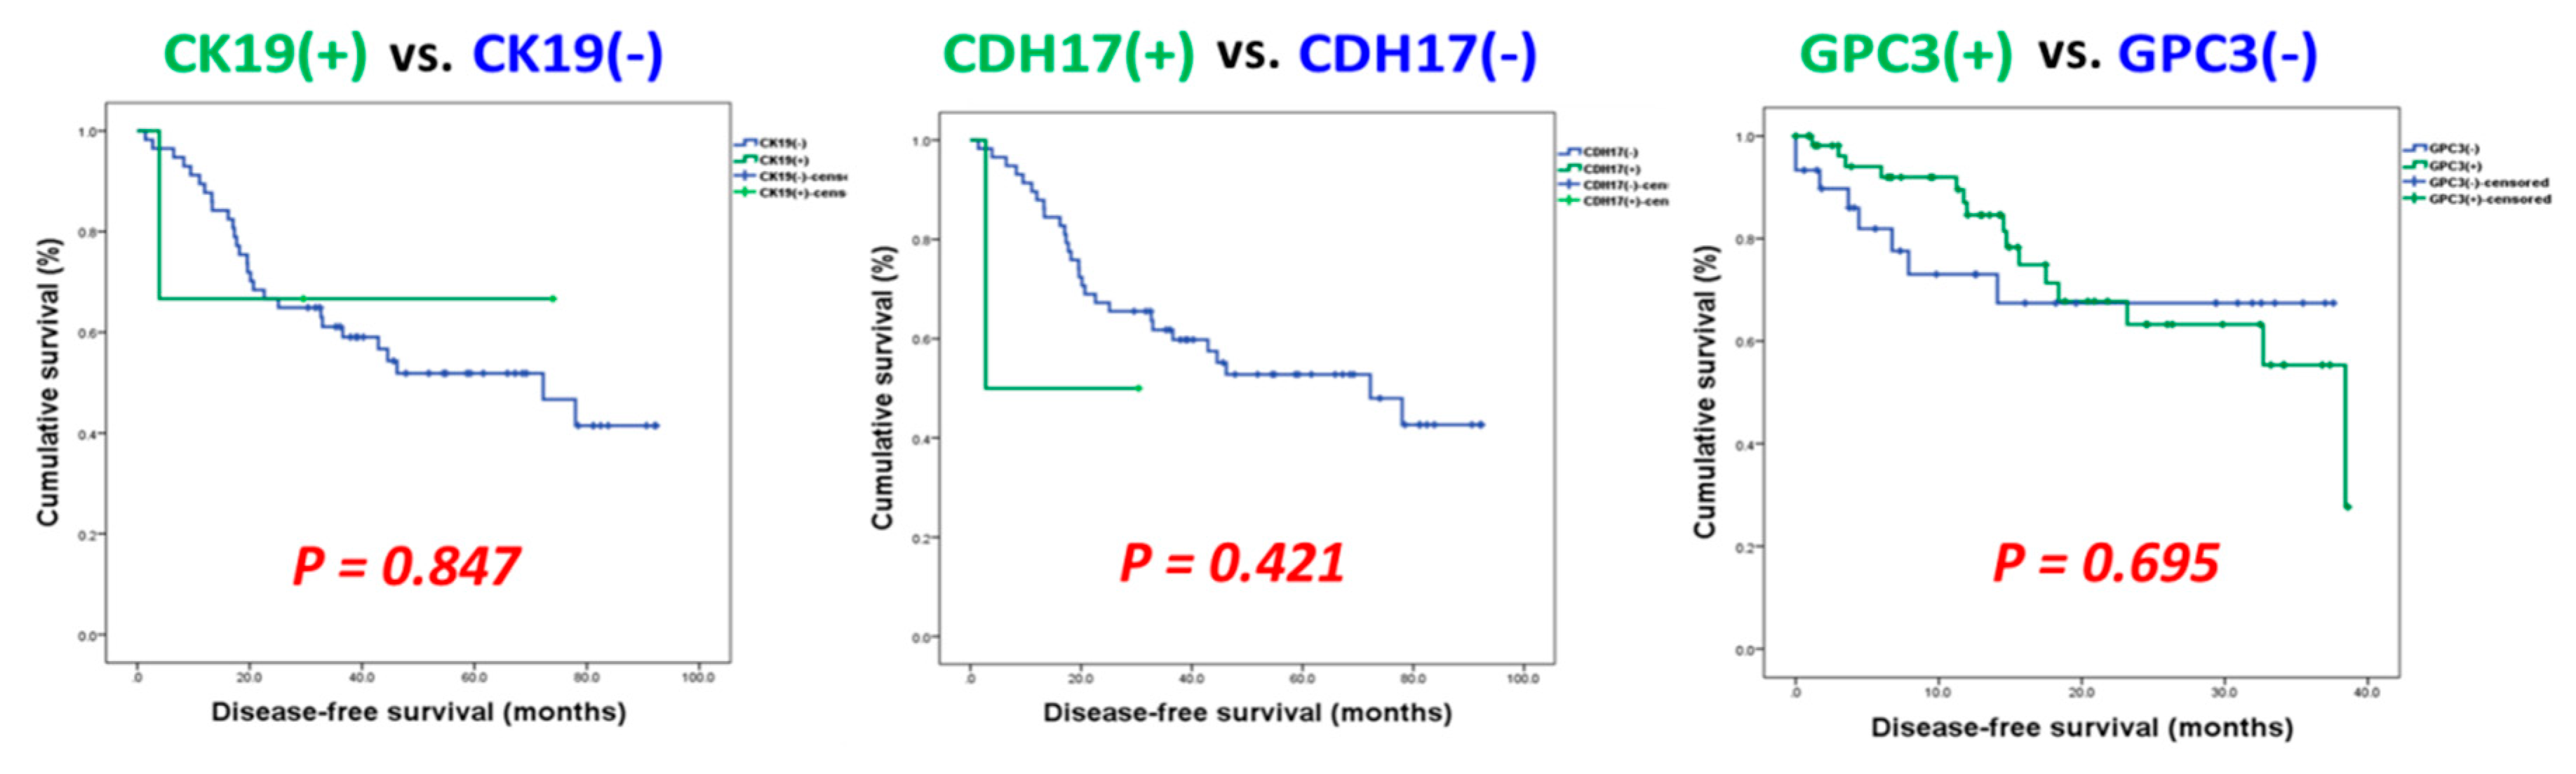
3.3. Identification of Potential Biomarkers for Normal AFP Hepatocellular Carcinoma

Among the cohort of 147 HCC patients scheduled to receive curative hepatectomy, 74 patients (50.3%) had normal AFP levels. As shown in Table 5, N-HCC patients had significantly higher serum glypican 3 (GPC3) and secreted phosphoprotein 1 (SPP1, or osteopontin (OPN)) levels than healthy subjects (mean GPC3, 5.1 vs. <0.01; mean SPP1, 52.2 vs. 13.0). On the contrary, insulin-like growth factor 1 (IGF-1) was significantly lower in N-HCC patients (mean IGF-1, 104 vs. 195). The distributions of respective concentrations were shown in Figure 2. Since an effective tumor marker should be instinctively higher in cancer patients, we chose GPC3 and SPP1 for further analysis.
As shown in Figure 3, the area under the ROC curve (AUC) of GPC3 and SPP1 for N-HCC was 0.788 (P = 0.004) and 0.625 (P = 0.213), respectively. GPC3 had a significantly better diagnostic capability for N-HCC than SPP1 in terms of AUC. When the cutoff value for GPC3 was set at 0.02 ng/mL, the sensitivity was 57.7% and the specificity of was 100% for N-HCC. On the other hand, when the cutoff value for SPP1 was set at 14.915 ng/mL, the sensitivity and specificity of OPN for N-HCC was only 59.6% and 60%, respectively. In other words, GPC3 may be a promising serum tumor marker for early detection and diagnosis of N-HCC.
In addition to serum levels of GPC3, we also examined the expression profiles of GPC3 and other promising prognostic indicators in tumor samples of N-HCC. As shown in Figure 4 and Table S1, the immunohistochemical (IHC) study of N-HCC and A-HCC for expressions of cytokeratin 19 (CK19), cadherin 17 (CDH17), and GPC3 were analyzed and compared. In accordance with serum profiles, more than 65% of N-HCC tumors expressed GPC3, and around 75% of A-HCC tumors showed immunopositivity for GPC3. In the meantime, the expression profiles of CDH17 were comparable between N-HCC and A-HCC. On the contrary, CK19 was sparsely seen in N-HCC. Unlike A-HCC, in which one-fourth of tumors had CK19 expression, only 5% of N-HCC tumors expressed CK19 upon IHC examination (P = 0.003). Furthermore, the influence of these prognostic markers on oncological survival were also investigated in N-HCC. After statistical analysis, neither CK19, CDH17, nor GPC3 was found to be a significantly poor prognostic factor for disease-free survival (DFS) or overall survival (OS) (P all > 0.05) in N-HCC (Figure 5).

4. Discussion

The current study demonstrated that normal AFP-HCC, or N-HCC, may be a distinct subclass of HCC based on evidence obtained from different aspects. First, the clinical analysis revealed that patients with N-HCC tended to be older males with less HBV infection, more non-viral etiology, and less cirrhosis. Since the vast majority of our non-viral N-HCC patients (87.8%) denied habitual alcohol consumption, carcinogenesis is, therefore, believed to be related to nonalcoholic fatty liver disease (NAFLD) or nonalcoholic steatohepatitis (NASH) [30,31]. This would implicate that NAFLD/NASH, in addition to viral hepatitis and cirrhosis, also plays an important role in the pathogenesis of N-HCC. According to a recent research, NASH may contribute to the development of HCC in the elderly without viral infection, and elderly HCC patients have significantly less liver cirrhosis [32]. Our study further indicates that these elderly non-viral HCC patients are more likely to be N-HCC. Secondly, the current study found that the N-HCC tended to be pathologically more well-differentiated and less advanced tumors. This would translate into a significantly better survival outcome in N-HCC than those with abnormal AFP levels after liver resection. Third, our translational study demonstrated that neither CK19, CDH17, nor GPC3 was found to be a significantly poor prognostic factor for either DFS or OS. This finding would contradict most of the previous publications that all CK19, CDH17, and GPC3 were poor prognostic indicators for HCC in general [33,34,35,36,37]. Lastly, we found in the current study that CK19, a notorious protein demonstrated to have worst outcome in HCC, was sparsely seen in N-HCC [33,34]. This and other results indicated that N-HCC may be a distinct subset of HCC that warrants further investigation. Unlike most of the previously published literature, which compared the outcome at a much higher AFP cut-off, our study employed the “normal” value as cut point and displayed the surgical as well as the long-term outcome. It is thus by far one of the largest series in the English literature to analyze the clinical-surgical-pathological variables and compare the survival outcome for HCC with normal AFP levels.
Many studies to date have been conducted to find new tumor markers for HCC. Nevertheless, most of them, instead of examining those HCC with lower or normal AFP levels, investigated HCC as a whole. The reported results, subsequently, may fail to discriminatively detect those HCC with normal AFP. It is thus of imperative significance to search for surrogate tumor markers for normal AFP-HCC.
Glypican-3 (GPC3) is a membrane-bound heparan sulfate proteoglycan belonging to a family of six similar cell-surface proteins [38]. It is also a fetal protein and only trace amount can be detected in adult kidney. Recent studies have shown that GPC3 can be employed to differentiate HCC from non-malignant hepatocellular diseases in resected liver specimen by immunohistochemical staining [39,40,41]. Moreover, high serum GPC3 levels were reported to be diagnostic of HCC with high sensitivity and specificity [4,16,17]. Its’ role as a prognostic biomarker for HCC after liver resection was also demonstrated [36]. This and other evidence suggested that GPC3 could be a potentially promising tumor marker for the diagnosis of HCC. However, yet another recent study reported that the publications regarding serum GPC3 for HCC diagnostics could be flawed due to different patient selection, sample size, heterogeneous experimental technique, and serum quality control [42]. Furthermore, most studies examined HCC as a whole; few had tried to investigate the diagnostic performance of GPC3 for HCC with low or normal AFP [24]. Therefore, it is crucial to determine the actual value of GPC3 in the diagnosis of HCC, especially HCC with low AFP. The results obtained from the current study demonstrated, from both the serological and tissue levels, that GPC3 could be a promising serum marker for early detection of N-HCC. We believe, as a result, that AFP and GPC3 should be determined simultaneously in patients at risk to enhance the diagnostic accuracy of HCC.
In addition to being a diagnostic serum tumor marker, AFP was reported to have functional roles in HCC. Recent study suggested that AFP transcriptionally down-regulates miR-29a through action of c-MYC, which in turn activates DNA methyltransferase 3A gene expression and global epigenetic alterations, resulting in aggressive HCC behavior and poor prognosis [43]. In other words, not only a serum biomarker can become a promising diagnostic tumor marker, but also it may be functionally active in promoting tumor formation, invasion, and metastasis. Whether such tumor markers exist for N-HCC thus mandates further investigation.
Despite promising results, the present study still has several limitations. Firstly, incomplete or missing clinical data are inevitable when retrospectively reviewing medical records. Secondly, the treatment strategy for HCC may have evolved over the study period, which could potentially influence the study results. Studies with shorter recruiting duration may address this issue. Thirdly, the current study aimed to explore a serum marker for the diagnosis of N-HCC. For a more persuasive and significant result, a larger sample size comprising different populations of patients including those with HCC, chronic liver diseases, hepatitis, cirrhosis, and normal healthy subjects are mandatory. Last but not the least, a stringent external validation cohort is also warranted to confirm our findings. As a result, a large-scale prospective study comprising exploration set and external validation set should be conducted.

5. Conclusions

In conclusion, the current study demonstrated that the clinicopathological characteristics of N-HCC were different from those of A-HCC in many aspects. N-HCC patients were significantly older with more comorbidities and less hepatitis virus infections. In addition, we found that GPC3 would be a promising tumor marker for diagnosing N-HCC. Our results implicate that the etiology and pathogenesis of N-HCC may be different from that of traditional HCC or A-HCC. This “N-HCC”, subsequently, should not be merely “normal AFP-HCC”; more specifically, we believe it should stand for “new category-HCC”. Further well-designed studies are warranted to validate our findings.

Supplementary Materials

The following are available online at https://www.mdpi.com/2077-0383/8/10/1736/s1, Table S1: IHC characteristics of N-HCC vs. A-HCC.

Author Contributions

Conceptualization, C.-W.L., C.-W.C. and M.-C.Y.; data curation, C.-W.L., H.-I.T., S.-W.H., C.-Y.L. and T.K.; formal analysis, H.-I.T., W.-C.L. and T.K.; funding acquisition, C.-W.L., S.-W.H., C.-Y.L. and C.-W.C.; investigation, W.-C.L., Y.-C.H. and M.-C.Y.; methodology, C.-W.L., W.-C.L. and Y.-C.H.; software, Y.-C.H. and T.K.; supervision, W.-C.L., C.-W.C. and M.-C.Y.; validation, C.-W.L., H.-I.T. and C.-W.C.; writing—original draft, C.-W.L.; writing—review and editing, H.-I.T., C.-W.C. and M.-C.Y.

Funding

This study was supported by the Chang Gung Memorial Hospital (CMRPG3G1301 and CMRPG3I0301) and Ministry of Science and Technology, Taiwan, R.O.C. (MOST 107-2314-B-182A-119-/NMRPG3H0291).

Acknowledgments

We are grateful to all our colleagues in the Department of Cancer Center, Department of Pathology, Chang Gung Memorial Hospital, and Graduate Institute of Clinical Medical Sciences, Chang Gung University for their technical assistance. We are also grateful to Jo-Chu Chiu, Chun-Hsing Wu, and Yi-Ping Liu for their assistance in data retrieval and processing.

Ethics Approval and Consent to Participate

This study was approved by the Institutional Review Boards (CGMH IRB No: 100-4268B and 201600359B0) of Chang Gung Memorial Hospital (CGMH).

Conflicts of Interest

Chao-Wei Lee, Hsin-I Tsai, Wei-Chen Lee, Shu-Wei Huang, Cheng-Yu Lin, Yi-Chung Hsieh, Tony Kuo, Chun-Wei Chen, and Ming-Chin Yu have no conflicts of interest or financial ties to disclose.

References

  1. Torre, L.A.; Bray, F.; Siegel, R.L.; Ferlay, J.; Lortet-Tieulent, J.; Jemal, A. Global cancer statistics, 2012. CA A Cancer J. Clin. 2015, 65, 87–108. [Google Scholar] [CrossRef] [Green Version]
  2. Department of Health ROC. Report of Leading Cancer-Related Death in 2014; Department of Health, Executive Yuan: Taipei, Taiwan, 2015. [Google Scholar]
  3. Masuzaki, R.; Karp, S.J.; Omata, M. New serum markers of hepatocellular carcinoma. Semin. Oncol. 2012, 39, 434–439. [Google Scholar] [CrossRef]
  4. Waidely, E.; Al-Yuobi, A.R.; Bashammakh, A.S.; El-Shahawi, M.S.; Leblanc, R.M. Serum protein biomarkers relevant to hepatocellular carcinoma and their detection. Analyst 2016, 141, 36–44. [Google Scholar] [CrossRef]
  5. Marrero, J.A.; Fontana, R.J.; Barrat, A.; Askari, F.; Conjeevaram, H.S.; Su, G.L.; Lok, A.S. Prognosis of hepatocellular carcinoma: Comparison of 7 staging systems in an American cohort. Hepatology 2005, 41, 707–716. [Google Scholar] [CrossRef]
  6. Jacobs, J.P.; Mavroudis, C.; Jacobs, M.L.; Maruszewski, B.; Tchervenkov, C.I.; Lacour-Gayet, F.G.; Clarke, D.R.; Yeh, T., Jr.; Walters, H.L., 3rd; Kurosawa, H.; et al. What is operative mortality? Defining death in a surgical registry database: A report of the STS Congenital Database Taskforce and the Joint EACTS-STS Congenital Database Committee. Ann. Thorac. Surg. 2006, 81, 1937–1941. [Google Scholar] [CrossRef]
  7. Ruoslahti, E.; Seppala, M. Studies of carcino-fetal proteins: Physical and chemical properties of human alpha-fetoprotein. Int. J. Cancer 1971, 7, 218–225. [Google Scholar] [CrossRef]
  8. Park, S.J.; Jang, J.Y.; Jeong, S.W.; Cho, Y.K.; Lee, S.H.; Kim, S.G.; Cha, S.W.; Kim, Y.S.; Cho, Y.D.; Kim, H.S.; et al. Usefulness of AFP, AFP-L3, and PIVKA-II, and their combinations in diagnosing hepatocellular carcinoma. Medicine 2017, 96, e5811. [Google Scholar] [CrossRef] [PubMed]
  9. Daniele, B.; Bencivenga, A.; Megna, A.S.; Tinessa, V. Alpha-fetoprotein and ultrasonography screening for hepatocellular carcinoma. Gastroenterology 2004, 127, S108–S112. [Google Scholar] [CrossRef] [PubMed]
  10. Tandon, P.; Garcia-Tsao, G. Prognostic indicators in hepatocellular carcinoma: A systematic review of 72 studies. Liver Int. 2009, 29, 502–510. [Google Scholar] [CrossRef] [PubMed]
  11. Cancer of the Liver Italian Program (CLIP) Investigators. A new prognostic system for hepatocellular carcinoma: A retrospective study of 435 patients: The Cancer of the Liver Italian Program (CLIP) investigators. Hepatology 1998, 28, 751–755. [Google Scholar] [CrossRef] [PubMed]
  12. Filmus, J.; Selleck, S.B. Glypicans: Proteoglycans with a surprise. J. Clin. Investig. 2001, 108, 497–501. [Google Scholar] [CrossRef] [PubMed]
  13. Nakatsura, T.; Yoshitake, Y.; Senju, S.; Monji, M.; Komori, H.; Motomura, Y.; Hosaka, S.; Beppu, T.; Ishiko, T.; Kamohara, H.; et al. Glypican-3, overexpressed specifically in human hepatocellular carcinoma, is a novel tumor marker. Biochem. Biophys. Res. Commun. 2003, 306, 16–25. [Google Scholar] [CrossRef]
  14. Capurro, M.I.; Xiang, Y.Y.; Lobe, C.; Filmus, J. Glypican-3 promotes the growth of hepatocellular carcinoma by stimulating canonical Wnt signaling. Cancer Res. 2005, 65, 6245–6254. [Google Scholar] [CrossRef] [PubMed]
  15. Midorikawa, Y.; Ishikawa, S.; Iwanari, H.; Imamura, T.; Sakamoto, H.; Miyazono, K.; Kodama, T.; Makuuchi, M.; Aburatani, H. Glypican-3, overexpressed in hepatocellular carcinoma, modulates FGF2 and BMP-7 signaling. Int. J. Cancer. 2003, 103, 455–465. [Google Scholar] [CrossRef] [PubMed]
  16. Liu, H.; Li, P.; Zhai, Y.; Qu, C.F.; Zhang, L.J.; Tan, Y.F.; Li, N.; Ding, H.G. Diagnostic value of glypican-3 in serum and liver for primary hepatocellular carcinoma. World J. Gastroenterol. 2010, 16, 4410–4415. [Google Scholar] [CrossRef] [PubMed]
  17. Capurro, M.; Wanless, I.R.; Sherman, M.; Deboer, G.; Shi, W.; Miyoshi, E.; Filmus, J. Glypican-3: A novel serum and histochemical marker for hepatocellular carcinoma. Gastroenterology 2003, 125, 89–97. [Google Scholar] [CrossRef]
  18. Rehem, R.N.; El-Shikh, W.M. Serum IGF-1, IGF-2 and IGFBP-3 as parameters in the assessment of liver dysfunction in patients with hepatic cirrhosis and in the diagnosis of hepatocellular carcinoma. Hepatogastroenterology 2011, 58, 949–954. [Google Scholar] [PubMed]
  19. Karabulut, S.; Tas, F.; Akyüz, F.; Ormeci, A.C.; Serilmez, M.; Soydinç, H.O.; Vatansever, S.; Yasasever, V. Clinical significance of serum hepatocyte growth factor (HGF) levels in hepatocellular carcinoma. Tumour Biol. 2014, 35, 2327–2333. [Google Scholar] [CrossRef]
  20. Sun, Q.; Zhang, Y.; Liu, F.; Zhao, X.; Yang, X. Identification of candidate biomarkers for hepatocellular carcinoma through pre-cancerous expression analysis in an HBx transgenic mouse. Cancer Biol. Ther. 2007, 6, 1532–1538. [Google Scholar] [CrossRef]
  21. Marrero, J.A.; Kulik, L.M.; Sirlin, C.B.; Zhu, A.X.; Finn, R.S.; Abecassis, M.M.; Roberts, L.R.; Heimbach, J.K. Diagnosis, Staging, and Management of Hepatocellular Carcinoma: 2018 Practice Guidance by the American Association for the Study of Liver Diseases. Hepatology 2018, 68, 723–750. [Google Scholar] [CrossRef] [Green Version]
  22. Yamagamim, H.; Moriyama, M.; Matsumura, H.; Aoki, H.; Shimizu, T.; Saito, T.; Kaneko, M.; Shioda, A.; Tanaka, N.; Arakawa, Y. Serum concentrations of human hepatocyte growth factor is a useful indicator for predicting the occurrence of hepatocellular carcinomas in C-viral chronic liver diseases. Cancer 2002, 95, 824–834. [Google Scholar] [CrossRef] [PubMed]
  23. Atta, M.M.E.S.A.; Atta, H.M.; Gad, M.A.M.; Rashed, L.A.; Said, E.M.; Hassanien, S.E.S.A.; Kaseb, A.O. Clinical significance of vascular endothelial growth factor in hepatitis C related hepatocellular carcinoma in Egyptian patients. J. Hepatocell. Carcinoma 2016, 3, 19–24. [Google Scholar] [CrossRef] [PubMed] [Green Version]
  24. Carr, B.I.; Pancoska, P.; Branch, R.A. Low alpha-fetoprotein hepatocellular carcinoma. J. Gastroenterol. Hepatol. 2010, 25, 1543–1549. [Google Scholar] [CrossRef] [PubMed]
  25. Lau, H.; Man, K.; Fan, S.T.; Yu, W.C.; Lo, C.M.; Wong, J. Evaluation of preoperative hepatic function in patients with hepatocellular carcinoma undergoing hepatectomy. Br. J. Surg. 1997, 84, 1255–1259. [Google Scholar] [CrossRef]
  26. Lam, C.M.; Fan, S.T.; Lo, C.M.; Wong, J. Major hepatectomy for hepatocellular carcinoma in patients with an unsatisfactory indocyanine green clearance test. Br. J. Surg. 1999, 86, 1012–1017. [Google Scholar] [CrossRef]
  27. Pang, Y.Y. The Brisbane 2000 terminology of liver anatomy and resections. HPB 2000; 2:333-39. HPB 2002, 4, 99–100. [Google Scholar] [CrossRef]
  28. Dindo, D.; Demartines, N.; Clavien, P.-A. Classification of Surgical Complications. Ann. Surg. 2004, 240, 205–213. [Google Scholar] [CrossRef]
  29. Hsu, H.Y.; Yu, M.C.; Lee, C.W.; Tsai, H.I.; Sung, C.M.; Chen, C.W.; Huang, S.W.; Lin, C.Y.; Jeng, W.J.; Lee, W.C.; et al. RAM score is an effective predictor for early mortality and recurrence after hepatectomy for hepatocellular carcinoma. BMC Cancer 2017, 17, 742. [Google Scholar] [CrossRef]
  30. Yasui, K.; Hashimoto, E.; Tokushige, K.; Koike, K.; Shima, T.; Kanbara, Y.; Saibara, T.; Uto, H.; Takami, S.; Kawanaka, M.; et al. Clinical and pathological progression of non-alcoholic steatohepatitis to hepatocellular carcinoma. Hepatol. Res. 2012, 42, 767–773. [Google Scholar] [CrossRef]
  31. Ascha, M.S.; Hanouneh, I.A.; Lopez, R.; Tamimi, T.A.; Feldstein, A.F.; Zein, N.N. The incidence and risk factors of hepatocellular carcinoma in patients with nonalcoholic steatohepatitis. Hepatology 2010, 51, 1972–1978. [Google Scholar] [CrossRef]
  32. Lee, C.W.; Chan, K.M.; Tsai, H.I.; Hsieh, Y.C.; Lin, C.Y.; Kuo, Y.C.; Hsu, H.Y.; Yu, M.C. Hepatic resection for hepatocellular carcinoma in the octogenarian: Is it justified? Aging 2019, 11, 1537–1550. [Google Scholar] [CrossRef] [PubMed]
  33. Lee, C.W.; Lin, S.E.; Tsai, H.I.; Su, P.J.; Hsieh, C.H.; Kuo, Y.C.; Sung, C.M.; Lin, C.Y.; Tsai, C.N.; Yu, M.C. Cadherin 17 is related to recurrence and poor prognosis of cytokeratin 19-positive hepatocellular carcinoma. Oncol. Lett. 2018, 15, 559–567. [Google Scholar] [CrossRef] [PubMed]
  34. Lee, C.W.; Kuo, W.L.; Yu, M.C.; Chen, T.C.; Tsai, C.N.; Lee, W.C.; Chen, M.F. The expression of cytokeratin 19 in lymph nodes was a poor prognostic factor for hepatocellular carcinoma after hepatic resection. World J. Surg. Oncol. 2013, 11, 136. [Google Scholar] [CrossRef] [PubMed]
  35. Ding, Z.B.; Shi, Y.H.; Zhou, J.; Shi, G.M.; Ke, A.W.; Qiu, S.; Wang, X.Y.; Dai, Z.; Xu, Y.; Fan, J. Liver-intestine cadherin predicts microvascular invasion and poor prognosis of hepatitis B virus-positive hepatocellular carcinoma. Cancer 2009, 115, 4753–4765. [Google Scholar] [CrossRef]
  36. Fu, S.J.; Qi, C.Y.; Xiao, W.K.; Li, S.Q.; Peng, B.G.; Liang, L.J. Glypican-3 is a potential prognostic biomarker for hepatocellular carcinoma after curative resection. Surgery 2013, 154, 536–544. [Google Scholar] [CrossRef]
  37. Yu, M.C.; Lee, Y.S.; Lin, S.E.; Wu, H.Y.; Chen, T.C.; Lee, W.C.; Chen, M.F.; Tsai, C.N. Recurrence and poor prognosis following resection of small hepatitis B-related hepatocellular carcinoma lesions are associated with aberrant tumor expression profiles of glypican 3 and osteopontin. Ann. Surg. Oncol. 2012, 19 (Suppl. 3), S455–S463. [Google Scholar] [CrossRef]
  38. Wang, S.K.; Zynger, D.L.; Hes, O.; Yang, X.J. Discovery and diagnostic value of a novel oncofetal protein: Glypican 3. Adv. Anat. Pathol. 2014, 21, 450–460. [Google Scholar] [CrossRef]
  39. Yao, S.; Zhang, J.; Chen, H.; Sheng, Y.; Zhang, X.; Liu, Z.; Zhang, C. Diagnostic value of immunohistochemical staining of GP73, GPC3, DCP, CD34, CD31, and reticulin staining in hepatocellular carcinoma. J. Histochem. Cytochem. 2013, 61, 639–648. [Google Scholar] [CrossRef]
  40. Enan, E.T.; El-Hawary, A.K.; El-Tantawy, D.A.; Abu-Hashim, M.M.; Helal, N.M. Diagnostic role of glypican 3 and CD34 for differentiating hepatocellular carcinoma from nonmalignant hepatocellular lesions. Ann. Diagn. Pathol. 2013, 17, 490–493. [Google Scholar] [CrossRef]
  41. Shafizadeh, N.; Ferrell, L.D.; Kakar, S. Utility and limitations of glypican-3 expression for the diagnosis of hepatocellular carcinoma at both ends of the differentiation spectrum. Mod. Pathol. 2008, 21, 1011–1018. [Google Scholar] [CrossRef] [Green Version]
  42. Liu, X.F.; Hu, Z.D.; Liu, X.C.; Cao, Y.; Ding, C.M.; Hu, C.J. Diagnostic accuracy of serum glypican-3 for hepatocellular carcinoma: A systematic review and meta-analysis. Clin. Biochem. 2014, 47, 196–200. [Google Scholar] [CrossRef] [PubMed]
  43. Parpart, S.; Roessler, S.; Dong, F.; Rao, V.; Takai, A.; Ji, J.; Qin, L.X.; Ye, Q.H.; Jia, H.L.; Tang, Z.Y.; et al. Modulation of miR-29 expression by alpha-fetoprotein is linked to the hepatocellular carcinoma epigenome. Hepatology 2014, 60, 872–883. [Google Scholar] [CrossRef] [PubMed] [Green Version]
Figure 1. Kaplan–Meier disease-free survival (DFS) and overall survival (OS) curves for hepatocellular carcinoma with normal (N-HCC) or abnormal (A-HCC) AFP. A, Disease-free survival curves. The median DFS was 44.6 months (95% CI 34.2–54.9) for N-HCC and 23.6 months (95% CI 18.7–28.6) for A-HCC (P < 0.001). The one-, three-, and five-year DFS rates were 81.6%, 62.4%, and 56.5%, respectively, for N-HCC and 63.4%, 48.0%, and 42.0%, respectively, for A-HCC. B. Overall survival curves. The mean OS was 94.5 months (95% CI 91.0–97.9) for N-HCC and 81.7 months (95% CI 78.0–85.3) for A-HCC (P < 0.001). The one-, three-, and five-year OS rates were 96.4%, 90.4%, and 84.8%, respectively, for N-HCC and 88.2%, 77.5%, and 72.6%, respectively, for A-HCC. DFS, disease-free survival; OS, overall survival; N-HCC, normal α-fetoprotein HCC; A-HCC, abnormalα-fetoprotein HCC.
Jcm 08 01736 g001
Figure 2. The scatter dot plots of GPC3, SPP1, IGF1, HGF, and VEGF. The serum levels of novel markers for N-HCC, A-HCC, and healthy subjects were determined by ELISA and represented as scatter dot plots. The arithmetic means of the tested parameters are indicated by a line. Student’s t test was employed for the statistical analysis and P < 0.05 was considered significant. GPC3, glypican 3; SPP1, secreted phosphoprotein 1; IGF1, insulin-like growth factor 1; HGF, hepatocyte growth factor; VEGF, vascular endothelial growth factor. N-HCC, normal α-fetoprotein HCC; A-HCC, abnormal α-fetoprotein HCC; ELISA, enzyme-linked immunosorbent assay.
Jcm 08 01736 g002
Figure 3. Performance of GPC3 and SPP1 ROC curves of GPC3 and SPP1 in differentiating N-HCC from healthy subjects. The area under the ROC curve of GPC3 and SPP1 for N-HCC was 0.788 (P = 0.004) and 0.625 (P = 0.213), respectively. GPC3, glypican 3; SPP1, secreted phosphoprotein 1; ROC, receiver operating characteristic.
Jcm 08 01736 g003
Figure 4. Immunohistochemical (IHC) microphotograph of primary HCC. The upper row (A, C, E) is IHC of N-HCC, while the lower row (B, D, F) is that of A-HCC. Most N-HCC and A-HCC (E and F) would express GPC3, while the expressions CDH17 were both low in N-HCC and A-HCC (C and D). CK19 was sparsely seen in N-HCC. About one-fourth of A-HCC tumors had CK19 expression (B); however, only 5% of N-HCC tumors expressed CK19 (A) (P = 0.003). (Magnifications, × 100). N-HCC, normal α-fetoprotein HCC; A-HCC, abnormalα-fetoprotein HCC; GPC3, glypican 3; CDH17, cadherin 17; CK19, cytokeratin 19.
Jcm 08 01736 g004
Figure 5. Kaplan–Meier disease-free survival (DFS) curves of N-HCC after hepatectomy Unlike HCC in general, CK19, CDH17, and GPC3 all were not significantly poor prognostic factors for DFS in N-HCC after hepatectomy (P all > 0.05). DFS, disease-free survival; N-HCC, normal α-fetoprotein HCC; GPC3, glypican 3; CDH17, cadherin 17; CK19, cytokeratin 19.
Jcm 08 01736 g005
Table 1. Clinical characteristics of normal alpha-fetoprotein hepatocellular carcinoma (N-HCC) a vs. abnormal alpha-fetoprotein hepatocellular carcinoma (A-HCC) b (n = 1616).
Variables cTotalN-HCC aA-HCC bP-Value d
No.(%)No.(%)No.(%)
Age > 65 year-old 577(35.7%)294(38.6%)283(33.1%)0.020
Male gender1256(77.7%)619(81.3%)637(74.5%)0.001
Comorbidity639(39.9%)339(45.0%)300(35.4%)<0.001
Diabetes348(21.7%)198(26.3%)150(17.7%)<0.001
Hypertension369(34.7%)185(35.7%)184(33.7%)0.490
ESRD e33(2.1%)23(3.1%)10(1.2%)0.008
HBV infection878(62.7%)378(56.2%)500(68.7%)<0.001
HCV infection471(36.0%)223(35.7%)248(36.3%)0.829
Non-B Non-C207(13.6%)134(18.6%)73(9.1%)<0.001
Cigarette smoking339(21.0%)169(22.2%)170(19.9%)0.252
Alcohol consumption201(12.4%)100(13.1%)101(11.8%)0.419
Pre-OP symptoms f361(22.3%)164(21.6%)197(23.0%)0.473
ICG-15 g (%)516(34.0%)238(33.5%)278(34.5%)0.664
Major procedure h444(28.3%)184(24.9%)260(31.3%)0.005
Blood loss >800 mL188(12.3%)75(10.4%)113(14.0%)0.032
OP duration >270 min672(43.1%)320(43.5%)352(42.7%)0.729
Major complication i153(9.9%)66(9.0%)87(10.7%)0.271
In-hospital mortality26(1.6%)9(1.2%)17(2.0%)0.202
6-month mortality87(5.4%)21(2.8%)66(7.7%)<0.001
MeanSEM jMeanSEM iMeanSEM iP-value
ICG-15 (%) g 9.5420.2319.1360.3099.8870.3420.103
Hemoglobin (g/dL) 13.4920.04813.4610.07013.5250.0680.515
Albumin (g/dL)4.1120.0124.1360.0184.0930.0160.083
Platelet (1000/uL)179.2681.826179.1992.569178.7792.6170.909
ALT (U/L)55.231.77553.923.14656.241.8880.517
Bilirubin total (mg/dL)0.7640.0130.7510.0220.7750.0140.341
Alkaline phosphatase (U/L)93.592.37894.764.60992.641.8940.661
α-fetoprotein (ng/mL) k14.40222.604.604.60227.201000.95<0.001
a Normal α-fetoprotein hepatocellular carcinoma; b Abnormal α-fetoprotein hepatocellular carcinoma c Only patients with available data were analyzed; d N-HCC vs. A-HCC; Pearson’s χ2 test was used to analyze the categorical variables, Student’s t test and Mann-Whitney U test were used to analyze continuous variables; e End-stage renal disease; f Include HCC presenting with anemia, jaundice, palpable mass, or ascites; g Indocyanine green retention test at 15 min; h Includes tri-segmentectomy, right/left lobectomy, and extended right/left lobectomy; i Includes grade III-IV surgical complications; j Standard error of mean; k Expressed as Median ± IQR.
Table 2. Pathologic characteristics of N-HCC a vs. A-HCC b (n = 1616).
Variables c TotalN-HCC aA-HCC bP-Value d
No.(%)No.(%)No.(%)
Tumor size (cm) >5505(32.3%)201(27.3%)304(36.7%)<0.001
Encapsulation Yes1282(82.2%)605(82.7%)677(81.9%)0.685
Capsular invasionYes965(62.0%)408(55.9%)557(67.4%)<0.001
RuptureYes120(7.7%)47(6.4%)73(8.8%)0.074
Vascular invasionYes527(33.8%)178(24.3%)349(42.3%)<0.001
Daughter noduleYes332(21.3%)109(14.9%)223(27.0%)<0.001
CirrhosisYes787(50.4%)338(46.2%)449(54.2%)0.002
NecrosisYes754(48.5%)331(45.4%)423(51.3%)0.021
Edmondson-Steiner grading systemGrade 1/2944(61.8%)527(74.3%)417(50.9%)<0.001
Grade 3/4584(38.2%)182(25.7%)402(49.1%)
T stageT1852(58.1%)456(66.4%)396(50.8%)<0.001
T2345(23.5%)152(22.1%)193(24.7%)
T3a133(9.1%)38(5.5%)95(12.2%)
T3b50(3.4%)6(0.9%)44(5.6%)
T487(5.9%)35(5.1%)52(6.7%)
N stageN112(0.8%)4(0.6%)8(1.0%)0.343
a Normal α-fetoprotein hepatocellular carcinoma b Abnormal α-fetoprotein hepatocellular carcinoma c Only patients with available data were analyzed d N-HCC vs. A-HCC; Pearson’s χ2 test was used to analyze the categorical variables.
Table 3. Univariate and cox regression multivariate analyses of factors associated with disease-free survival (DFS) a in N-HCC b after hepatectomy.
Variables cUnivariateMultivariate
Median DFS a ± SE (months)P-ValueHazard Ratio (95% CI)P-Value
Age (>65 vs. ≤65 (year-old))39.4 ± 4.6 vs. 49.2 ± 8.60.131
Gender (male vs. female)41.9 ± 5.8 vs. 70.6 ± 15.70.115
Diabetes mellitus (yes vs. no)45.6 ± 12.0 vs. 44.6 ± 6.30.428
Hypertension (yes vs. no)41.7 ± 11.5 vs. 41.6 ± 5.00.523
ESRD d (yes vs. no)76.0 ± 29.0 vs. 44.6 ± 5.40.873
HBV surface antigen (positive vs. negative)47.9 ± 7.4 vs. 41.0 ± 7.10.310
Hepatitis C virus (positive vs. negative)32.9 ± 5.2 vs. 46.2 ± 8.00.182
Cigarette smoking (yes vs. no)37.6 ± 5.6 vs. 47.0 ± 7.00.197
Alcohol consumption (yes vs. no)41.9 ± 11.8 vs. 45.6 ± 6.30.526
Pre-OP symptoms e (yes vs. no)31.8 ± 5.4 vs. 60.0 ± 7.50.0041.278 (0.986–1.657)0.064
ICG-15 f (>10 vs. ≤10 (%))32.7 ± 4.8 vs. 57.2 ± 7.80.0021.520 (1.204–1.919)<0.001
Procedure type (Major g vs. Minor)28.2 ± 7.0 vs. 61.4 ± 8.0<0.0011.017 (0.751–1.377)0.913
Blood loss (>800 vs. ≤800 (mL))30.7 ± 11.0 vs. 47.0 ± 6.30.0341.095 (0.750–1.597)0.639
OP duration (>270 vs. ≤270 (mins))36.7 ± 4.2 vs. 70.6 ± 9.1<0.0011.238 (0.964–1.591)0.094
Complication (Major h vs. Minor/none)27.7 ± 10.7 vs. 46.2± 6.20.0441.031 (0.699–1.520)0.879
Albumin (≤3.5 vs. >3.5 (g/dL))40.1 ± 5.6 vs. 47.0 ± 6.30.175
Tumor size (>5 vs. ≤5 (cm))26.9 ± 4.6 vs. 67.9 ± 8.7<0.0011.823 (1.366–2.433)<0.001
Capsule (yes vs. no)47.0 ± 6.2 vs. 32.9 ± 5.90.147
Capsular invasion (yes vs. no)41.9 ± 7.7 vs. 49.2 ± 9.20.264
Rupture (yea vs. no)32.0 ± 11.9 vs. 47.9 ± 6.70.0101.098 (0.709–1.701)0.676
Vascular invasion (yes vs. no)22.0 ± 4.2 vs. 63.5 ± 8.9<0.0011.460 (1.116–1.910)0.006
Daughter nodule (yes vs. no)22.2 ± 2.6 vs. 61.4 ± 7.5<0.0011.565 (1.182–2.072)0.002
Cirrhosis (yes vs. no)40.1 ± 3.8 vs. 62.3 ± 9.60.0401.272 (1.008–1.605)0.043
Necrosis (yes vs. no)40.6 ± 3.8 vs. 63.5 ± 8.80.061
Edmondson–Steiner grading system(grade 3/4 vs. grade 1/2)37.4 ± 7.6 vs. 47.0 ± 6.20.101
a Disease-free survival b Normal α-fetoprotein hepatocellular carcinoma c Only patients with available data were analyzed d End-stage renal disease e Include HCC presenting with anemia, jaundice, palpable mass, or ascites f Indocyanine green retention test at 15 min g Includes tri-segmentectomy, right/left lobectomy, and extended right/left lobectomy h Includes grade III-IV surgical complications.
Table 4. Univariate and cox regression multivariate analyses of factors associated with OS a in N-HCC b after hepatectomy.
Variables cUnivariateMultivariate
Mean OS a ± SE (Months)P-ValueHazard Ratio (95% CI)P-Value
Age (>65 vs. ≤65 (year-old))90.7 ± 3.2 vs. 96.6 ± 2.10.084
Gender (male vs. female)92.7 ± 2.0 vs. 102.8 ± 3.70.0371.153 (0.838–1.586)0.382
Diabetes mellitus (yes vs. no)88.0 ± 3.8 vs. 96.4 ± 2.00.223
Hypertension (yes vs. no)98.8 ± 3.8 vs. 94.1 ± 2.90.841
ESRD d (yes vs. no)70.8 ± 4.2 vs. 95.1 ± 1.80.984
HBV surface antigen (positive vs. negative)94.1 ± 2.4 vs. 98.2 ± 2.90.501
Hepatitis C virus (positive vs. negative)96.9 ± 3.4 vs. 91.7 ± 2.50.189
Cigarette smoking (yes vs. no)88.8 ± 4.3 vs. 96.2 ± 1.90.0321.075 (0.819–1.411)0.604
Alcohol consumption (yes vs. no)95.2 ± 4.6 vs. 94.6 ± 1.90.986
Pre-OP symptoms e (yes vs. no)91.8 ± 3.8 vs. 95.4 ± 2.00.129
ICG-15 f (>10 vs. ≤10 (%))89.6 ± 3.5 vs. 95.4 ± 2.10.120
Procedure type (Major g vs. Minor)80.1 ± 3.6 vs. 98.7 ± 1.9<0.0011.023 (0.760–1.376)0.881
Blood loss (>800 vs. ≤800 (mL))71.4 ± 6.0 vs. 97.0 ± 1.8<0.0011.131 (0.779–1.643)0.516
Complication (Major h vs. Minor/none)66.3 ± 5.6 vs. 97.2 ± 1.8<0.0011.118 (0.762–1.639)0.569
Albumin (≤3.5 vs. >3.5 (g/dL))79.6 ± 5.2 vs. 95.3 ± 1.90.064
Tumor size (>5 vs. ≤5 (cm))82.4 ± 3.7 vs. 99.1 ± 1.9<0.0011.839 (1.375–2.461)<0.001
Capsule (yes vs. no)94.8 ± 1.9 vs. 93.9 ± 4.40.709
Capsular invasion (yes vs. no)92.9 ± 2.4 vs. 96.2 ± 2.70.287
Rupture (yea vs. no)85.7 ± 5.9 vs. 94.9 ± 1.80.585
Vascular invasion (yes vs. no)78.8 ± 4.2 vs. 99.5 ± 1.9<0.0011.549 (1.190–2.015)0.001
Daughter nodule (yes vs. no)75.9 ± 4.7 vs. 98.0 ± 1.9<0.0011.786 (1.359–2.348)<0.001
Cirrhosis (yes vs. no)90.3 ± 2.7 vs. 98.1 ± 2.30.0461.438 (1.145–1.805)0.002
Necrosis (yes vs. no)90.9 ± 2.6 vs. 97.9 ± 2.40.0491.132 (0.889–1.442)0.315
Edmondson–Steiner grading system (grade 3/4 vs. grade 1/2)90.1 ± 3.7 vs. 96.0 ± 2.00.068
a Overall survival b Normal α-fetoprotein hepatocellular carcinoma c Only patients with available data were analyzed d End-stage renal disease e Include HCC presenting with anemia, jaundice, palpable mass, or ascites f Indocyanine green retention test at 15 min g Includes tri-segmentectomy, right/left lobectomy, and extended right/left lobectomy h Includes grade III-IV surgical complications.
Table 5. Serum concentrations of various markers in patients with HCC (n = 147).
VariablesN-HCC a vs. A-HCC bN-HCC a vs. Healthy SubjectA-HCC b vs. Healthy Subject
Mean ± SEMP-Value hMean ± SEMP-Value hMean ± SEMP-Value h
GPC3 c (ng/mL)5.1± 1.2 vs.
3.4 ± 0.9
0.2655.1± 1.2 vs.
< 0.01
<0.0013.4± 0.9 vs.
< 0.01
0.001
SPP1 d (ng/mL)52.2 ± 8.3 vs.
58.2 ± 6.5
0.57052.2 ± 8.3 vs.
13.0 ± 1.6
<0.00158.2 ± 6.5 vs.
13.0 ± 1.6
<0.001
IGF-1 e (ng/mL)104 ± 11 vs.
92 ± 8
0.380104 ± 11 vs.
195 ± 18
0.00191.7± 7.8 vs.
195 ± 18
<0.001
HGF f (pg/mL)952 ± 123 vs.
1043 ± 120
0.596952 ± 123 vs.
909 ± 38
0.7411043 ± 120 vs.
909 ± 38
0.292
VEGF g (pg/mL)137 ± 12 vs.
145 ± 13
0.623137 ± 12 vs.
179 ± 16
0.164145 ± 12 vs.
179 ± 16
0.300
a Normal α-fetoprotein hepatocellular carcinoma b Abnormal α-fetoprotein hepatocellular carcinoma c Glypican-3 d secreted phosphoprotein 1 (SPP1), also known as osteopontin (OPN) e Insulin-like growth factor 1 f Hepatocyte growth factor g Vascular endothelial growth factor h Student’s t test.

