High-Frequency Ultrasound for Assessment of Peri-Implant Bone Thickness


Abstract
:1. Introduction
2. Materials and Methods
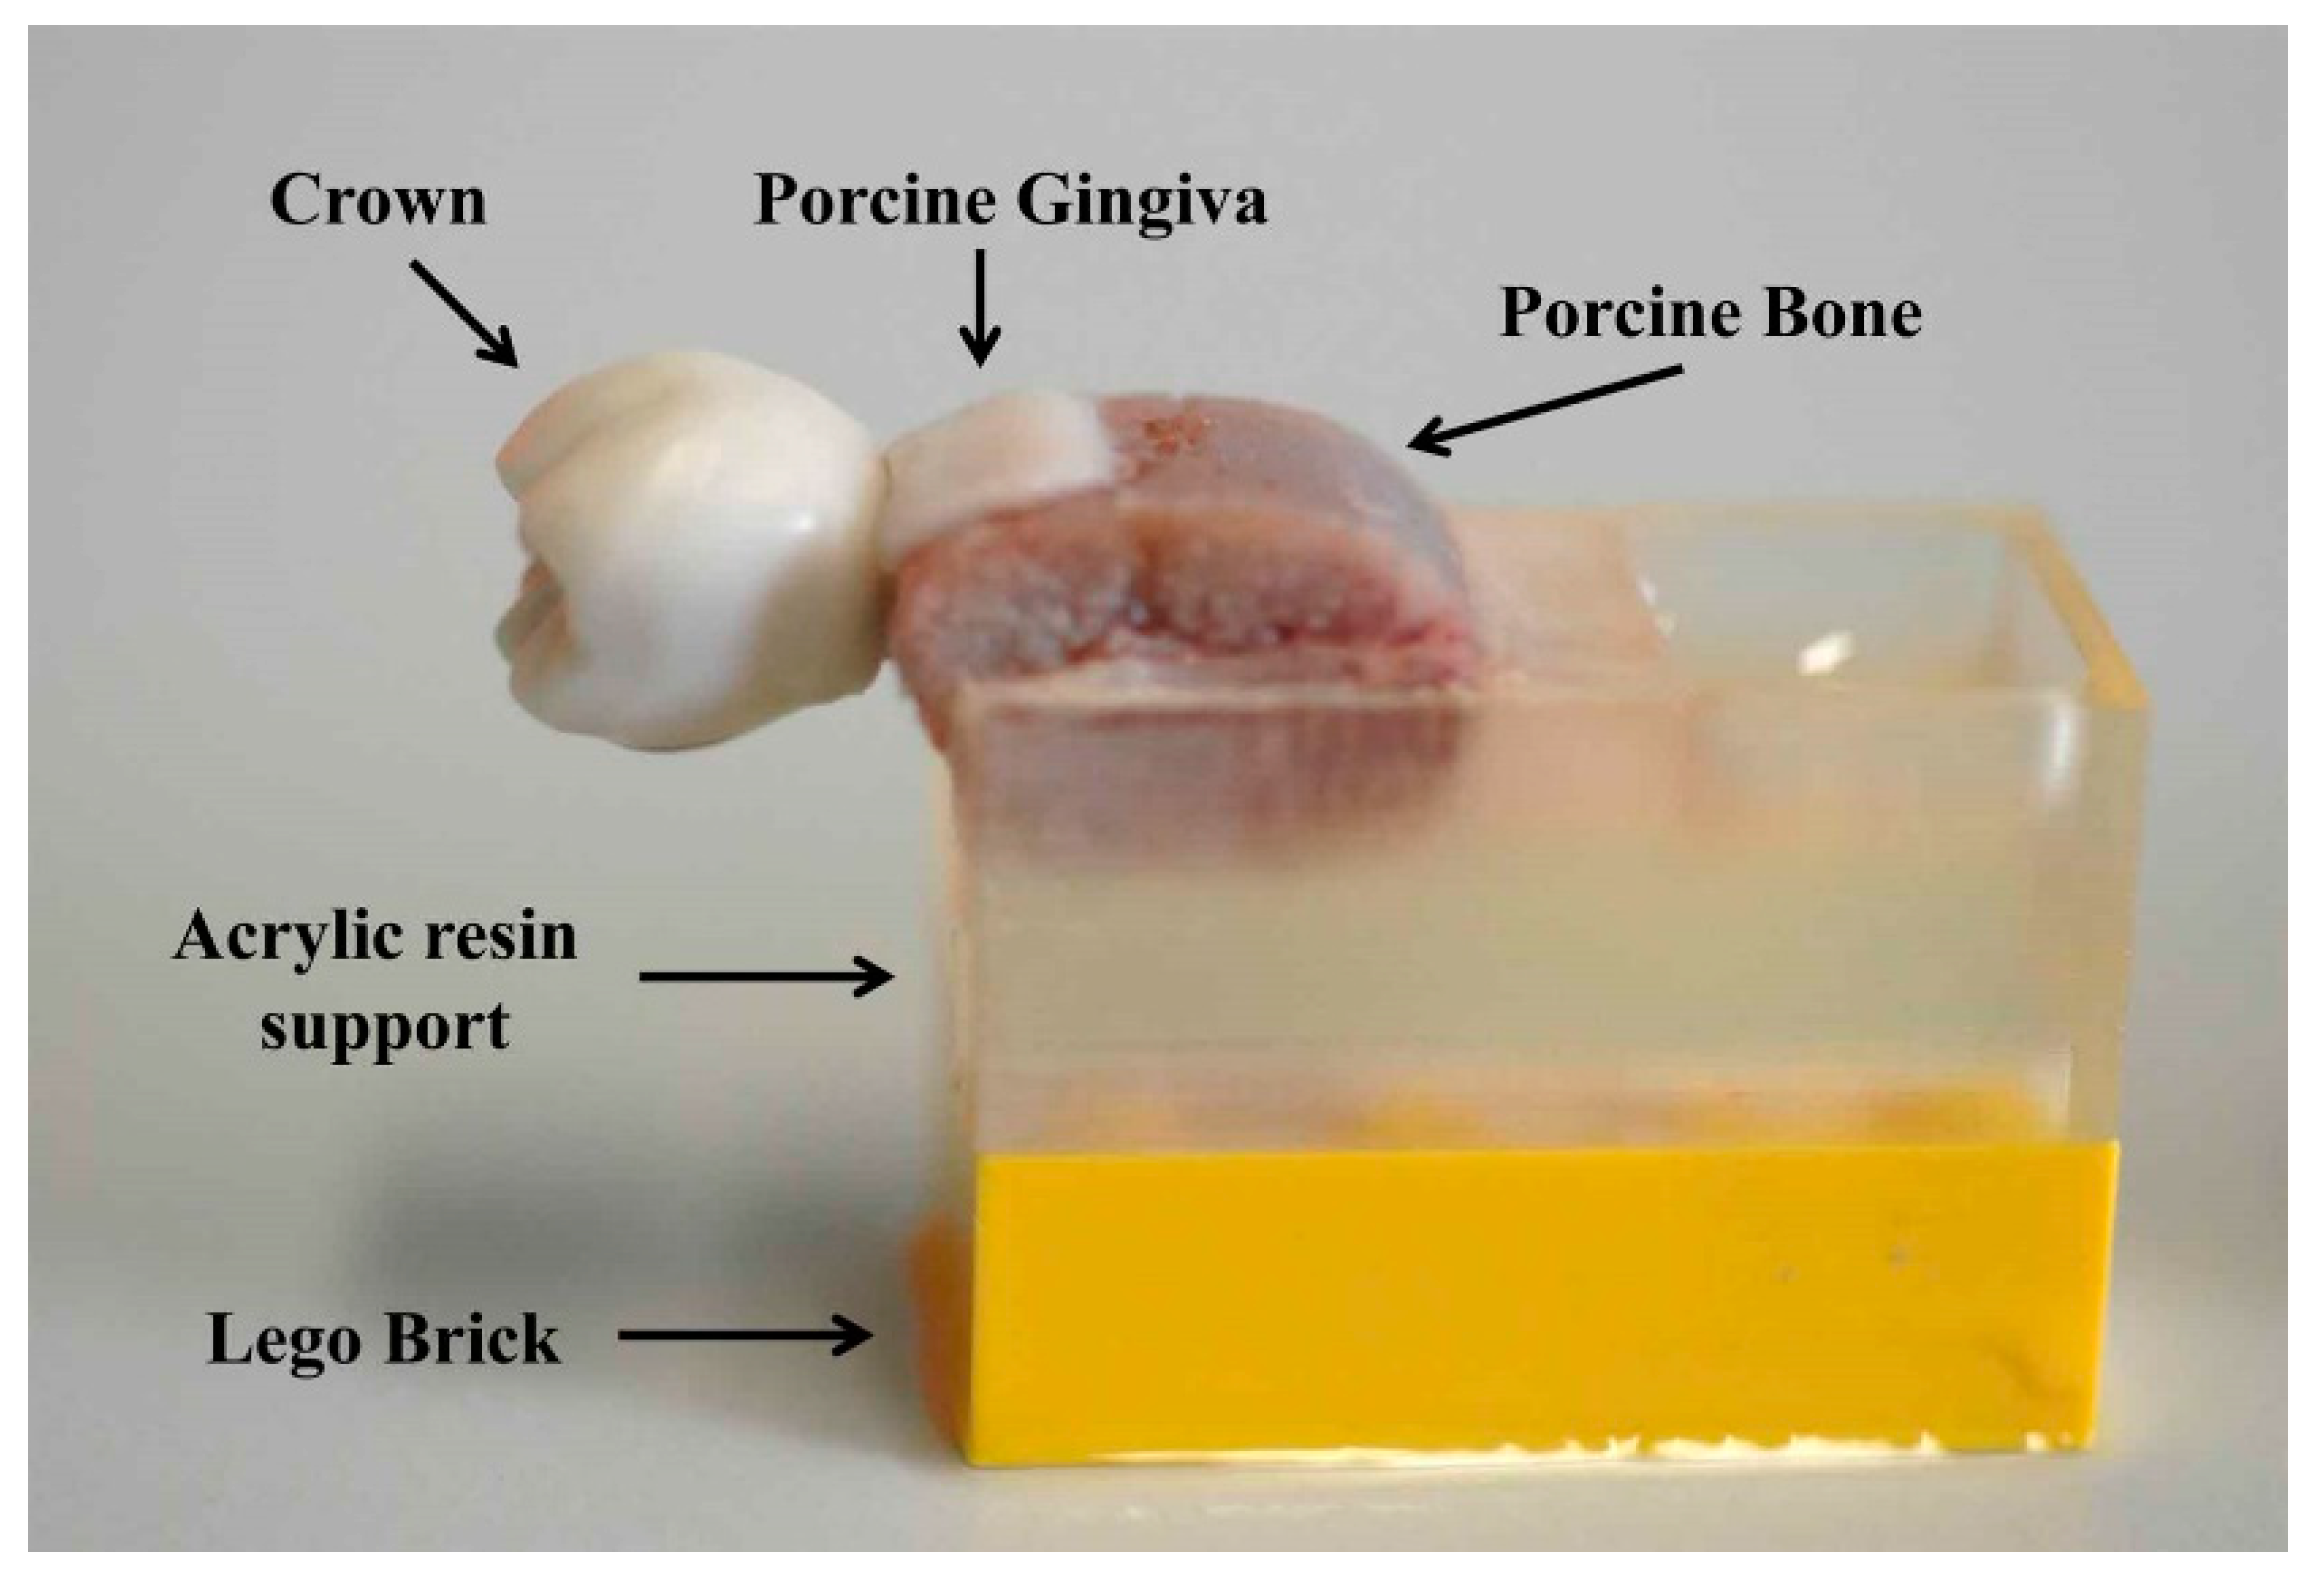
2.1. Sample Acquisition
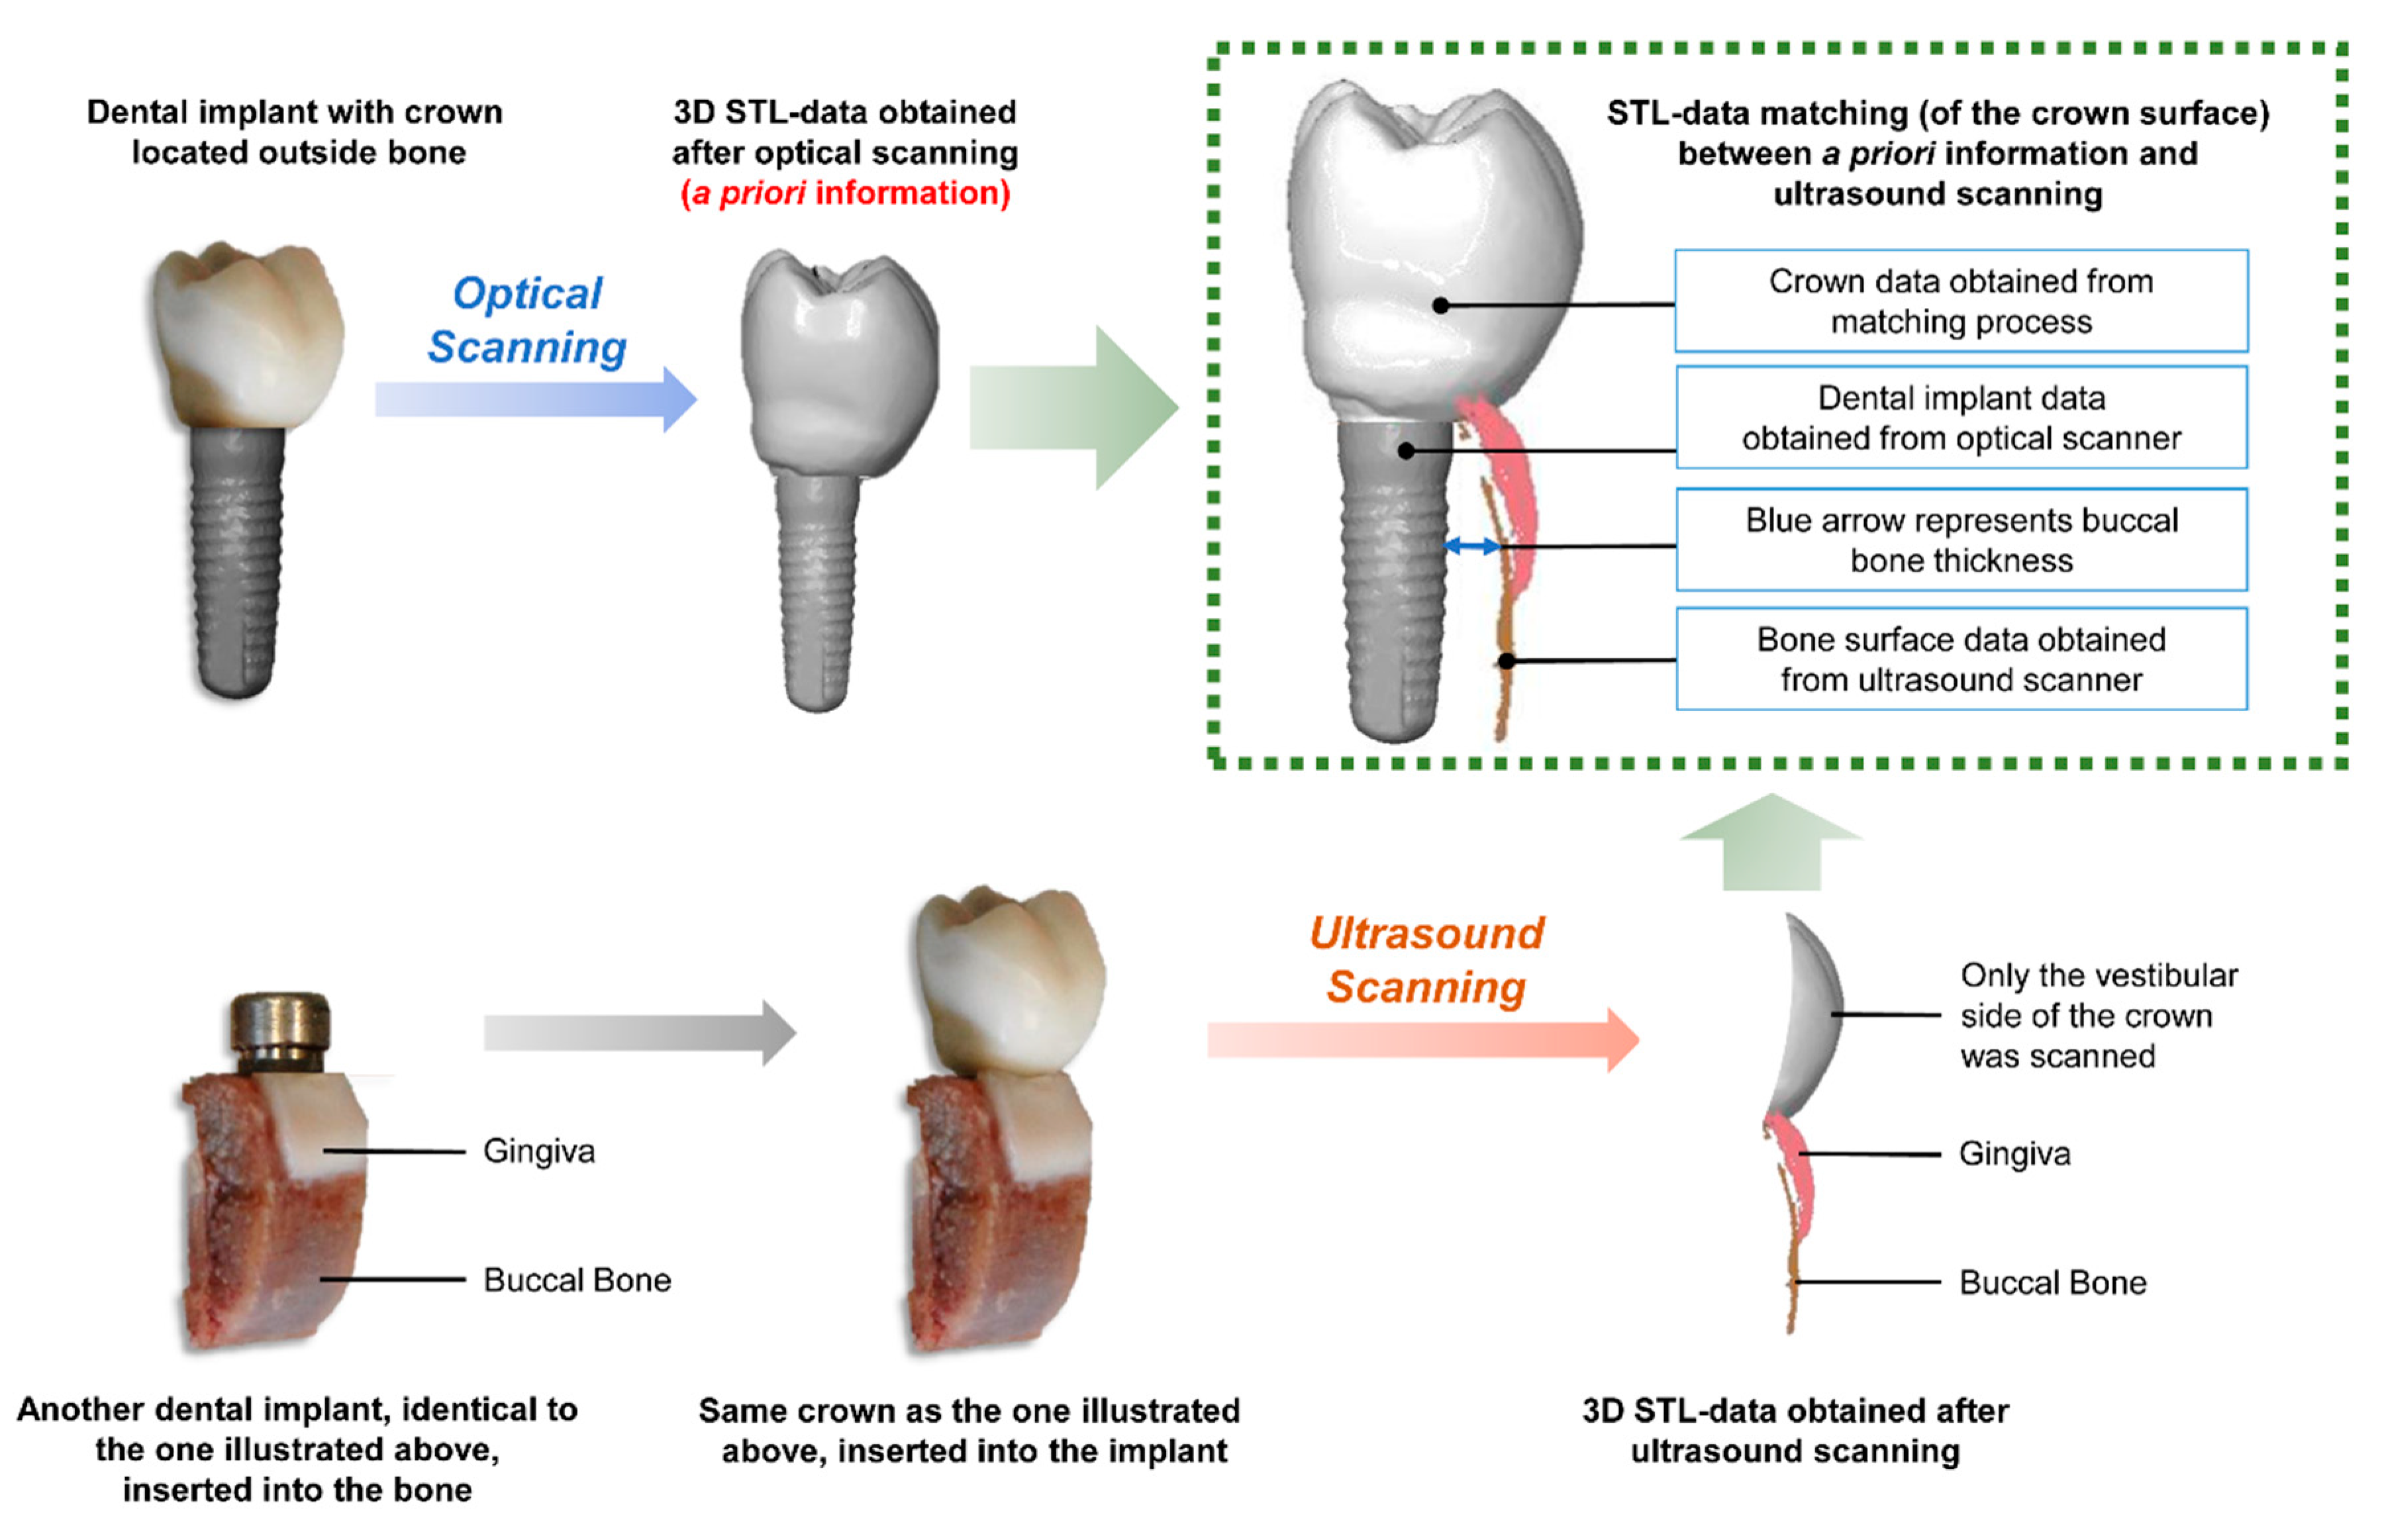
2.2. A Priori Information Acquisition
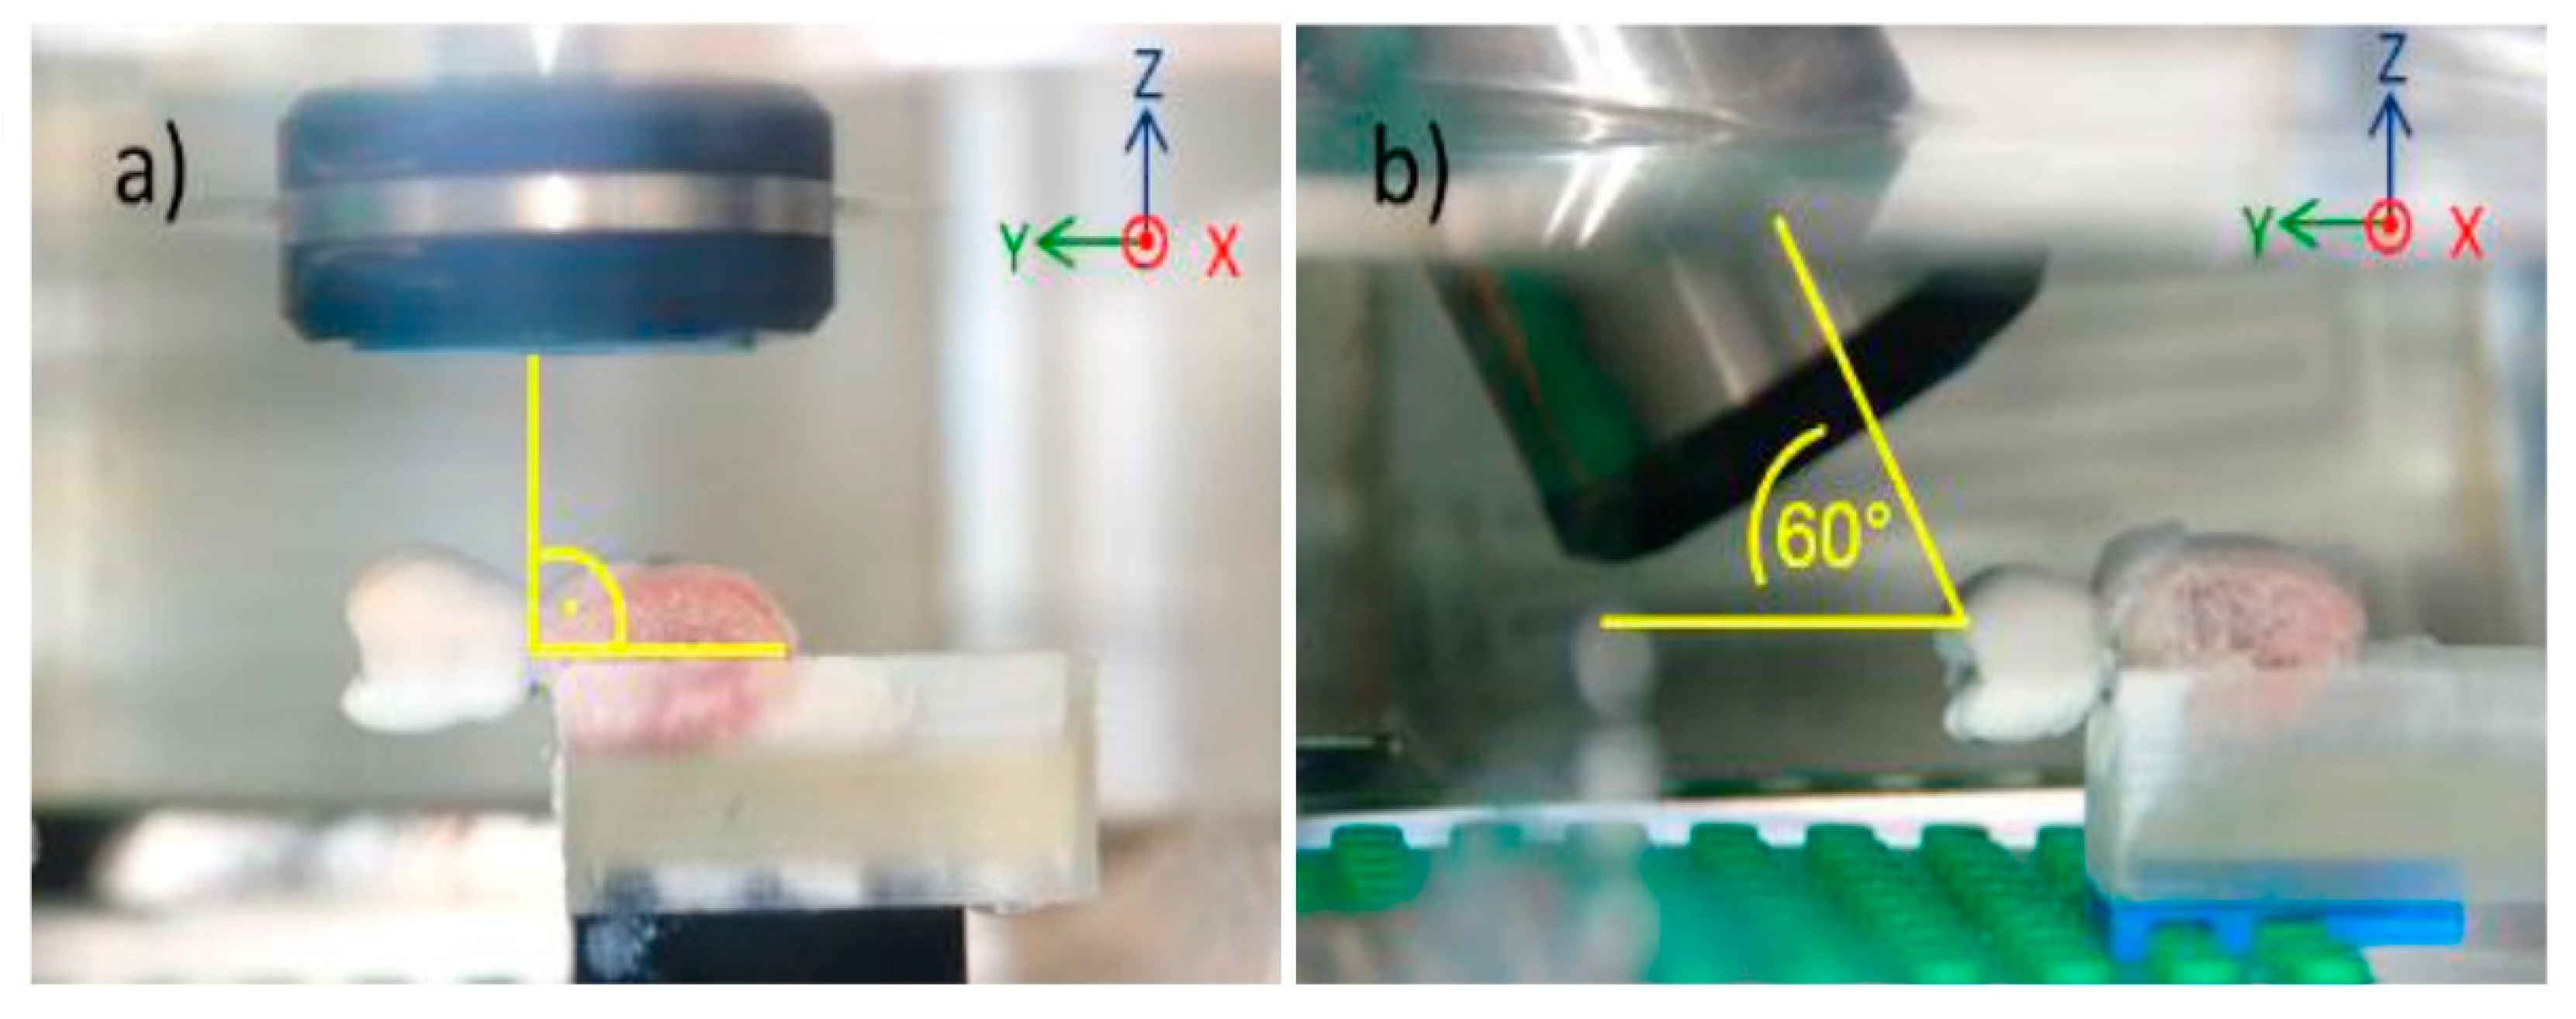
2.3. Ultrasound
2.4. CBCT
2.5. Optical Scanning
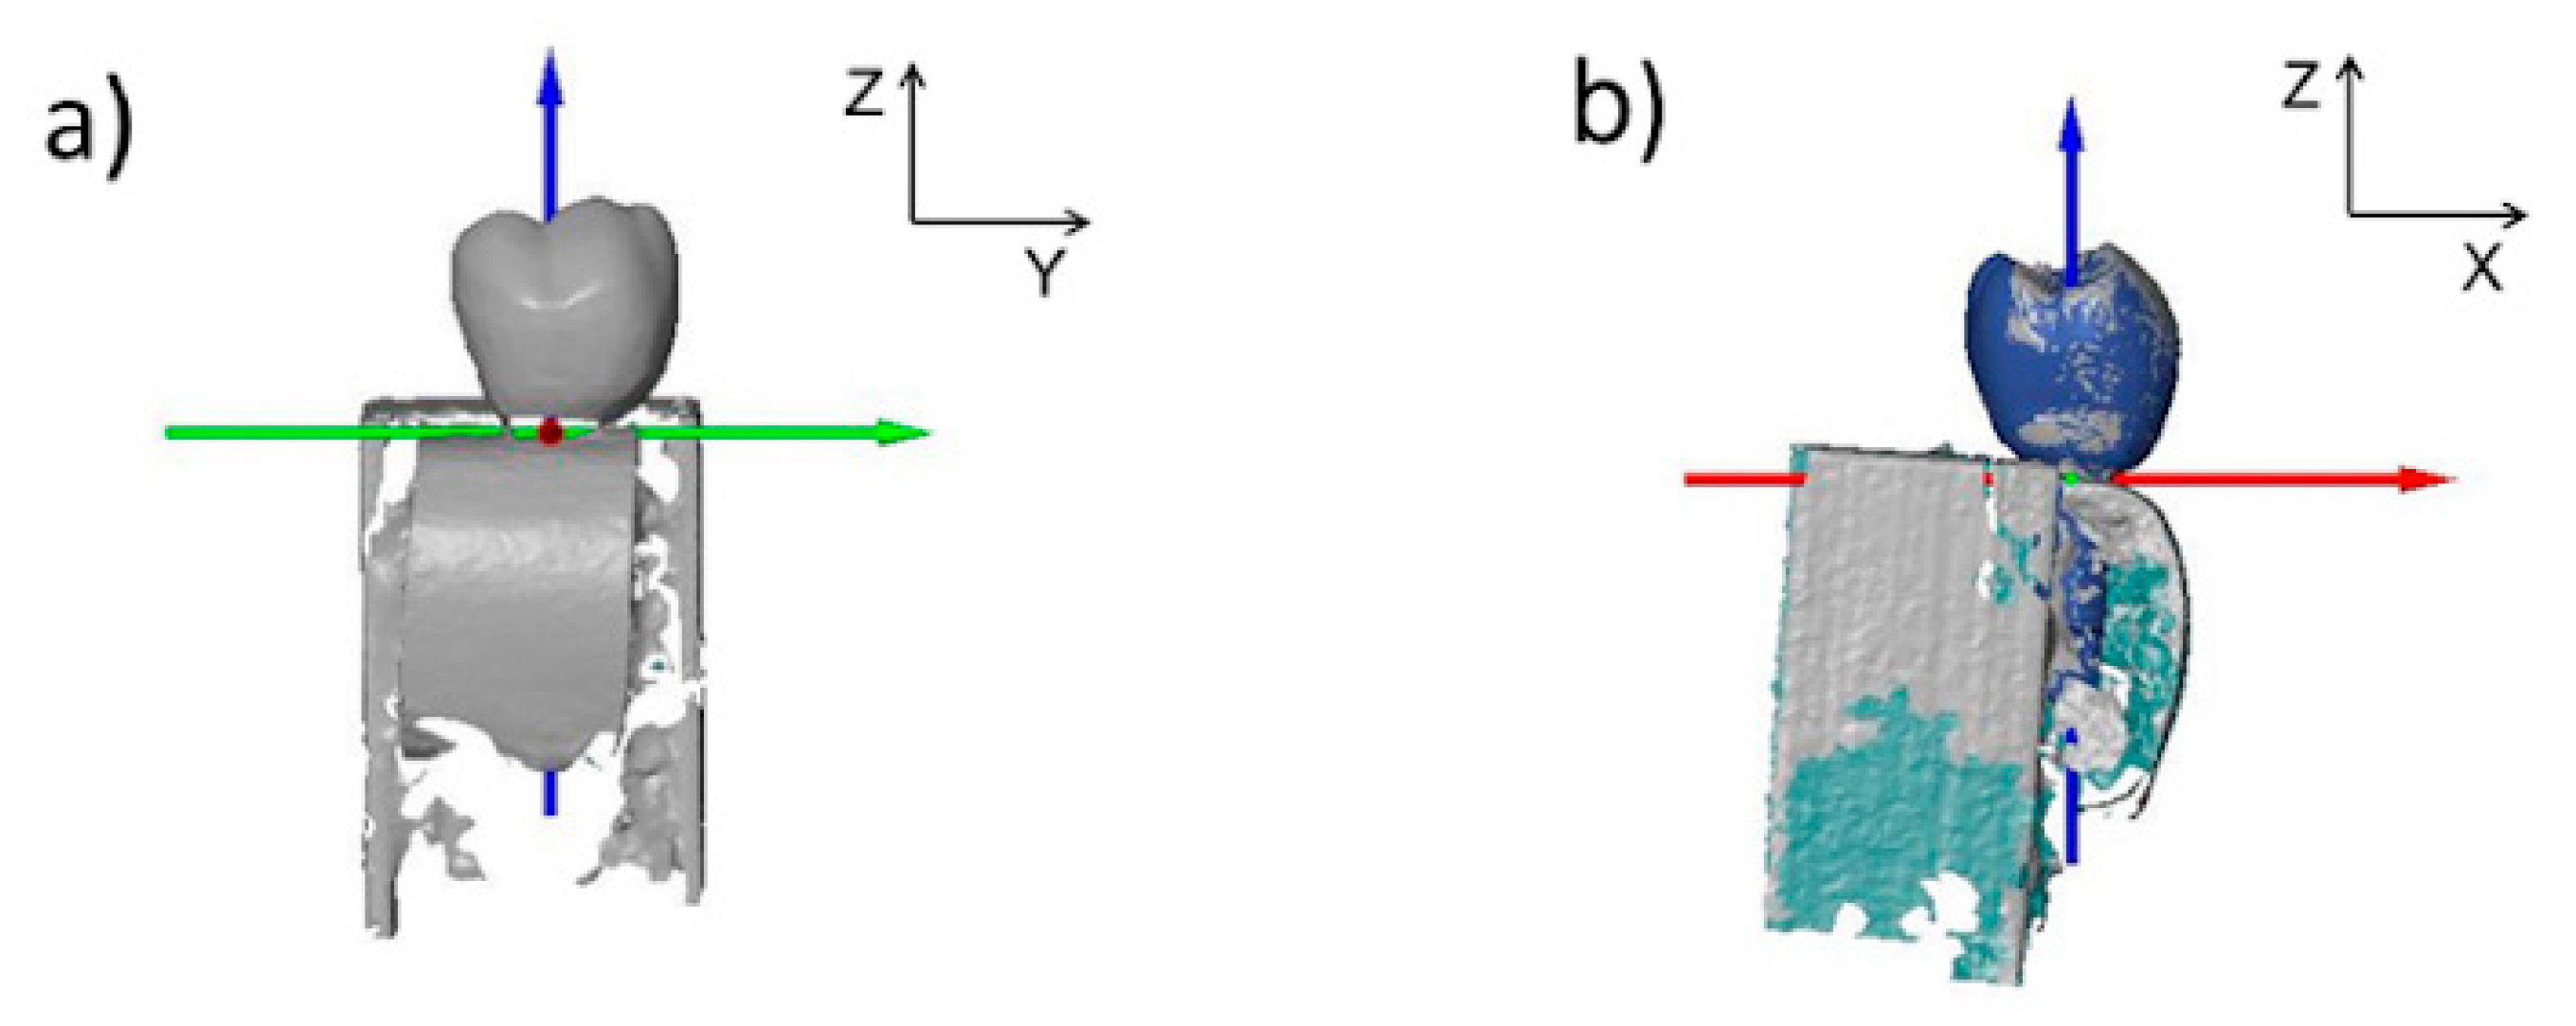
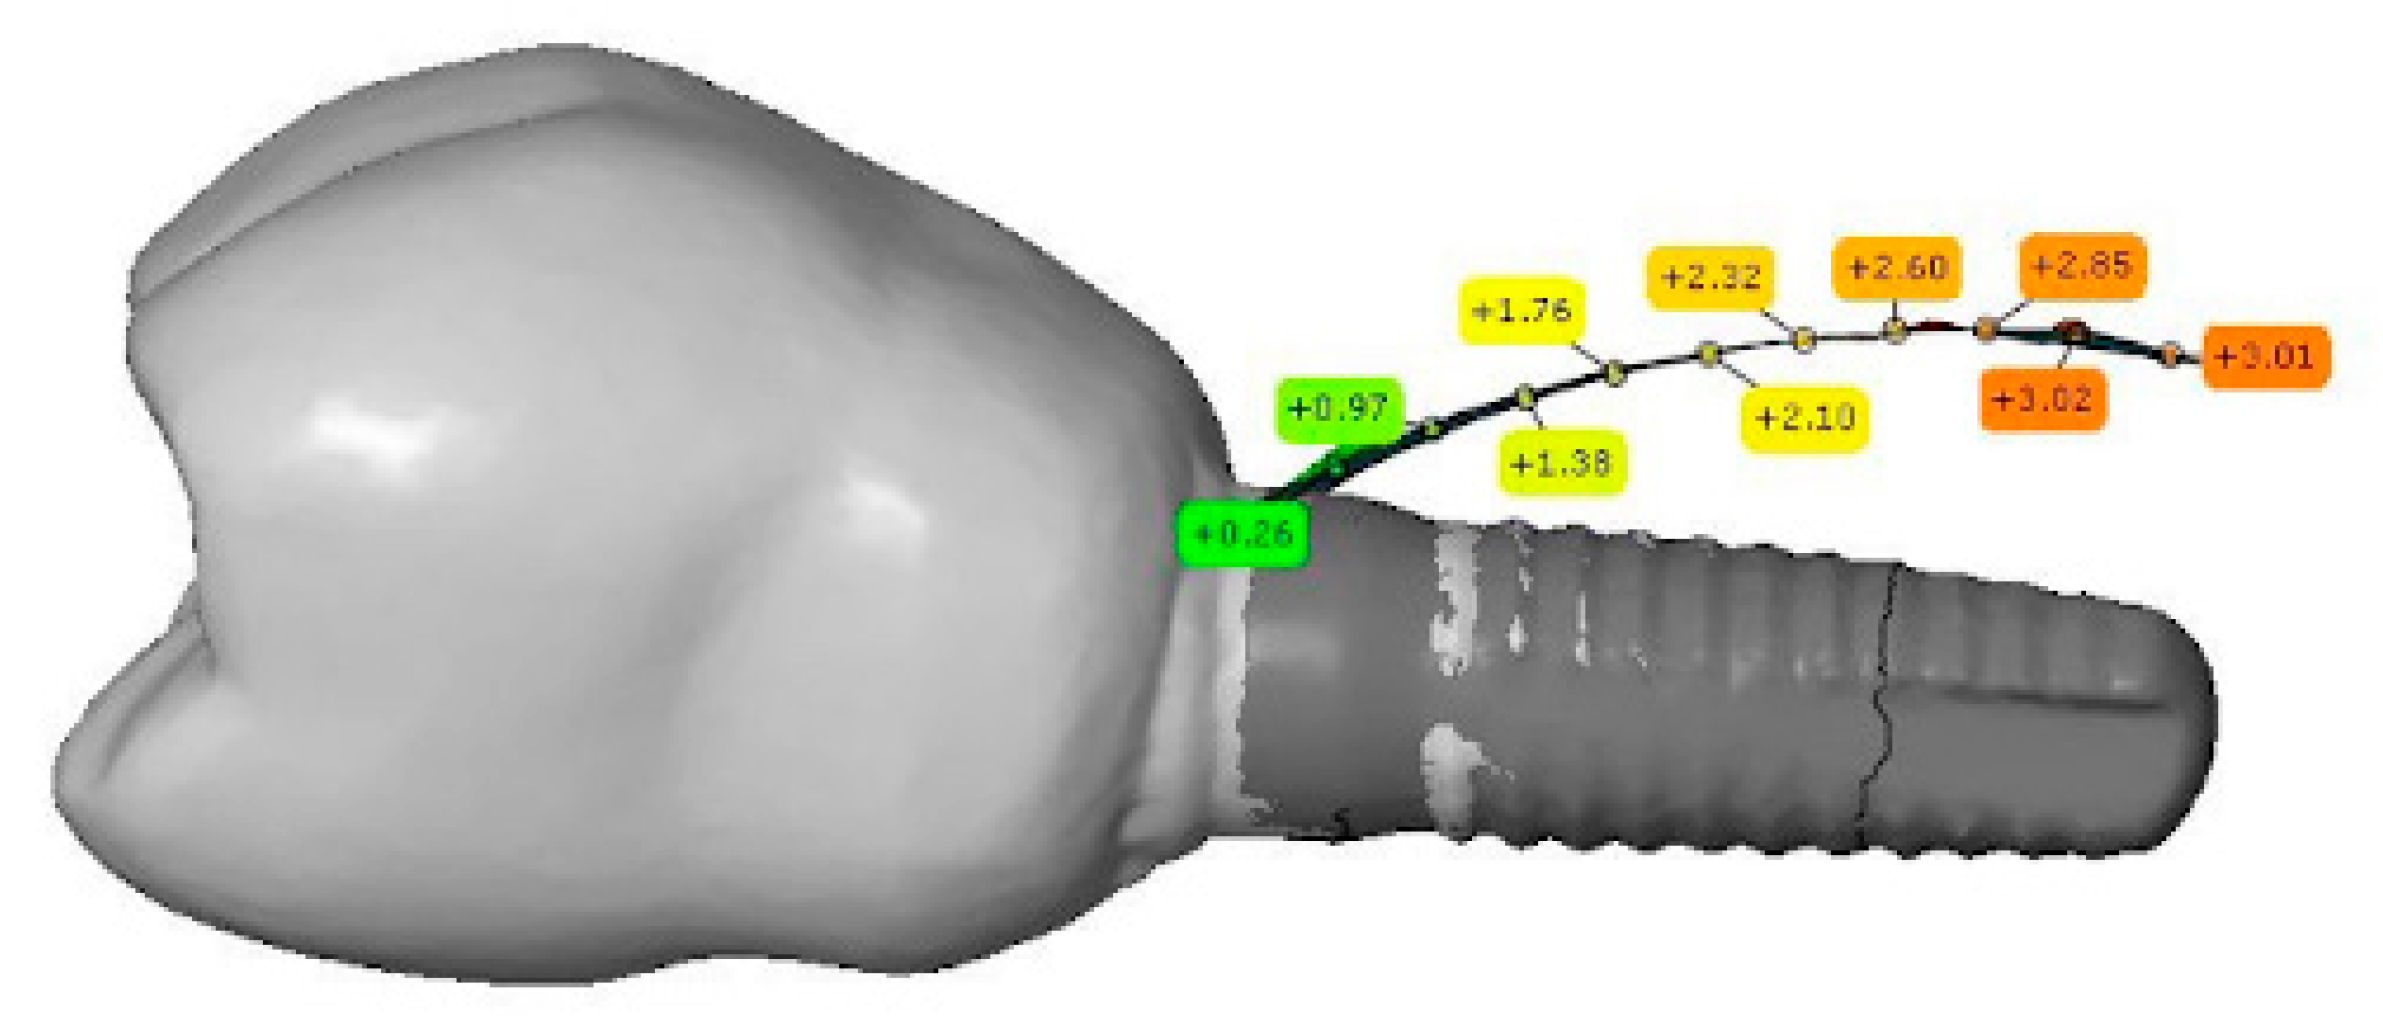
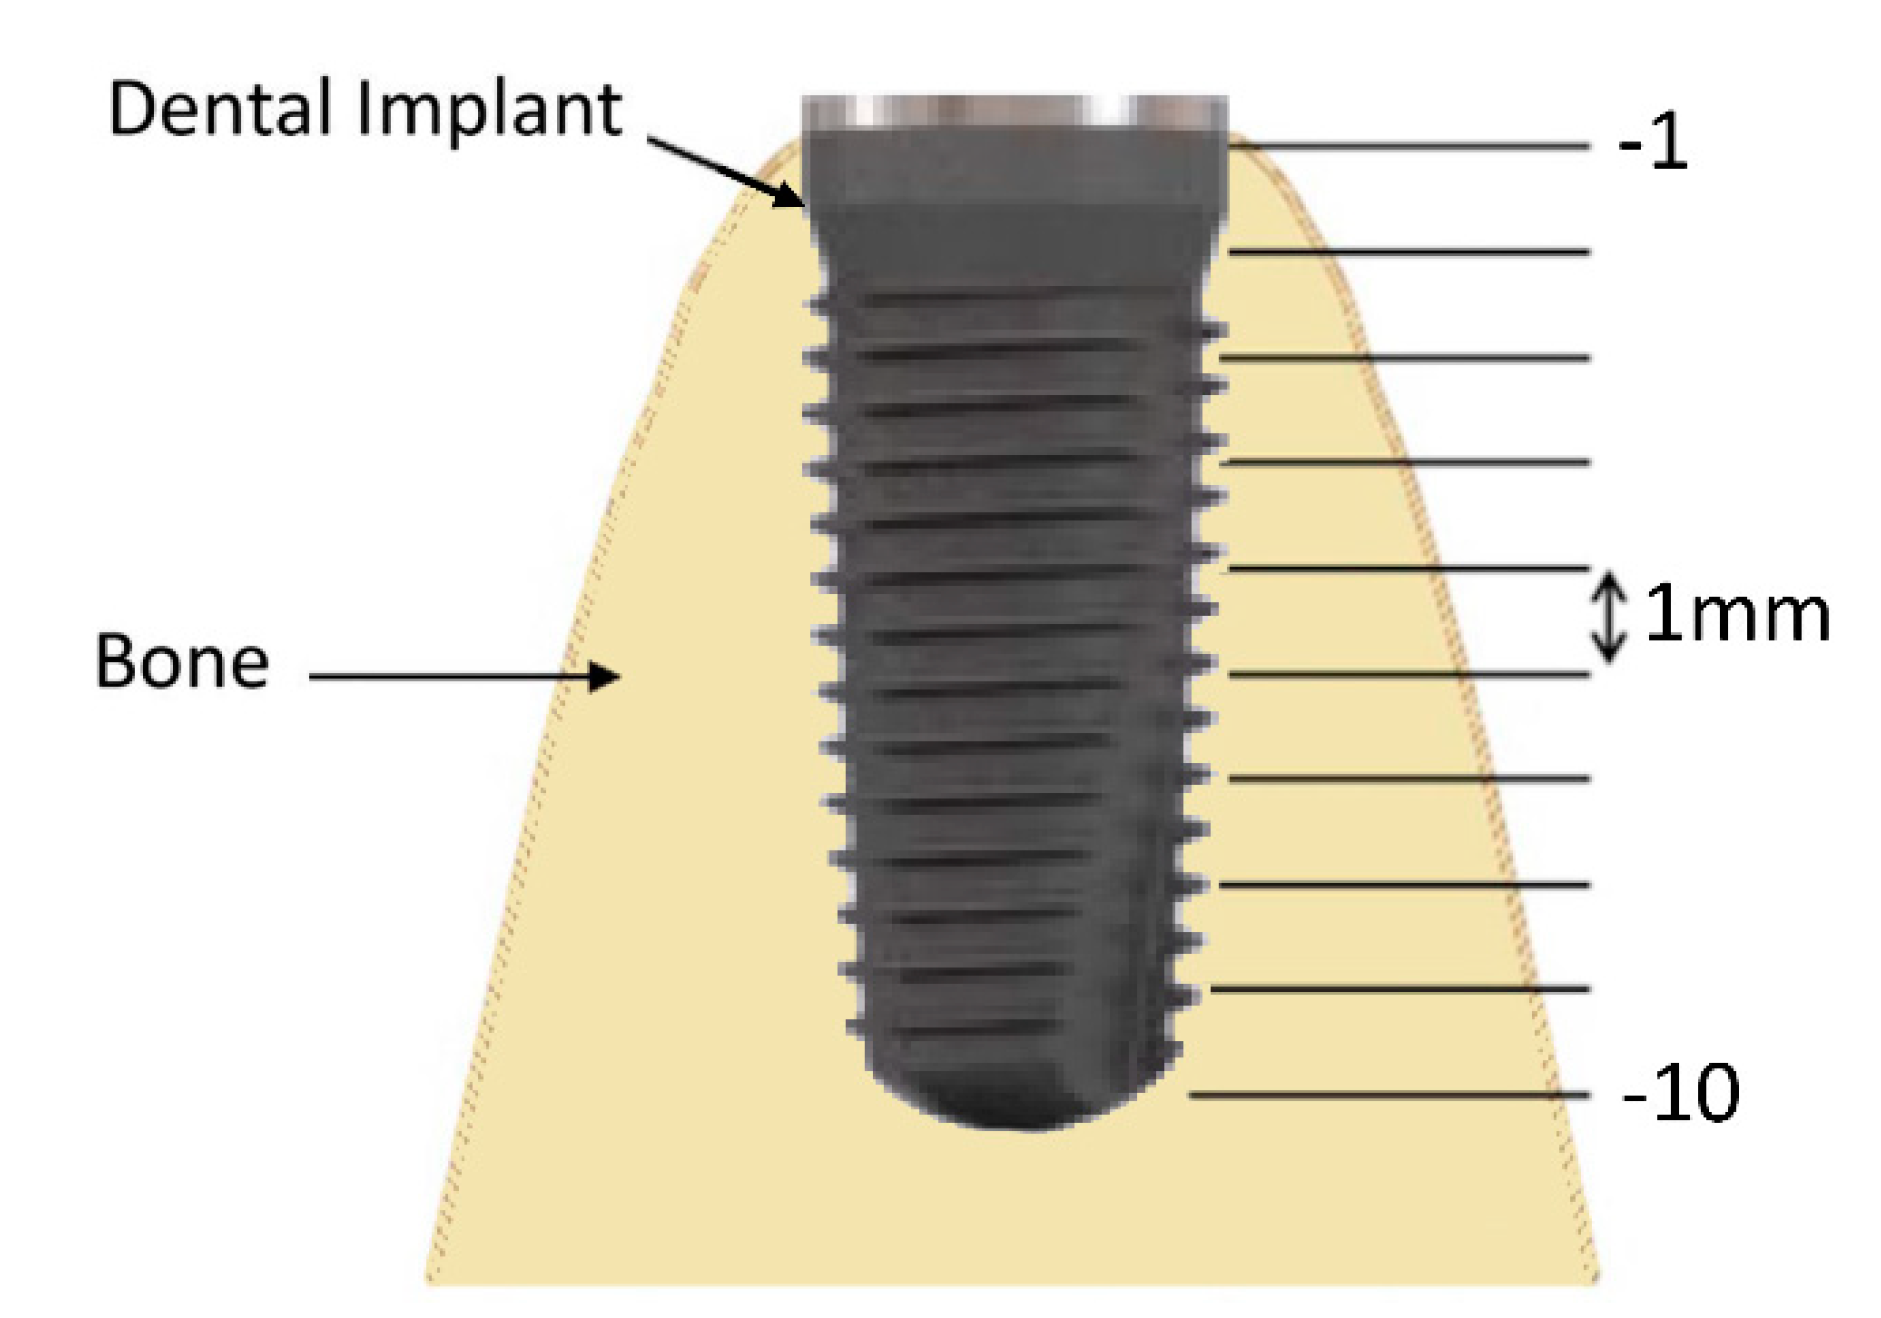
2.6. Bone Thickness Measurement
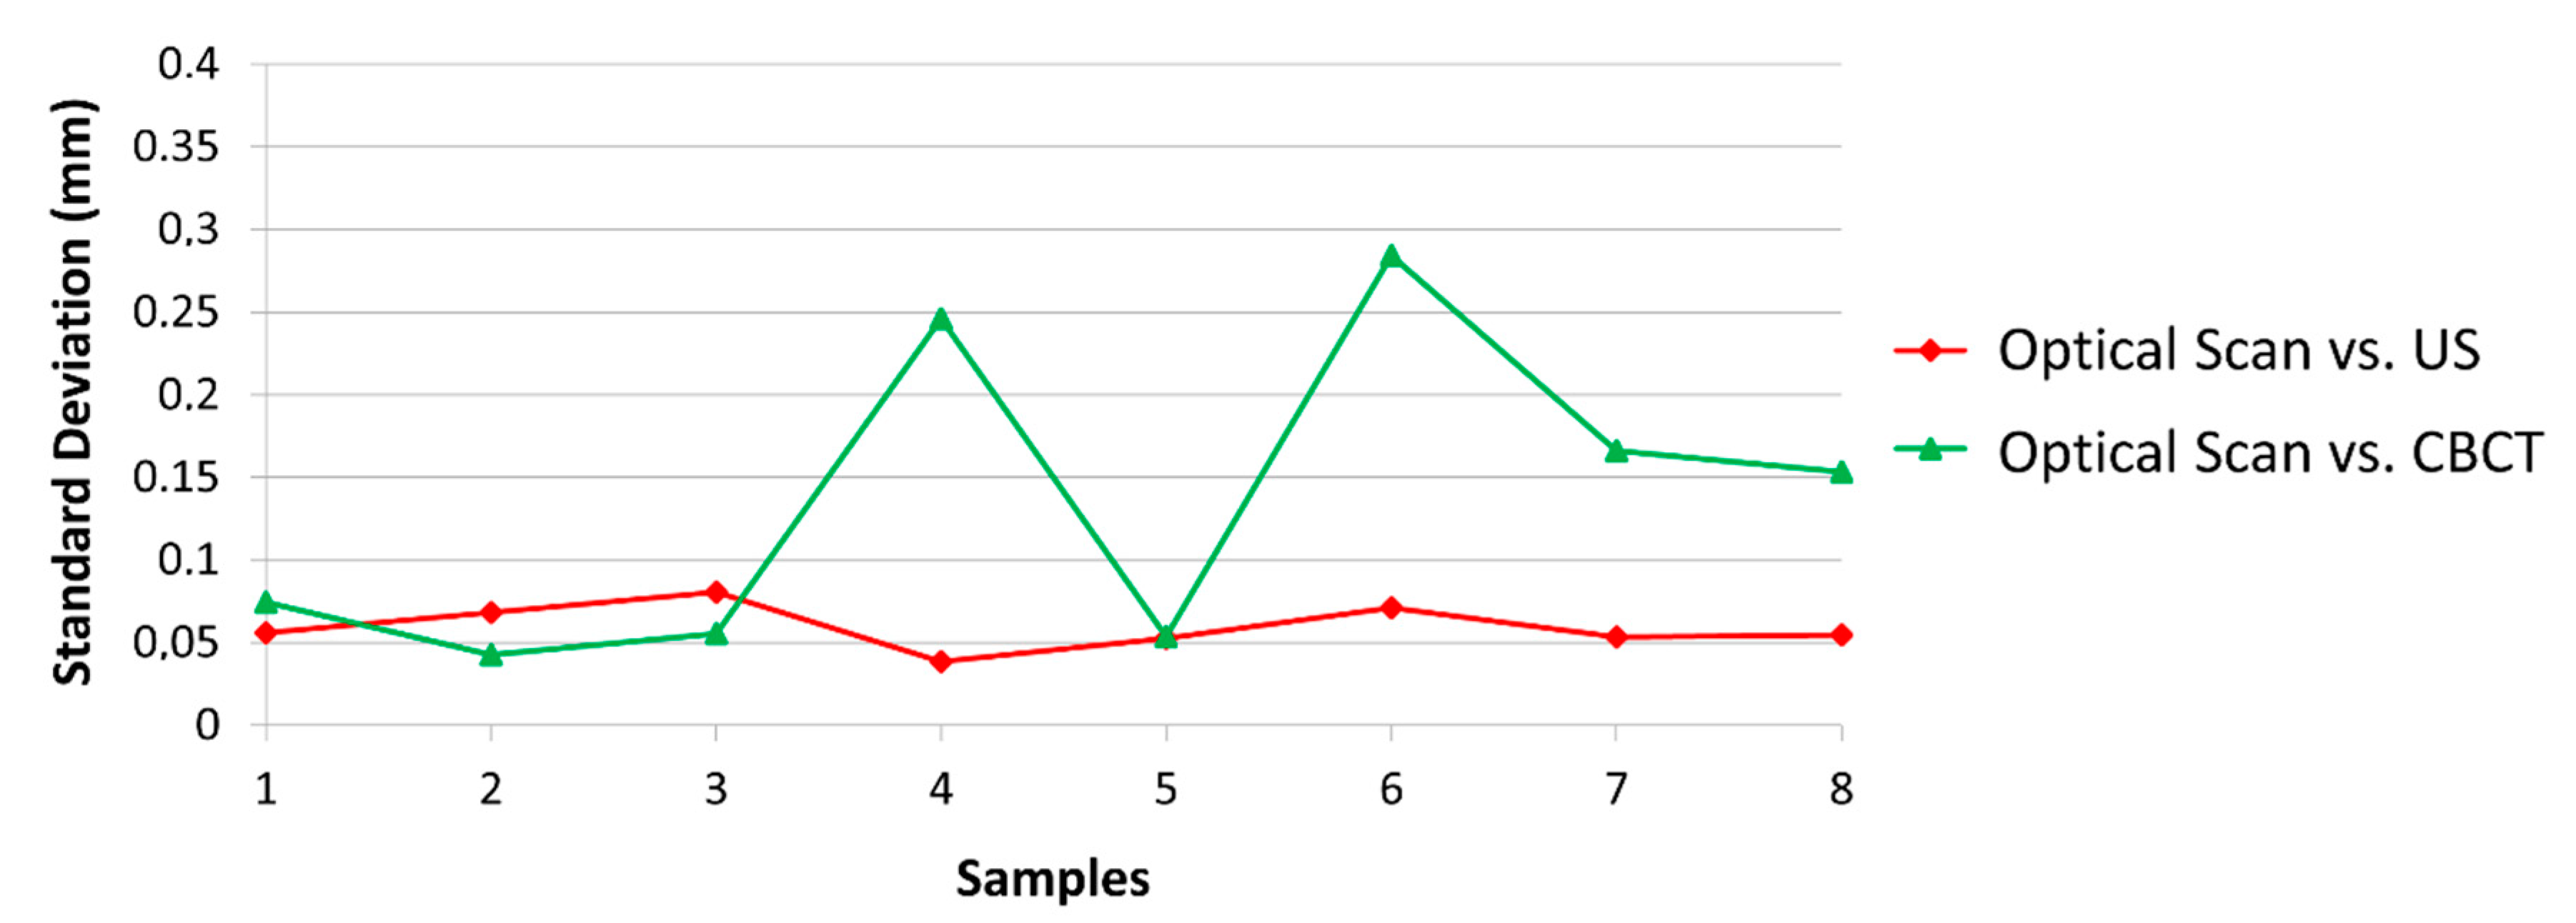
2.7. Data Analysis
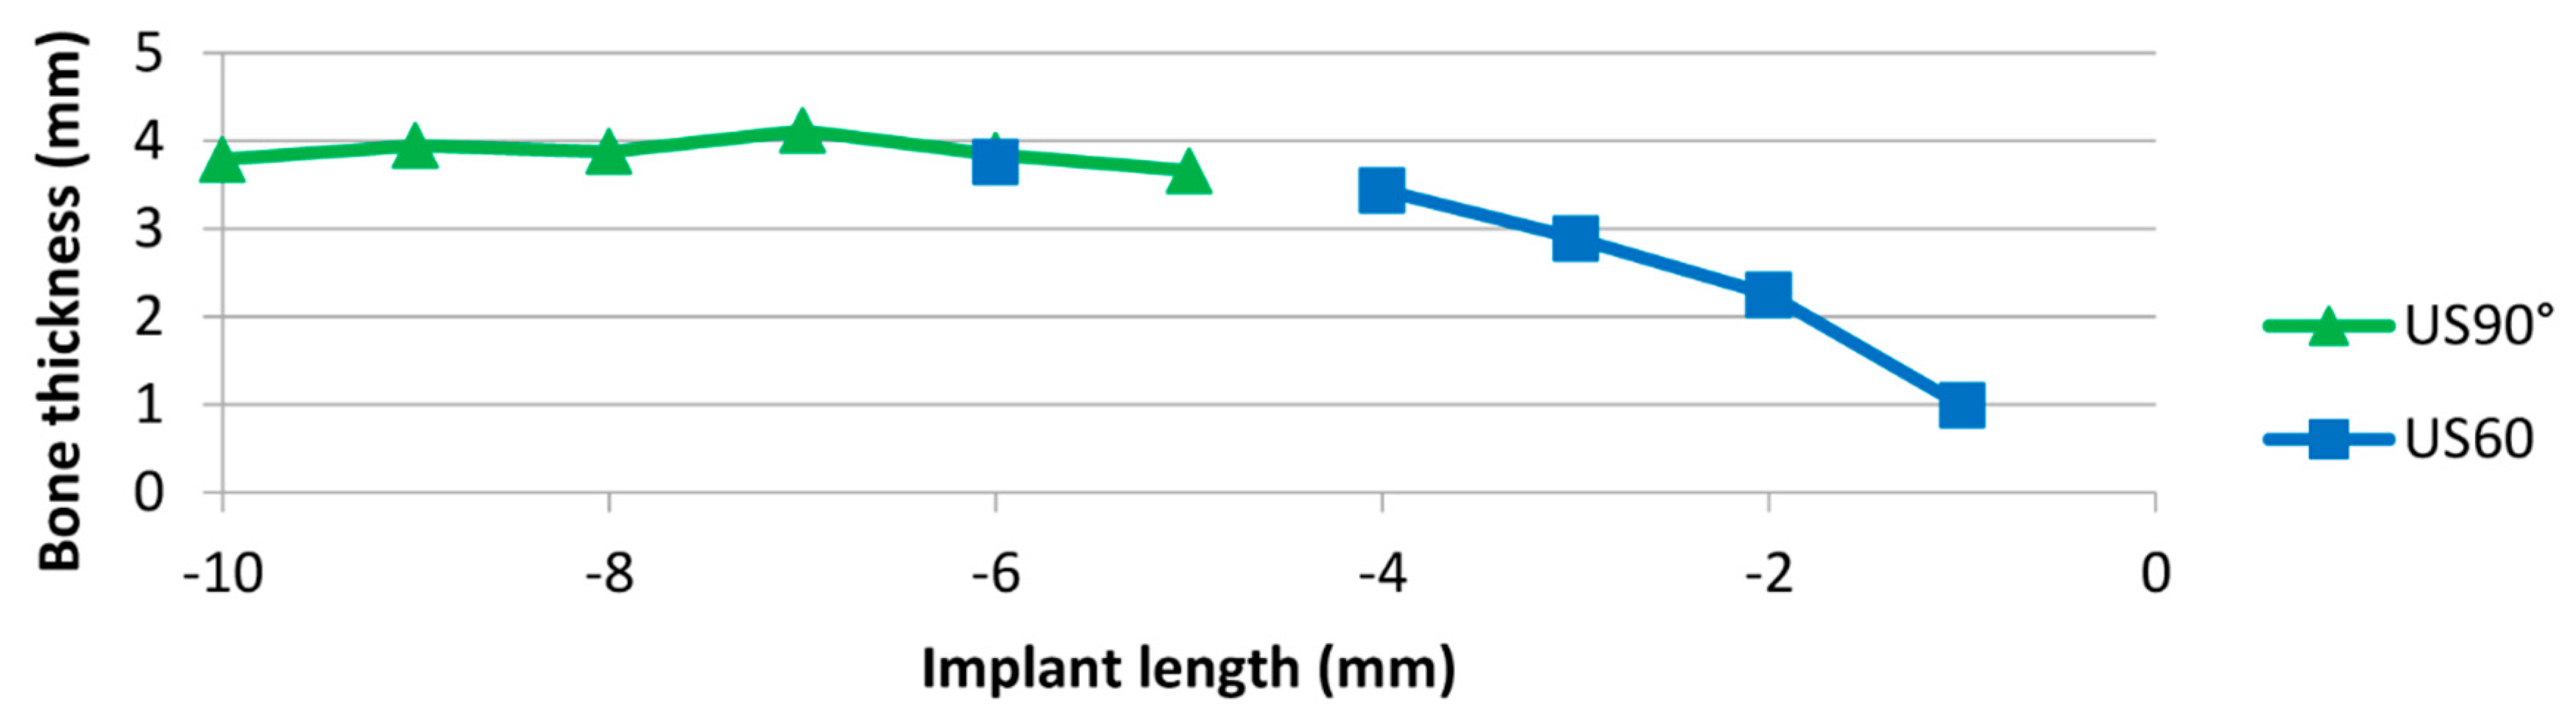
3. Results
4. Discussion
5. Conclusions
Author Contributions
Acknowledgments
Conflicts of Interest
References
- Benic, G.I.; Elmasry, M.; Hammerle, C.H. Novel digital imaging techniques to assess the outcome in oral rehabilitation with dental implants: A narrative review. Clin. Oral Implants Res. 2015, 26, 86–96. [Google Scholar] [CrossRef]
- Shiratori, L.N.; Marotti, J.; Yamanouchi, J.; Chilvarquer, I.; Contin, I.; Tortamano-Neto, P. Measurement of buccal bone volume of dental implants by means of cone-beam computed tomography. Clin. Oral Implants Res. 2012, 23, 797–804. [Google Scholar] [CrossRef] [PubMed]
- Demircan, S.; Demircan, E. Dental cone beam computed tomography analyses of the anterior maxillary bone thickness for immediate implant placement. Implant Dent. 2015, 24, 664–668. [Google Scholar] [CrossRef] [PubMed]
- Andres-Garcia, R.; Vives, N.G.; Climent, F.H.; Palacin, A.F.; Santos, V.R.; Climent, M.H.; Bullon, P. In vitro evaluation of the influence of the cortical bone on the primary stability of two implant systems. Med. Oral Patol. Oral Cir. Bucal. 2009, 14, E93–E97. [Google Scholar] [PubMed]
- Deeb, G.R.; Deeb, J.G. Soft tissue grafting around teeth and implants. Oral Maxillofac. Surg. Clin. North Am. 2015, 27, 425–448. [Google Scholar] [CrossRef] [PubMed]
- Naveau, A.; Shinmyouzu, K.; Moore, C.; Avivi-Arber, L.; Jokerst, J.; Koka, S. Etiology and measurement of peri-implant crestal bone loss (CBL). J. Clin. Med. 2019, 8, 166. [Google Scholar] [CrossRef] [PubMed]
- Al Amri, M.D.; Kellesarian, S.V.; Abduljabbar, T.S.; Al Rifaiy, M.Q.; Al Baker, A.M.; Al-Kheraif, A.A. Comparison of peri-implant soft tissue parameters and crestal bone loss around immediately loaded and delayed loaded implants in smokers and non-smokers: 5-Year Follow-Up Results. J. Periodontol. 2017, 88, 3–9. [Google Scholar] [CrossRef] [PubMed]
- Al Amri, M.D.; Kellesarian, S.V. Crestal bone loss around adjacent dental implants restored with splinted and nonsplinted fixed restorations: A systematic literature review. J. Prosthodont. 2017, 26, 495–501. [Google Scholar] [CrossRef] [PubMed]
- Heitz-Mayfield, L.J.; Mombelli, A. The therapy of peri-implantitis: A systematic review. Int. J. Oral. Maxillofac. Implants 2014, 29, 325–345. [Google Scholar] [CrossRef]
- Bertram, S.; Emshoff, R. Sonography of periimplant buccal bone defects in periodontitis patients: A pilot study. Oral Surg. Oral Med. Oral Pathol. Oral Radiol. Endod. 2008, 105, 99–103. [Google Scholar] [CrossRef]
- Bohner, L.O.L.; Tortamano, P.; Marotti, J. Accuracy of linear measurements around dental implants by means of cone beam computed tomography with different exposure parameters. Dentomaxillofac. Radiol. 2017, 46, 20160377. [Google Scholar] [CrossRef] [PubMed]
- Kaeppler, G. Applications of cone beam computed tomography in dental and oral medicine. Int. J. Comput. Dent. 2010, 13, 203–219. [Google Scholar] [PubMed]
- Razavi, T.; Palmer, R.M.; Davies, J.; Wilson, R.; Palmer, P.J. Accuracy of measuring the cortical bone thickness adjacent to dental implants using cone beam computed tomography. Clin. Oral Implants Res. 2010, 21, 718–725. [Google Scholar] [CrossRef]
- Tyndall, D.A.; Price, J.B.; Tetradis, S.; Ganz, S.D.; Hildebolt, C.; Scarfe, W.C. Position statement of the American Academy of Oral and Maxillofacial Radiology on selection criteria for the use of radiology in dental implantology with emphasis on cone beam computed tomography. Oral Surg. Oral Med. Oral Pathol. Oral Radiol. 2012, 113, 817–826. [Google Scholar] [CrossRef] [PubMed]
- Bornstein, M.M.; Al-Nawas, B.; Kuchler, U.; Tahmaseb, A. Consensus statements and recommended clinical procedures regarding contemporary surgical and radiographic techniques in implant dentistry. Int. J. Oral Maxillofac. Implants 2014, 29, 78–82. [Google Scholar] [CrossRef] [PubMed]
- Chang, H.Y.; Park, S.Y.; Kim, J.A.; Kim, Y.K.; Lee, H.J. Early radiographic diagnosis of peri-implantitis enhances the outcome of peri-implantitis treatment: A 5-year retrospective study after non-surgical treatment. J. Periodontal Implant Sci. 2015, 45, 82–93. [Google Scholar] [CrossRef]
- Nguyen, K.T.; Le, L.H.; Kaipatur, N.R.; Zheng, R.; Lou, E.H.; Major, P.W. High-resolution ultrasonic imaging of dento-periodontal tissues using a multi-element phased array system. Ann. Biomed. Eng. 2016, 44, 2874–2886. [Google Scholar] [CrossRef]
- Nguyen, K.C.; Le, L.H.; Kaipatur, N.R.; Major, P.W. Imaging the cemento-enamel junction using a 20-MHz ultrasonic transducer. Ultrasound Med. Biol. 2016, 42, 333–338. [Google Scholar] [CrossRef]
- Choi, M.; Culjat, M.O.; Singh, R.S.; White, S.N. Ultrasound imagery for dental implant diagnosis and treatment planning in a porcine model. J. Prosthet. Dent. 2012, 108, 344–353. [Google Scholar] [CrossRef]
- Habor, D.; Neuhaus, S.; Vollborn, T.; Wolfart, S.; Radermacher, K.; Heger, S. Model based assessment of vestibular jawbone thickness using high frequency 3D-ultrasound micro-scanning. Med. Imaging 2013 Ultrason. Imaging Tomogr. Ther. 2013, 8675, 86750Z. [Google Scholar]
- Habor, D.; Vollborn, T.; Chuembou Pekam, F.; Radermacher, K.; Degen, K.; Marotti, J.; Wolfart, S.; Heger, S. An ultrasonic micro-scanner for thickness assessment of the vestibular jawbone: In-vitro accuracy evaluation. In Proceedings of the IEEE International Ultrasonics Symposium, Chicago, IL, USA, 3–6 September 2014; pp. 745–748. [Google Scholar]
- Eghbali, A.; De Bruyn, H.; Cosyn, J.; Kerckaert, I.; Van Hoof, T. Ultrasonic assessment of mucosal thickness around implants: Validity, reproducibility, and stability of connective tissue grafts at the buccal aspect. Clin. Implant Dent. Relat. Res. 2016, 18, 51–61. [Google Scholar] [CrossRef]
- Degen, K.; Habor, D.; Radermacher, K.; Heger, S.; Kern, J.S.; Wolfart, S.; Marotti, J. Assessment of cortical bone thickness using ultrasound. Clin. Oral Implants Res. 2017, 28, 520–528. [Google Scholar] [CrossRef]
- Marotti, J.; Heger, S.; Tinschert, J.; Tortamano, P.; Chuembou, F.; Radermacher, K.; Wolfart, S. Recent advances of ultrasound imaging in dentistry—A review of the literature. Oral Surg. Oral Med. Oral Pathol. Oral Radiol. 2013, 115, 819–832. [Google Scholar] [CrossRef]
- Nguyen, K.T.; Pacheco-Pereira, C.; Kaipatur, N.R.; Cheung, J.; Major, P.W.; Le, L.H. Comparison of ultrasound imaging and cone-beam computed tomography for examination of the alveolar bone level: A systematic review. PLoS ONE 2018, 13, e0200596. [Google Scholar] [CrossRef]
- Chan, H.L.; Wang, H.L.; Fowlkes, J.B.; Giannobile, W.V.; Kripfgans, O.D. Non-ionizing real-time ultrasonography in implant and oral surgery: A feasibility study. Clin. Oral Implants Res. 2017, 28, 341–347. [Google Scholar] [CrossRef]
- Chan, H.L.; Misch, K.; Wang, H.L. Dental imaging in implant treatment planning. Implant Dent. 2010, 19, 288–298. [Google Scholar] [CrossRef]
- Gonzalez-Martin, O.; Oteo, C.; Ortega, R.; Alandez, J.; Sanz, M.; Veltri, M. Evaluation of peri-implant buccal bone by computed tomography: An experimental study. Clin. Oral Implants Res. 2016, 27, 950–955. [Google Scholar] [CrossRef]
- Vollborn, T.; Habor, D.; Junk, S.; Radermacher, K.; Heger, S. A Voice-Coil Actuated Ultrasound Micro-Scanner for Intraoral High Resolution Impression Taking. In Proceedings of the 2012 IEEE/RSJ International Conference on Intelligent Robots and Systems (IROS), Algarve, Portugal, 7–12 October 2012; pp. 3571–3576. [Google Scholar]
- Vollborn, T.; Habor, D.; Pekam, F.C.; Heger, S.; Marotti, J.; Reich, S.; Wolfart, S.; Tinschert, J.; Radermacher, K. Soft tissue-preserving computer-aided impression: A novel concept using ultrasonic 3D-scanning. Int. J. Comput. Dent. 2014, 17, 277–296. [Google Scholar]
- Tapie, L.; Lebon, N.; Mawussi, B.; Fron-Chabouis, H.; Duret, F.; Attal, J.P. Understanding dental CAD/CAM for restorations—Accuracy from a mechanical engineering viewpoint. Int. J. Comput. Dent. 2015, 18, 343–367. [Google Scholar]
- Chuembou Pekam, F.; Marotti, J.; Wolfart, S.; Tinschert, J.; Radermacher, K.; Heger, S. High-frequency ultrasound as an option for scanning of prepared teeth: An in vitro study. Ultrasound Med. Biol. 2015, 41, 309–316. [Google Scholar] [CrossRef]
- Praca, L.; Pekam, F.C.; Rego, R.O.; Radermacher, K.; Wolfart, S.; Marotti, J. Accuracy of single crowns fabricated from ultrasound digital impressions. Dent. Mater. 2018, 34, e280–e288. [Google Scholar] [CrossRef]
- Blessmann, M.; Pohlenz, P.; Blake, F.A.; Lenard, M.; Schmelzle, R.; Heiland, M. Validation of a new training tool for ultrasound as a diagnostic modality in suspected midfacial fractures. Int. J. Oral Maxillofac. Surg. 2007, 36, 501–506. [Google Scholar] [CrossRef]
- Marotti, J.; Broeckmann, J.; Chuembou Pekam, F.; Praca, L.; Radermacher, K.; Wolfart, S. Impression of subgingival dental preparation can be taken with ultrasound. Ultrasound Med. Biol. 2019, 45, 558–567. [Google Scholar] [CrossRef]
- Chan, H.L.; Sinjab, K.; Chung, M.P.; Chiang, Y.C.; Wang, H.L.; Giannobile, W.V.; Kripfgans, O.D. Non-invasive evaluation of facial crestal bone with ultrasonography. PLoS ONE 2017, 12, e0171237. [Google Scholar] [CrossRef]
- Vera, C.; De Kok, I.J.; Chen, W.; Reside, G.; Tyndall, D.; Cooper, L.F. Evaluation of post-implant buccal bone resorption using cone beam computed tomography: A clinical pilot study. Int. J. Oral Maxillofac. Implants 2012, 27, 1249–1257. [Google Scholar]
- Goller-Bulut, D.; Sekerci, A.E.; Kose, E.; Sisman, Y. Cone beam computed tomographic analysis of maxillary premolars and molars to detect the relationship between periapical and marginal bone loss and mucosal thickness of maxillary sinus. Med. Oral Patol. Oral Cir. Bucal. 2015, 20, e572. [Google Scholar] [CrossRef]
- Joshi, V.; Gupta, S. Immediate Implant Placement in Anterior Aesthetic Region and Assessment using Cone-Beam Computed Tomography Scan Technology. J. Int. Oral Health. 2015, 7, 99–102. [Google Scholar]
- Goodarzi Pour, D.; Romoozi, E.; Soleimani Shayesteh, Y. Accuracy of Cone Beam Computed Tomography for Detection of Bone Loss. J. Dent. 2015, 12, 513–523. [Google Scholar]
- Nikolic-Jakoba, N.; Spin-Neto, R.; Wenzel, A. Cone-Beam Computed Tomography for Detection of Intrabony and Furcation Defects: A Systematic Review Based on a Hierarchical Model for Diagnostic Efficacy. J. Periodontol. 2016, 87, 630–644. [Google Scholar] [CrossRef]
- Albrektsson, T.; Zarb, G.; Worthington, P.; Eriksson, A.R. The long-term efficacy of currently used dental implants: A review and proposed criteria of success. Int. J. Oral Maxillofac. Implants 1986, 1, 11–25. [Google Scholar]
- Bohner, L.; Habor, D.; Tortamano, P.; Radermacher, K.; Wolfart, S.; Marotti, J. Assessment of buccal bone surrounding dental implants using a high-frequency ultrasound scanner. Ultrasound Med. Biol. 2019, 45, 1427–1434. [Google Scholar] [CrossRef]
- Bohner, L.; Habor, D.; Gremse, F.; Tortamano, P.; Wolfart, S.; Marotti, J. Accuracy of high-frequency ultrasound scanner in detecting peri-implant bone defects. Ultrasound Med. Biol. 2019, 45, 650–659. [Google Scholar] [CrossRef]


© 2019 by the authors. Licensee MDPI, Basel, Switzerland. This article is an open access article distributed under the terms and conditions of the Creative Commons Attribution (CC BY) license (http://creativecommons.org/licenses/by/4.0/).
Share and Cite
Marotti, J.; Neuhaus, S.; Habor, D.; Bohner, L.; Heger, S.; Radermacher, K.; Wolfart, S. High-Frequency Ultrasound for Assessment of Peri-Implant Bone Thickness. J. Clin. Med. 2019, 8, 1539. https://doi.org/10.3390/jcm8101539
Marotti J, Neuhaus S, Habor D, Bohner L, Heger S, Radermacher K, Wolfart S. High-Frequency Ultrasound for Assessment of Peri-Implant Bone Thickness. Journal of Clinical Medicine. 2019; 8(10):1539. https://doi.org/10.3390/jcm8101539
Chicago/Turabian StyleMarotti, Juliana, Sarah Neuhaus, Daniel Habor, Lauren Bohner, Stefan Heger, Klaus Radermacher, and Stefan Wolfart. 2019. "High-Frequency Ultrasound for Assessment of Peri-Implant Bone Thickness" Journal of Clinical Medicine 8, no. 10: 1539. https://doi.org/10.3390/jcm8101539
APA StyleMarotti, J., Neuhaus, S., Habor, D., Bohner, L., Heger, S., Radermacher, K., & Wolfart, S. (2019). High-Frequency Ultrasound for Assessment of Peri-Implant Bone Thickness. Journal of Clinical Medicine, 8(10), 1539. https://doi.org/10.3390/jcm8101539