Article

Stability-Driven Osteoporosis Screening: Multi-View Consensus Feature Selection with External Validation and Sensitivity Analysis

by
Waragunt Waratamrongpatai
1,
Watcharaporn Cholamjiak
2,
Nontawat Eiamniran
2 and
Phatcharapon Udomluck
1,*
1
School of Medicine, University of Phayao, Phayao 56000, Thailand
2
School of Science, University of Phayao, Phayao 56000, Thailand
*
Author to whom correspondence should be addressed.
J. Clin. Med. 2026, 15(2), 677; https://doi.org/10.3390/jcm15020677
Submission received: 24 November 2025 / Revised: 5 January 2026 / Accepted: 8 January 2026 / Published: 14 January 2026
(This article belongs to the Special Issue Accelerating Fracture Healing: Clinical Diagnosis and Treatment)

Abstract

Background/Objectives: Osteoporosis is a major global health concern, and early risk assessment plays a crucial role in fracture prevention. Although demographic, clinical, and lifestyle factors are commonly incorporated into screening tools, their relative importance within data-driven prediction frameworks can vary substantially across datasets. Rather than aiming to identify novel predictors, this study evaluates the stability and behavior of established osteoporosis risk factors using statistical inference and machine learning-based feature selection methods across heterogeneous data sources. We further examine whether simplified and near-minimal models can achieve predictive performances comparable to that of full-feature configurations. Methods: An open-access Kaggle dataset (n = 1958) and a retrospective clinical dataset from the University of Phayao Hospital (n = 176) were analyzed. Feature relevance was assessed using logistic regression, likelihood ratio testing, MRMR, ReliefF, and unified importance scoring. Multiple predictor configurations, ranging from full-feature to minimal and near-minimal models, were evaluated using decision tree, support vector machine, k-nearest neighbor, naïve Bayes, and efficient linear classifiers. External validation was performed using hospital-based records. Results: Across all analyses, age consistently emerged as the dominant predictor, followed by corticosteroid use, while other variables showed limited incremental predictive contributions. Simplified models based on age alone or age combined with medication-related variables achieved performances comparable to full-feature models (accuracy ≈91% and AUC ≈ 0.95). In addition, near-minimal models incorporating gender alongside age and medications demonstrated a favorable balance between discrimination and computational efficiency under external validation. Although overall performance declined under distributional shift, naïve Bayes and efficient linear classifiers showed the most stable external behavior (AUC = 0.728–0.787). Conclusions: These findings indicate that stability-driven feature selection primarily reproduces well-established epidemiological risk patterns rather than identifying novel predictors. Minimal and near-minimal models—including those incorporating gender—retain acceptable performances under external validation and are methodologically efficient. Given the limited size and single-center nature of the external cohort, the results should be interpreted as preliminary methodological evidence rather than definitive support for clinical screening deployment. Further multi-center studies are required to assess generalizability and clinical relevance.

1. Introduction

Osteoporosis is a chronic, progressive skeletal disorder characterized by decreased bone mass and microarchitectural deterioration of bone tissue, resulting in increased bone fragility and fracture risk [1]. According to the World Health Organization (WHO), osteoporosis is considered a major global health problem, affecting more than 200 million people worldwide and contributing to approximately 8.9 million fractures annually, including hip, vertebral, and wrist fractures that account for substantial morbidity, mortality, and healthcare expenditures [2,3,4]. Its prevalence rises sharply with age, particularly among postmenopausal women due to estrogen deficiency and accelerated bone turnover [5,6]. Hip fractures, in particular, carry a one-year mortality rate approaching 20–30%, creating a substantial clinical and socioeconomic burden globally [7,8].
Early identification of individuals at risk is critical for timely preventive interventions and fracture reduction. Dual-energy X-ray absorptiometry (DXA) remains the gold standard for diagnosing osteoporosis and measuring bone mineral density (BMD) [9]; however, it is limited by cost, radiation exposure, lack of availability in rural or resource-limited regions, and reduced accessibility in primary care settings [10,11,12]. Additionally, reliance on BMD alone does not fully account for the multifactorial nature of osteoporosis, which is influenced by lifestyle behaviors, hormonal status, genetic predisposition, comorbidities, and long-term medication use—such as glucocorticoids—that significantly alter bone metabolism [13,14,15,16].
To address these challenges, clinical risk assessment tools such as Fracture Risk Assessment Tool (FRAX) have been developed to estimate fracture probability using demographic and clinical factors [17,18]. While widely adopted, these tools may suffer from population-specific calibration issues and limited adaptability to heterogeneous clinical environments [19,20]. Consequently, there is growing interest in artificial intelligence (AI) and machine learning (ML) approaches capable of integrating high-dimensional, multi-source data to enhance osteoporosis screening, fracture risk prediction, and clinical decision-making [21,22,23,24].
AI-driven models have shown promise in analyzing DXA images, CT scans, X-rays, electronic medical records (EMR), and lifestyle datasets to predict osteoporosis and fragility fractures with improved accuracy and scalability [25,26,27,28]. Deep learning systems can extract subtle bone quality features beyond BMD, whereas traditional ML algorithms provide interpretable risk factor assessment conducive to clinical adoption [29,30,31]. However, a major limitation in current AI-based osteoporosis research is the lack of reproducibility across diverse datasets, susceptibility to model overfitting, and inadequate external validation—issues that restrict their translation into real-world fracture prevention pathways [32,33,34].
Feature selection plays a central role in developing reliable prediction models. Recent advances highlight the importance of stability-driven feature selection, where predictors are evaluated across repeated subsampling, bootstrapping, or resampling procedures to ensure robustness against data perturbations and multicollinearity [35,36]. Multi-view learning—where predictors are grouped into clinically meaningful domains such as demographics, lifestyle, laboratory biomarkers, and medication history—offers additional advantages by preserving complementary information across heterogeneous data sources [37,38]. Incorporating multi-view consensus mechanisms further enhances model interpretability, reduces the influence of noisy or redundant features, and strengthens generalizability across heterogeneous patient cohorts, as demonstrated in recent machine learning-based medical decision support studies [39,40,41,42]. The present study integrates two complementary datasets to evaluate these methodological innovations. The first dataset is an open-access resource from Kaggle entitled “Lifestyle Factors Influencing Osteoporosis”, comprising 1958 records with demographic, lifestyle, and clinical risk variables [43]. This dataset is not intended to represent population-level epidemiology but is used exclusively as a methodological benchmark to examine feature stability behavior across different machine learning models. The second dataset consists of retrospective clinical records from the University of Phayao Hospital (176 patients; data collected between 2018 and 2025), incorporating clinically relevant fracture-related risk factors such as age, prior smoking exposure, and corticosteroid (prednisolone) use, and serves as the primary source for clinically meaningful interpretation. The combination of open-access population-based data and real-world EMR data provides a unique opportunity to assess model robustness, cross-population reproducibility, and sensitivity to distributional shifts—key requirements for deploying AI tools within fracture management pathways [44,45,46].
This study proposes a stability-driven, multi-view consensus feature selection framework designed to examine how different statistical and machine learning-based feature selection strategies behave across heterogeneous datasets, rather than to identify novel clinical predictors of osteoporosis. The framework is coupled with systematic factor-removal experiments and subgroup-based sensitivity analyses to assess feature robustness, stability, and interpretability under varying data conditions. External validation using hospital electronic medical record (EMR) data enables an unbiased evaluation of model performance in real-world clinical settings, addressing generalizability concerns frequently reported in prior machine learning studies. The expected contribution of this work lies in strengthening methodological rigor, improving transparency in feature selection behavior, and supporting the development of parsimonious and interpretable screening models suitable for community-based applications. Ultimately, this approach provides a methodological foundation for reliable fracture risk stratification while emphasizing cautious interpretation of dominant predictors arising from dataset characteristics rather than independent biological discovery.

2. Materials and Methods

2.1. Study Design

This study employed a cross-sectional, retrospective, multi-dataset analytical design integrating open-access data and real-world clinical records. The primary objective was not to discover novel clinical predictors of osteoporosis, but to systematically evaluate the stability, robustness, and behavior of different statistical and machine learning-based feature selection strategies across heterogeneous datasets. To this end, a stability-driven, multi-view consensus feature selection framework was implemented, complemented by factor removal experiments, subgroup-based sensitivity analyses, and external validation. This design follows current methodological recommendations emphasizing reproducible machine learning pipelines and independent validation to assess generalizability, mitigate dataset-driven artifacts, and reduce overfitting in clinical prediction models [44].

2.2. Data Sources and Descriptives

2.2.1. Data Sources

(a)
Open-Access Dataset (Kaggle)
The primary dataset was obtained from the publicly accessible Kaggle repository “Lifestyle Factors Influencing Osteoporosis”, comprising 1958 participants. This dataset contains demographic, lifestyle, nutritional, hormonal, and medical variables related to osteoporosis risk and was used exclusively as a methodological testbed to evaluate feature selection stability and model behavior across machine learning algorithms, rather than for population-level inference. All records were complete, with no missing values. Source: https://www.kaggle.com/datasets/amitvkulkarni/lifestyle-factors-influencing-osteoporosis (accessed on 20 August 2025).
(b)
Retrospective Clinical Dataset (Hospital-Based)
An independent external validation dataset was derived from retrospective clinical records at the University of Phayao Hospital collected between 2018 and 2025. A total of 176 patients were included, with variables capturing age, sex, smoking history, corticosteroid/prednisolone use, comorbidities, and confirmed osteoporosis diagnosis based on BMD or clinician assessment.
This combination of datasets allows evaluation of model robustness between population-level and real-world clinical settings.

2.2.2. Descriptive Statistics

Descriptive characteristics of key variables—particularly age, categorical risk factors, and osteoporosis distribution—were summarized using Jamovi (Version 2.7.9.0). Statistical outputs are derived directly from the analysis report as the following baseline characteristics Table 1.
Table 1 shows baseline characteristics of the 1958 participants from the Kaggle osteoporosis dataset, comparing non-osteoporosis and osteoporosis groups. Age showed a marked difference between groups, whereas most categorical variables displayed balanced distributions across both groups.
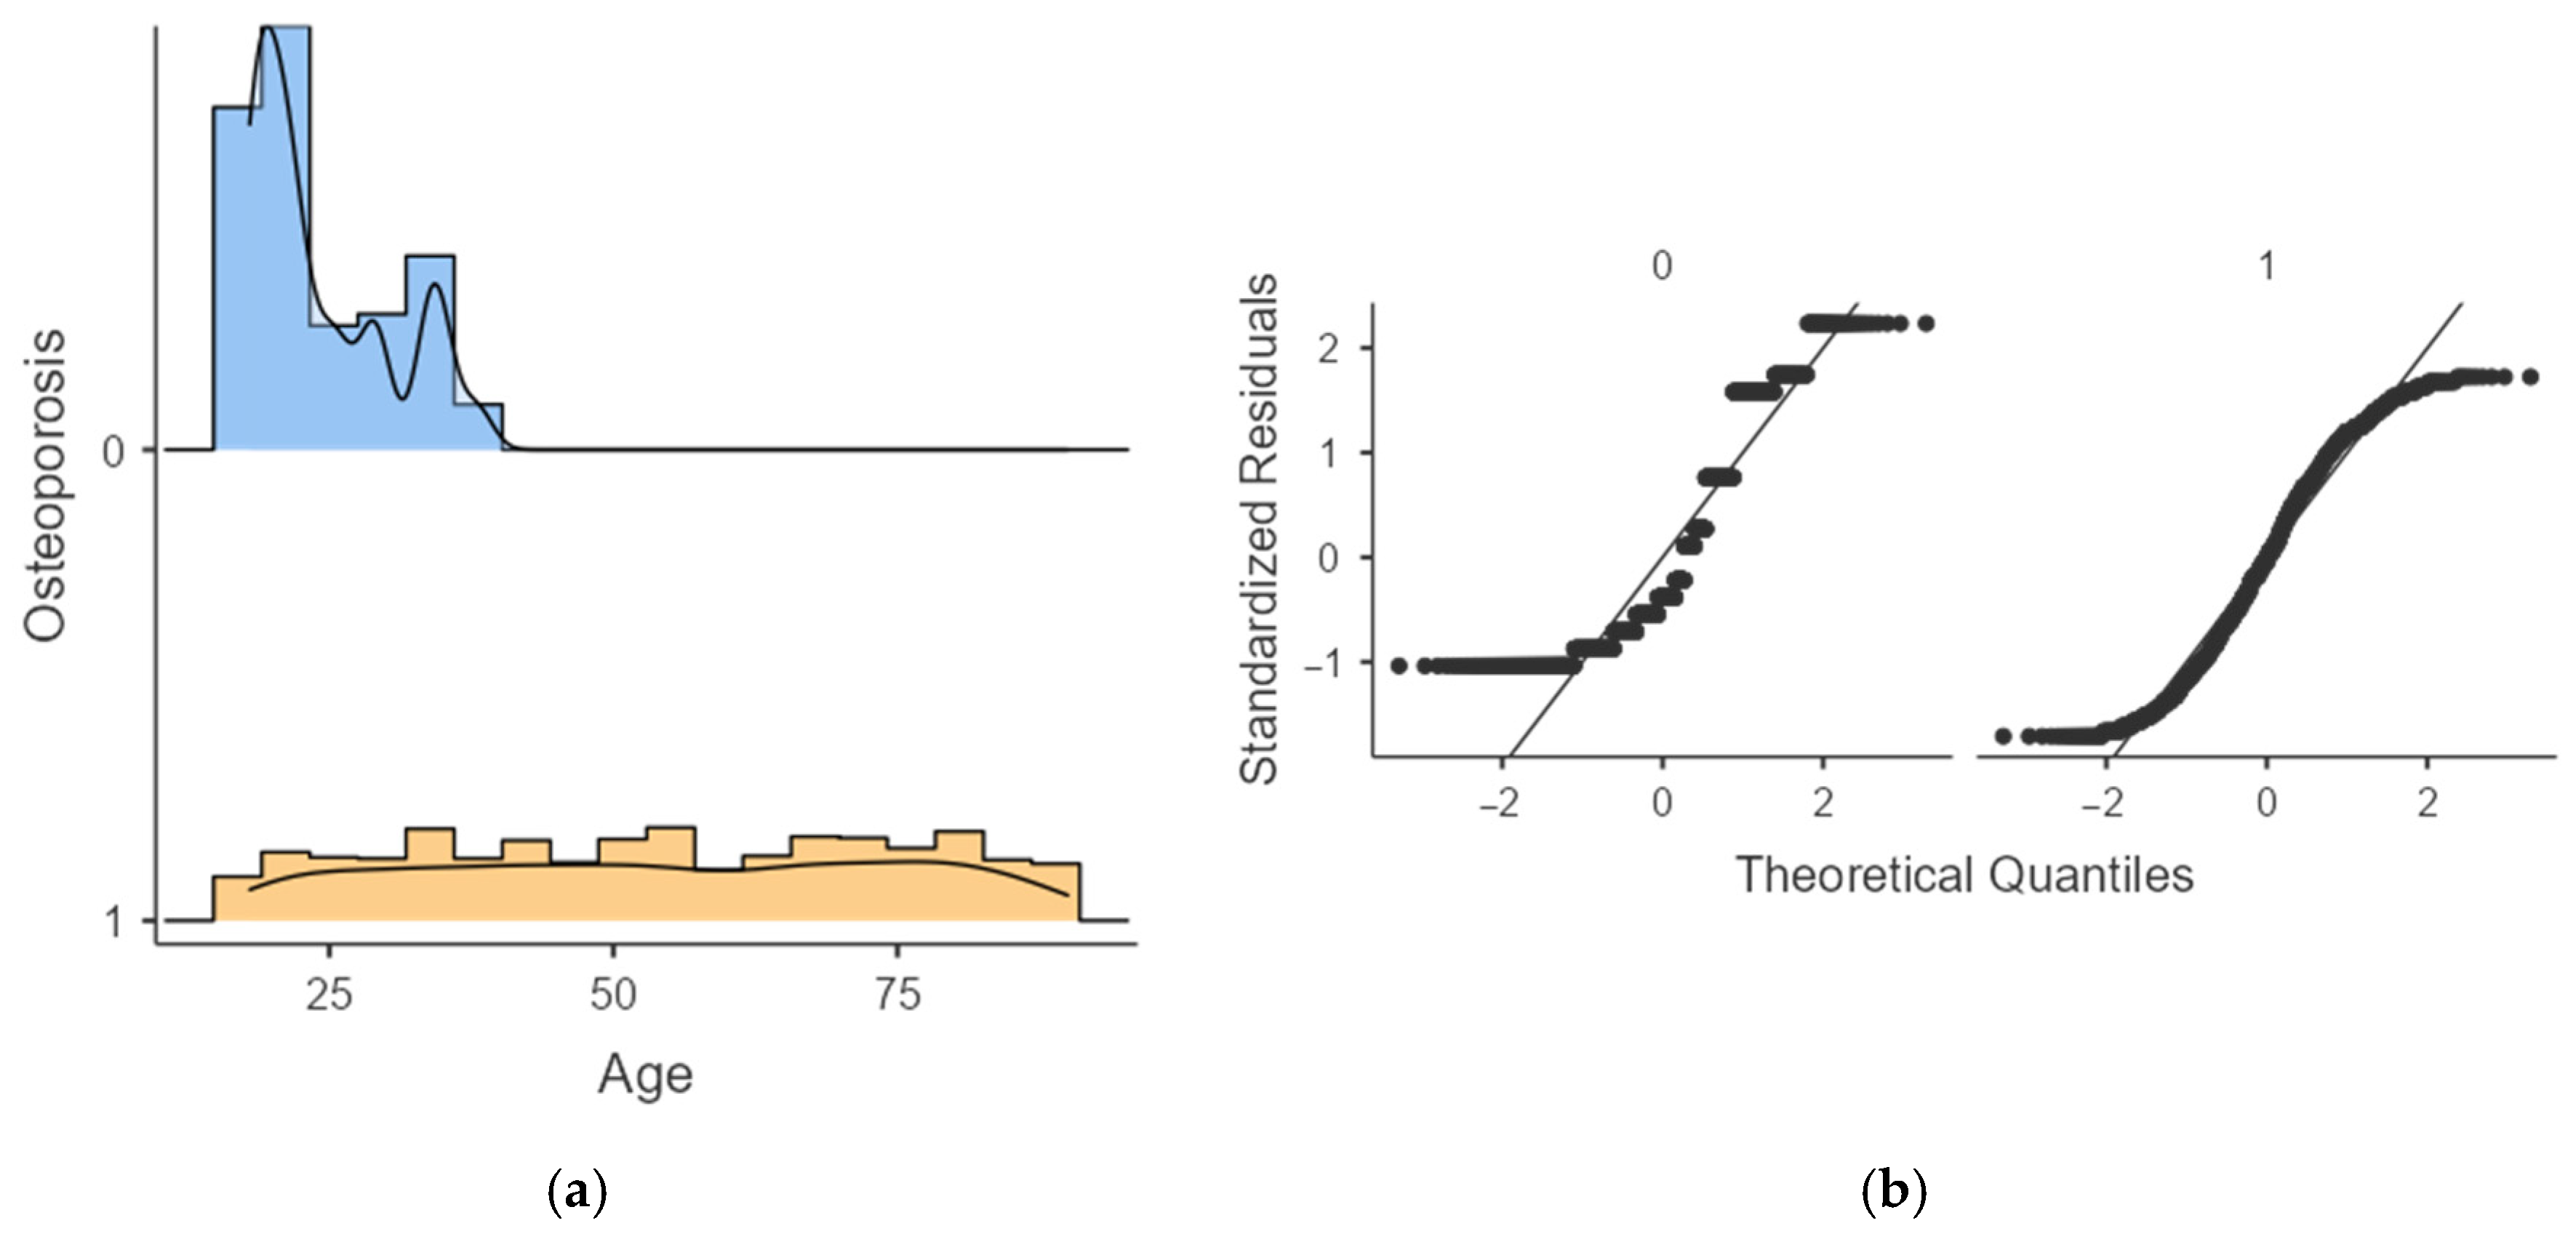
To further explore the distributional differences in age between individuals with and without osteoporosis, additional graphical analyses were performed. These visualizations provide an intuitive overview of how age is distributed across outcome groups and evaluate whether the assumption of normality is appropriate for downstream statistical modeling.
From Figure 1, the graphical analysis highlights clear differences in age patterns between groups. Individuals without osteoporosis displayed a narrowly clustered age distribution centered around early adulthood, whereas those with osteoporosis exhibited a substantially wider and older age range, extending into late adulthood. Q–Q plots further revealed pronounced deviations from normality in both groups, suggesting that age is not normally distributed and should be analyzed using non-parametric or model-based approaches rather than parametric methods relying on normality assumptions. These findings reinforce age as a leading discriminative factor for osteoporosis status within the dataset.

2.3. Model Development

Model development followed a stability-driven framework using multiple predictor configurations derived from statistical tests and machine learning feature selection. Nine models (Cases 1–9), ranging from full-feature to ultra-minimal sets, were constructed to evaluate the effect of progressive feature reduction.
Five machine learning algorithms were trained for each case—Decision Tree, Support Vector Machine (SVM), k-Nearest Neighbors (KNN), Naïve Bayes, and Efficient Linear—representing diverse learning paradigms. All models were developed and internally validated using the Kaggle dataset (n = 1958) with stratified hold-out evaluation. Performance metrics included accuracy, precision, recall, F1-score, and Area Under the Curve (AUC).
Special emphasis was placed on simplified models, particularly those using Age alone or Age + Medications, to determine whether minimal predictor sets could match the performance of more complex models. Models demonstrating high internal stability and strong discriminative performance were selected for subsequent external validation using the hospital dataset.

2.4. Workflow

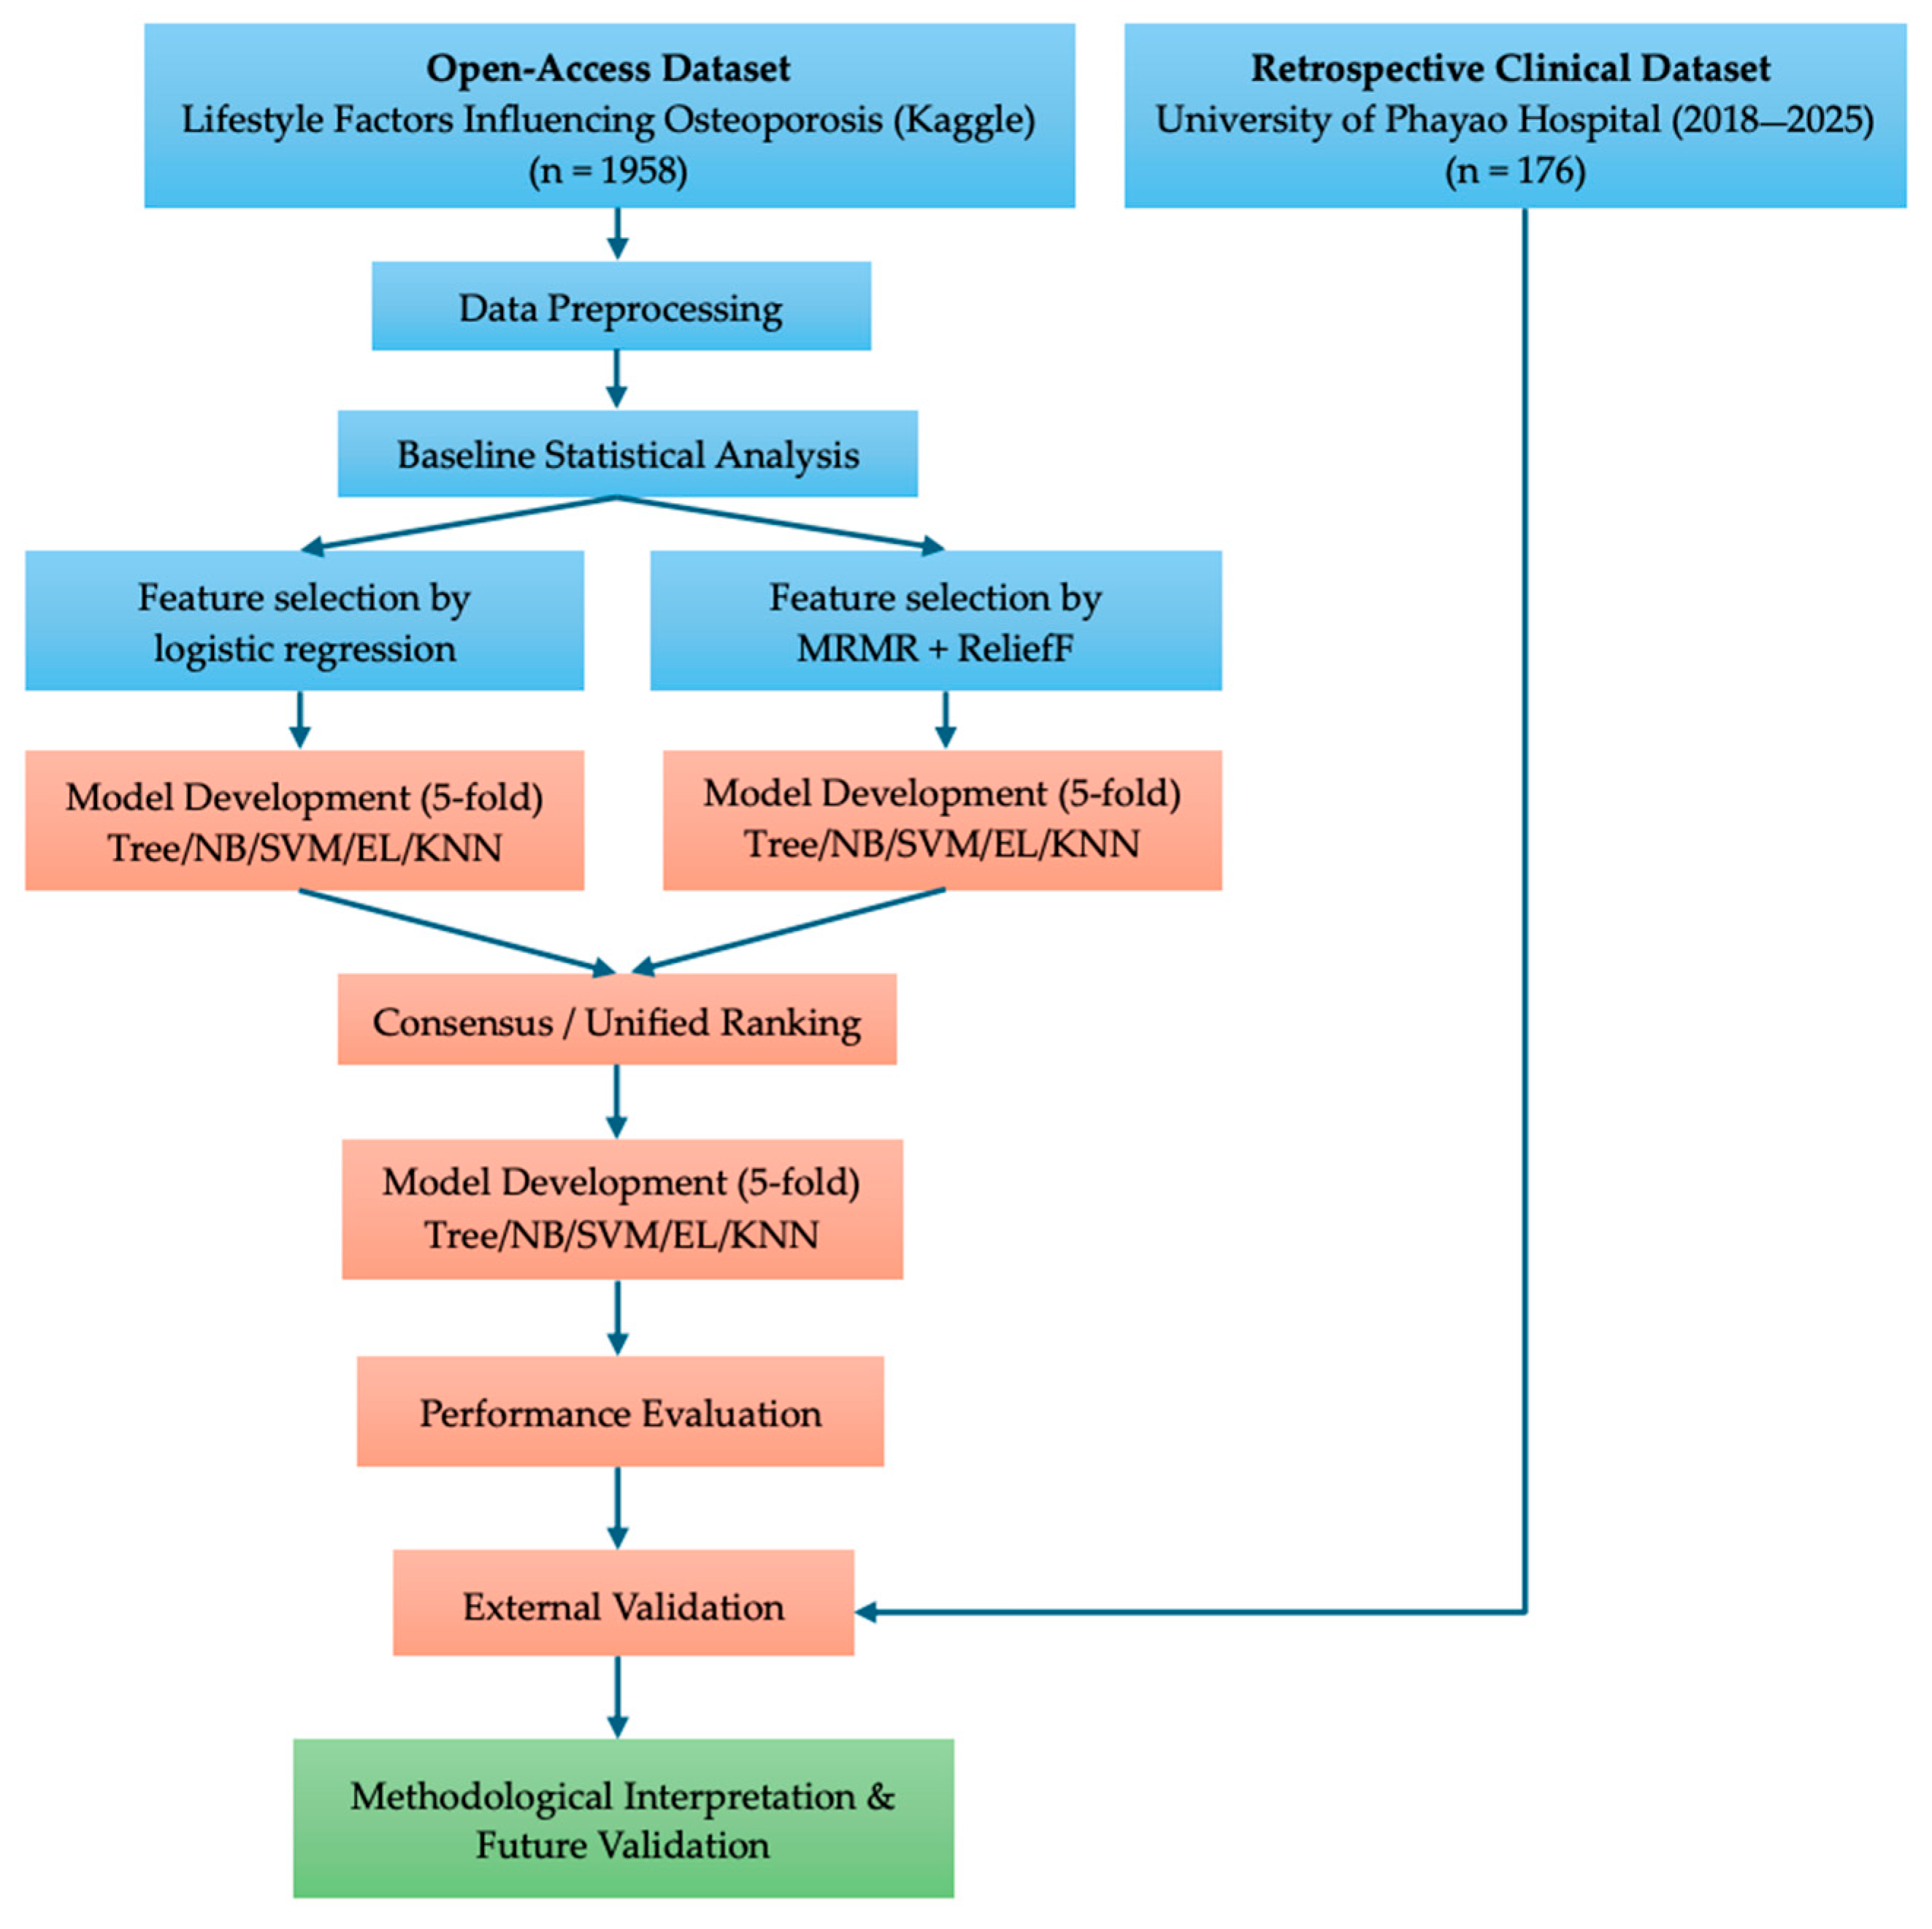
Figure 2 illustrates the complete analytical pipeline employed in the study, beginning with data acquisition from open-access and retrospective clinical sources, followed by data preprocessing and baseline statistical analysis. Feature selection was conducted using complementary statistical and machine learning approaches, with a unified consensus ranking guiding model development across multiple predictor configurations and classification algorithms. Model performance was assessed through internal evaluation and preliminary external validation. The final stage emphasizes methodological interpretation and highlights directions for future clinical validation rather than direct deployment.

3. Results

3.1. Statistical Analysis of Predictors

From Table 2, analysis of all predictors revealed that age is overwhelmingly the strongest determinant of osteoporosis, with an exceptionally high likelihood ratio (χ2 = 1329.6 and p < 0.001) and a highly significant logistic regression coefficient (OR = 1.17 per year). This indicates that each additional year of age increases osteoporosis odds by approximately 17%, making age the dominant driver of the model. Aside from age, only corticosteroid medication use showed a statistically significant association (χ2 = 5.04; p = 0.025; OR = 1.36), although its effect size was much smaller. All other lifestyle, demographic, nutritional, and clinical variables—including gender, hormonal status, family history, race/ethnicity, body weight, calcium intake, vitamin D intake, smoking, alcohol consumption, physical activity, medical conditions, and prior fractures—showed non-significant effects (p > 0.05).
Findings from the combined likelihood ratio tests and logistic regression coefficients clearly indicate that age is the dominant predictor of osteoporosis, whereas most other demographic, lifestyle, and nutritional variables show minimal or no contribution to the model. Variables such as Gender, Family History, and Alcohol Consumption demonstrated extremely small χ2 values (0.0047–0.0395) and non-significant regression coefficients (p > 0.80), with odds ratios close to 1.0. These results suggest that their influence on osteoporosis risk within this dataset is negligible.
Based on this evidence, two screening models were developed:
  • Full Model (Comprehensive Model)
The full model incorporates all available predictors, including demographic, clinical, lifestyle, nutritional, and medical variables. This model serves as the baseline reference, capturing the maximum achievable predictive performance when the complete feature set is utilized.
2.
Reduced Model (Simplified Screening Model)
The reduced model excludes Gender, Family History, and Alcohol Consumption, as these predictors demonstrated consistently non-significant effects, trivial effect sizes, and minimal contribution to the explanatory power of the model. By removing these low-impact features, the model achieves improved parsimony and interpretability, while maintaining performance nearly identical to the full model. This configuration is especially suitable for real-world or community-based screening, where data availability may be limited.
3.
Two-Feature Model (Minimal Predictive Model)
To further identify the most essential predictors, a third model was developed using only Age and Medications (corticosteroid use)—the only two variables that showed statistically significant associations in both the omnibus likelihood ratio tests and logistic regression analyses. Age exhibited a dominant effect (OR ≈ 1.17 per year and p < 0.001), while corticosteroid use showed a modest but meaningful association (OR ≈ 1.36 and p = 0.025), consistent with established evidence regarding steroid-induced bone loss.
This model evaluates whether these two core predictors alone can sustain clinically acceptable screening performance. Given the negligible influence of most other variables—including demographic, lifestyle, and nutritional factors—the Two-Feature Model provides a highly parsimonious yet clinically coherent alternative. Preliminary comparisons indicate that overall discriminative capacity remains largely preserved, with only minor reductions, if any, in sensitivity or stability. This makes the model particularly advantageous for rapid screening, low-resource environments, telehealth workflows, or situations where comprehensive data collection is not feasible.
From Table 3, the comparison across the three model configurations—Full Model, Reduced Model, and the Two-Feature Model—demonstrated that screening performance remained highly stable despite progressive reductions in the feature set. The Full Model and Reduced Model showed nearly identical results, with accuracy values of 0.826 and 0.825, sensitivities of 0.781 in both cases, and specificities of 0.870 and 0.869, respectively. Their AUC values were also identical at 0.906, indicating that the removal of Gender, Family History, and Alcohol Consumption had no meaningful impact on discriminative performance.
The Two-Feature Model, which included only Age and Medications, exhibited performance that was similarly strong, achieving accuracy of 0.827, sensitivity of 0.783, specificity of 0.870, and an AUC of 0.904. Although the AUC was slightly lower than that of the full and reduced models, the difference was minimal and did not materially affect overall classification capability. Model fit indices showed expected patterns: while the Two-Feature Model had a slightly higher Deviance, its AIC and BIC values were lower than those of the Full Model, reflecting improved parsimony with only a marginal trade-off in fit.
Taken together, these results demonstrate that the core predictive capacity of the screening framework is preserved even when the model is reduced to only two variables, driven primarily by the strong effect of age. This supports the practical utility of simplified or minimal models, particularly for rapid osteoporosis screening in real-world, community-based, or resource-limited environments.

3.2. Feature Selection and Model Development Using Machine Learning

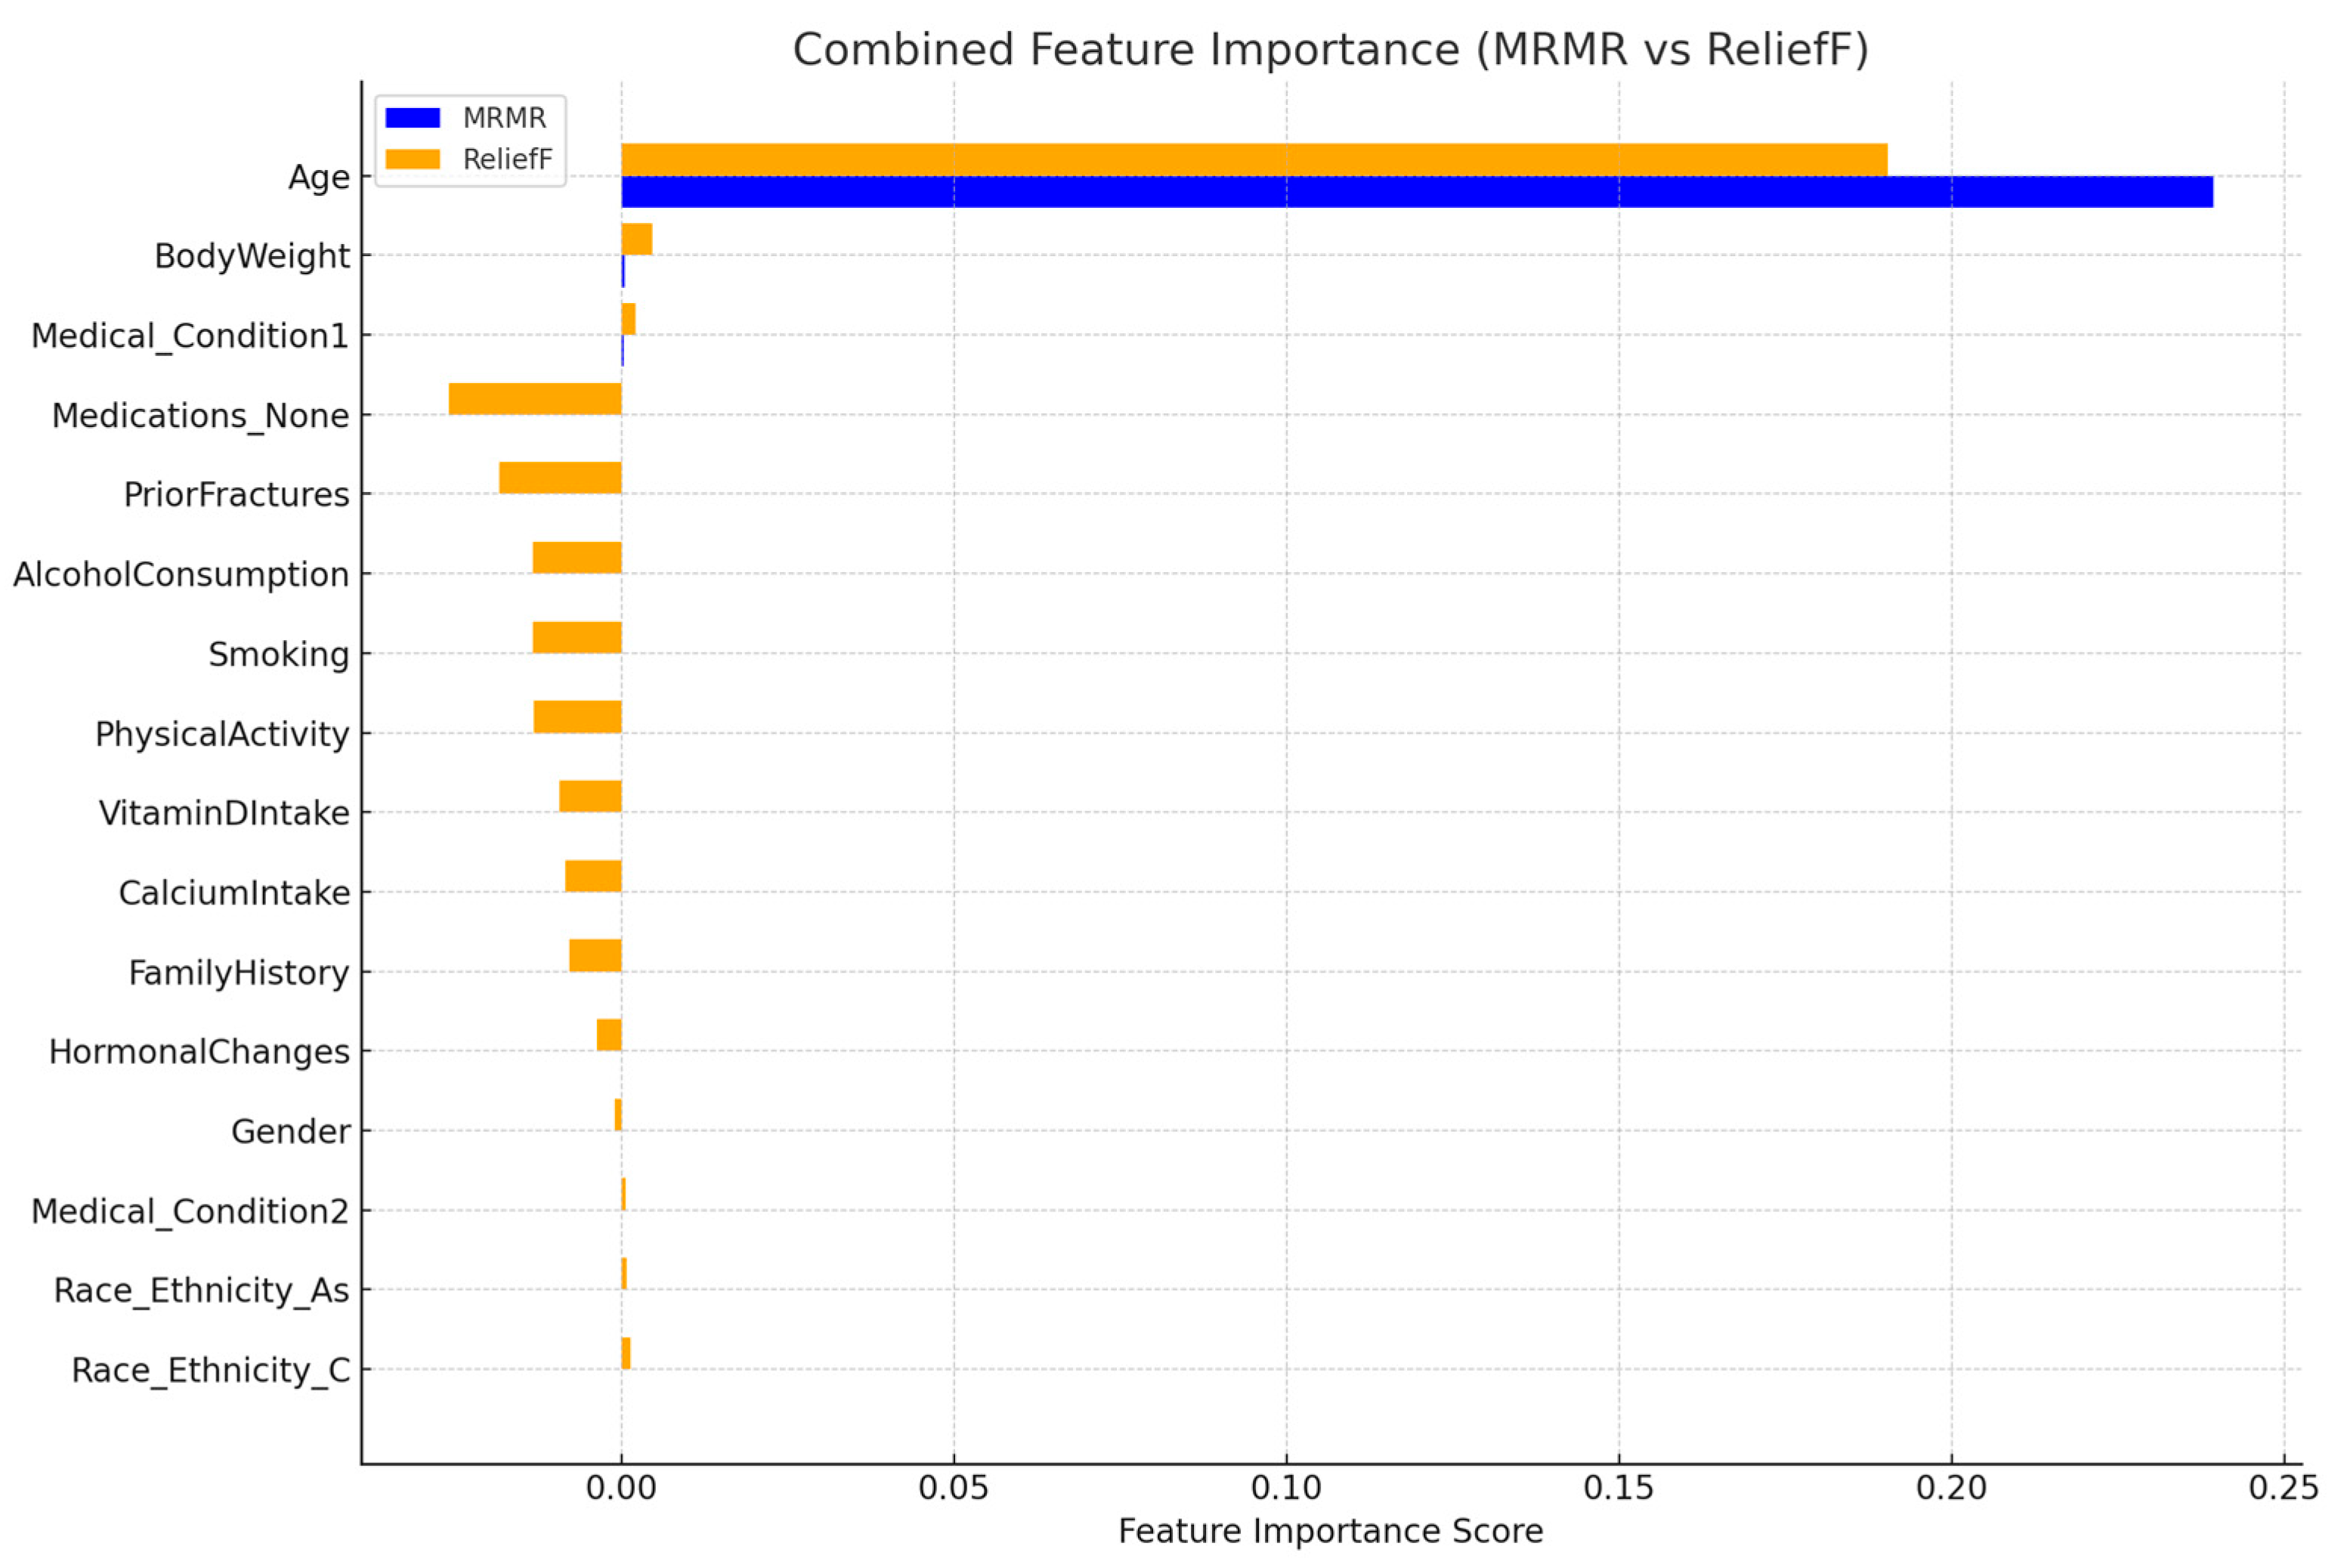
From Figure 3, the bar plot compares feature importance scores derived from the MRMR and ReliefF feature selection methods across all predictors. Age consistently demonstrates the highest importance in both algorithms, indicating its dominant role in osteoporosis prediction. Other variables show minimal or near-zero contributions, reflecting low discriminative value within this dataset. Color coding distinguishes the two algorithms (MRMR in blue and ReliefF in orange), enabling direct comparison of ranking consistency.
To further evaluate the relative importance of predictors from a machine-learning perspective, feature importance was assessed using two complementary filter-based methods, namely Minimum Redundancy Maximum Relevance (MRMR) and ReliefF. The averaged importance scores derived from these methods were then used to rank all candidate features, as summarized in Table 4.
The combined analysis of feature importance using MRMR and ReliefF algorithms demonstrates a clear and consistent pattern in identifying the predictors most relevant to osteoporosis classification.
1.
Age is the overwhelmingly dominant predictor
Age shows by far the highest importance score across both algorithms, with an average score more than 100 times greater than any other feature. This confirms that age contributes the most discriminative information in predicting osteoporosis, consistent with the logistic regression and model performance results.
2.
Very small contributions from other variables
A few additional features—such as Medical_Condition1, Calcium Intake, Alcohol Consumption, and Physical Activity—received small positive scores, indicating minor influence. However, their importance values remain extremely low relative to age and are unlikely to meaningfully improve model performance.
3.
Several variables show near-zero or negative importance
Many predictors, including Family History, Smoking, Hormonal Changes, Race/Ethnicity, and Body Weight, exhibit zero or negative ReliefF values. Negative scores indicate that the feature may add noise rather than improve classification, reinforcing their negligible predictive value in this dataset.
4.
Strong agreement between MRMR and ReliefF
Both methods show a similar ranking pattern—clear dominance of age, small secondary contributions from clinical or nutritional factors, and weak influence from lifestyle and demographic variables. This cross-method consistency enhances confidence in the stability of feature relevance.
To evaluate the incremental contribution of key predictors and to identify the most parsimonious yet effective screening framework, five predictive model configurations were constructed based on increasing numbers of top-ranked features. The feature ranking was determined using a combination of MRMR scores and ReliefF scores with Age consistently emerging as the strongest predictor across all analyses.
  • Case 1: Full-Predictor Model (All features).
  • Case 2: Five-Predictor Model (5 Features):
    • Age;
    • Medications;
    • Calcium Intake;
    • Physical Activity;
    • Alcohol Consumption (positive but small ReliefF score).
  • Case 3: Four-Predictor Model (4 Features):
    • Age;
    • Medications;
    • Calcium Intake;
    • Physical Activity (small positive ReliefF score).
  • Case 4: Three-Predictor Model (3 Features):
    • Age;
    • Medications;
    • Calcium Intake (modest importance across ReliefF).
  • Case 5: Two-Predictor Model (2 Features):
    • Age;
    • Medications (corticosteroid use).
  • Case 6: Single-Predictor Model (1 Feature):
    • Age.
Table 5 shows the comparison across the six feature selection cases reveals high stability in model performance, even as the number of predictors decreases from the full set down to a single-feature model. Across all configurations, the Tree, SVM, and KNN classifiers consistently achieved the highest validation accuracy—often above 91%, particularly in Cases 4–6. Notably, the single-predictor model (Case 6), which relied solely on Age, produced accuracy levels (≈91.42%) comparable to those of more complex models, further underscoring age as the dominant predictive factor. In addition to accuracy-based metrics, AUC values remained consistently strong across all models, typically ranging from 0.90 to 0.96, demonstrating excellent discriminative ability regardless of the number of features included. Importantly, even the most simplified models—Cases 5 and 6—achieved AUC values between 0.949 and 0.954, closely matching or exceeding those observed in the full-feature and intermediate-feature models. This stability in AUC reinforces the robustness of the minimal-predictor approach. Precision, recall, and F1-scores also remained remarkably stable across all cases, with top-performing models achieving values above 92%. Although training time increased substantially for Naïve Bayes and SVM in later cases, these computational differences did not affect predictive performance. The strongest and most efficient overall performers were Tree, SVM, and KNN, which maintained excellent classification quality across all feature configurations.
Case 5 evaluates a model using only two predictors—Age and Medications (corticosteroid use)—representing the smallest feature set that preserves statistically significant contributions from both variables. This model demonstrated excellent predictive performance, with the Tree, SVM, and KNN classifiers each achieving 91.42% accuracy, 92.68% precision, 91.42% recall, an F1-score of 91.36%, and AUC values around 0.954–0.949. These metrics are essentially identical to those obtained from more complex models (Cases 1–4), confirming that the inclusion of additional low-importance variables does not yield meaningful performance gains. In terms of efficiency, the Tree and KNN models trained substantially faster than Naïve Bayes and SVM, making them well suited for real-time or resource-constrained environments. The consistently high accuracy, precision, recall, F1-score, and AUC across classifiers indicate strong discriminative power and stable classification performance despite the simplicity of the model. Overall, Case 5 highlights the practical advantage of a highly parsimonious screening framework, demonstrating that a combination of just Age and corticosteroid medication use is sufficient to match the predictive accuracy and AUC of more complex feature sets. This finding reinforces the clinical and computational value of stability-driven feature selection and supports the deployment of ultra-minimal models in community hospitals, telemedicine screening platforms, and primary care settings.
Collectively, these results demonstrate that simplifying the model by reducing predictors does not compromise predictive accuracy or AUC. This supports the use of minimal or ultra-minimal feature sets—particularly models relying on Age alone or Age combined with Medications—as robust, efficient approaches for osteoporosis risk prediction, especially in resource-limited or community screening settings.

3.3. Consensus Feature Selection and Integrated Model Construction

From Table 6, a unified ranking integrating logistic regression effect estimates and machine learning importance scores consistently identified Age and Medications (corticosteroid use) as the dominant predictors across all analyses, while other variables showed substantially weaker combined contributions. This pattern suggests that minimal and ultra-minimal configurations primarily reflect established epidemiological risk factors rather than novel predictive signals.
Based on this unified assessment, additional multi-feature configurations were explored to evaluate whether secondary predictors with modest importance could provide incremental value. Variables such as Smoking, Prior Fractures, and selected Race/Ethnicity categories were sequentially incorporated according to their unified ranking (Estimate × Average Importance), ensuring a systematic and non-arbitrary expansion strategy. Although these factors were clearly weaker than the primary predictors, their inclusion allowed controlled assessment of potential additive effects and demographic interactions in more complex feature settings.
  • Case 7: Three-Predictor Model (3 Features):
    • Age;
    • Medications;
    • Smoking.
  • Case 8: Four-Predictor Model (4 Features):
    • Age;
    • Medications;
    • Smoking;
    • PriorFractures.
  • Case 9: Five-Predictor Model (5 Features):
    • Age;
    • Medications;
    • Smoking;
    • PriorFractures;
    • Race_Ethnicity_C.
  • Case 10: Four-Predictor Model (Rank 1–3 + Gender):
    • Age;
    • Medications;
    • Smoking;
    • Gender.
  • Case 11: Tree-Predictor Model (Rank 1–2 + Gender):
    • Age;
    • Medications;
    • Gender.
Case 10 and Case 11 were specifically designed to evaluate the potential contribution of Gender, a well-established biological factor associated with osteoporosis risk, particularly in the context of postmenopausal bone loss. The inclusion of Gender in these configurations was motivated by extensive epidemiological evidence demonstrating pronounced sex-specific differences in osteoporosis prevalence and fracture risk, with postmenopausal women representing the most affected population group [47,48]. These cases were not intended to introduce a novel predictor, but rather to assess whether gender-related information provides incremental value within the proposed methodological framework.
From Table 7, across Cases 7–9, the inclusion of secondary predictors (e.g., Smoking, Prior Fractures, and Race/Ethnicity_C) maintained consistently high and stable model performance, with Case 7 in particular preserving strong predictive accuracy after adding Smoking. However, these additional features did not lead to substantial or systematic performance improvements compared with simpler configurations and, in some algorithms, resulted in increased computational cost. In contrast, Case 11 (Age + Medications + Gender) demonstrated a favorable balance between predictive performance and computational efficiency. While maintaining accuracy and AUC values comparable to other high-performing models, Case 11 required notably lower training time, making it an efficient minimal-feature configuration within the proposed methodological framework.

3.4. External Validation Using Retrospective Hospital Records

To assess the generalizability of the proposed models under distributional shift, external validation was performed using retrospective clinical records obtained from the University of Phayao Hospital. Four representative configurations—Case 5 (Age + Medications), Case 6 (Age only), Case 7 (Age + Medications + Smoking), and Case 11 (Age + Medications + Gender)—were selected for external testing across five machine learning algorithms. These cases were chosen to compare minimal and slightly expanded feature sets, as well as to evaluate the effect of incorporating clinically relevant secondary variables. Model robustness was assessed by examining performance on the external cohort, where population characteristics differed from those of the training dataset. The resulting accuracy, precision, recall, F1-score, and AUC values are summarized in Table 8.
As shown in Table 8, external validation resulted in a moderate decline in predictive performance compared with internal validation, which is expected under real-world conditions with differing population characteristics. Across the evaluated configurations (Cases 5, 6, 7, and 11), test-set accuracy generally ranged from approximately 73% to 77%, with precision and recall remaining relatively stable. While no single configuration consistently achieved the highest value across all performance metrics, Case 11 (Age + Medications + Gender) demonstrated a favorable overall balance between accuracy and discriminative ability. In particular, the Efficient Linear classifier in Case 11 showed competitive accuracy alongside relatively strong AUC values compared with other minimal and near-minimal models, making it a methodologically attractive option under external validation. These results indicate that minimal and near-minimal feature configurations retain acceptable predictive capability under distributional shift. Although performance attenuation is evident, the findings should be interpreted as preliminary evidence of robustness rather than definitive clinical generalizability. The combined evaluation of accuracy, AUC, and computational efficiency suggests that Efficient Linear models with carefully selected minimal features, such as Case 11, represent a promising balance within the proposed framework.
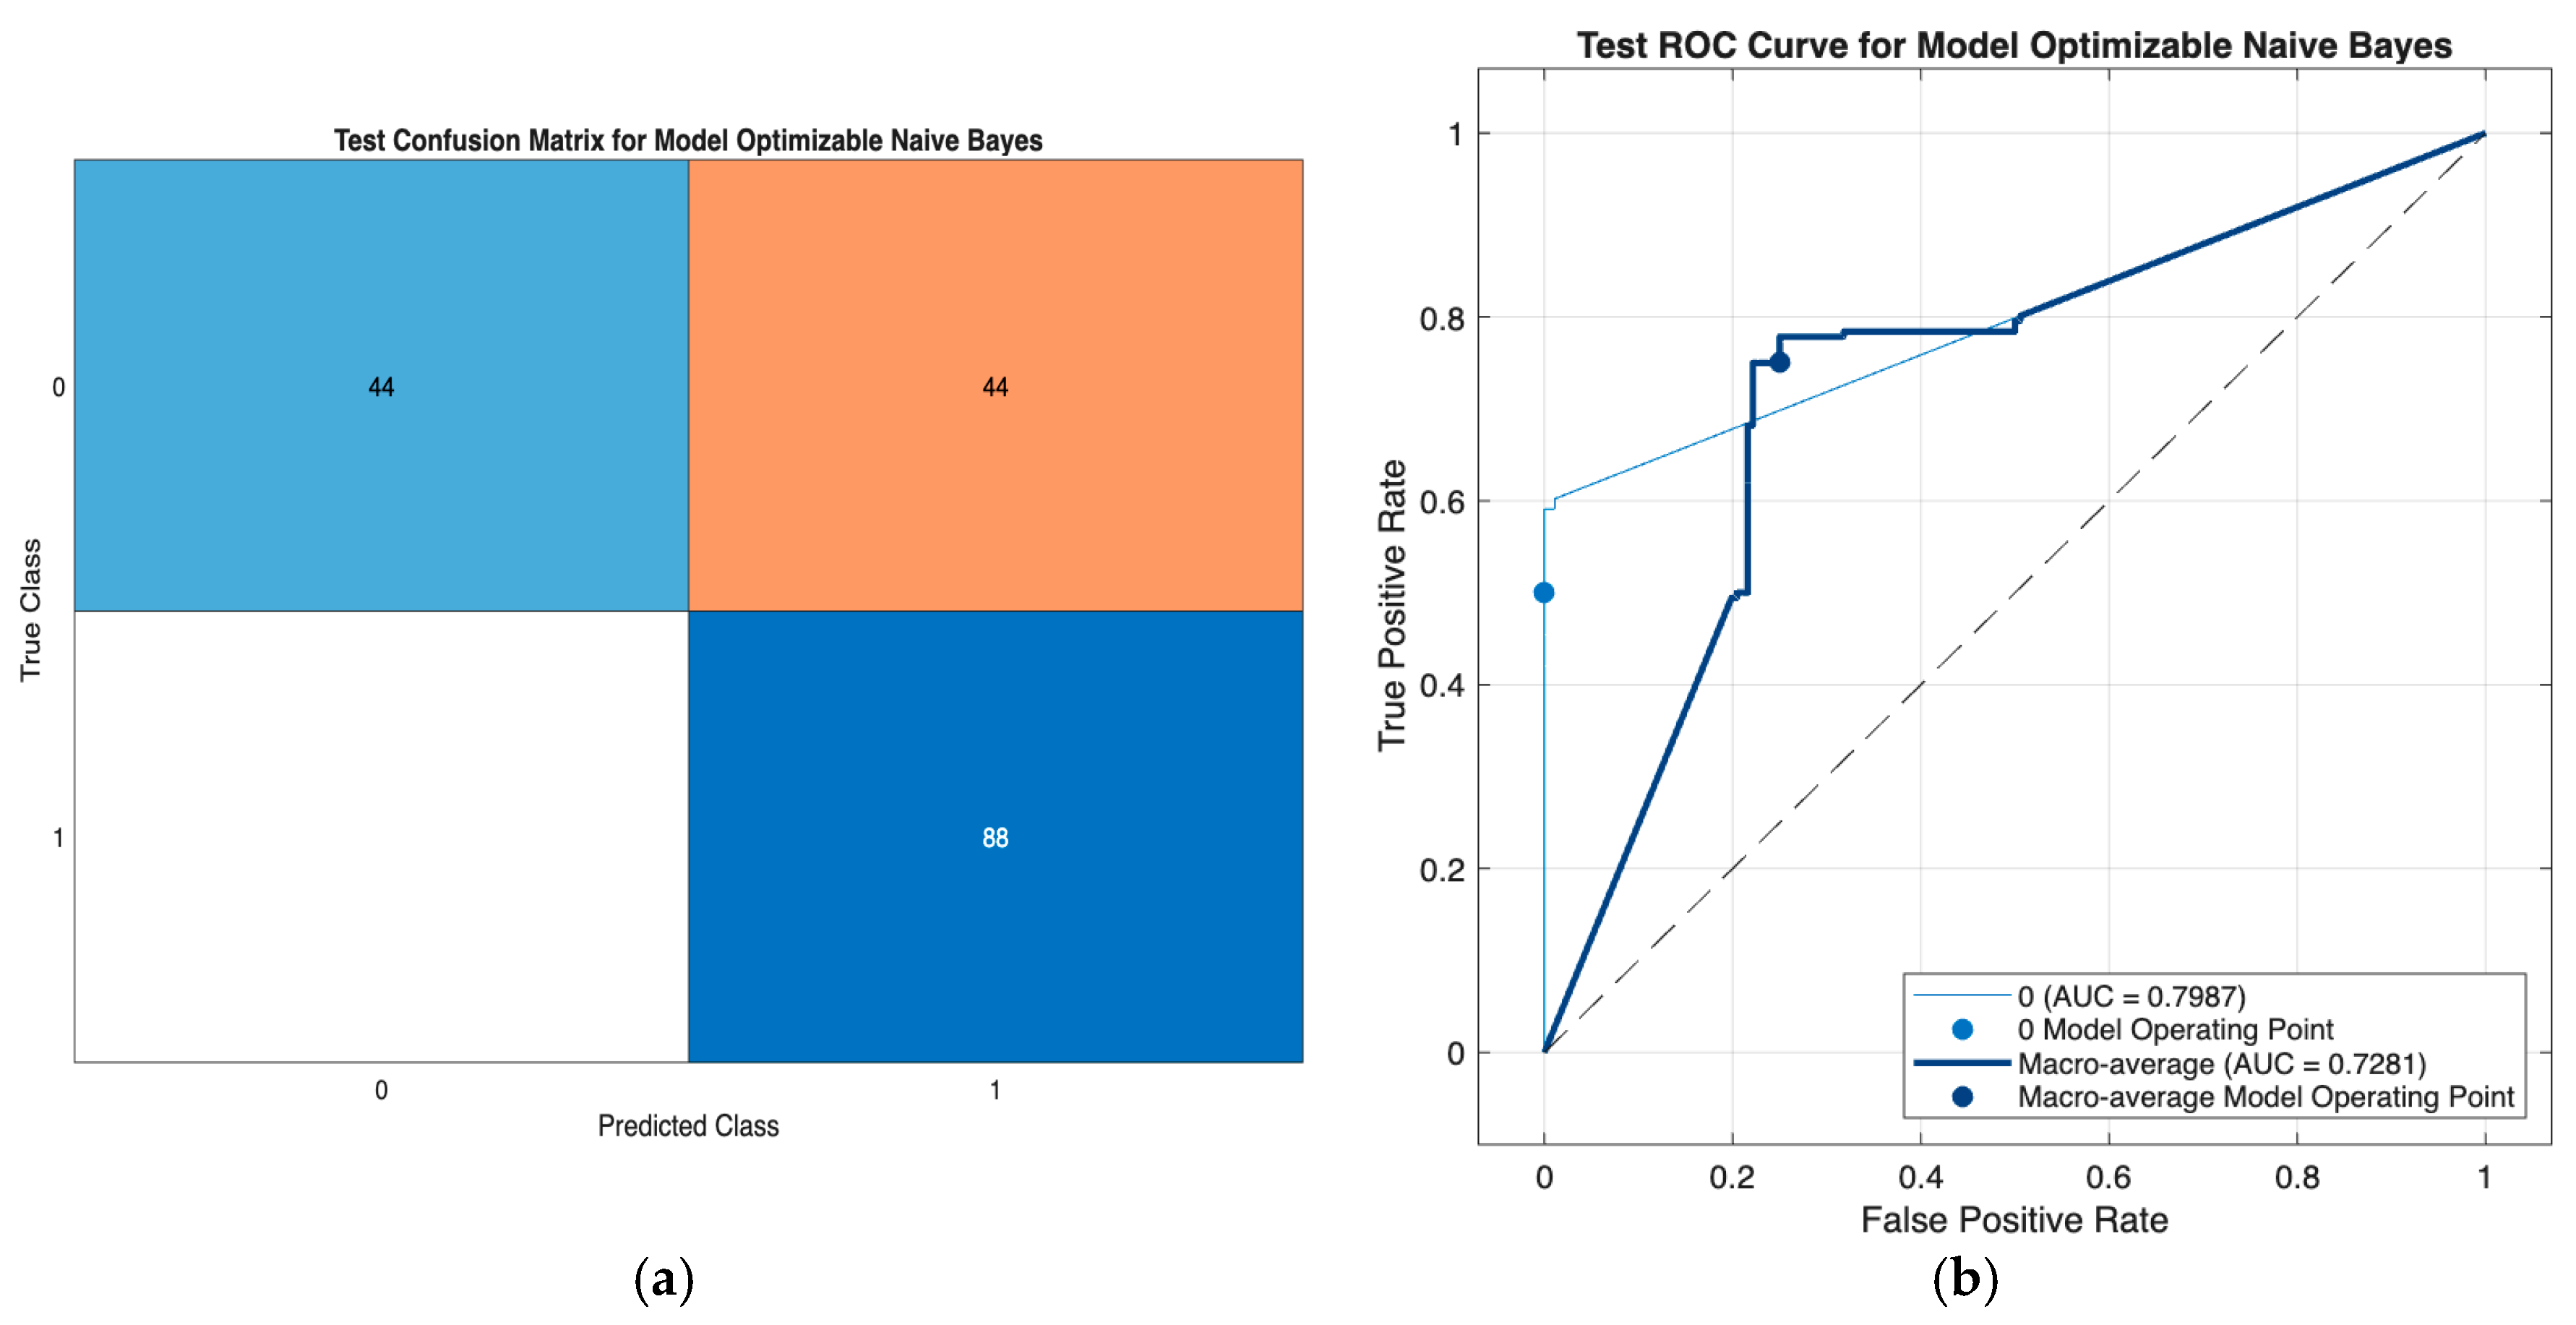
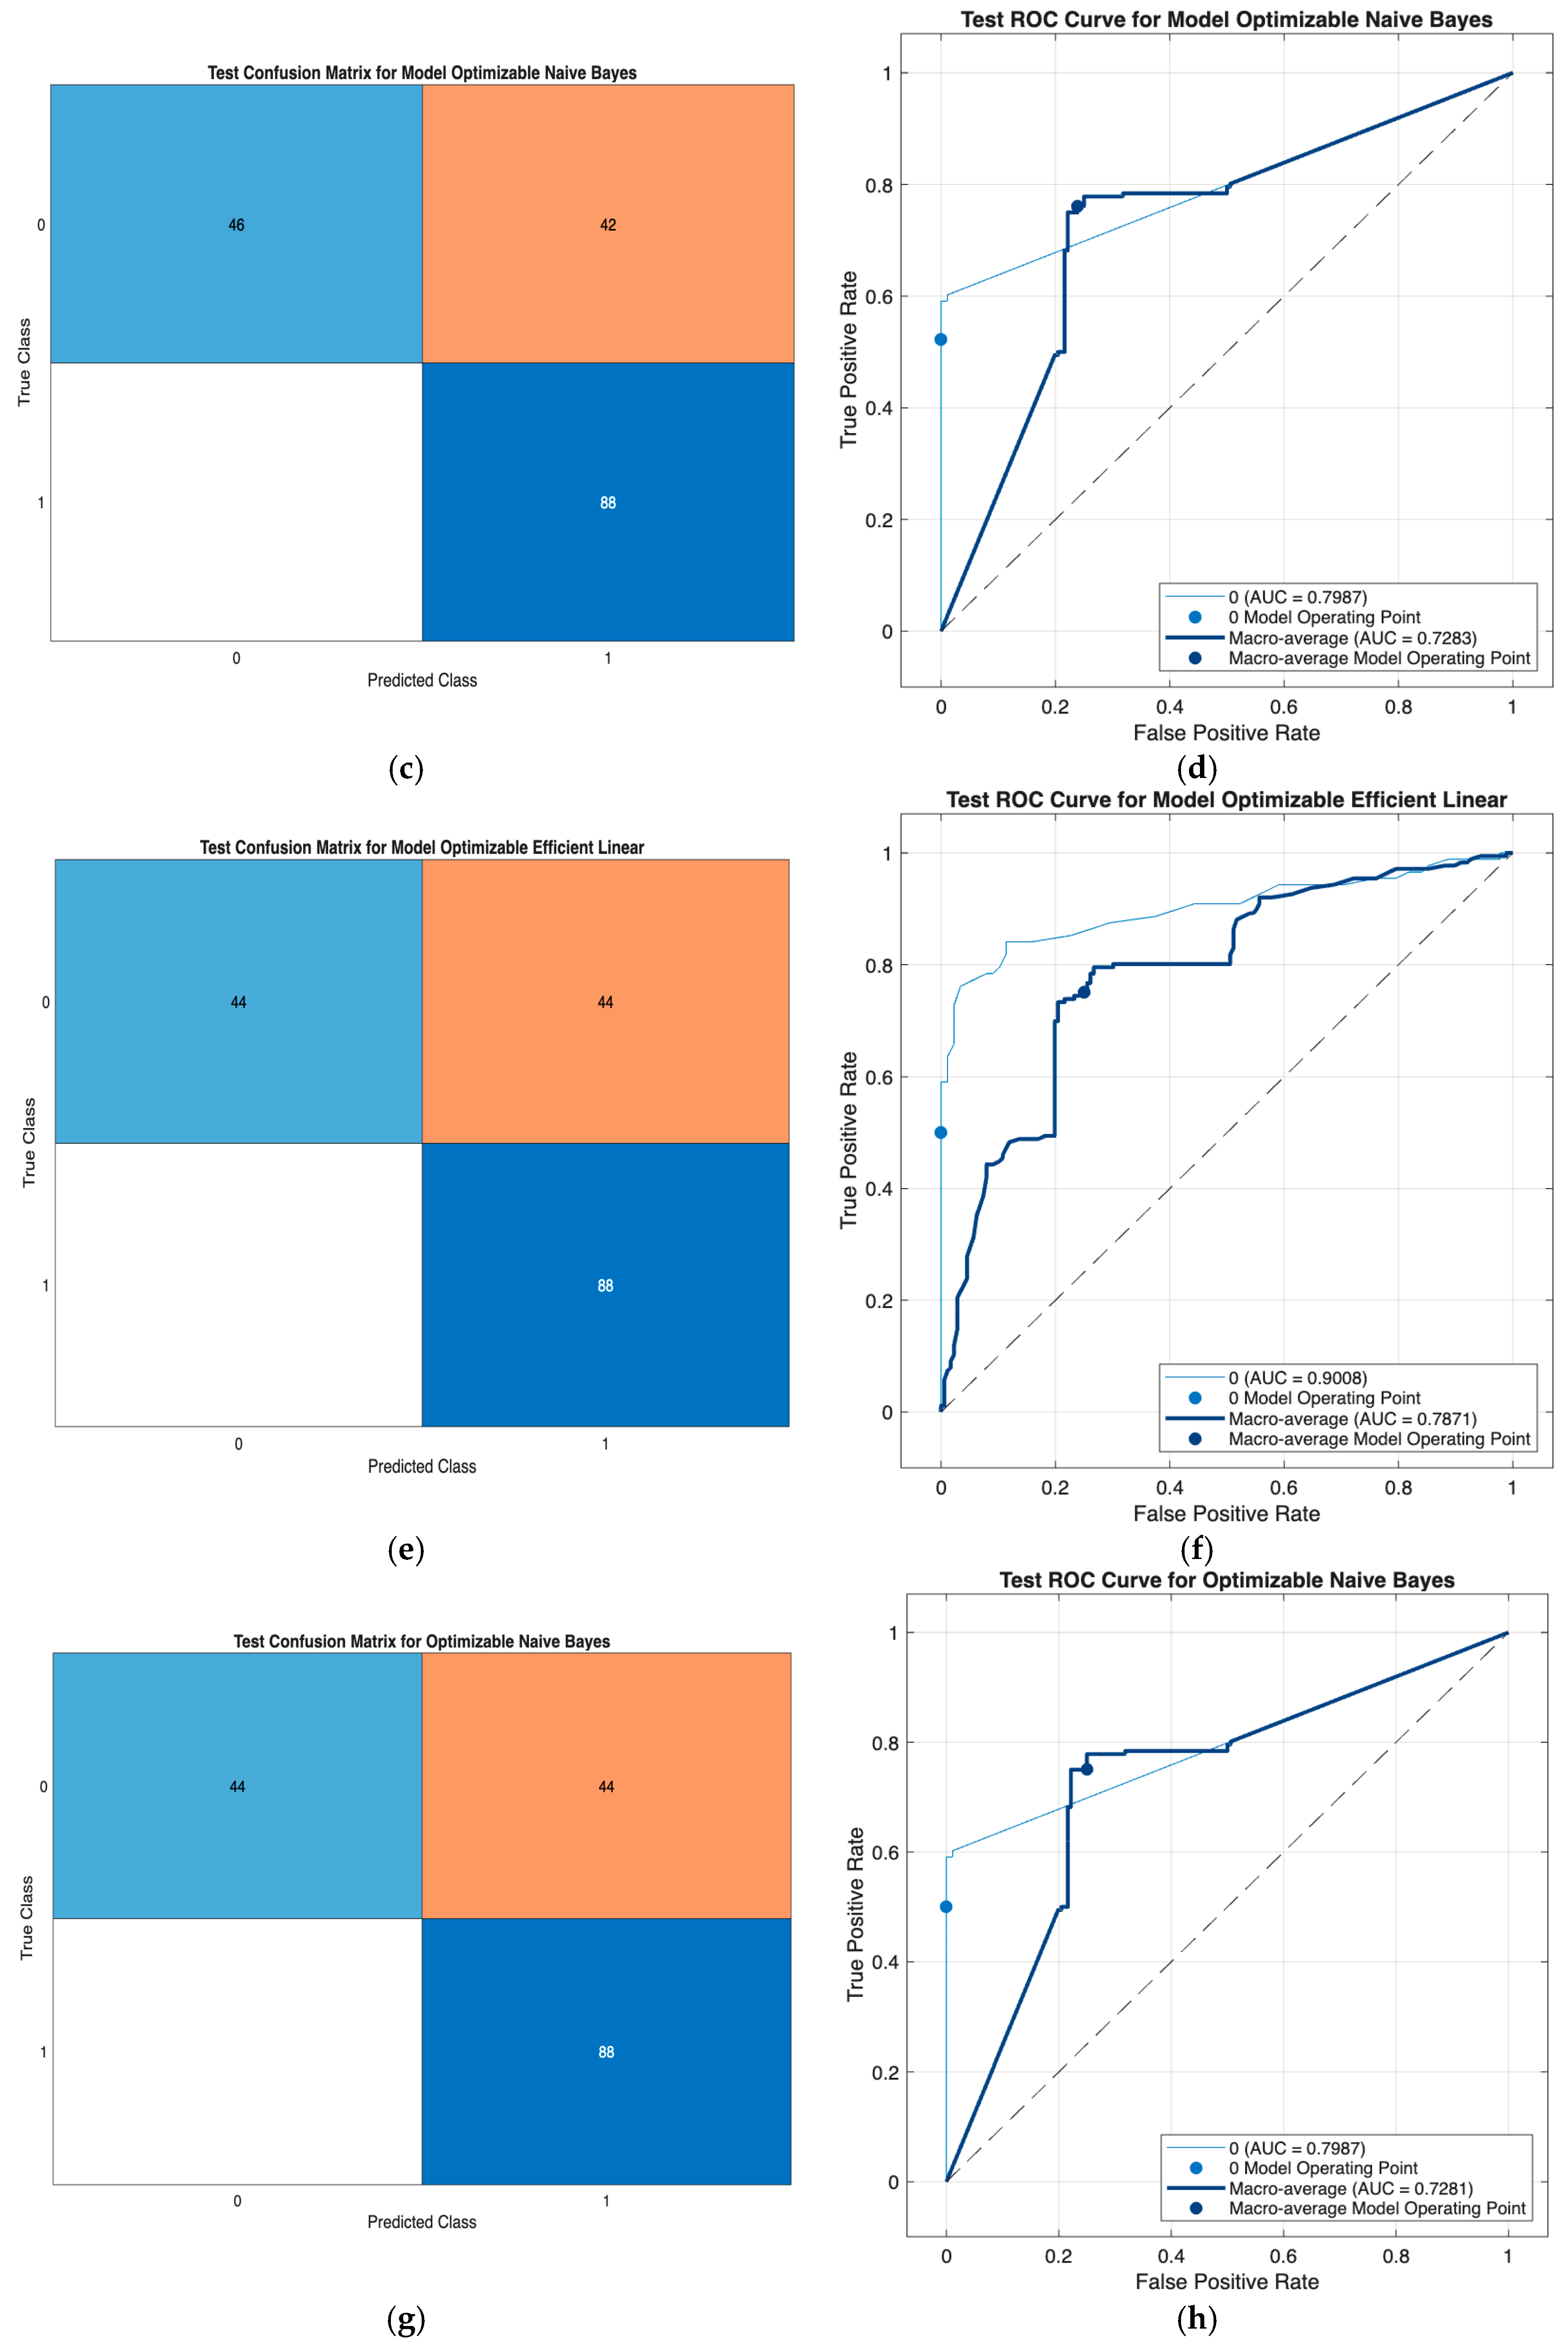
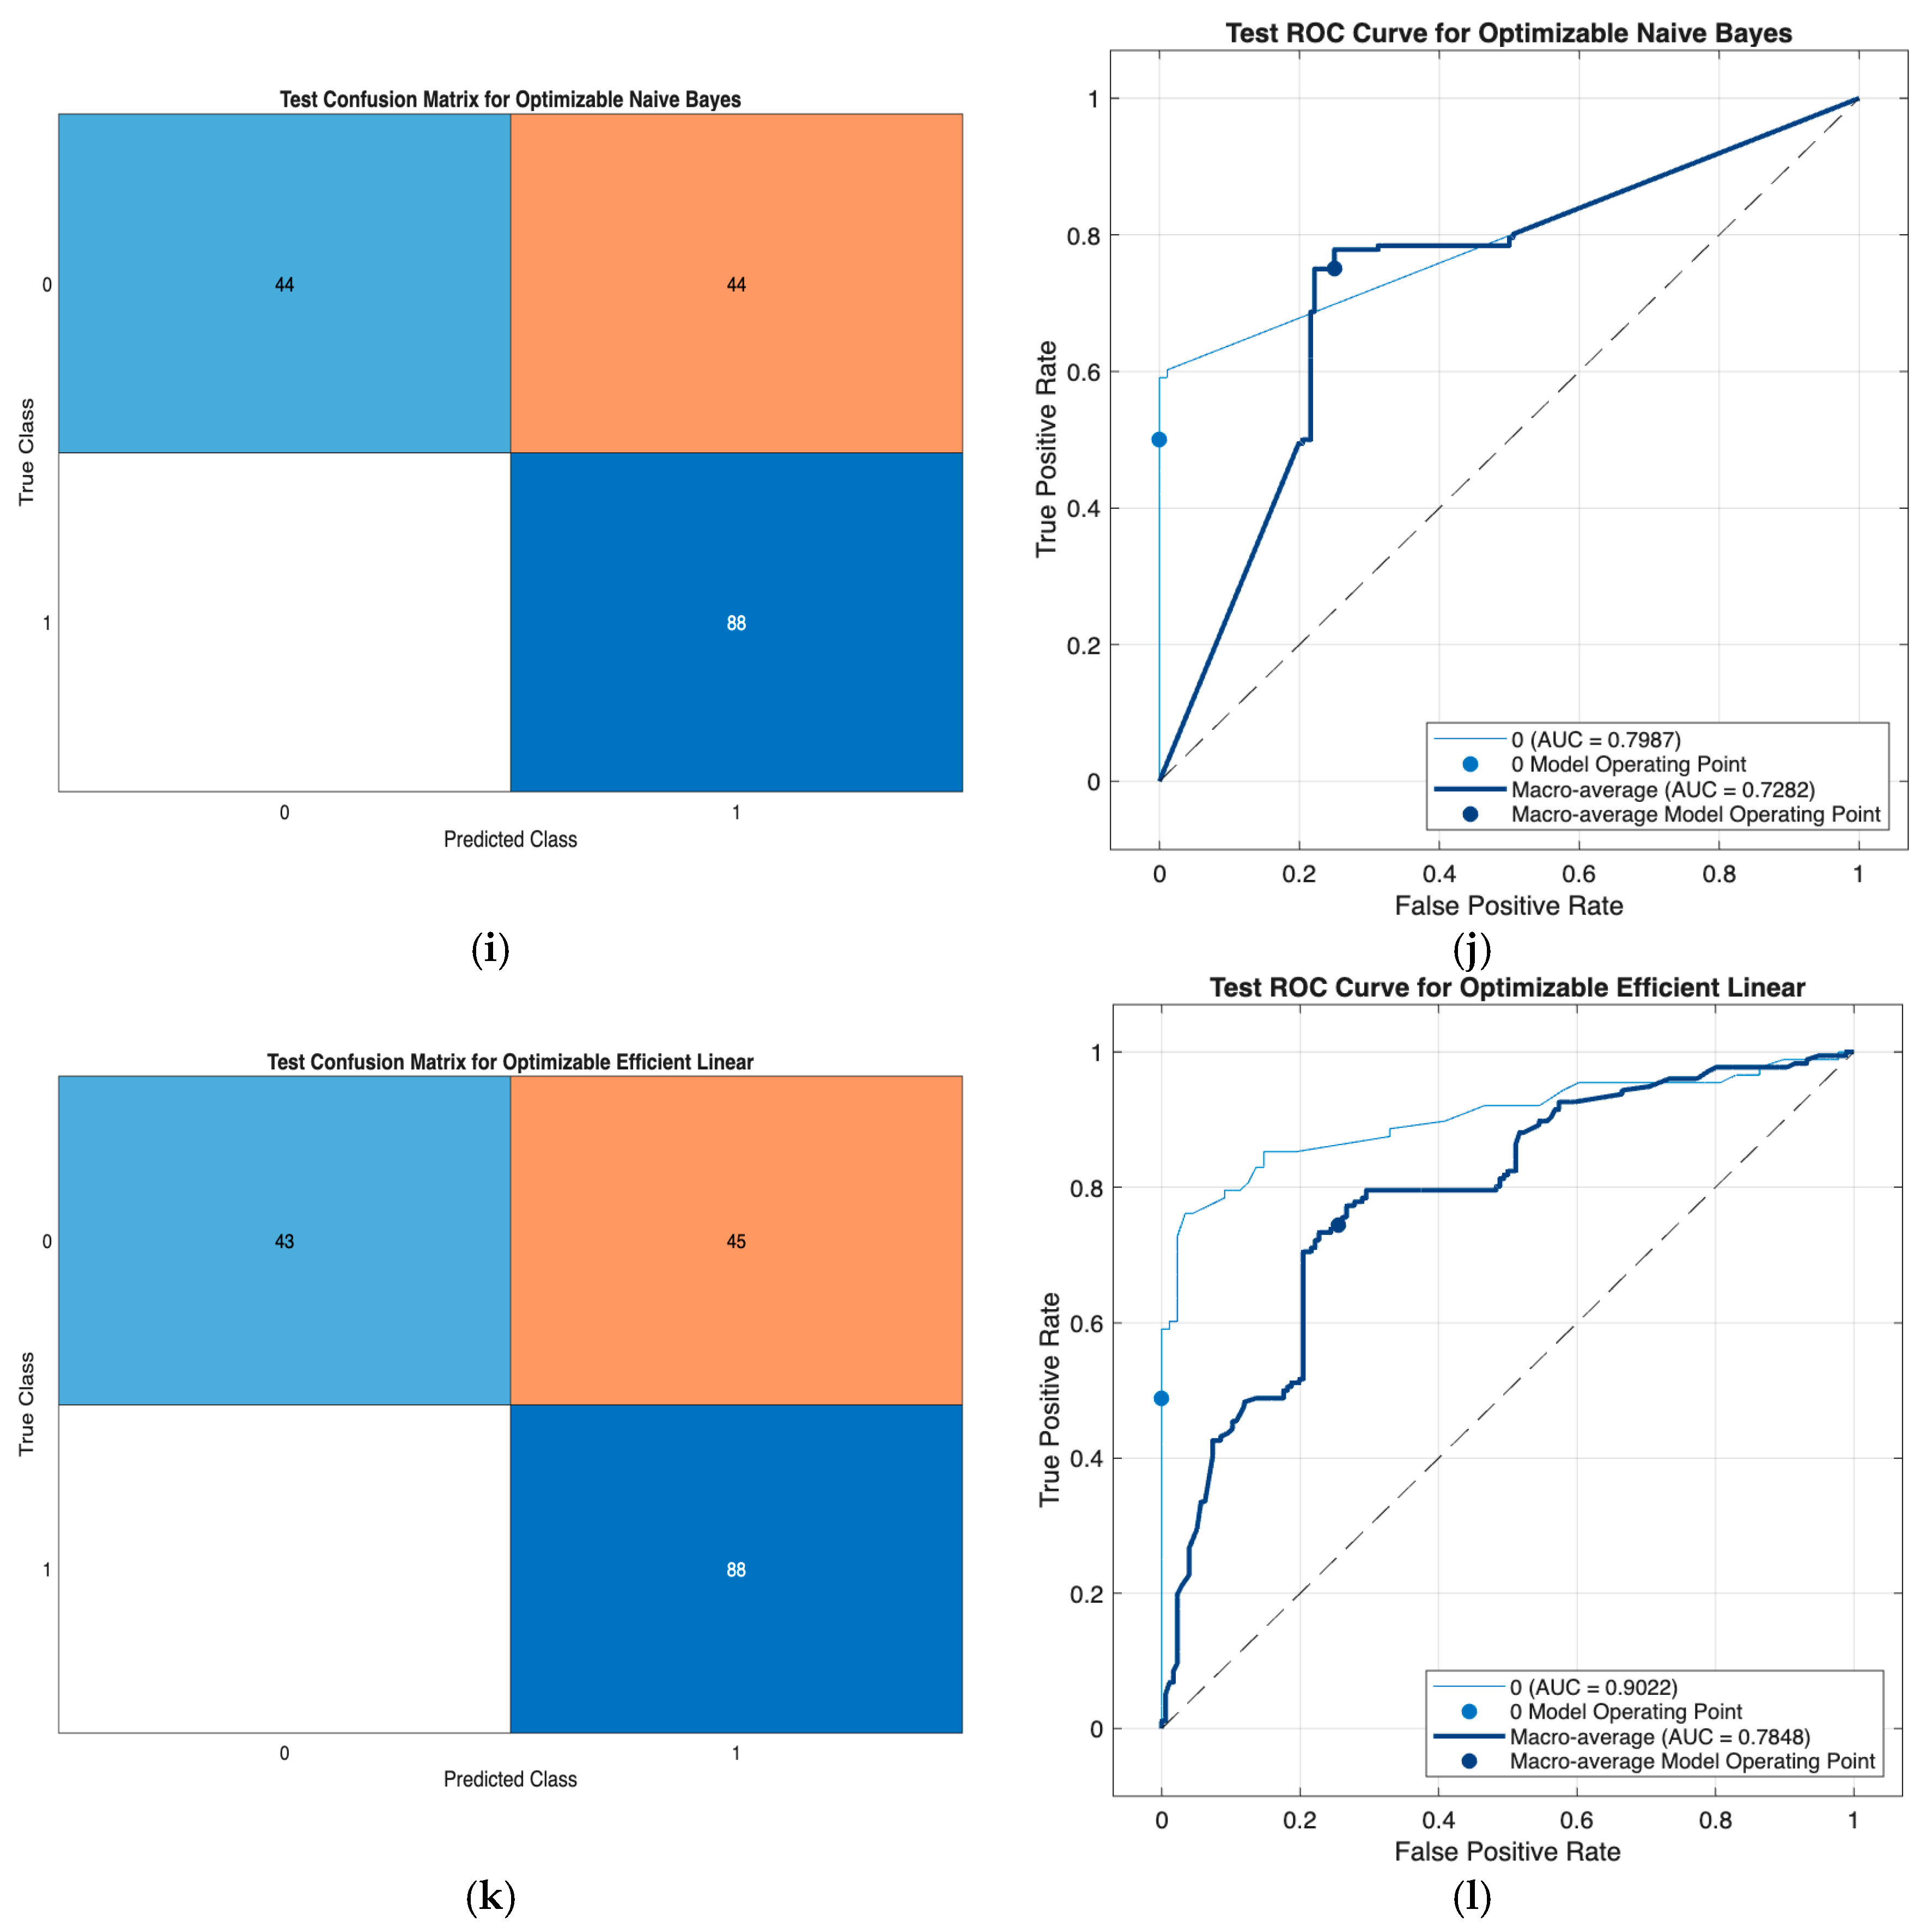
From Figure 4, external test-set evaluation demonstrated that both Naïve Bayes and Efficient Linear classifiers maintained stable and comparable performance across Cases 5–7 and 11. The confusion matrices indicate balanced classification behavior with consistent true-positive detection across models, while the ROC analyses show moderate to good discriminative ability under external validation.
Among the evaluated configurations, Case 11 (Age + Medications + Gender) exhibited a favorable balance between accuracy and AUC, particularly for the Efficient Linear classifier, which achieved competitive discrimination with a simple model structure. Overall, the results suggest that minimal and near-minimal feature models retain acceptable robustness under distributional shift, with Case 11 offering an efficient and methodologically attractive configuration for external evaluation.
All experimental configurations evaluated in this study are summarized in Table 9, encompassing models derived from statistical inference, machine learning feature importance, and their unified integration. This table provides a transparent overview of feature selection rationale and enables direct comparison across all cases.

4. Discussion

This study systematically examined the stability and predictive contribution of demographic, clinical, and lifestyle factors for osteoporosis risk prediction using an integrated framework combining statistical modeling, feature selection algorithms, and machine learning classifiers. Across all analytical approaches—including logistic regression, likelihood ratio testing, MRMR, ReliefF, and unified importance ranking—Age consistently emerged as the most dominant and stable predictor. Importantly, this dominance should be interpreted primarily as a dataset-driven effect, reflecting age imbalance and correlated feature structures within heterogeneous data sources, rather than as a novel or independent clinical discovery. In this context, age serves as an illustrative example of how a single variable can repeatedly surface across diverse machine learning pipelines due to underlying dataset characteristics, thereby influencing feature stability and apparent model sufficiency. While the observed prominence of age is consistent with well-established biological and epidemiological evidence regarding age-related decline in bone mineral density, the principal contribution of this study lies in demonstrating how such known risk factors behave within different feature selection frameworks under real-world data constraints.
Among secondary predictors, corticosteroid medication use was the only variable showing a statistically meaningful and biologically plausible association with osteoporosis, supporting its role as a clinically relevant complement to age. In contrast, other demographic and lifestyle variables—including gender, family history, race/ethnicity, nutritional intake, smoking, alcohol consumption, and physical activity—exhibited limited incremental discriminative value once age was accounted for, as reflected by weak effect sizes and consistently low feature-importance scores.
Machine learning experiments across multiple feature selection scenarios demonstrated that minimal and near-minimal models achieved predictive performance comparable to more complex multi-feature configurations. Notably, both the single-predictor model (Age only) and the two-predictor model (Age plus Medications) maintained strong internal performance. This observation should be interpreted primarily as a dataset-driven effect, reflecting age imbalance and correlated feature structures within the analyzed data, rather than as evidence of a novel or exclusive clinical role of age. In this context, the dominance of age illustrates how heterogeneous data distributions can lead to the consistent emergence of a single variable across machine learning pipelines, thereby influencing feature stability and apparent model sufficiency. These findings reinforce the methodological value of parsimony while highlighting the importance of cautious interpretation when dominant predictors arise from dataset characteristics rather than independent biological discovery.
External validation using retrospective clinical records further demonstrated that model performance decreased under distributional shift, as expected, yet remained acceptable. Across the evaluated configurations, Naïve Bayes and Efficient Linear classifiers showed the most stable external behavior. In particular, models incorporating Age, Medications, and Gender (Case 11) achieved a favorable balance between accuracy and discriminative ability, while maintaining lower computational cost, making them methodologically attractive for external evaluation under constrained data settings.
Importantly, these findings should be interpreted as methodological validation of stability-driven feature selection rather than evidence of newly identified clinical risk factors or readiness for clinical deployment. Simplified models should therefore be regarded as complementary analytical tools for exploratory or preliminary risk stratification, not as standalone screening or diagnostic instruments.
Future research should focus on larger, multi-center cohorts with greater demographic heterogeneity, alongside the integration of additional high-value data sources—such as imaging biomarkers and longitudinal fracture outcomes—to more rigorously assess generalizability, stability, and translational relevance.

5. Conclusions

This study demonstrates that stability-driven feature selection, integrated with statistical and machine learning analyses, enables the development of parsimonious and methodologically robust models for osteoporosis risk prediction. Across all analytical frameworks, age consistently emerged as the most reliable predictor, while corticosteroid use was the only additional variable providing meaningful and statistically significant predictive value. Other demographic, nutritional, and lifestyle factors contributed limited incremental information once age was accounted for. In addition, models incorporating gender alongside age and medication use—while still maintaining a near-minimal feature set—showed improved screening performances in selected external validation scenarios. This indicates that gender-related information can enhance discrimination without substantially increasing model complexity. Overall, minimal and near-minimal models, including age-only, age-plus-medication, and age–medication–gender configurations, achieved predictive performances comparable to more complex models. External validation confirmed that these streamlined models retain acceptable performances under population heterogeneity, although results should be interpreted as methodological evidence rather than justification for standalone clinical screening or diagnostic deployment. Future studies should extend validation to larger, multi-center cohorts and integrate longitudinal outcomes and imaging-derived biomarkers to further assess generalizability and clinical relevance.

Author Contributions

Conceptualization, W.W. and P.U.; methodology and software, W.C. and N.E.; validation, W.W., W.C. and P.U.; formal analysis, W.C.; data curation, W.W.; writing—original draft preparation, W.C.; writing—review and editing, W.W., N.E. and P.U.; supervision, W.W. All authors have read and agreed to the published version of the manuscript.

Funding

This study was supported by the revenue budget in 2025, School of Medicine, University of Phayao (Grant No. MD68-18) and Thailand Science Research and Innovation Fund (Fundamental Fund 2026, Grant No. 2253/2568).

Institutional Review Board Statement

This study was conducted in accordance with the Declaration of Helsinki, the Belmont report, CIOMS Guideline international conference on Harmonization in Good Cinical Pratice or ICH-GCP and with approval from the Human Research Ethics Committee of University of Phayao on Health Sciences and Sciences and Technology (Institutional Review Board (IRB) approval, IRB Number: HREC-UP-HSST 1.1/005/69 and 17 October 2025).

Informed Consent Statement

Patient consent was waived due to the data used in our study were obtained from the official hospital database of the University of Phayao Hospital. These data consist of retrospective statistical records without any personal identifiers and were provided with formal permission for research use. This study has been reviewed and approved by The Human Research Ethics Committee of University of Phayao on Health Sciences and Sciences and Technology and has been classified as Exempted, as it involves secondary analysis of anonymized data.

Data Availability Statement

The open-access dataset used in this study, Lifestyle Factors Influencing Osteoporosis, is publicly available on Kaggle and contains 1958 complete records comprising demographic, lifestyle, nutritional, hormonal, and medical variables relevant to osteoporosis risk. This dataset can be accessed at: https://www.kaggle.com/datasets/amitvkulkarni/lifestyle-factors-influencing-osteoporosis (accessed on 20 August 2025). The retrospective clinical dataset used for external validation was obtained from the University of Phayao Hospital and includes 176 patient records collected between 2018 and 2025. Due to ethical and institutional regulations, this hospital dataset is not publicly available, but may be accessed upon reasonable request to the corresponding author and with appropriate ethics approval.

Acknowledgments

W. Woratamrongpatai and P. Udomluck would like to thank the revenue budget in 2025, School of Medicine, University of Phayao (Grant No. MD68-18). W. Cholamjiak and N. Eiamniran would like to thank University of Phayao and Thailand Science Research and Innovation Fund (Fundamental Fund 2026, Grant No. 2253/2568). During the preparation of this manuscript, the authors used ChatGPT (GPT-5, OpenAI, 2025) for language refinement, grammar correction, and improvement of academic phrasing in the Abstract, Methods, and Discussion sections. The tool was used solely to enhance clarity and readability; it did not generate scientific ideas, perform data analysis, or contribute to the interpretation of results. All scientific content, clinical interpretation, and conclusions were developed, verified, and approved by the authors, who take full responsibility for the integrity and accuracy of the work. The authors have reviewed and edited the output and take full responsibility for the content of this publication.

Conflicts of Interest

The authors declare no conflicts of interest.

References

  1. Consensus Development Panel. Osteoporosis prevention, diagnosis, and therapy. NIH Consens. Statement 2000, 17, 1–45. [Google Scholar]
  2. Johnell, O.; Kanis, J.A. An estimate of the worldwide prevalence and disability associated with osteoporotic fractures. Osteoporos. Int. 2006, 17, 1726–1733. [Google Scholar] [CrossRef] [PubMed]
  3. Sözen, T.; Özışık, L.; Başaran, N.C. An overview and management of osteoporosis. Eur. J. Rheumatol. 2016, 4, 46. [Google Scholar] [CrossRef] [PubMed]
  4. Hernlund, E.; Svedbom, A.; Ivergård, M.; Compston, J.; Cooper, C.; Stenmark, J.; McCloskey, E.V.; Jonsson, B.; Kanis, J.A. Osteoporosis in the European Union: Medical management, epidemiology and economic burden. Arch. Osteoporos. 2013, 8, 136. [Google Scholar] [CrossRef]
  5. Riggs, B.L.; Khosla, S.; Melton, L.J. Sex steroids and the construction and conservation of the adult skeleton. Endocr. Rev. 2002, 23, 279–302. [Google Scholar] [CrossRef]
  6. Cortet, B.; Vasseur, J.; Grardel, B.; Catanzariti, L.; Marchandise, X.; Delcambre, B. Management of male osteoporosis. Jt. Bone Spine 2001, 68, 252–256. [Google Scholar] [CrossRef]
  7. Haentjens, P.; Magaziner, J.; Colón-Emeric, C.S.; Vanderschueren, D.; Milisen, K.; Velkeniers, B.; Boonen, S. Excess mortality after hip fracture among older adults. Ann. Intern. Med. 2010, 152, 380–390. [Google Scholar] [CrossRef]
  8. Morley, J.E. Osteoporosis and fragility fractures. J. Am. Med. Dir. Assoc. 2011, 12, 389–392. [Google Scholar] [CrossRef]
  9. Kanis, J.A. Assessment of Osteoporosis at the Primary Health-Care Level; WHO Collaborating Centre for Metabolic Bone Diseases; University of Sheffield: Sheffield, UK, 2007. [Google Scholar]
  10. Watts, N.B. The fracture risk assessment tool (FRAX®): Applications in clinical practice. J. Womens Health 2011, 20, 525–531. [Google Scholar] [CrossRef]
  11. Adler, R.A.; El-Hajj Fuleihan, G.; Bauer, D.C.; Camacho, P.M.; Clarke, B.L.; Clines, G.A.; Compston, J.E.; Drake, M.T.; Edwards, B.J.; Favus, M.J.; et al. Managing osteoporosis in patients on long-term bisphosphonate treatment: Report of a task force of the American Society for Bone and Mineral Research. J. Bone Miner. Res. 2016, 31, 16–35. [Google Scholar] [CrossRef]
  12. Nayak, S.; Edwards, D.L.; Saleh, A.A.; Greenspan, S.L. Performance of risk assessment instruments for predicting osteoporotic fracture risk: A systematic review. Osteoporos. Int. 2014, 25, 23–49. [Google Scholar] [CrossRef] [PubMed]
  13. Compston, J.; McClung, M.; Leslie, W.D. Osteoporosis. Lancet 2019, 393, 364–376. [Google Scholar] [CrossRef] [PubMed]
  14. Högler, W.; Ward, L. Osteoporosis in children with chronic disease. Endocr. Dev. 2015, 28, 176–195. [Google Scholar] [PubMed]
  15. Van Staa, T.P.; Leufkens, H.G.M.; Cooper, C. The epidemiology of corticosteroid-induced osteoporosis: A meta-analysis. Osteoporos. Int. 2002, 13, 777–787. [Google Scholar] [CrossRef]
  16. Weinstein, R.S. Glucocorticoid-induced bone disease. In Primer on the Metabolic Bone Diseases and Disorders of Mineral Metabolism, 8th ed.; Rosen, C.J., Ed.; Wiley-Blackwell: Hoboken, NJ, USA, 2013; pp. 473–481. [Google Scholar]
  17. Kanis, J.A.; Johnell, O.; Odén, A.; Johansson, H.; McCloskey, E.V. FRAX™ and the assessment of fracture probability in men and women from the UK. Osteoporos. Int. 2008, 19, 385–397. [Google Scholar] [CrossRef]
  18. McCloskey, E.V.; Harvey, N.C.; Johansson, H.; Kanis, J.A. FRAX updates 2016. Curr. Opin. Rheumatol. 2016, 28, 433–441. [Google Scholar] [CrossRef]
  19. Rubin, K.H.; Abrahamsen, B.; Friis-Holmberg, T.; Hjelmborg, J.V.; Bech, M.; Hermann, A.P.; Barkmann, R.; Glüer, C.C.; Brixen, K. Comparison of different screening tools (FRAX®, OST, ORAI, OSIRIS, SCORE and age alone) to identify women with increased risk of fracture: A population-based prospective study. Bone 2013, 56, 16–22. [Google Scholar] [CrossRef]
  20. Johannesdottir, F.; Allaire, B.; Bouxsein, M.L. Fracture prediction by computed tomography and finite element analysis: Current and future perspectives. Curr. Osteoporos. Rep. 2018, 16, 411–422. [Google Scholar] [CrossRef]
  21. Jiang, F.; Jiang, Y.; Zhi, H.; Dong, Y.; Li, H.; Ma, S.; Wang, Y. Artificial intelligence in healthcare: Past, present and future. Stroke Vasc. Neurol. 2017, 2, 230–243. [Google Scholar] [CrossRef]
  22. LeCun, Y.; Bengio, Y.; Hinton, G. Deep learning. Nature 2015, 521, 436–444. [Google Scholar] [CrossRef]
  23. Panch, T.; Szolovits, P.; Atun, R. Artificial intelligence, machine learning and health systems. J. Glob. Health 2018, 8, 020303. [Google Scholar] [CrossRef] [PubMed]
  24. Sariişik, G.; Öğütlü, A.S. Machine learning-driven optimization of energy efficiency in marble CNC machining for sustainable manufacturing. J. Tribol. 2025, 148, 14205. [Google Scholar] [CrossRef]
  25. Luo, W.; Wu, J.; Chen, Z.; Guo, P.; Zhang, Q.; Lei, B.; Chen, Z.; Li, S.; Li, C.; Liu, H.; et al. Evaluation of fragility fracture risk using deep learning based on ultrasound radio frequency signal. Endocrine 2024, 86, 800–812. [Google Scholar] [CrossRef] [PubMed]
  26. Jang, M.; Kim, M.; Bae, S.J.; Lee, S.H.; Koh, J.M.; Kim, N. Opportunistic osteoporosis screening using chest radiographs with deep learning: Development and external validation with a cohort dataset. J. Bone Miner. Res. 2020, 37, 369–377. [Google Scholar] [CrossRef]
  27. Kim, S.; Kim, B.R.; Chae, H.D.; Lee, J.; Ye, S.J.; Kim, D.H.; Hong, S.H.; Choi, J.-Y.; Yoo, H.J. Deep radiomics–based approach to the diagnosis of osteoporosis using hip radiographs. Radiol. Artif. Intell. 2022, 4, e210212. [Google Scholar] [CrossRef]
  28. Namireddy, S.R.; Gill, S.S.; Peerbhai, A.; Kamath, A.G.; Ramsay, D.S.; Ponniah, H.S.; Salih, A.; Jankovic, D.; Kalasauskas, D.; Neuhoff, J.; et al. Artificial intelligence in risk prediction and diagnosis of vertebral fractures. Sci. Rep. 2024, 14, 30560. [Google Scholar] [CrossRef]
  29. Nguyen, H.G. Identification of Asymptomatic Vertebral Fracture Using Artificial Intelligence Methods. Ph.D. Dissertation, University of Technology Sydney, Sydney, Australia, 2024. [Google Scholar]
  30. Shim, J.G.; Kim, D.W.; Ryu, K.H.; Cho, E.A.; Ahn, J.H.; Kim, J.I.; Lee, S.H. Application of machine learning approaches for osteoporosis risk prediction in postmenopausal women. Arch. Osteoporos. 2020, 15, 169. [Google Scholar] [CrossRef]
  31. Alden, Z.N.A.M.; Ata, O. Comprehensive comparison of osteoporosis prediction models. PeerJ Comput. Sci. 2024, 10, e2338. [Google Scholar] [CrossRef]
  32. Beam, A.L.; Kohane, I.S. Big data and machine learning in health care. JAMA 2018, 319, 1317–1318. [Google Scholar] [CrossRef]
  33. Sanclemente, G.L. Reliability: Understanding cognitive human bias in artificial intelligence for national security and intelligence analysis. Secur. J. 2022, 35, 1328–1348. [Google Scholar] [CrossRef]
  34. Gundersen, O.E.; Kjensmo, S. State of the art: Reproducibility in artificial intelligence. In Proceedings of the AAAI Conference on Artificial Intelligence, New Orleans, LA, USA, 2–7 February 2018; AAAI Press: Palo Alto, CA, USA, 2018; Volume 32. No. 1. [Google Scholar]
  35. Meinshausen, N.; Bühlmann, P. Stability selection. J. R. Stat. Soc. Ser. B Stat. Methodol. 2010, 72, 417–473. [Google Scholar] [CrossRef]
  36. Dormann, C.F.; Elith, J.; Bacher, S.; Buchmann, C.; Carl, G.; Carré, G.; Marquéz, J.R.G.; Gruber, B.; Lafourcade, B.; Leitão, P.J.; et al. Collinearity: A review of methods to deal with it and a simulation study evaluating their performance. Ecography 2013, 36, 27–46. [Google Scholar] [CrossRef]
  37. Xu, C.; Tao, D.; Xu, C. A survey on multi-view learning. arXiv 2013, arXiv:1304.5634. [Google Scholar] [CrossRef]
  38. Yang, Z.; Li, Q.; Liu, W.; Lv, J. Shared multi-view data representation for multi-domain event detection. IEEE Trans. Pattern Anal. Mach. Intell. 2019, 42, 1243–1256. [Google Scholar] [CrossRef] [PubMed]
  39. Biecek, P.; Burzykowski, T. Explanatory Model Analysis: Explore, Explain, and Examine Predictive Models; Chapman & Hall/CRC: Boca Raton, FL, USA, 2021. [Google Scholar]
  40. Molnar, C.; Casalicchio, G.; Bischl, B. Interpretable machine learning—A brief history, state-of-the-art and challenges. In Proceedings of the Joint European Conference on Machine Learning and Knowledge Discovery in Databases (ECML PKDD 2020), Ghent, Belgium, 14–18 September 2020; Lecture Notes in Computer Science. Cellier, P., Driessens, K., Eds.; Springer International Publishing: Cham, Switzerland, 2020; Volume 12457, pp. 417–431. [Google Scholar]
  41. Devnath, L.; Janzen, I.; Lam, S.; Yuan, R.; MacAulay, C. Predicting future lung cancer risk in low-dose CT screening patients with AI tools. In Medical Imaging 2025: Computer-Aided Diagnosis; SPIE: Bellingham, WA, USA, 2025; Volume 13407, pp. 634–639. [Google Scholar]
  42. Yuan, R.; Janzen, I.; Devnath, L.; Khattra, S.; Myers, R.; Lam, S.; MacAulay, C. MA19.11 Predicting future lung cancer risk with low-dose screening CT using an artificial intelligence model. J. Thorac. Oncol. 2023, 18, S174. [Google Scholar] [CrossRef]
  43. Kulkarni, A. Lifestyle Factors Influencing Osteoporosis. Available online: https://www.kaggle.com/datasets/amitvkulkarni/lifestyle-factors-influencing-osteoporosis (accessed on 20 August 2025).
  44. Riley, R.D.; Ensor, J.; Snell, K.I.E.; Debray, T.P.A.; Altman, D.G.; Moons, K.G.M.; Collins, G.S. External validation of clinical prediction models using big datasets from e-health records or IPD meta-analysis: Opportunities and challenges. BMJ 2016, 353, i3140. [Google Scholar] [CrossRef] [PubMed]
  45. Stevens, K.Y.R.; Meulenbroeks, D.; Houterman, S.; Gijsen, T.; Weyers, S.; Schoot, B.C. Prediction of unsuccessful endometrial ablation: A retrospective study. Gynecol. Surg. 2019, 16, 7. [Google Scholar] [CrossRef]
  46. Heus, P.; Damen, J.A.A.; Pajouheshnia, R.; Scholten, R.J.P.M.; Reitsma, J.B.; Collins, G.S.; Altman, D.G.; Moons, K.G.M.; Hooft, L. Uniformity in measuring adherence to reporting guidelines: The example of TRIPOD for assessing completeness of reporting of prediction model studies. BMJ Open 2019, 9, e025611. [Google Scholar] [CrossRef]
  47. McClung, M.R.; Miller, P.D.; Papapoulos, S.E. Osteoporosis: An overview. In Primer on the Metabolic Bone Diseases and Disorders of Mineral Metabolism, 8th ed.; Rosen, C.J., Ed.; Wiley-Blackwell: Hoboken, NJ, USA, 2018; pp. 393–397. [Google Scholar]
  48. Kanis, J.A.; Cooper, C.; Rizzoli, R.; Reginster, J.-Y.; Scientific Advisory Board of the European Society for Clinical and Economic Aspects of Osteoporosis (ESCEO); Committees of Scientific Advisors and National Societies of the International Osteoporosis Foundation (IOF). European guidance for the diagnosis and management of osteoporosis in postmenopausal women. Osteoporos. Int. 2019, 30, 3–44. [Google Scholar] [CrossRef]
Figure 1. Age distribution (a) and Q–Q plots (b) for osteoporosis vs. non-osteoporosis groups. The non-osteoporosis group shows a younger and narrower age range, while the osteoporosis group displays an older and wider distribution, with both groups deviating from normality.
Jcm 15 00677 g001
Figure 2. Overall workflow of the stability-driven osteoporosis prediction framework.
Jcm 15 00677 g002
Figure 3. Combined Feature Importance Based on MRMR and ReliefF Algorithms.
Jcm 15 00677 g003
Figure 4. External test-set evaluation for Case 5–7, 11 models using Naïve Bayes and Efficient Linear classifiers. Panels (a,c,e,g,i,k) show the confusion matrices for the Optimizable Naïve Bayes (Case 5), Optimizable Naïve Bayes (Case 6), Optimizable Efficient Linear (Case 6), Optimizable Naïve Bayes (Case 7), Optimizable Naïve Bayes (Case 11), and Optimizable Efficient Linear (Case 11) models, respectively. Panels (b,d,f,h,j,l) show the ROC curve for the Optimizable Naïve Bayes (Case 5), Optimizable Naïve Bayes (Case 6), Optimizable Efficient Linear (Case 6), Optimizable Naïve Bayes (Case 7), Optimizable Naïve Bayes (Case 11), and Optimizable Efficient Linear (Case 11) models.
Jcm 15 00677 g004aJcm 15 00677 g004bJcm 15 00677 g004c
Table 1. Baseline Characteristics of Participants (N = 1958).
CharacteristicNon-Osteoporosis (n = 979)Osteoporosis (n = 979)Total
Age (years)Mean = 24.3 ± 6.11 Median = 22Mean = 53.9 ± 21.0 Median = 53
Gender
  Male490 (50.1%)502 (51.3%)992 (50.7%)
  Female489 (49.9%)477 (48.7%)966 (49.3%)
Hormonal Changes
  Normal25.4%24.7%50.1%
  Postmenopausal24.6%25.3%49.9%
Family History of OsteoporosisBalanced (%)Balanced (%)
Race/Ethnicity
  African American17.2%17.6%34.8%
  Asian16.2%16.0%32.2%
  Caucasian16.6%16.4%33.0%
Body Weight Category
  Underweight22.9%24.7%47.6%
  Normal27.1%25.3%52.4%
Calcium Intake
  Adequate24.3%24.5%48.8%
  Low25.7%25.5%51.2%
Vitamin D Intake
  Sufficient25.4%26.3%51.7%
  Insufficient24.6%23.7%48.3%
Physical Activity
  Active26.6%25.6%52.2%
  Sedentary23.4%24.4%47.8%
Smoking Status
  Smoker25.5%24.7%50.2%
  Non-Smoker24.5%25.3%49.8%
Alcohol Consumption
  Yes24.7%24.8%49.5%
  No25.3%25.2%50.5%
Medical Conditions
  Hyperthyroidism17.1%17.5%34.6%
  Rheumatoid Arthritis16.1%16.2%32.3%
  None16.8%16.2%33.0%
Medications
  Yes24.0%25.7%49.7%
  No26.0%24.3%50.3%
Prior Fractures
  Yes24.7%25.5%50.2%
  No25.3%24.5%49.8%
Table 2. Combined Summary of Predictors from Logistic Regression and Likelihood Ratio Tests.
Predictorχ2 (LR Test)p (LR)EstimateSEZp (Model)OR95% CI (Lower–Upper)
Age1329.604<0.0010.157940.0077420.4029<0.0011.171091.15346–1.18900
Gender (Female–Male)0.004730.9450.009360.136090.06880.9451.009400.77307–1.31798
Hormonal Changes (Postmenopausal–Normal)0.174910.6760.056860.135960.41820.6761.058510.81090–1.38172
Family History (Yes–No)0.020480.8860.019460.135990.14310.8861.019650.78108–1.33109
Race/Ethnicity (Asian–African American)1.295130.5230.190550.167711.13620.2561.209920.87097–1.68078
Race/Ethnicity (Caucasian–African American)0.102210.166890.61250.5401.107620.79860–1.53621
Body Weight (Underweight–Normal)0.282780.5950.072450.136210.53190.5951.075140.82323–1.40414
Calcium Intake (Adequate–Low)0.041840.8380.027820.136020.20460.8381.028210.78759–1.34325
Vitamin D Intake (Insufficient–Sufficient)0.445840.504−0.090810.13605−0.66750.5040.913190.69945–1.19224
Physical Activity (Sedentary–Active)0.326350.5680.077840.136260.57120.5681.080950.82760–1.41185
Smoking (Yes–No)2.907760.088-0.232050.13628−1.70270.0890.792910.60704–1.03568
Alcohol Consumption (Moderate–None)0.039520.842-0.027050.13609−0.19880.8420.973310.74543–1.27085
Medical Conditions (Hyperthyroidism–None)1.365410.505−0.025020.16450−0.15210.8790.975290.70650–1.34634
Medical Conditions (Rheumatoid Arthritis–None)−0.181460.16728−1.08480.2780.834050.60009–1.15767
Medications (Corticosteroids–None)5.042300.0250.305050.136202.23970.0251.356701.03884–1.77181
Prior Fractures (Yes–No)2.310250.1290.207310.136541.51820.1291.230360.94147–1.60789
Table 3. Model performance for age as a continuous predictor (cut-off = 0.5).
ModelAccuracySensitivitySpecificityAUCDevianceAICBICMcFadden’s R2Tjur’s R2
Full model0.8260.7810.8700.9061377141115060.4930.551
Reduced model0.8250.7810.8690.9061377140514830.4930.551
Two-Feature Model0.8270.7830.8700.9041386139214090.4890.547
Table 4. Ranked Feature Importance (Average of MRMR and ReliefF Scores).
RankFeatureMRMRReliefFAverage Importance
1Age0.23930.19030.2148
2Medical_Condition10.00020.00450.00235
3CalciumIntake0.00000.00210.00105
4AlcoholConsumption0.00000.00130.00065
5PhysicalActivity0.00000.00070.00035
6BodyWeight0.0004−0.0260−0.0128
7Gender0.00000.00060.00030
8Race_Ethnicity_C0.0000−0.0011−0.00055
9Medical_Condition20.0000−0.0085−0.00425
10PriorFractures0.0000−0.0037−0.00185
11VitaminDIntake0.0000−0.0079−0.00395
12Race_Ethnicity_As0.0000−0.0094−0.00470
13FamilyHistory0.0000−0.0133−0.00665
14Smoking0.0000−0.0134−0.00670
15Medications_None0.0000−0.0134−0.00670
16HormonalChanges0.0000−0.0184−0.00920
Table 5. Performance comparison of five machine learning classifiers across six feature selection scenarios (Case 1–Case 6).
Model TypeTraining Time (s)Accuracy % (Validation)Precision %Recall %F1 Score %AUC
Case 1Tree44.7390.6091.8790.6090.530.9507
Naive Bayes201.5686.0687.9986.0685.880.9363
SVM440.8485.6087.0885.6085.450.9181
Efficient Linear238.6182.9483.5782.9482.860.9159
KNN267.9985.9686.4685.9685.910.9231
Case 2Tree18.0191.0692.2691.0691.000.9540
Naive Bayes62.5686.3688.2886.3686.190.9384
SVM497.2587.6987.8887.6987.680.8751
Efficient Linear36.8983.3083.8783.3083.230.9189
KNN33.9486.4187.5786.4186.310.8970
Case 3Tree15.3891.0692.2991.0691.000.9527
Naive Bayes62.6786.1188.0786.1185.930.9386
SVM269.3889.8990.6089.8989.840.9041
Efficient Linear57.4583.0983.5783.0983.030.9193
KNN62.8190.1991.2790.1990.130.9362
Case 4Tree14.7291.1692.4991.1691.090.9541
Naive Bayes49.3286.1688.0686.1685.980.9386
SVM141.7091.1692.3491.1691.100.9218
Efficient Linear41.3982.9983.5482.9982.920.9193
KNN28.9191.1692.3491.1691.100.9459
Case 5Tree620.4591.4292.6891.4291.360.9544
Naive Bayes1215.5686.4188.2486.4186.250.9388
SVM808.8491.4292.6891.4291.360.9253
Efficient Linear42.6083.4083.6783.4083.370.9115
KNN62.2691.4292.6891.4291.360.9499
Case 6Tree12.6791.4292.6891.4291.360.9548
Naive Bayes644.5886.2187.7986.2186.070.9383
SVM1234.2691.4292.6891.4291.360.9094
Efficient Linear42.0585.2486.5585.2485.110.9187
KNN49.8791.4292.6891.4291.360.9541
Table 6. Unified ranking of osteoporosis predictors based on combined statistical (logistic regression estimates) and machine learning feature importance (average MRMR + ReliefF) scores.
RankFeatureEstimate (abs)Average ImportanceCombined Score
1Age0.157940.21480.1864
2Medications (Corticosteroids)0.3050500.1525
3Smoking0.23205−0.006700.1127
4PriorFractures0.20731−0.001850.1027
5Race_Ethnicity_C0.19055−0.000550.095
6Medical_Condition20.18146−0.004250.0886
7Race_Ethnicity_As0.10221−0.004700.0484
8VitaminDIntake0.09081−0.003950.0434
9PhysicalActivity0.077840.000350.0391
10BodyWeight0.07245−0.01280.0298
11HormonalChanges0.05686−0.009200.0238
12CalciumIntake0.027820.001050.0144
13AlcoholConsumption0.027050.000650.0138
14Medical_Condition10.025020.002350.0137
15Medications_None0.0305−0.006700.0119
16FamilyHistory0.01946−0.006650.0064
17Gender0.009360.00030.0048
Table 7. Performance of machine learning classifiers across three expanded feature selection scenarios (Case 7–11).
Model TypeTraining Time (s)Accuracy % (Validation)Precision % Recall %F1 Score %AUC
Case 7Tree23.6191.4292.6891.4291.360.9542
Naive Bayes40.4386.3188.1386.3186.150.9388
SVM135.0991.4292.6891.4291.360.9293
Efficient Linear56.3783.6684.2683.6683.580.9182
KNN57.7991.4292.6891.4291.360.9447
Case 8Tree19.9591.0192.1191.0190.950.9515
Naive Bayes61.3286.3688.1786.3686.200.9389
SVM294.9089.8990.6589.8989.840.9023
Efficient Linear40.4183.7184.4483.7183.620.9194
KNN36.2390.3091.4690.3090.230.9338
Case 9Tree21.2091.1692.2591.1691.110.9521
Naive Bayes59.6886.2188.0686.2186.040.9387
SVM544.2387.2887.4087.2887.270.8747
Efficient Linear39.7683.5584.2383.5583.470.9184
KNN32.9888.7689.4488.7688.720.9204
Case 10Tree1.3090.8191.8790.8190.750.9214
Naive Bayes44.6386.4788.2186.4786.310.9199
SVM229.3389.9991.0989.9989.920.9133
Efficient Linear53.0383.6684.4083.6683.570.9137
KNN69.5591.0192.1191.0190.950.9132
Case 11Tree1.1691.4292.6891.4291.360.9238
Naive Bayes30.4486.4188.2886.4186.250.9200
SVM907.6791.0192.1191.0190.950.9107
Efficient Linear765.4482.5882.7582.5882.560.8940
KNN585.7891.4292.6891.4291.360.9192
Table 8. External validation results of minimal-feature models (Case 5 and Case 6) using retrospective hospital records.
Model NumberModel TypeAccuracy % (Validation)Accuracy % (Test)Precision % (Test)Recall % (Test)F1 Score % (Test)AUC
Case 5Tree91.4274.4383.0874.4372.640.6818
Naive Bayes86.4175.0083.3375.0073.330.7281
SVM91.4274.4383.0874.4372.640.7627
Efficient Linear83.4073.3082.5973.3071.240.7670
KNN91.4274.4383.0874.4372.640.6818
Case 6Tree91.4274.4383.0874.4372.640.6818
Naive Bayes86.2176.1483.8576.1474.700.7282
SVM91.4274.4383.0874.4372.640.7306
Efficient Linear85.2475.0083.3375.0073.330.7870
KNN91.4274.4383.0874.4372.640.6818
Case 7Tree91.4274.4383.0874.4372.640.7443
Naive Bayes86.3175.0083.3375.0073.330.7987
SVM91.4274.4383.0874.4372.640.7457
Efficient Linear83.6674.4383.0874.4372.640.9017
KNN91.4274.4383.0874.4372.640.7443
Case 11Tree91.4274.4383.0874.4372.640.7443
Naive Bayes86.4176.1483.3375.0073.330.7987
SVM91.0174.4383.0874.4372.640.9107
Efficient Linear82.5875.0083.0874.4372.640.9022
KNN91.4274.4383.0874.4372.640.7443
Table 9. Summary of experimental cases based on statistical analysis, machine learning feature importance, and combined ranking strategies.
CaseSelection BasisModel DescriptionIncluded PredictorsMethodological Purpose
Full ModelStatistical analysis (Table 2)ComprehensiveAll predictorsBaseline model capturing maximum explanatory power
Reduced ModelStatistical analysis (Table 2)Simplified Screening ModelAll except Gender, Family History, AlcoholImprove parsimony and interpretability with minimal performance loss
Two-Feature ModelStatistical analysis (Table 2)Minimal Predictive ModelAge, Medications (corticosteroids)Minimal statistically supported screening model
Case 1Feature importance
(Table 4)
Full-Predictor ModelAll predictorsReference model for ML-based ranking
Case 2Feature importance
(Table 4)
Five-Predictor ModelAge, Medications, Calcium Intake, Physical Activity, AlcoholIncludes predictors with small positive ReliefF scores
Case 3Feature importance
(Table 4)
Four-Predictor ModelAge, Medications, Calcium Intake, Physical ActivityRemoval of marginal predictors
Case 4Feature importance
(Table 4)
Three-Predictor ModelAge, Medications, Calcium IntakeCore ML-supported predictors
Case 5Feature importance
(Table 4)
Two-Predictor ModelAge, MedicationsHighly parsimonious ML-driven model
Case 6Feature importance
(Table 4)
Single-Predictor ModelAgeLower-bound benchmark
Case 7Combined ranking
(Table 6)
Three-Predictor ModelAge, Medications, SmokingUnified statistical–ML ranking
Case 8Combined ranking
(Table 6)
Four-Predictor ModelAge, Medications, Smoking, Prior FracturesExtended combined-ranking model
Case 9Combined ranking
(Table 6)
Five-Predictor ModelAge, Medications, Smoking, Prior Fractures, Race_Ethnicity_CExtended combined-ranking model
Case 10Combined ranking + GenderRank 1–3 + GenderAge, Medications, Smoking, GenderExplicit evaluation of Gender contribution
Case 11Combined ranking + GenderRank 1–2 + GenderAge, Medications, GenderIsolated assessment of Gender in minimal setting
Disclaimer/Publisher’s Note: The statements, opinions and data contained in all publications are solely those of the individual author(s) and contributor(s) and not of MDPI and/or the editor(s). MDPI and/or the editor(s) disclaim responsibility for any injury to people or property resulting from any ideas, methods, instructions or products referred to in the content.