Incremental Prognostic Value of Glucose Variability and the Lactate-to-Albumin Ratio Beyond APACHE II After a 48-Hour Landmark in Critically Ill Adults: A Retrospective Cohort Study


Abstract
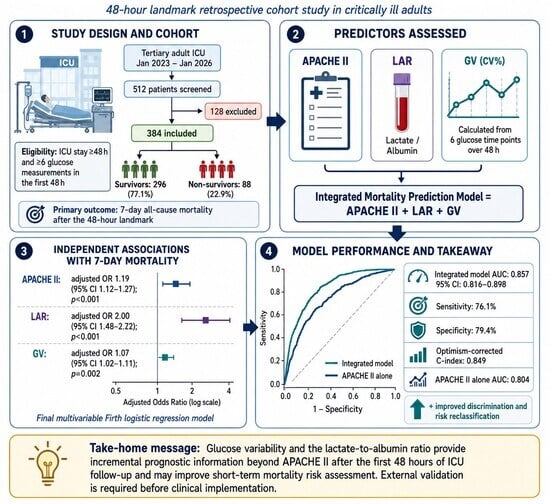
1. Introduction
2. Materials and Methods
2.1. Study Design and Setting
2.2. Study Population and Patient Selection
2.3. Data Collection and Variable Definitions
2.4. Outcome Measures
2.5. Statistical Analysis
3. Results
3.1. Patient Selection and Cohort Characteristics
3.2. Univariable and Multivariable Prognostic Associations
3.3. Incremental Prognostic Performance of LAR and Glucose Variability
3.4. Internal Validation and Calibration
3.5. Mean Glycemia-Adjusted and Temporally Matched Sensitivity Analyses
3.6. LAR Decomposition Sensitivity Analysis
3.7. Nonlinearity and Restricted Cubic Spline Analysis
3.8. Decision-Curve Analysis
3.9. Exploratory ROC-Derived Cut-Offs
4. Discussion
4.1. Principal Findings
4.2. Glucose Variability, Mean Glycemia, and Temporal Comparability
4.3. Lactate-to-Albumin Ratio and Its Individual Components
4.4. Incremental Value Beyond APACHE II and Clinical Interpretation
4.5. Strengths and Limitations
5. Conclusions
Supplementary Materials
Author Contributions
Funding
Institutional Review Board Statement
Informed Consent Statement
Data Availability Statement
Acknowledgments
Conflicts of Interest
References
- Knaus, W.A.; Draper, E.A.; Wagner, D.P.; Zimmerman, J.E. APACHE II: A severity of disease classification system. Crit. Care Med. 1985, 13, 818–829. [Google Scholar] [CrossRef] [Scilit]
- De Grooth, H.-J.; Geenen, I.L.; Girbes, A.R.; Vincent, J.-L.; Parienti, J.-J.; Oudemans-van Straaten, H.M. SOFA and mortality endpoints in randomized controlled trials: A systematic review and meta-regression analysis. Crit. Care 2017, 21, 38. [Google Scholar] [CrossRef] [Scilit]
- Ranzani, O.T.; Singer, M.; Salluh, J.I.F.; Shankar-Hari, M.; Pilcher, D.; Berger-Estilita, J.; Coopersmith, C.M.; Juffermans, N.P.; Laffey, J.; Reinikainen, M.; et al. Development and Validation of the Sequential Organ Failure Assessment (SOFA)-2 Score. JAMA 2025, 334, 2090. [Google Scholar] [CrossRef] [Scilit]
- Rousseau, A.-F.; Martindale, R. Nutritional and metabolic modulation of inflammation in critically ill patients: A narrative review of rationale, evidence and grey areas. Ann. Intensive Care 2024, 14, 121. [Google Scholar] [CrossRef] [Scilit]
- Gunst, J.; Verbruggen, S.C. Insulin resistance in critical illness: Consequences for nutrition therapy and glucose management. Curr. Opin. Crit. Care 2023, 29, 286–292. [Google Scholar] [CrossRef] [Scilit]
- Hryciw, B.N.; Ghossein, J.; Rochwerg, B.; Meggison, H.; Fernando, S.M.; Kyeremanteng, K.; Tran, A.; Seely, A.J.E. Glycemic Variability As a Prognostic Factor for Mortality in Patients With Critical Illness: A Systematic Review and Meta-Analysis. Crit. Care Explor. 2024, 6, e1025. [Google Scholar] [CrossRef] [Scilit]
- Krinsley, J.S. Glycemic variability: A strong independent predictor of mortality in critically ill patients. Crit. Care Med. 2008, 36, 3008–3013. [Google Scholar] [CrossRef] [Scilit]
- The NICE-SUGAR Study Investigators. Intensive versus Conventional Glucose Control in Critically Ill Patients. N. Engl. J. Med. 2009, 360, 1283–1297. [CrossRef] [Scilit]
- The NICE-SUGAR Study Investigators. Hypoglycemia and Risk of Death in Critically Ill Patients. N. Engl. J. Med. 2012, 367, 1108–1118. [CrossRef] [Scilit]
- Pierrakos, C.; Velissaris, D.; Bisdorff, M.; Marshall, J.C.; Vincent, J.-L. Biomarkers of sepsis: Time for a reappraisal. Crit. Care 2020, 24, 287. [Google Scholar] [CrossRef] [Scilit]
- Vincent, J.-L.; Russell, J.A.; Jacob, M.; Martin, G.; Guidet, B.; Wernerman, J.; Roca, R.F.; McCluskey, S.A.; Gattinoni, L. Albumin administration in the acutely ill: What is new and where next? Crit. Care 2014, 18, 231. [Google Scholar] [CrossRef] [Scilit]
- Saravi, B.; Goebel, U.; Hassenzahl, L.O.; Jung, C.; David, S.; Feldheiser, A.; Stopfkuchen-Evans, M.; Wollborn, J. Capillary leak and endothelial permeability in critically ill patients: A current overview. Intensive Care Med. Exp. 2023, 11, 96. [Google Scholar] [CrossRef] [Scilit]
- Gharipour, A.; Razavi, R.; Gharipour, M.; Mukasa, D. Lactate/albumin ratio: An early prognostic marker in critically ill patients. Am. J. Emerg. Med. 2020, 38, 2088–2095. [Google Scholar] [CrossRef] [Scilit]
- Zhao, X.; Peng, Q.; Li, W.; Hu, D.; Guan, Y.; Wang, J. Elevated lactate/albumin ratio is associated with poor prognosis in sepsis patients: A systematic review and meta-analysis. J. Med. Biochem. 2024, 43, 334–349. [Google Scholar] [CrossRef] [Scilit]
- Suzuki, Y.; Aoki, Y.; Shimizu, M.; Nakajima, M.; Imai, R.; Okada, Y.; Mimuro, S.; Nakajima, Y. Predictive accuracy of lactate albumin ratio for mortality in intensive care units: A nationwide cohort study. BMJ Open 2024, 14, e088926. [Google Scholar] [CrossRef] [Scilit]
- Von Elm, E.; Altman, D.G.; Egger, M.; Pocock, S.J.; Gøtzsche, P.C.; Vandenbroucke, J.P. The Strengthening the Reporting of Observational Studies in Epidemiology (STROBE) statement: Guidelines for reporting observational studies. Lancet 2007, 370, 1453–1457. [Google Scholar] [CrossRef] [Scilit]
- R Core Team. R: A Language and Environment for Statistical Computing [Internet]; R Foundation for Statistical Computing: Vienna, Austria, 2025; Available online: https://www.r-project.org/ (accessed on 31 August 2026).
- Öner, S.F.; Şenol Karataş, S.; Bulut, O.K. Reproducibility Materials for “Incremental Prognostic Value of Glucose Variability and the Lactate-to-Albumin Ratio Beyond APACHE II After a 48-Hour Landmark in Critically Ill Adults”; Zenodo: Geneva, Switzerland, 2026. [Google Scholar] [CrossRef]
- Emgin, Ö.; Yavuz, M.; Şahin, A.; Güneş, M.; Eser, M.; Yavuz, T.; Kökalan, D.; Ergün, B.; Rollas, K.; Çakırgöz, M.Y. The Association Between Glycemic Variability and Mortality in Critically Ill Patients: A Multicenter Prospective Observational Study. J. Clin. Med. 2024, 13, 6939. [Google Scholar] [CrossRef] [Scilit]
- Klimontov, V.V.; Saik, O.V.; Korbut, A.I. Glucose Variability: How Does It Work? Int. J. Mol. Sci. 2021, 22, 7783. [Google Scholar] [CrossRef] [Scilit]
- Huang, Y.; Yue, L.; Qiu, J.; Gao, M.; Liu, S.; Wang, J. Endothelial Dysfunction and Platelet Hyperactivation in Diabetic Complications Induced by Glycemic Variability. Horm. Metab. Res. 2022, 54, 419–428. [Google Scholar] [CrossRef] [Scilit]
- Shah, M.S.; Brownlee, M. Molecular and Cellular Mechanisms of Cardiovascular Disorders in Diabetes. Circ. Res. 2016, 118, 1808–1829. [Google Scholar] [CrossRef] [Scilit]
- Thakar, S.; Katakia, Y.T.; Ramakrishnan, S.K.; Pandya Thakkar, N.; Majumder, S. Intermittent High Glucose Elevates Nuclear Localization of EZH2 to Cause H3K27me3-Dependent Repression of KLF2 Leading to Endothelial Inflammation. Cells 2021, 10, 2548. [Google Scholar] [CrossRef] [Scilit]
- Shadvar, K.; Nader-Djalal, N.; Vahed, N.; Sanaie, S.; Iranpour, A.; Mahmoodpoor, A.; Vahedian-Azimi, A.; Samim, A.; Rahimi-Bashar, F. Comparison of lactate/albumin ratio to lactate and lactate clearance for predicting outcomes in patients with septic shock admitted to intensive care unit: An observational study. Sci. Rep. 2022, 12, 13047. [Google Scholar] [CrossRef] [Scilit]
- Lichtenauer, M.; Wernly, B.; Ohnewein, B.; Franz, M.; Kabisch, B.; Muessig, J.; Masyuk, M.; Lauten, A.; Schulze, P.; Hoppe, U.; et al. The Lactate/Albumin Ratio: A Valuable Tool for Risk Stratification in Septic Patients Admitted to ICU. Int. J. Mol. Sci. 2017, 18, 1893. [Google Scholar] [CrossRef] [Scilit]
- Yoon, S.H.; Choi, B.; Eun, S.; Bae, G.E.; Koo, C.M.; Kim, M.K. Using the lactate-to-albumin ratio to predict mortality in patients with sepsis or septic shock: A systematic review and meta-analysis. Eur. Rev. Med. Pharmacol. Sci. 2022, 26, 1743–1752. [Google Scholar] [CrossRef] [Scilit]
- Collins, G.S.; Dhiman, P.; Ma, J.; Schlussel, M.M.; Archer, L.; Van Calster, B.; Harrell, F.E.; Martin, G.P.; Moons, K.G.M.; Van Smeden, M.; et al. Evaluation of clinical prediction models (part 1): From development to external validation. BMJ 2024, 384, e074819. [Google Scholar] [CrossRef] [Scilit]



| Variable | Overall (n = 384) | Survivors (n = 296) | Non-Survivors (n = 88) | p Value |
|---|---|---|---|---|
| Age, years | 64.7 (55.4–74.6) | 63.3 (53.8–72.8) | 70.9 (59.5–82.8) | <0.001 |
| Male sex, n (%) | 242 (63.0) | 183 (61.8) | 59 (67.0) | 0.447 |
| Diabetes mellitus, n (%) | 119 (31.0) | 84 (28.4) | 35 (39.8) | 0.058 |
| APACHE II score | 18.0 (14.0–22.0) | 17.0 (12.8–20.0) | 23.0 (20.0–26.0) | <0.001 |
| Glasgow Coma Scale score | 11.0 (10.0–13.0) | 12.0 (10.0–14.0) | 10.0 (8.0–11.0) | <0.001 |
| Albumin, g/dL | 2.1 (1.7–2.4) | 2.2 (1.9–2.6) | 1.7 (1.4–2.1) | <0.001 |
| Lactate, mmol/L | 2.0 (1.4–2.9) | 1.7 (1.2–2.4) | 2.9 (2.2–4.3) | <0.001 |
| Lactate-to-albumin ratio | 0.96 (0.57–1.60) | 0.80 (0.52–1.25) | 1.79 (1.20–2.69) | <0.001 |
| Glucose variability (CV, %) | 11.5 (7.5–16.6) | 10.9 (6.8–16.0) | 15.5 (10.8–20.0) | <0.001 |
| Primary diagnosis, n (%) | <0.001 | |||
| Sepsis | 109 (28.4) | 83 (28.0) | 26 (29.5) | |
| Septic shock | 54 (14.1) | 28 (9.5) | 26 (29.5) | |
| Pneumonia | 105 (27.3) | 84 (28.4) | 21 (23.9) | |
| Trauma | 38 (9.9) | 32 (10.8) | 6 (6.8) | |
| Postoperative | 33 (8.6) | 29 (9.8) | 4 (4.5) | |
| Other | 45 (11.7) | 40 (13.5) | 5 (5.7) |
| Predictor | Univariable OR (95% CI) | p Value | Adjusted OR (95% CI) | p Value |
|---|---|---|---|---|
| Age, per 1-year increase | 1.03 (1.02–1.05) | <0.001 | — | — |
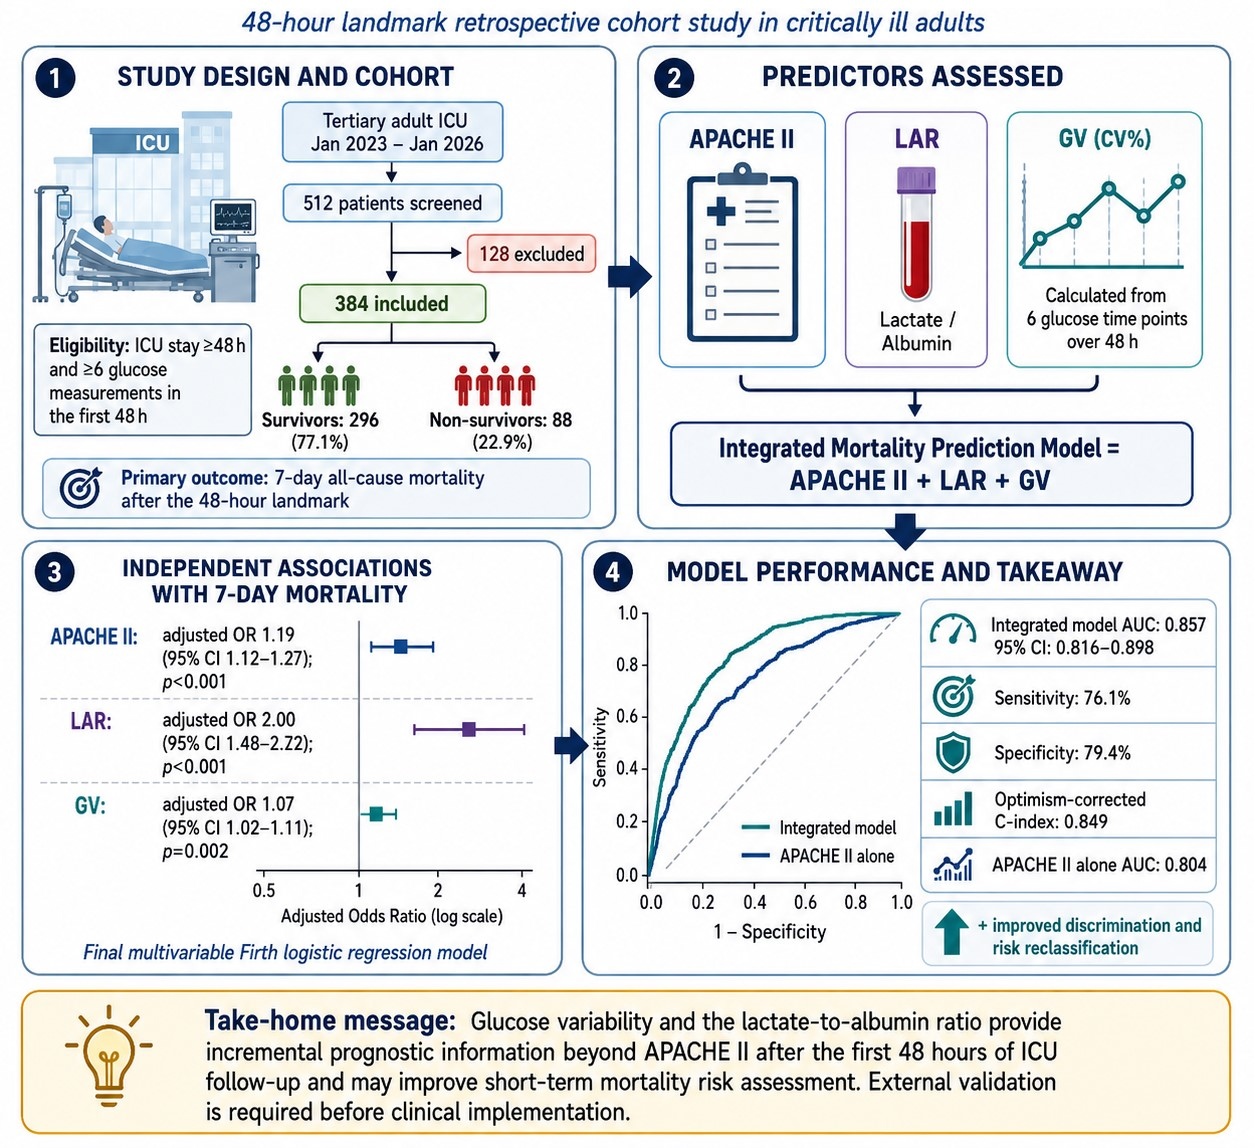
| APACHE II score, per 1-point increase | 1.26 (1.19–1.34) | <0.001 | 1.19 (1.12–1.27) | <0.001 |
| GCS score, per 1-point increase | 0.54 (0.46–0.63) | <0.001 | — | — |
| Albumin, per 1-g/dL increase | 0.15 (0.08–0.26) | <0.001 | — | — |
| Lactate, per 1-mmol/L increase | 1.90 (1.57–2.31) | <0.001 | — | — |
| LAR, per 1-unit increase | 2.91 (2.17–3.90) | <0.001 | 1.97 (1.48–2.69) | <0.001 |
| Glucose variability (CV), per 1-percentage-point increase | 1.09 (1.06–1.13) | <0.001 | 1.07 (1.02–1.11) | 0.002 |
| Model | Predictors | AUC (95% CI) | ΔAUC vs. Previous Model (95% CI) | DeLong p Value | Apparent Brier Score | Optimism- Corrected C-Index | Optimism- Corrected Brier Score |
|---|---|---|---|---|---|---|---|
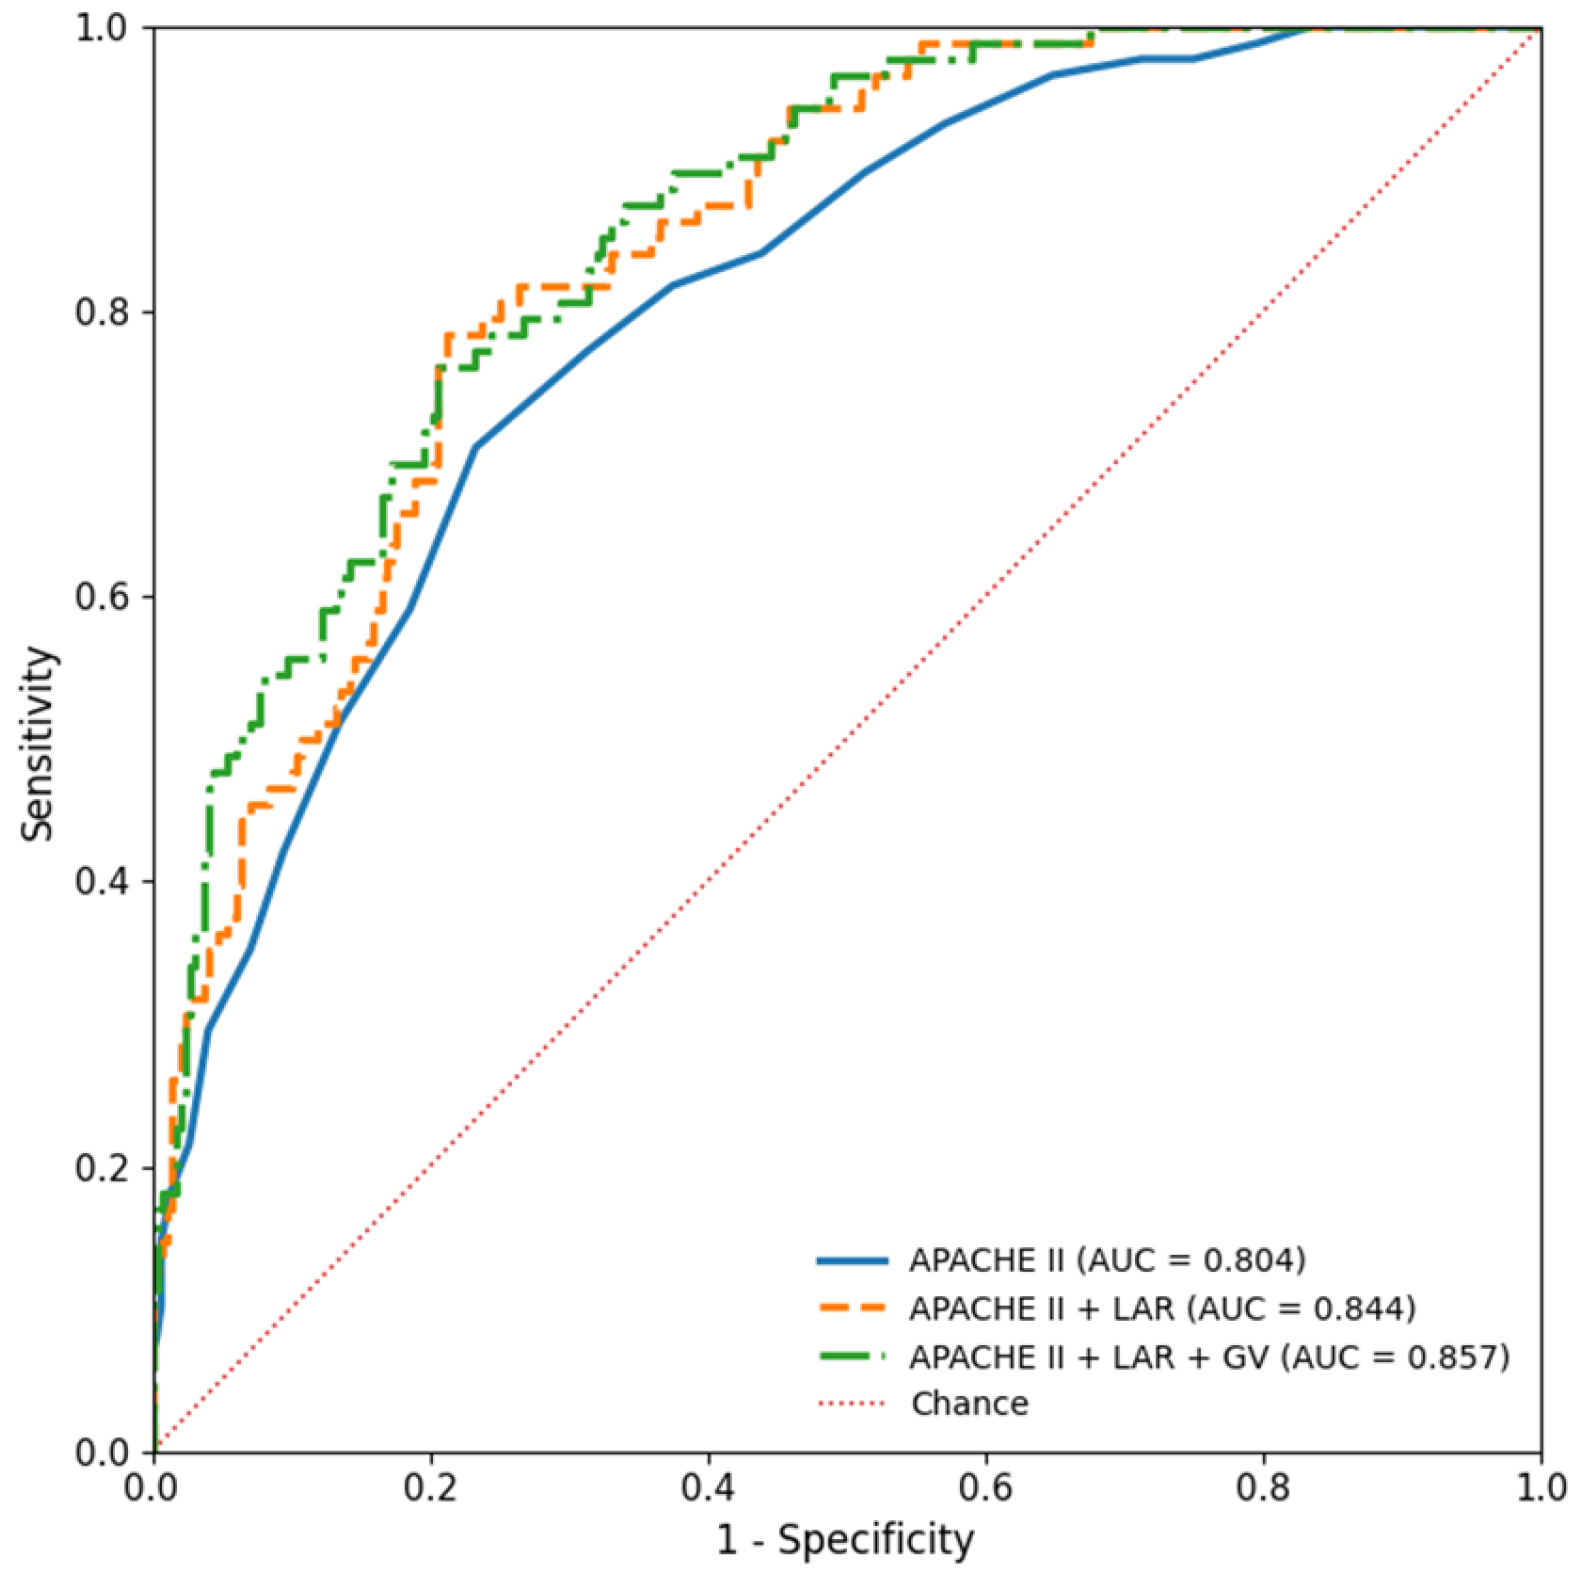
| M0 | APACHE II | 0.804 (0.755–0.854) | — | — | 0.137 | 0.803 | 0.138 |
| M1 | APACHE II + LAR | 0.844 (0.802–0.886) | +0.040 (0.014–0.065) | 0.002 | 0.126 | 0.840 | 0.129 |
| M2 | APACHE II + LAR + GV | 0.857 (0.816–0.898) | +0.013 (−0.004–0.030) | 0.145 | 0.121 | 0.851 | 0.124 |
| (A) | |||||||||
| Analysis | Reference model AUC (95% CI) | Extended model AUC (95% CI) | ΔAUC (95% CI) | DeLong p | GV OR (95% CI) | GV p | CorrectedC-index, reference → extended | Corrected Brier, reference → extended | |
| 0–48 h mean-glycemia adjusted | 0.847 (0.806–0.888) | 0.857 (0.817–0.897) | +0.010 (−0.008 to 0.027) | 0.275 | 1.06 (1.02–1.11) | 0.002 | 0.841 → 0.849 | 0.131 → 0.126 | |
| Temporally matched 0–24 h | 0.848 (0.807–0.889) | 0.852 (0.811–0.892) | +0.003 (−0.012 to 0.019) | 0.651 | 1.05 (1.01–1.09) | 0.008 | 0.841 → 0.843 | 0.131 → 0.127 | |
| (B) | |||||||||
| Comparison | LAR model AUC (95% CI) | Separate- component model AUC (95% CI) | ΔAUC * (95% CI) | p value | Brier, LAR model | Brier, separate components | |||
| APACHE II + LAR vs. APACHE II + lactate + albumin | 0.844 (0.802–0.886) | 0.853 (0.812–0.893) | +0.009 (−0.004 to 0.021) | 0.186 | 0.126 | 0.123 | |||
| APACHE II + LAR + GV vs. APACHE II + lactate + albumin + GV | 0.857 (0.816–0.898) | 0.865 (0.825–0.904) | +0.007 (−0.006 to 0.021) | 0.272 | 0.121 | 0.117 | |||
| (C) | |||||||||
| Model | Apparent AUC (95% CI) | Apparent Brier | Optimism-corrected C-index | Optimism-corrected Brier | Optimism-corrected calibration slope | ||||
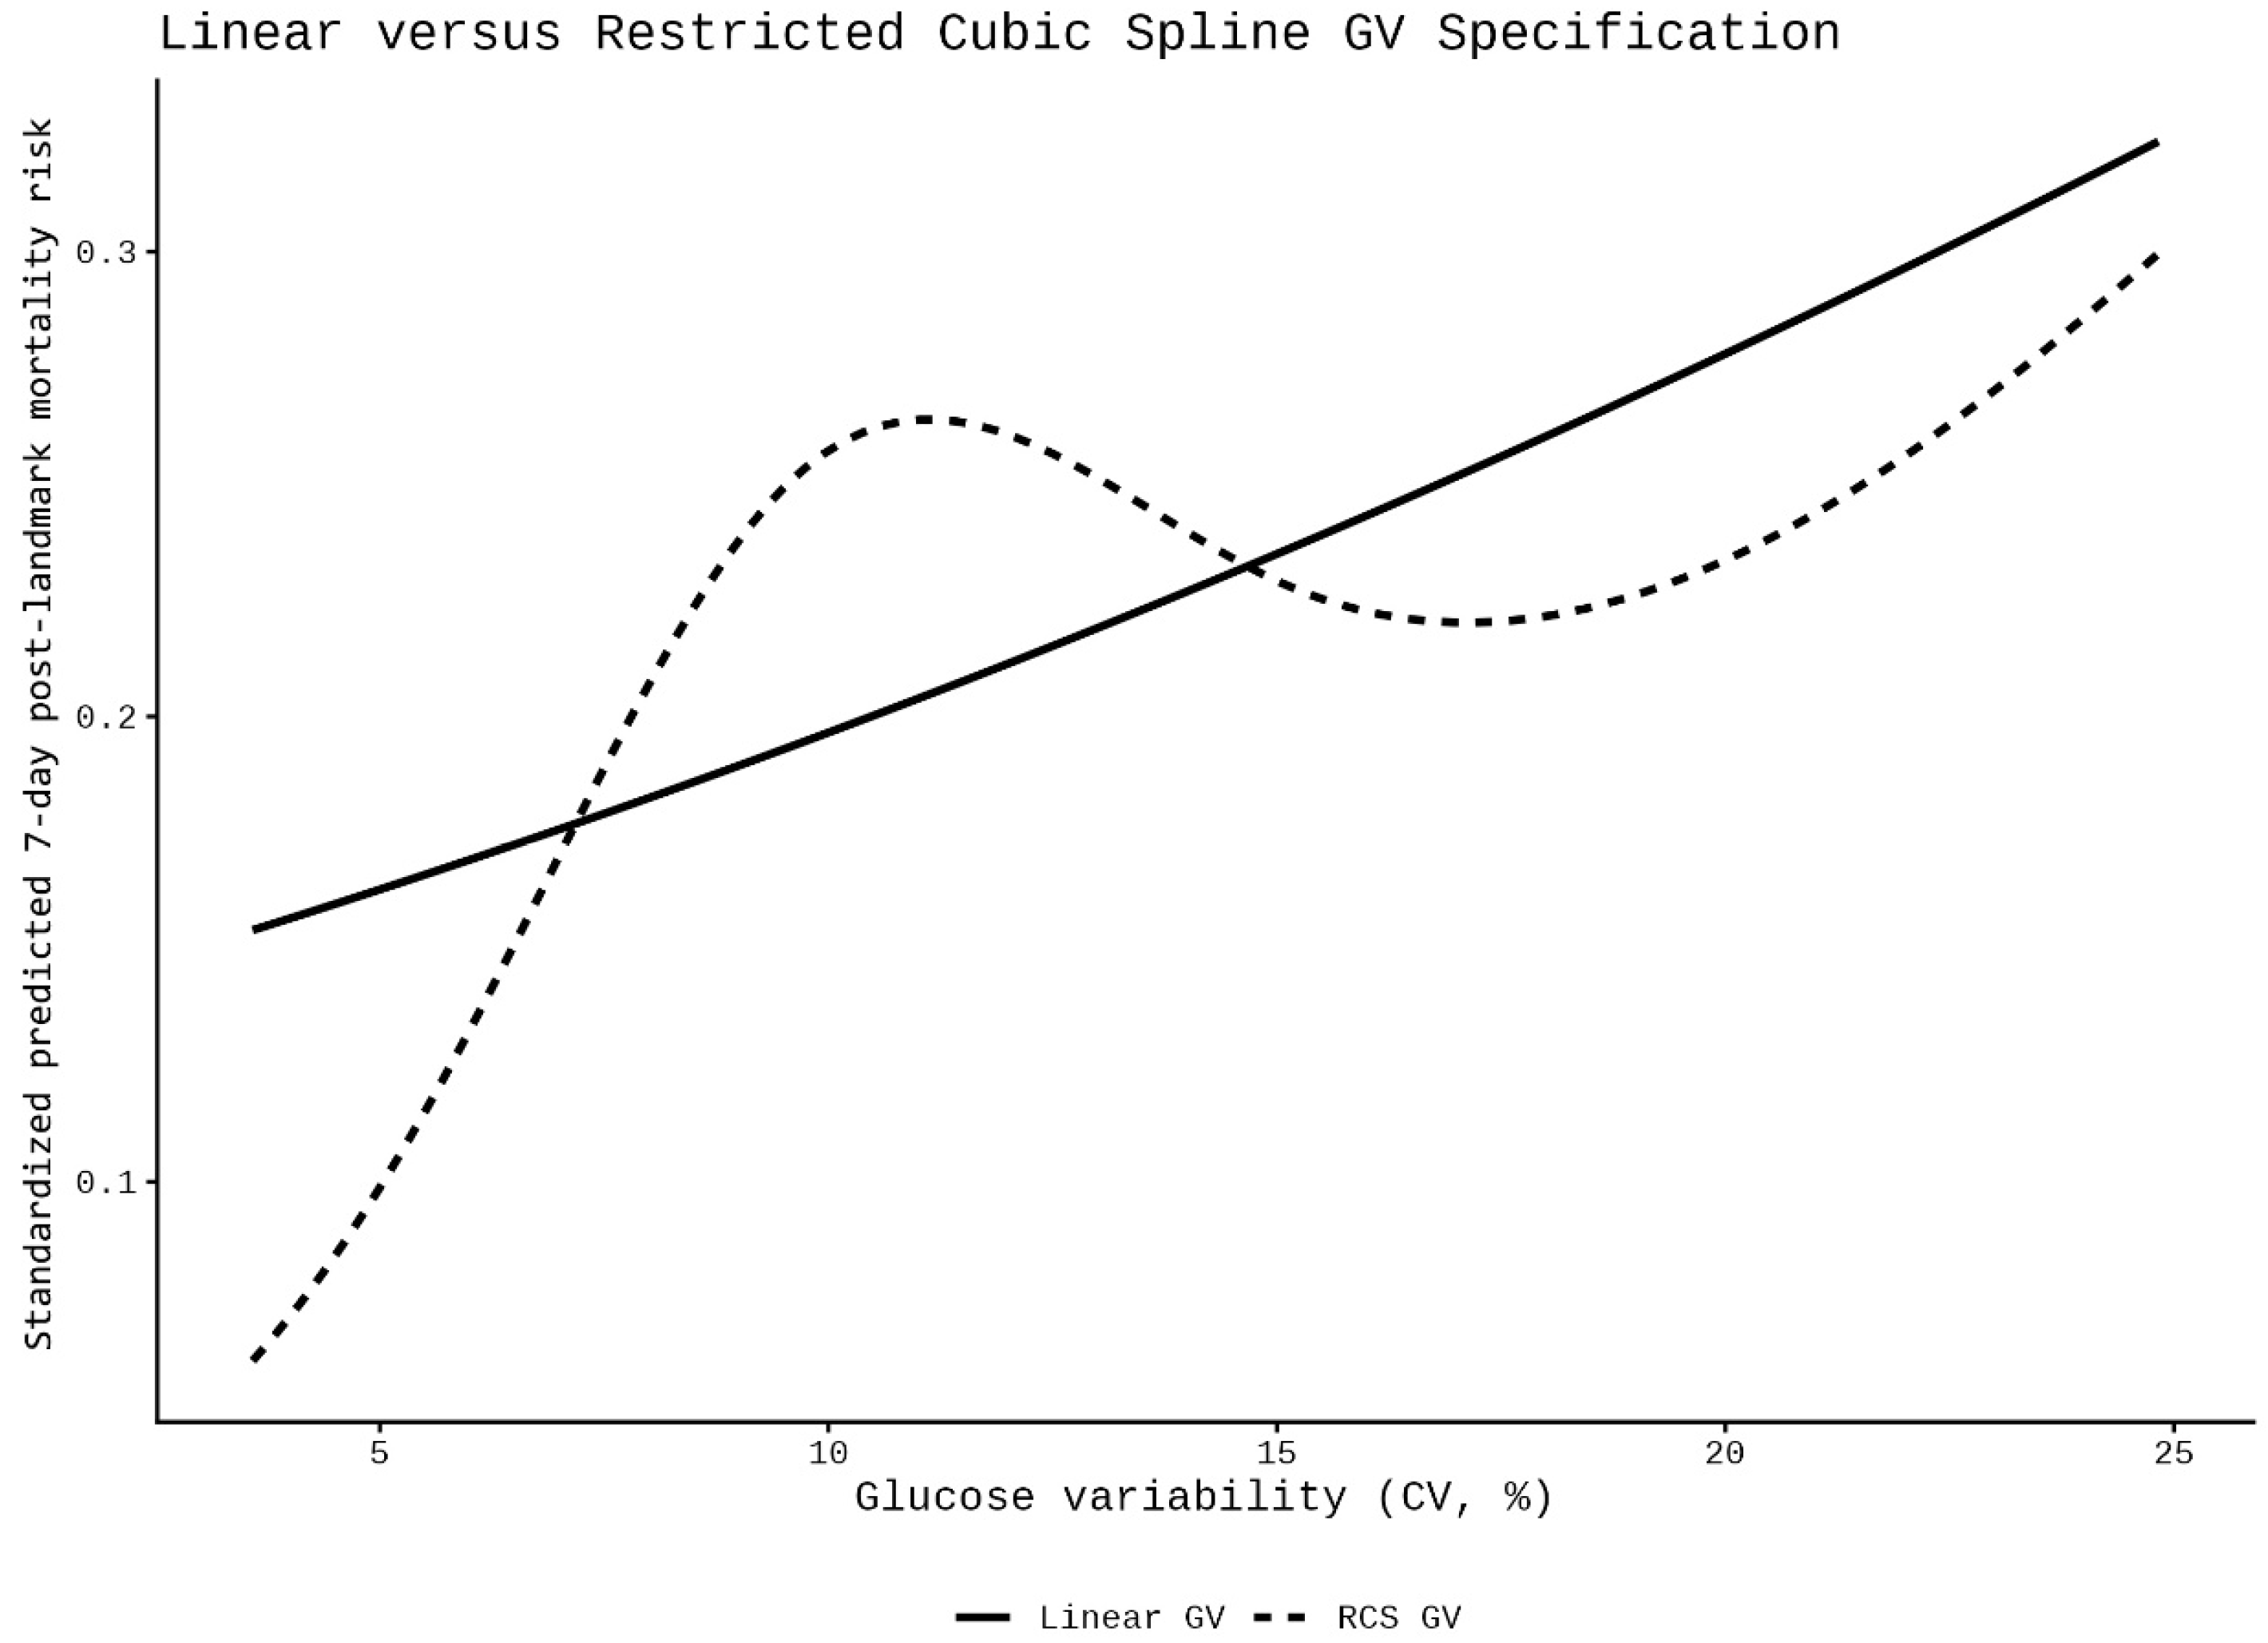
| Linear GV | 0.857 (0.816–0.898) | 0.121 | 0.852 | 0.124 | 0.990 | ||||
| RCS GV | 0.864 (0.824–0.904) | 0.118 | 0.854 | 0.123 | 0.970 | ||||
Disclaimer/Publisher’s Note: The statements, opinions and data contained in all publications are solely those of the individual author(s) and contributor(s) and not of MDPI and/or the editor(s). MDPI and/or the editor(s) disclaim responsibility for any injury to people or property resulting from any ideas, methods, instructions or products referred to in the content. |
© 2026 by the authors. Licensee MDPI, Basel, Switzerland. This article is an open access article distributed under the terms and conditions of the Creative Commons Attribution (CC BY) license.
Share and Cite
Öner, S.F.; Şenol Karataş, S.; Bulut, O.K. Incremental Prognostic Value of Glucose Variability and the Lactate-to-Albumin Ratio Beyond APACHE II After a 48-Hour Landmark in Critically Ill Adults: A Retrospective Cohort Study. J. Clin. Med. 2026, 15, 6925. https://doi.org/10.3390/jcm15176925
Öner SF, Şenol Karataş S, Bulut OK. Incremental Prognostic Value of Glucose Variability and the Lactate-to-Albumin Ratio Beyond APACHE II After a 48-Hour Landmark in Critically Ill Adults: A Retrospective Cohort Study. Journal of Clinical Medicine. 2026; 15(17):6925. https://doi.org/10.3390/jcm15176925
Chicago/Turabian StyleÖner, Sait Fatih, Sevim Şenol Karataş, and Oğuz Kağan Bulut. 2026. "Incremental Prognostic Value of Glucose Variability and the Lactate-to-Albumin Ratio Beyond APACHE II After a 48-Hour Landmark in Critically Ill Adults: A Retrospective Cohort Study" Journal of Clinical Medicine 15, no. 17: 6925. https://doi.org/10.3390/jcm15176925
APA StyleÖner, S. F., Şenol Karataş, S., & Bulut, O. K. (2026). Incremental Prognostic Value of Glucose Variability and the Lactate-to-Albumin Ratio Beyond APACHE II After a 48-Hour Landmark in Critically Ill Adults: A Retrospective Cohort Study. Journal of Clinical Medicine, 15(17), 6925. https://doi.org/10.3390/jcm15176925