Article

Association Between Metabolic Obesity Phenotypes and Alcohol-Associated Fatty Liver Disease Among US Adults: A NHANES 2013–2018 Analysis

1
Molecular and Translational Medicine, Paul L. Foster School of Medicine, Texas Tech University Health Sciences Center El Paso, El Paso, TX 79905, USA
2
Paul L. Foster School of Medicine, Texas Tech University Health Sciences Center El Paso, El Paso, TX 79905, USA
3
Department of Biomedical Informatics, Biostatistics and Medical Epidemiology, School of Medicine, University of Missouri, Columbia, MO 65212, USA
4
Department of Family and Community Medicine, Paul L. Foster School of Medicine, Texas Tech University Health Sciences Center El Paso, El Paso, TX 79905, USA
*
Author to whom correspondence should be addressed.
J. Clin. Med. 2026, 15(14), 5726; https://doi.org/10.3390/jcm15145726
Submission received: 1 June 2026 / Revised: 12 July 2026 / Accepted: 14 July 2026 / Published: 22 July 2026
(This article belongs to the Section Gastroenterology & Hepatopancreatobiliary Medicine)

Abstract

Background: Alcohol-associated fatty liver disease (AFLD) is a major public health concern and remains one of the leading causes of chronic liver disease in the United States. Understanding the interplay between obesity, metabolic dysfunction, and lifestyle factors may help identify populations at increased risk for AFLD. Methods: This cross-sectional study utilized data from the National Health and Nutrition Examination Survey (NHANES) collected between 2013–2018. AFLD was operationally defined using elevated liver enzyme levels combined with risky alcohol consumption. Metabolic obesity phenotypes (MOPs) were characterized by combining body mass index categories with either metabolic health status or metabolic syndrome (MS). Results: The weighted prevalence of AFLD was 14% (95%CI: 12–16%). AFLD prevalence was significantly higher among males than females (17% vs. 10% respectively, p < 0.0001), and among Hispanics compared to Non-Hispanic Black participants (20% vs. 9% respectively, p < 0.0001). Compared with metabolically healthy normal-weight individuals, obese participants with MS demonstrated the strongest association overall AFLD association (adjusted PR: 6.73; 95% CI: 4.51–10.05). Furthermore, obese males with MS showed the highest odds of AFLD under both MOP schemes (MOP 1: OR: 8.19; 95% CI: 4.41–15.23; MOP 2: OR: 10.92; 95% CI: 6.86–17.37). Conclusions: Individuals with obesity and metabolic dysfunction demonstrated significantly higher AFLD prevalence compared with metabolically healthy normal-weight individuals. MOPs incorporating MS demonstrated stronger associations with AFLD than classifications based on metabolic health status alone. These findings support the importance of screening strategies that address both obesity and metabolic dysfunction in addition to alcohol use to better identify high-risk populations.

1. Introduction

Alcohol-associated fatty liver disease (AFLD) is an emerging public health concern, characterized by excessive hepatic fat accumulation resulting from chronic alcohol consumption. AFLD represents the earliest stage of alcohol-associated liver disease (ALD), a disease continuum characterized by hepatic steatosis, inflammation, fibrosis, cirrhosis, and hepatocellular carcinoma. The hepatic metabolism of alcohol generates toxic metabolites that impair lipid metabolism and damage hepatocytes, leading to hepatic steatosis and inflammation. Persistent inflammation may subsequently progress to fibrosis, cirrhosis, and hepatocellular carcinoma. Globally, approximately 5% of individuals are affected by AFLD, making it a significant worldwide health concern [1,2]. In the United States, AFLD remains one of the leading causes of chronic liver disease [3].
Recently, the conceptual framework and nomenclature of fatty liver diseases have evolved toward the broader category of steatotic liver disease (SLD), including metabolic dysfunction-associated steatotic liver disease (MASLD) and metabolic dysfunction-associated alcohol-related liver disease (MetALD) [4]. Despite these evolving definitions, ALFD terminology remains commonly used in epidemiologic studies examining alcohol-related hepatic injury. Emerging evidence suggests that metabolic dysfunction contributes substantially to alcohol-related liver injury beyond alcohol consumption alone [5].
Historically, AFLD was attributed primarily to excessive alcohol intake. However, emerging evidence demonstrates that obesity and metabolic dysfunction play important roles in disease susceptibility and progression [6,7,8]. Metabolic syndrome (MS), characterized by central obesity, hypertension, hyperglycemia, hypertriglyceridemia, and reduced HDL cholesterol is strongly associated with hepatic steatosis and alcohol-related liver injury [9]. Obesity contributes to insulin resistance, oxidative stress, and systemic inflammation, all of which may exacerbate alcohol-induced hepatocellular injury [10].
Studies integrating body mass index (BMI) and metabolic health have proposed metabolic obesity phenotype (MOP) frameworks to better characterize heterogeneity in cardiometabolic risk profiles [11,12,13]. These phenotypes (MOPs) classify individuals according to BMI category and metabolic health status or MS presence. Emerging evidence from SLD research suggests that metabolic dysfunction may be more strongly associated with disease severity than body size alone [14].
Recent evidence further supports the importance of integrating metabolic dysfunction into alcohol-related liver disease assessment. A recent study demonstrated that MASLD, MetALD, and ALD were independently associated with elevated sudden cardiac arrest risk, with risk highest among individuals with ALD [15]. Furthermore, MetALD demonstrated a disproportionate impact among younger adults [15]. Additionally, the fatty liver index (FLI), a widely used surrogate marker for SLD, has demonstrated predictive utility for cardiovascular disease and mortality across varying levels of alcohol consumption [16].
The prevalence and severity of AFLD are additionally influenced by demographic and behavioral factors that vary across populations [17]. Hispanic populations, particularly Hispanic men, experience disproportionately elevated burdens of metabolic disease and alcohol associated liver injury [18,19,20,21]. Despite the clinical importance of AFLD, relatively few studies have examined the association between MOPs and AFLD across diverse demographic groups. Therefore, this study aimed to characterize the prevalence of AFLD and examine its association with MOPs, while accounting for demographic and lifestyle factors.

2. Methods

2.1. Study Population and Data Source

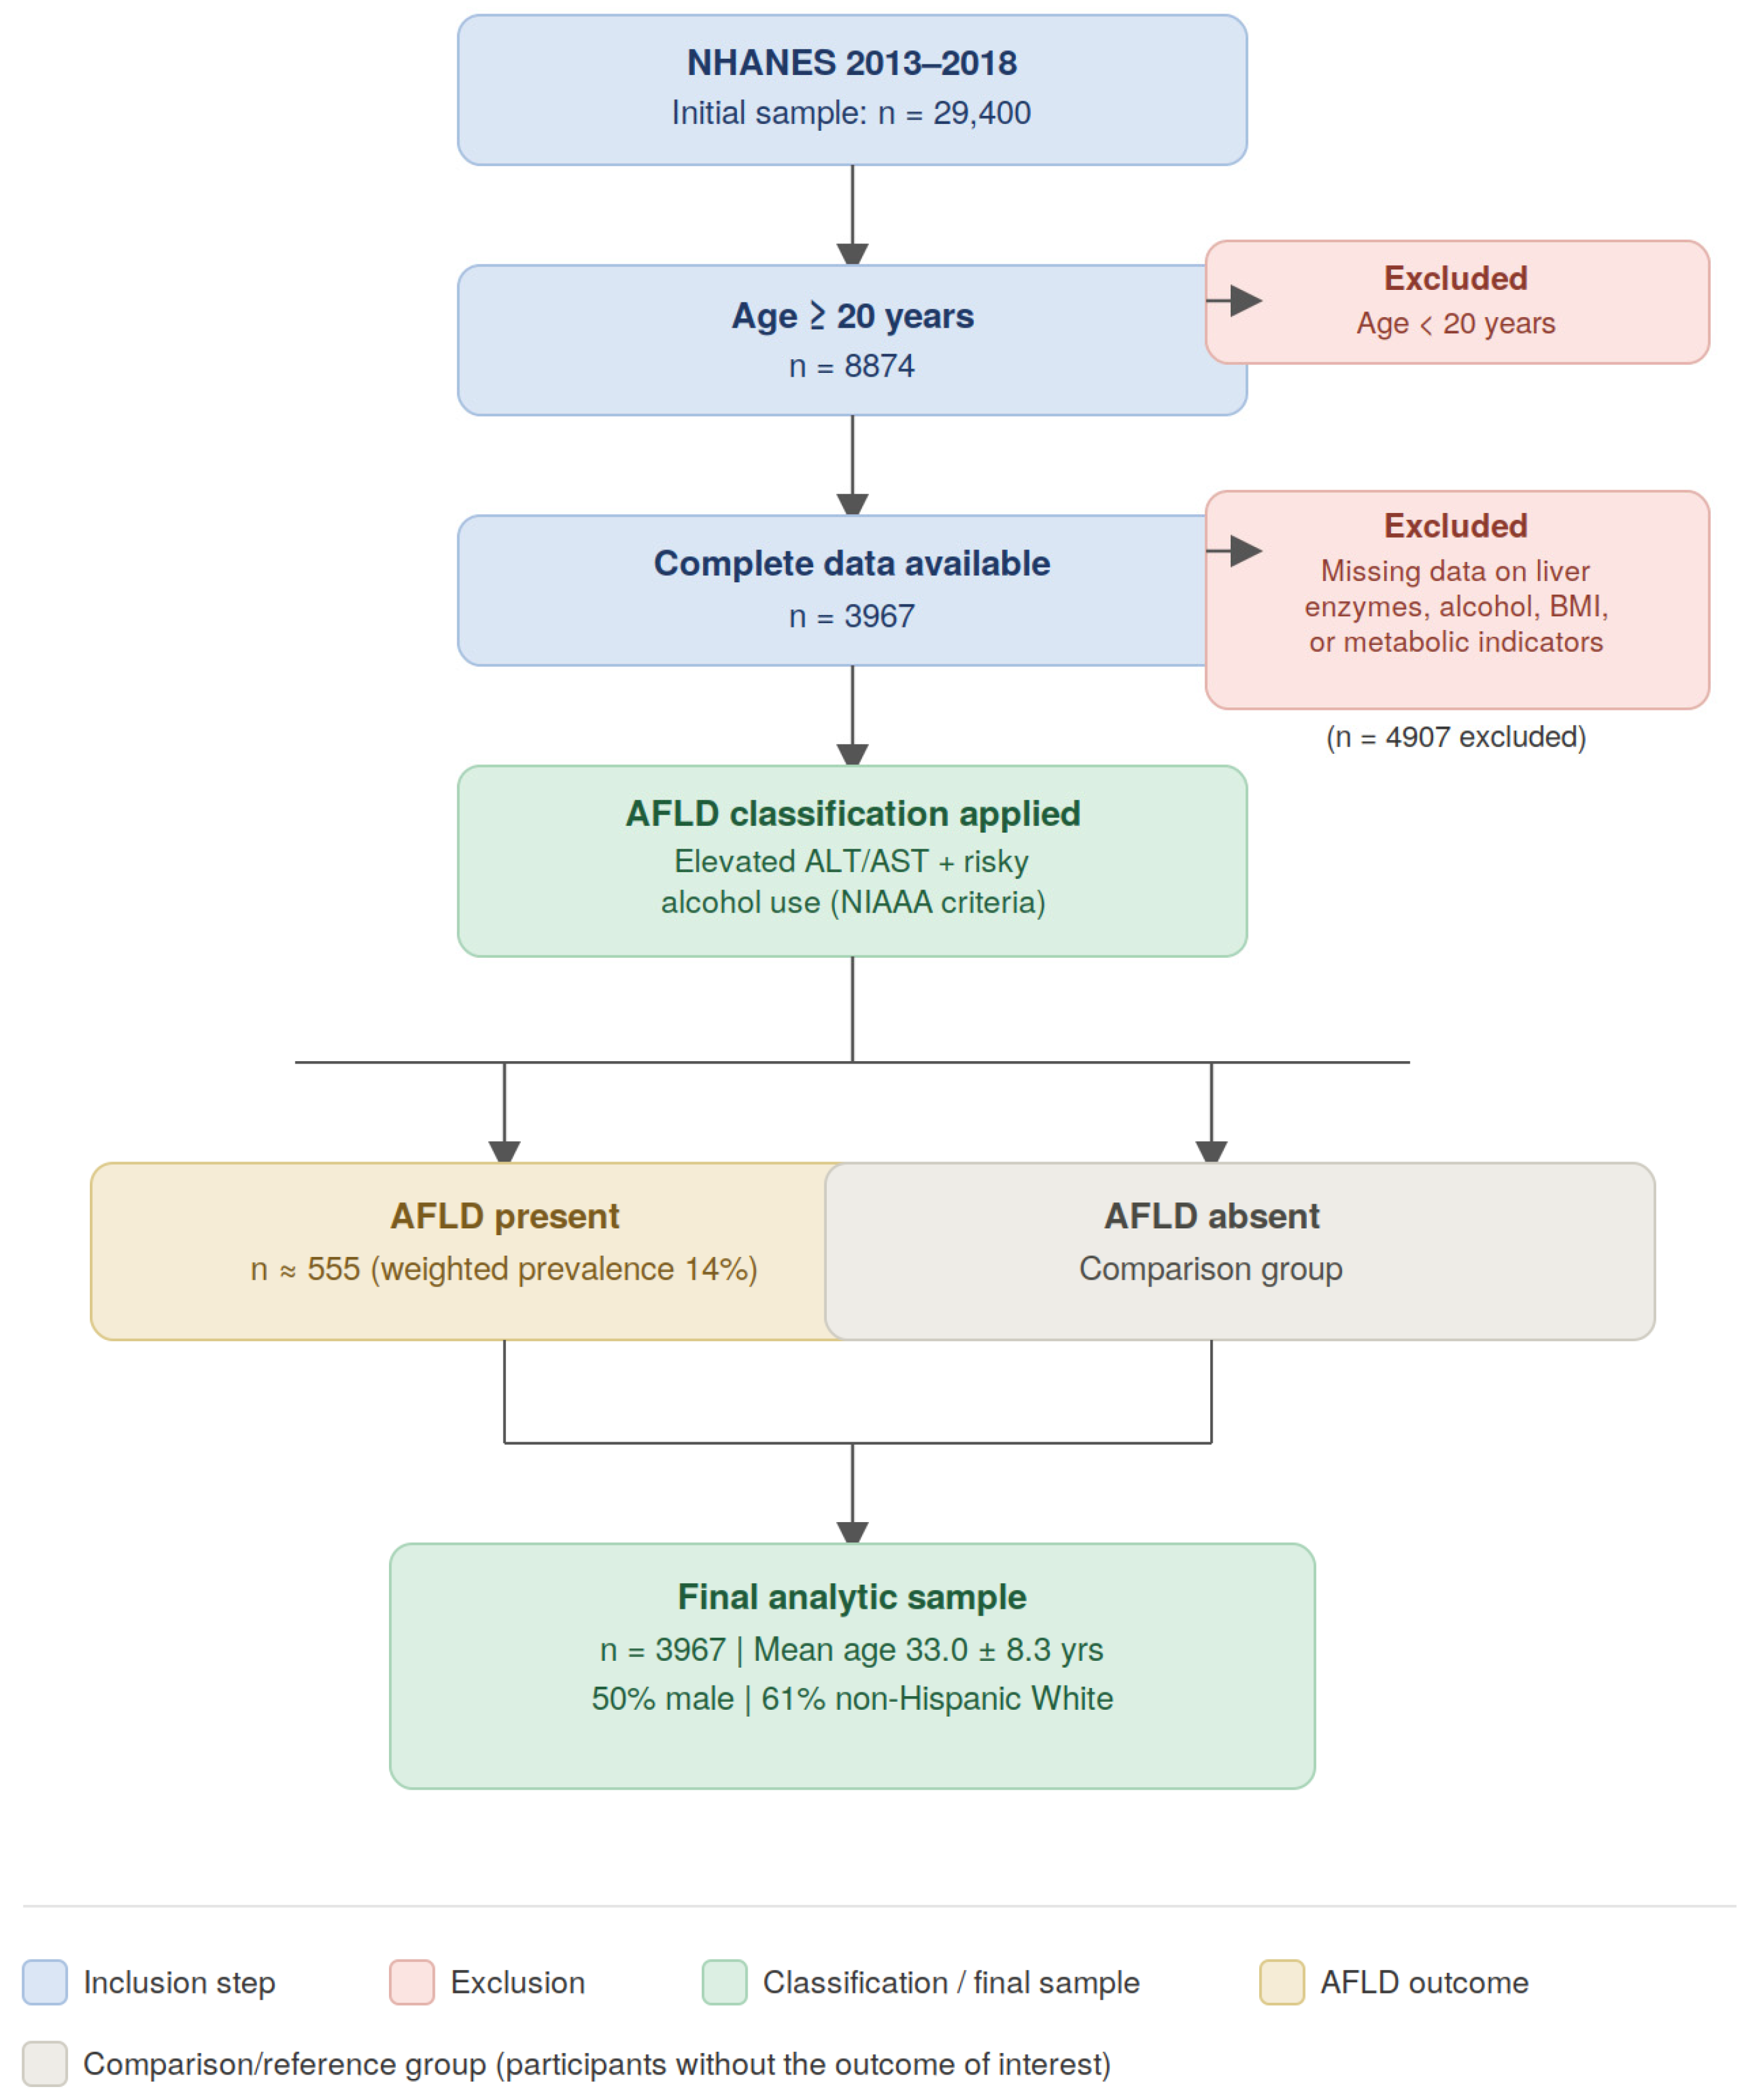
This cross-sectional study utilized data from the National Health and Nutrition Examination Survey (NHANES) collected between 2013 and 2018. NHANES is conducted by the National Center for Health Statistics (NCHS), using a complex, multistage probability sampling design to generate nationally representative estimates of the civilian noninstitutionalized US population [22]. Data were collected through standardized interviews, physical examinations, and laboratory analyses. Among 29,400 NHANES participants surveyed between 2013 and 2018, 8874 adults aged 18–50 had complete alcohol-use data. Participants missing liver enzyme measurements, alcohol consumption variables, anthropometric measures, MS components, or covariates were excluded. The final analytic sample included 3967 participants. A participant selection flow diagram is provided in Figure 1.
Missing data was handled using complete case analysis. Participants with missing data on liver enzyme measurements, alcohol consumption variables, anthropometric measurements, MS, or key covariates were excluded from the analysis. Although this approach preserved consistency across analyses, it may have introduced selection bias if excluded participants differed systematically from included participants.

2.2. Outcome Definition: ALFD

AFLD status was operationally defined using biochemical and behavioral criteria. Serum alanine- aminotransferase (ALT) and aspartate aminotransferase (AST) levels were measured using standardized NHANES laboratory procedures [23]. Elevated liver enzymes were defined using sex-specific cut-offs commonly used epidemiologic studies: ALT > 40 U/L and AST > 37 U/L for men; ALT > 31 U/L or AST > 31 U/L for women [24].
Alcohol consumption was assessed using NHANES alcohol use questionnaires. Risky alcohol use was defined according to National Institute on Alcohol Abuse and Alcoholism (NIAAA) criteria as >14 drinks per week or >4 drinks/day for men, and >7 drinks per week or >3 drinks/day for women [25]. Participants meeting both risky alcohol consumption and elevated liver enzyme criteria were classified as having AFLD.
To ensure the validity of fasting-dependent MS variables, fasting duration prior to blood draw was assessed using the NHANES variable PHAFSTHR. Participants included in analyses requiring fasting glucose and triglyceride measurements were restricted to those fasting ≥8 h prior to specimen collection, consistent with ATP III MS assessment recommendations.

2.3. Exposures: MOPs

BMI was calculated as weight in kilograms divided by height in meters squared (kg/m2) using standardized NHANES anthropometric measurements [26]. Participants were categorized as normal weight (BMI 18.5–24.9 kg/m2), overweight (BMI 25.0–29.9 kg/m2), or obese (BMI ≥ 30.0 kg/m2) [13].
Two MOP classification schemes were constructed by integrating BMI category with metabolic health status, consistent with established MOP frameworks in the literature [13].
MOP 1: combined BMI category with metabolic health status: Normal Weight + Metabolically healthy (NW + MH), Normal Weight + Metabolically Unhealthy (NW + MU), Overweight + Metabolically Healthy (OW + MH), Overweight + Metabolically Unhealthy (OW + MU), Obese + Metabolically Healthy (OB + MH), and Obese + Metabolically Unhealthy (OB + MU).
MOP 2: combined BMI category with MS status: Normal Weight + No MS (NW + No MS), Normal Weight + MS (NW + MS), Overweight + No MS (OW + No MS), Overweight + MS (OW + MS), Obese + No MS (OB + No MS), and Obese + MS (OB + MS).
Metabolically healthy was defined as failing to meet the threshold for metabolic unhealthiness (i.e., having fewer than two of the six Wildman criteria) [9]. MS was defined according to Adult Treatment Panel III (ATP III) criteria requiring ≥ 3 of the following: waist circumference > 102 cm in men or >88 cm in women; triglycerides ≥ 150 mg/dL; HDL cholesterol < 40 mg/dL in men or <50 mg/dL in women; blood pressure ≥ 130/85 mmHg or antihypertensive medication use; fasting glucose ≥ 100 mg/dL or antidiabetic medication use [10]. Unhealthy behavior was defined as current smoking, insufficient physical activity, or risky alcohol consumption according to NIAAA guidelines. Cardiac syndrome was defined as a self-reported history of coronary heart disease, heart attack, stroke, heart failure, or angina.
NHANES prescription medication files were additionally examined to identify antihypertensive, antidiabetic, and lipid-lowering medication use. However, because NHANES medication files do not consistently specify medication indication, some degree of misclassification may remain.

2.4. Current Nomenclature

To align our study with the current international consensus nomenclature, individuals meeting the criteria for AFLD were stratified into exclusive phenotypic sub-groups based on their metabolic health [4]. Participants were stratified into four severity tiers based on the number of concurrent metabolic risk factors present: pure ALD (0 factors), mild MetALD (1 factor), moderate MetALD (2 factors), and severe MetALD (≥3 factors).

2.5. Statistical Analysis

All analyses followed NHANES analytic guidelines incorporating survey weights, strata, and primary sampling units (PSUs) to generate nationally representative estimates [27].
Descriptive statistics summarized participant characteristics by AFLD status. Differences between groups were assessed using survey-weighted chi-square tests for categorical variables and survey-weighted t-tests or ANOVA for continuous variables.
Survey-weighted multivariable logistic regression models were fitted to evaluate association between AFLD and MOPs. Because the weighted prevalence of AFLD exceeded 10%, prevalence ratios (PRs) and corresponding 95% confidence intervals (CIs) were estimated using marginal standardization (predicted marginals) derived from the fitted logistic regression models rather than directly interpreting odds ratios, which may overestimate associations in cross-sectional studies with common outcomes. Adjusted models controlled for age, sex, race/ethnicity, education, smoking status, and physical activity.
All analyses were conducted using Stata version 17.0 (StataCorp LLC, College Station, TX, USA). Statistical significance was defined as a two-sided p-value < 0.05.

2.6. Ethical Considerations

NHANES protocols were approved by the NCHS Research Ethics Review Board, and written informed consent was obtained from all participants. The present secondary analysis utilized publicly available de-identified data and was exempt from additional institutional review board approval.

3. Results

A total of 3967 participants were included in the analysis (mean age 33.0 ± 8.3 years; 50% male). Most participants were non-Hispanic White (61%), followed by Hispanic (20%) and non-Hispanic Black (10%). Approximately one-quarter of participants had MS, and nearly one in four were classified as obese (Table 1 and Table 2).
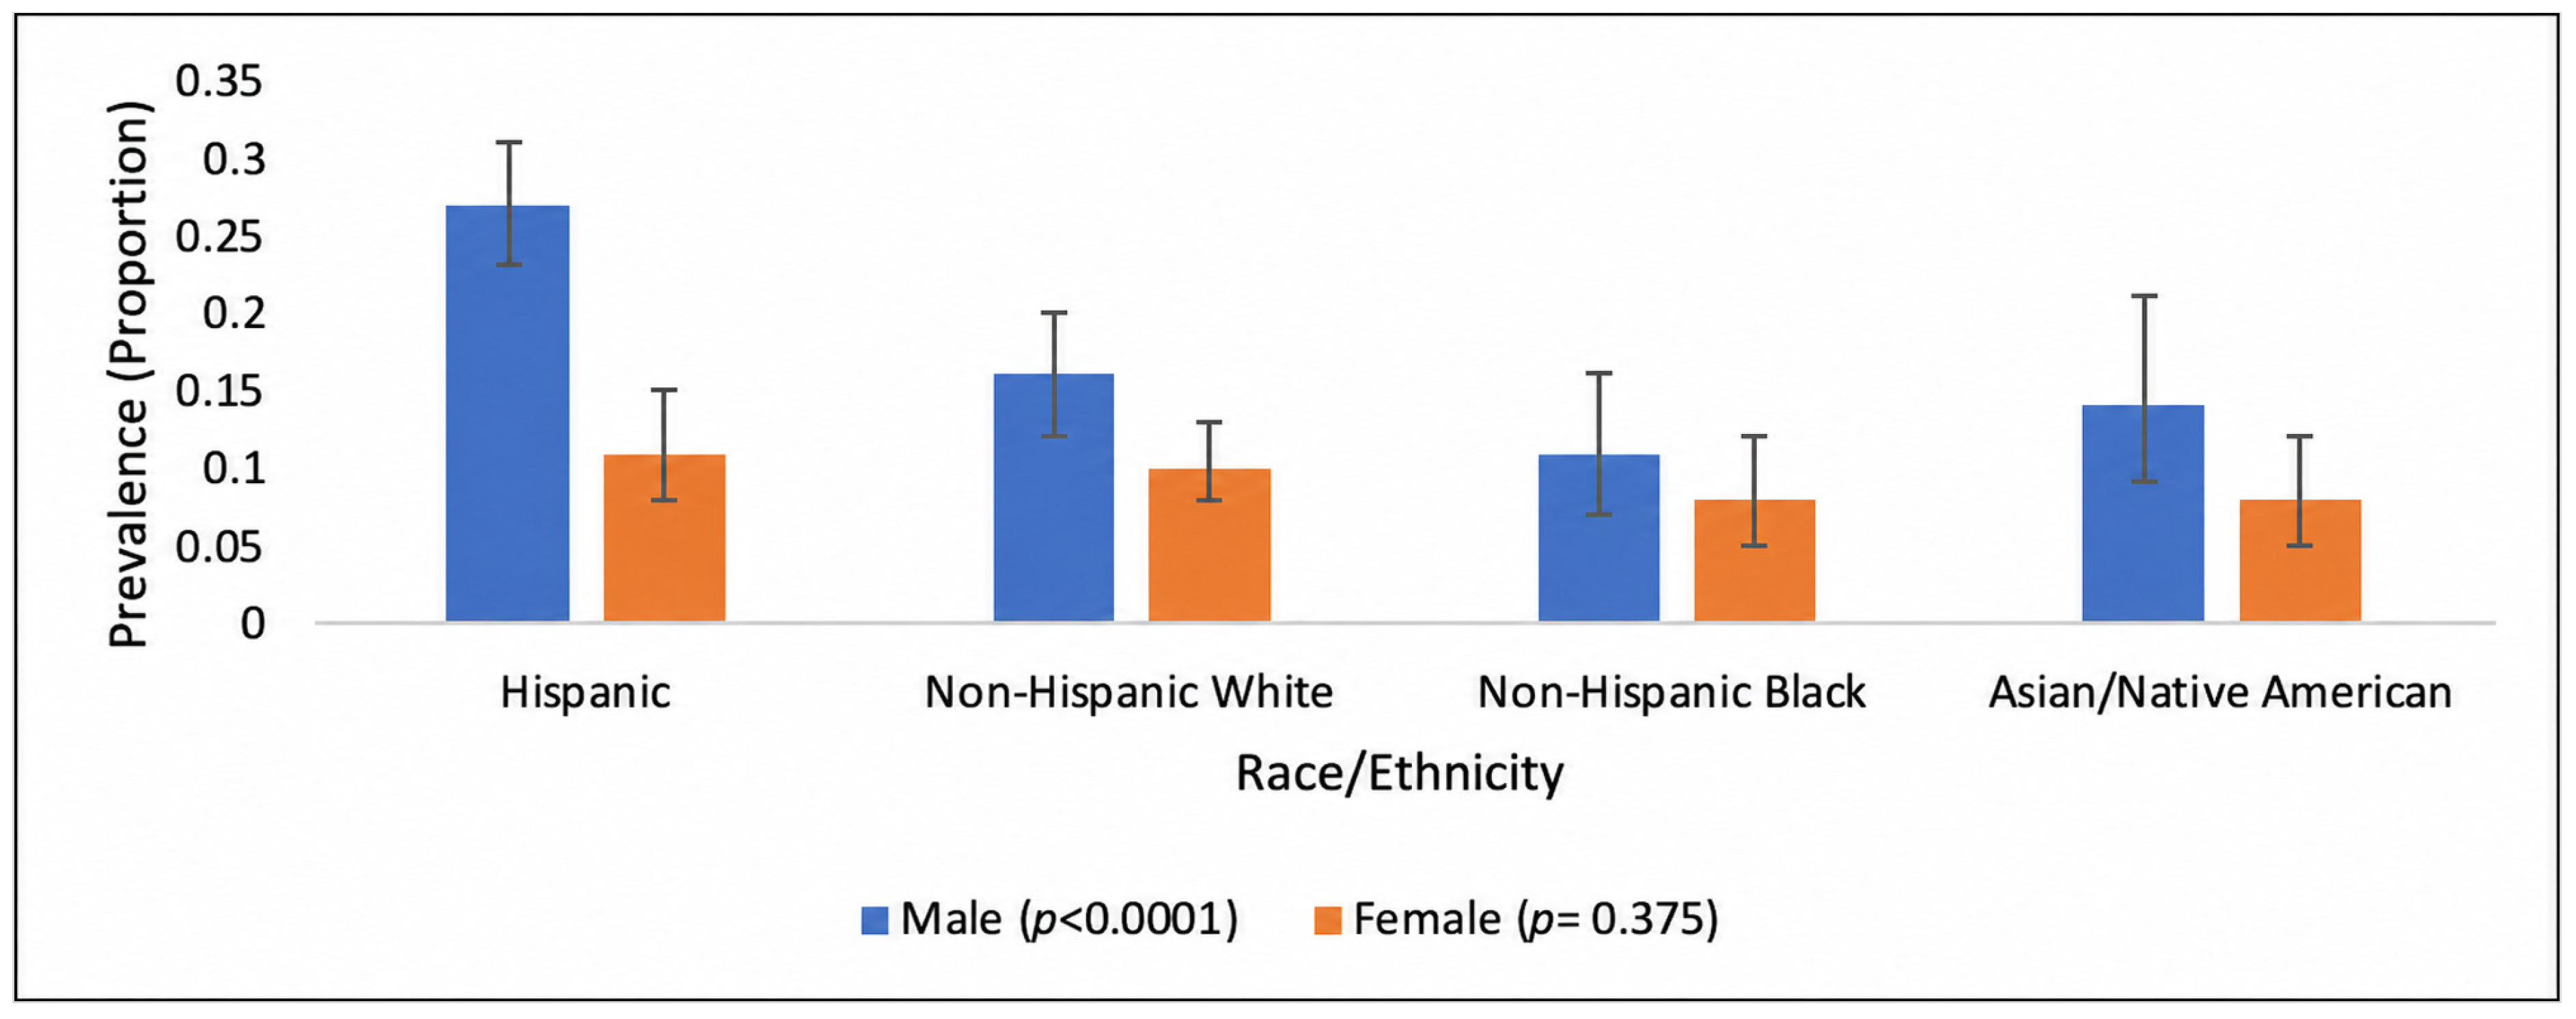
The weighted prevalence of AFLD was 14% (95% CI: 12–16%). Prevalence was significantly higher among males compared with females (17% vs. 10%, p < 0.0001) and among Hispanic participants compared with non-Hispanic Black participants (20% vs. 9%, p < 0.0001) (Figure 1). AFLD was also higher among individuals with lower educational attainment, unhealthy lifestyle, obesity and MS (p < 0.0001) (Table 3). AFLD prevalence increased progressively across worsening MOPs. In MOP 1, prevalence ranged from 5% among metabolically healthy normal weight participants to 33% among metabolically unhealthy obese participants. In MOP 2, prevalence was lowest among normal-weight individuals without MS and highest among obese individuals with MS (Table 3).
Stratified analyses demonstrated that Hispanic males had the highest AFLD prevalence, whereas non-Hispanic Black females had the lowest prevalence (Figure 2).
Survey-weighted regression analyses demonstrated significant associations between MOPs and AFLD prevalence. In MOP 1, compared with metabolically healthy normal-weight participants, metabolically unhealthy overweight participants and metabolically healthy obese participants demonstrated significantly higher AFLD prevalence. The strongest association was observed among metabolically unhealthy obese participants (PR: 7.03; 95% CI: 4.27–11.58).
Similarly, in MOP 2, overweight participants with MS and obese participants with MS demonstrated substantially higher AFLD prevalence compared with normal weight participants without MA. Obese participants with MS exhibited the strongest association overall (PR: 8.09; 95% CI: 5.60–11.71) (Table 4).
In adjusted models, obesity combined with metabolic dysfunction remained strongly associated with AFLD. Compared with metabolically healthy normal-weight participants, metabolically unhealthy obese individuals demonstrated approximately sixfold higher AFLD prevalence (adjusted PR: 6.00; 95% CI:3.58–10.04). Likewise, obese participants with MS had significantly elevated prevalence (adjusted PR: 6.73; 95% CI: 4.51–10.05). Overweight participants with MS also demonstrated increased AFLD prevalence, whereas normal weight participants with MS did not significantly differ from the reference group (Table 5).
Sex-stratified analyses demonstrated important differences in AFLD prevalence across MOP. In both MOP classification schemes, metabolically unhealthy obesity remained significantly associated with AFLD among both men and women; however, the magnitude of association was consistently greater among men.
MOP 2 demonstrated stronger discriminatory capacity than MOP 1, particularly among male participants. Overweight men with MS demonstrated significantly elevated AFLD prevalence, whereas this association was not statistically significant among women. Obesity combined with MS demonstrated the strongest association with AFLD in both sexes, with particularly elevated prevalence among men (Table 6).
Reclassification of our target cohort according to the updated international nomenclature revealed an overwhelmingly high metabolic burden. Out of the heavy-drinking subpopulation presenting with elevated liver enzymes (n = 532), the vast majority met the diagnostic criteria for some form of MetALD (97.47%; unweighted n = 515) due to the concurrent presence of one or more metabolic risk factors. Conversely, only a minute fraction of the disease cohort presented as pure ALD without any accompanying metabolic anomalies (2.53%; unweighted n = 17). Gender distribution differed significantly across severity tiers (p = 0.0418), with men disproportionately represented in the pure ALD and severe MetALD groups (Table 7).

4. Discussion

In this nationally representative study of US adults, obesity and metabolic dysfunction were strongly associated with AFLD prevalence (14%), which is higher than the global prevalence (5%). This can primarily be attributed to the study participant selection criteria which was restricted to adults aged 18–50, which is a population with higher rates of alcohol consumption than the broader adult population. Furthermore, Hispanic and non-Hispanic Black populations, who comprise a substantial proportion of the weighted US population, have been shown to bear a disproportionately higher burden of AFLD (20% and 9%, respectively), consistent with prior literature [28,29]. Participants with obesity combined with metabolic abnormalities demonstrated the greatest prevalence of AFLD, while metabolically healthy normal-weight individuals consistently exhibited the lowest prevalence. These findings suggest that metabolic dysfunction is substantially associated with alcohol-associated hepatic injury beyond alcohol consumption alone.
Our findings align with growing evidence demonstrating that metabolic dysfunction amplifies susceptibility to SLD and alcohol-related liver injury [12,30]. Obesity, insulin resistance, dyslipidemia, and hypertension are known to promote hepatic inflammation, oxidative stress, and impaired lipid metabolism, thereby exacerbating alcohol-induced hepatocellular damage [31]. The observed associations support the evolving conceptual framework of SLD, in which metabolic dysfunction plays a central role in disease progression alongside alcohol exposure.
Importantly, MOP 2, which incorporated MS criteria, demonstrated stronger associations with AFLD than MOP 1 across both sexes. One potential explanation is that ATP III MS criteria identify individuals with more advanced and clinically established cardiometabolic dysfunction. In contrast, metabolically unhealthy classifications may capture individuals with less severe or subclinical metabolic abnormalities. Consequently, MS may better identify individuals with metabolic profiles that potentiate alcohol-related hepatic injury and inflammation. This dose–response pattern was reinforced when AFLD was further stratified by the number of concurrent metabolic risk factors, which showed that over half of participants meeting AFLD criteria had three or more concurrent factors, indicating that cumulative cardiometabolic burden, not any single risk factor, distinguishes disease severity within the AFLD spectrum. This finding reinforces the rationale for the 2023 consensus nomenclature, which incorporates metabolic risk factor burden into disease classification rather than treating alcohol use and metabolic dysfunction as independent contributors [4].
Our findings are also consistent with previous epidemiologic studies reporting strong associations between obesity, dyslipidemia, diabetes, and alcohol-associated liver disease [6,32]. Furthermore, low socioeconomic status, male sex, and limited educational attainment have been associated with increased ALD burden and reduced access to preventive healthcare services [33,34].
Substantial demographic disparities were also observed. Hispanic participants, particularly Hispanic men, demonstrated the highest AFLD prevalence [28]. These findings are consistent with previous literature reporting disproportionately elevated burdens of metabolic disease and SLD among Hispanic populations [21,35]. Potential contributing factors include differences in alcohol consumption patterns, obesity prevalence, socioeconomic factors, healthcare access, and genetic susceptibility, including patatin-like phospholipase domain-containing protein 3 (PNPLA3) polymorphisms associated with hepatic fat accumulation [29,36]. Sex-specific differences were similarly notable. Men demonstrated consistently higher AFLD prevalence than women across nearly all MOPs and across the four-tier MetALD severity gradient. Biological mechanisms underlying these differences may include variations in alcohol metabolism, visceral adiposity distribution, hormonal influences, and inflammatory responses to metabolic stress [37,38].
The study has several important strengths. The use NHANES data provides nationally representative estimates and enhances generalizability to the US population. Furthermore, incorporation of MOP frameworks allowed for a more nuanced assessment of the combined influence of obesity and metabolic dysfunction on AFLD prevalence. Nevertheless, several limitations should be acknowledged. First, the cross-sectional design of NHANES precludes causal inference regarding the relationships among alcohol consumption, metabolic dysfunction, and AFLD. Second, AFLD was operationally designed using elevated ALT/AST levels combined with self-reported risky alcohol consumption rather than imaging-based liver assessment, which may have introduced misclassification bias. Although liver enzymes alone are not sufficient for definitive SLD diagnosis, NHANES lacks standardized imaging-based liver assessment across all survey cycles included in this study. Therefore, this approach was used as a pragmatic epidemiologic definition consistent with prior population-based studies. Third, alcohol consumption data were self-reported and may be subject to recall or reporting bias.
Despite these limitations, the present findings highlight the importance of integrating metabolic health assessment into alcohol-related liver disease screening and prevention strategies. Interventions targeting obesity, MS, and unhealthy lifestyle behaviors may help reduce AFLD burden, particularly among high-risk demographic groups.

5. Conclusions

In this nationally representative study of US adults, obesity and metabolic dysfunction were strongly associated with AFLD prevalence. Participants with obesity combined with metabolic abnormalities demonstrated the highest prevalence of AFLD, while Hispanic individuals and men represented disproportionately affected populations.
MOPs incorporating MS demonstrated stronger associations with AFLD than classifications based solely on metabolic health status, suggesting that MS may better capture clinically significant metabolic vulnerability related to alcohol-associated liver injury.
These findings support the importance of screening strategies that extend beyond alcohol consumption alone and incorporate assessment of obesity and metabolic dysfunction. Future longitudinal studies incorporating imaging-based liver assessment and contemporary SLD classifications are needed to further clarify the relationship between metabolic dysfunction and alcohol-associated liver disease progression.

Author Contributions

J.M. and A.D. conceived the study. S.A. and P.D. conducted data analysis. F.S. and P.D. contributed to manuscript writing and editing. All authors have read and agreed to the published version of the manuscript.

Funding

This research received no external funding.

Institutional Review Board Statement

Not applicable.

Informed Consent Statement

Not applicable.

Data Availability Statement

The raw data supporting the conclusions of this article will be made available by the authors on request.

Conflicts of Interest

The authors declare no conflicts of interest.

References

  1. Niu, X.; Zhu, L.; Xu, Y.; Zhang, M.; Hao, Y.; Ma, L.; Li, Y.; Xing, H. Global prevalence, incidence, and outcomes of alcohol related liver diseases: A systematic review and meta-analysis. BMC Public Health 2023, 23, 859. [Google Scholar] [CrossRef] [Scilit] [PubMed]
  2. Aslam, A.; Kwo, P.Y. Epidemiology and Disease Burden of Alcohol Associated Liver Disease. J. Clin. Exp. Hepatol. 2023, 13, 88–102. [Google Scholar] [CrossRef] [Scilit] [PubMed]
  3. Wong, T.; Dang, K.; Ladhani, S.; Singal, A.K.; Wong, R.J. Prevalence of Alcoholic Fatty Liver Disease Among Adults in the United States, 2001–2016. JAMA 2019, 321, 1723–1725. [Google Scholar] [CrossRef] [Scilit] [PubMed]
  4. Rinella, M.E.; Lazarus, J.V.; Ratziu, V.; Francque, S.M.; Sanyal, A.J.; Kanwal, F.; Romero, D.; Abdelmalek, M.F.; Anstee, Q.M.; Arab, J.P.; et al. A multisociety Delphi consensus statement on new fatty liver disease nomenclature. J. Hepatol. 2023, 79, 1542–1556. [Google Scholar] [CrossRef] [PubMed]
  5. Asrani, S.K.; Mellinger, J.; Arab, J.P.; Shah, V.H. Reducing the Global Burden of Alcohol-Associated Liver Disease: A Blueprint for Action. Hepatology 2021, 73, 2039–2050. [Google Scholar] [CrossRef] [Scilit] [PubMed]
  6. Yoshimura, Y.; Hamaguchi, M.; Hashimoto, Y.; Okamura, T.; Nakanishi, N.; Obora, A.; Kojima, T.; Fukui, M. Obesity and metabolic abnormalities as risks of alcoholic fatty liver in men: NAGALA study. BMC Gastroenterol. 2021, 21, 321. [Google Scholar] [CrossRef] [Scilit] [PubMed]
  7. Simonetto, D.A.; Winder, G.S.; Connor, A.A.; Terrault, N.A. Liver transplantation for alcohol-associated liver disease. Hepatology 2024, 80, 1441–1461. [Google Scholar] [CrossRef] [Scilit] [PubMed]
  8. Wong, R.J.; Singal, A.K. Trends in Liver Disease Etiology Among Adults Awaiting Liver Transplantation in the United States, 2014–2019. JAMA Netw. Open 2020, 3, e1920294. [Google Scholar] [CrossRef] [Scilit] [PubMed]
  9. Wildman, R.P.; Muntner, P.; Reynolds, K.; McGinn, A.P.; Rajpathak, S.; Wylie-Rosett, J.; Sowers, M.R. The Obese Without Cardiometabolic Risk Factor Clustering and the Normal Weight with Cardiometabolic Risk Factor Clustering: Prevalence and Correlates of 2 Phenotypes Among the US Population (NHANES 1999–2004). Arch. Intern. Med. 2008, 168, 1617–1624. [Google Scholar] [CrossRef] [Scilit] [PubMed]
  10. Grundy, S.M.; Cleeman, J.I.; Daniels, S.R.; Donato, K.A.; Eckel, R.H.; Franklin, B.A.; Gordon, D.J.; Krauss, R.M.; Savage, P.J.; Smith, S.C.; et al. Diagnosis and Management of the Metabolic Syndrome: An American Heart Association/National Heart, Lung, and Blood Institute Scientific Statement: Executive Summary. Circulation 2005, 112, 2735–2752. [Google Scholar] [CrossRef] [Scilit]
  11. Chiang, D.J.; McCullough, A.J. The Impact of Obesity and Metabolic Syndrome on Alcoholic Liver Disease. Clin. Liver Dis. 2014, 18, 157–163. [Google Scholar] [CrossRef] [Scilit] [PubMed]
  12. Åberg, F.; Byrne, C.D.; Pirola, C.J.; Männistö, V.; Sookoian, S. Alcohol consumption and metabolic syndrome: Clinical and epidemiological impact on liver disease. J. Hepatol. 2023, 78, 191–206. [Google Scholar] [CrossRef] [Scilit] [PubMed]
  13. Mitu, I.; Preda, C.; Dimitriu, C.D.; Mitu, O.; Costache, I.I.; Ciocoiu, M. Metabolic Phenotypes-The Game Changer in Quality of Life of Obese Patients? Healthcare 2022, 10, 617. [Google Scholar] [CrossRef] [Scilit] [PubMed] [PubMed Central]
  14. Kim, D.; Kim, W.; Joo, S.K.; Han, J.; Kim, J.H.; Harrison, S.A.; Younossi, Z.M.; Ahmed, A. Association between body size-metabolic phenotype and nonalcoholic steatohepatitis and significant fibrosis. J. Gastroenterol. 2020, 55, 330–341. [Google Scholar] [CrossRef] [Scilit] [PubMed]
  15. Jeong, J.H.; Kim, Y.; Yim, S.Y.; Kim, Y.G.; Han, K.D.; Seo, C.O.; Roh, S.Y.; Shim, J.; Kim, Y.H.; Choi, J.I. Sudden cardiac arrest in steatotic liver disease with metabolic dysfunction or increased alcohol intake. Heart Rhythm. 2026, 23, e1129–e1137. [Google Scholar] [CrossRef] [Scilit] [PubMed]
  16. Han, B.H.; Lee, J.; Kim, H.S.; Cho, J.H.; Han, K.; Lee, S.H. Impact of Fatty Liver Index on Cardiovascular Disease and Mortality across Alcohol Consumption Levels in Young Adults. Endocrinol. Metab. 2026. Epub ahead of print. [Google Scholar] [CrossRef] [Scilit] [PubMed]
  17. Jophlin, L.L.; Singal, A.K.; Bataller, R.; Wong, R.J.; Sauer, B.G.; Terrault, N.A.; Shah, V.H. ACG Clinical Guideline: Alcohol-Associated Liver Disease. Am. J. Gastroenterol. 2024, 119, 30–54. [Google Scholar] [CrossRef] [Scilit] [PubMed]
  18. Bellamkonda, R.; Mahalingam, S.; Ethiraj, O.; Perumal, S.K.; Arumugam, M.K.; Knoell, D.L.; Fisher, K.W.; Casey, C.A.; Kharbanda, K.K.; Rasineni, K. Effect of aging on the development and progression of alcohol-associated liver disease. Alcohol Clin. Exp. Res. 2025, 49, 1412–1423. [Google Scholar] [CrossRef] [Scilit] [PubMed]
  19. Radonjić, T.; Dukić, M.; Jovanović, I.; Zdravković, M.; Mandić, O.; Popadić, V.; Popović, M.; Nikolić, N.; Klašnja, S.; Divac, A.; et al. Aging of Liver in Its Different Diseases. Int. J. Mol. Sci. 2022, 23, 13085. [Google Scholar] [CrossRef] [Scilit] [PubMed]
  20. Anouti, A.; Mellinger, J.L. The Changing Epidemiology of Alcohol-Associated Liver Disease: Gender, Race, and Risk Factors. Semin. Liver Dis. 2023, 43, 050–059. [Google Scholar] [CrossRef] [Scilit] [PubMed]
  21. Ayares, G.; Díaz, L.A.; Fuentes-López, E.; Idalsoaga, F.; Cotter, T.G.; Dunn, W.; Simonetto, D.; Shah, V.H.; Kamath, P.S.; Lazarus, J.V.; et al. Racial and ethnic disparities in the natural history of alcohol-associated liver disease in the United States. Liver Int. 2024, 44, 2822–2833. [Google Scholar] [CrossRef] [Scilit] [PubMed]
  22. About NHANES. Centers for Disease Control and Prevention; 2024. Available online: https://www.cdc.gov/nchs/nhanes/about/index.html (accessed on 16 October 2025).
  23. What NHANES Covers and How It Works. Centers for Disease Control and Prevention; 2024. Available online: https://www.cdc.gov/nchs/nhanes/about/survey-content-operations.html (accessed on 16 October 2025).
  24. NHANES Data Collection Methods—Interviews, Examinations, and Lab Testing. Centers for Disease Control and Prevention. Available online: https://wwwn.cdc.gov/nchs/nhanes/analyticguidelines.aspx (accessed on 16 October 2025).
  25. The Basics: Defining How Much Alcohol is too Much. U.S. Department of Health and Human Services; 2025. Available online: http://www.niaaa.nih.gov/health-professionals-communities/core-resource-on-alcohol/basics-defining-how-much-alcohol-too-much (accessed on 16 October 2025).
  26. National Health and Nutrition Examination Survey: 2021 Anthropometry Procedures Manual. National Center for Health Statistics; 2021. Available online: https://wwwn.cdc.gov/nchs/data/nhanes/public/2021/manuals/2021-Anthropometry-Procedures-Manual-508.pdf (accessed on 16 October 2025).
  27. Brief Overview of Sample Design, Nonresponse Bias Assessment, and Analytic Guidelines for NHANES August 2021–August 2023. 2024. Available online: https://wwwn.cdc.gov/nchs/nhanes/continuousnhanes/overviewbrief.aspx?Cycle=2021-2023 (accessed on 16 October 2025).
  28. Levy, R.E.; Catana, A.M.; Durbin-Johnson, B.; Halsted, C.H.; Medici, V. Ethnic Differences in Presentation and Severity of Alcoholic Liver Disease. Alcohol. Clin. Exp. Res. 2015, 39, 566–574. [Google Scholar] [CrossRef] [Scilit] [PubMed]
  29. Díaz, L.A.; Lazarus, J.V.; Fuentes-López, E.; Idalsoaga, F.; Ayares, G.; Desaleng, H.; Danpanichkul, P.; Cotter, T.G.; Dunn, W.; Barrera, F.; et al. Disparities in steatosis prevalence in the United States by Race or Ethnicity according to the 2023 criteria. Commun. Med. 2024, 4, 219. [Google Scholar] [CrossRef] [Scilit] [PubMed]
  30. Arab, J.P.; Díaz, L.A.; Rehm, J.; Im, G.; Arrese, M.; Kamath, P.S.; Lucey, M.R.; Mellinger, J.; Thiele, M.; Thursz, M.; et al. Metabolic dysfunction and alcohol-related liver disease (MetALD): Position statement by an expert panel on alcohol-related liver disease. J. Hepatol. 2025, 82, 744–756. [Google Scholar] [CrossRef] [Scilit] [PubMed]
  31. Fabbrini, E.; Sullivan, S.; Klein, S. Obesity and Nonalcoholic Fatty Liver Disease: Biochemical, Metabolic, and Clinical Implications. Hepatology 2010, 51, 679–689. [Google Scholar] [CrossRef] [Scilit] [PubMed]
  32. Hagström, H.; Hegmar, H.; Moreno, C. Interactions between the metabolic syndrome and alcohol consumption increases the risk of liver disease. United Eur. Gastroenterol. J. 2024, 12, 168–176. [Google Scholar] [CrossRef] [Scilit] [PubMed]
  33. Wang, H.; Ma, L.; Yin, Q.; Zhang, X.; Zhang, C. Prevalence of Alcoholic Liver Disease and Its Association with Socioeconomic Status in North-Eastern China. Alcohol. Clin. Exp. Res. 2014, 38, 1035–1041. [Google Scholar] [CrossRef] [Scilit] [PubMed]
  34. Askgaard, G.; Jepsen, P.; Jensen, M.D.; Kann, A.E.; Morling, J.; Kraglund, F.; Card, T.; Crooks, C.; West, J. Population-Based Study of Alcohol-Related Liver Disease in England in 2001–2018: Influence of Socioeconomic Position. Am. J. Gastroenterol. 2024, 119, 1337–1345. [Google Scholar] [CrossRef] [Scilit] [PubMed]
  35. Singh, A.; Amin, H.; Garg, R.; Gupta, M.; Lopez, R.; Alkhouri, N.; MCCullough, A. Increased Prevalence of Obesity and Metabolic Syndrome in Patients with Alcoholic Fatty Liver Disease. Dig. Dis. Sci. 2020, 65, 3341–3349. [Google Scholar] [CrossRef] [Scilit] [PubMed]
  36. Chartier, K.; Caetano, R. Ethnicity and health disparities in alcohol research. Alcohol Res. Health 2010, 33, 152–160. [Google Scholar] [PubMed] [PubMed Central]
  37. Manjarrés, L.; Xavier, A.; González, L.; Garrido, C.; Zacconi, F.C.; Rivera, K.; Parra, L.; Phinikaridou, A.; Besa, C.; Andia, M.E. Sex differences in the relationship between body composition and MASLD progression in a murine model of metabolic syndrome. iScience 2025, 28, 111863. [Google Scholar] [CrossRef] [Scilit] [PubMed]
  38. Cooper, K.M.; Delk, M.; Devuni, D.; Sarkar, M. Sex differences in chronic liver disease and benign liver lesions. JHEP Rep. 2023, 5, 100870. [Google Scholar] [CrossRef] [Scilit] [PubMed]
Figure 1. Participant selection diagram.
Jcm 15 05726 g001
Figure 2. Prevalence of AFLD by Race/Ethnicity & Sex (n = 3967).
Jcm 15 05726 g002
Table 1. Demographic summary of the participants (n = 3967).
Overall (n = 3967)With AFLD (n = 532)
n (%)n (%)
Age (years) [mean (SD)]33.04 (8.34)33.04 (8.34)
Sex
   Male1955 (50)339 (63)
   Female2012 (50)193 (37)
Education
   <High school658 (11)124 (16)
   High school graduate or GED953 (24)159 (30)
   Some college or AA degree1329 (33)175 (35)
   College graduate or above1027 (32)74 (19)
Ethnicity
   Hispanic1076 (20)207 (28)
   Non-Hispanic White1466 (61)195 (58)
   Non-Hispanic black766 (10)68 (7)
   Asian/Native American659 (9)62 (7)
Marital status
   Never married1232 (31)163 (29)
   Married1482 (37.4)189 (40)
   Living with partner533 (13.4)95 (17)
   Widow/Divorced/Separated395 (10)54 (9)
   Unknown325 (8.2)31 (4)
Income
   <45K1819 (37)273 (40)
   45–100K1105 (31)145 (30)
   >100K758 (26)74 (23)
   Unknown285 (6)40 (7)
Unhealthy behavior
   No906 (26)34 (10)
   Yes3061 (74)498 (90)
Cardiac Syndrome
   No1450 (36)103 (18)
   Yes2517 (64)429 (82)
Table 2. Distribution of Exposures in the Entire Cohort (n = 3967).
n (%)
Obesity status
   Normal1673 (42)
   Overweight1312 (33)
   Obese982 (24)
MS
   No2961 (74.6)
   Yes988 (24.9)
   Unknown18 (0.5)
Metabolic Health
   Metabolic healthy403 (10)
   Metabolic unhealthy3564 (90)
MOP 1
   NW + MH825 (21)
   NM + MU848 (22)
   OW + MH422 (11)
   OW + MU890 (23)
   OB + MH203 (5)
   OB + MU779 (19)
MOP 2 *
   NW + No MS1558 (39.4)
   NM + MS111 (2.8)
   OW + No MS954 (24.2)
   OW + MS352 (8.9)
   OB + No MS449 (11.4)
   OB + MS525 (13.3)
* Data were missing for these variables; therefore, the frequencies may not sum to the total sample size (n).
Table 3. Weighted prevalence of AFLD by study exposures and covariates (n = 3967).
VariableCategoriesPrev95% CIp Value
Overall0.140.12, 0.16
SexMale0.170.15, 0.20<0.0001
Female0.100.08, 0.12
Education<High school0.190.15, 0.24<0.0001
High school graduate or GED0.180.15, 0.20
Some college or AA degree0.150.12, 0.17
College graduate or above0.080.06, 0.11
EthnicityHispanic0.200.17, 0.230.0001
Non-Hispanic White0.130.11, 0.15
Non-Hispanic black0.090.07, 0.13
Asian/Native American0.110.08, 0.15
Marital StatusNever married0.130.10, 0.160.2192
Married0.130.11, 0.16
Living with partner0.180.14, 0.23
Widow/Divorced/Separated0.140.10, 0.18
Unknown0.110.07, 0.17
Income<45K0.150.13, 0.170.5666
45–100K0.130.11, 0.16
>100K0.120.09, 0.17
Unknown0.140.10, 0.21
Unhealthy behaviorNo0.050.04, 0.07<0.0001
Yes0.170.15, 0.19
Obesity statusNormal0.050.04, 0.07<0.001
Overweight0.130.11, 0.16
Obese0.30.26, 0.34
Cardiac syndromeNo0.070.05, 0.09<0.0001
Yes0.180.16, 0.20
(MOP 1)NW + MH0.050.03, 0.07<0.0001
NM + MU0.050.04, 0.08
OW + MH0.060.04, 0.09
OW + MU0.170.13, 0.21
OB + MH0.170.11, 0.26
OB + MU0.330.28, 0.38
MOP 2NW + No MS0.050.02, 0.10<0.0001
NM + MS0.100.08, 0.13
OW + No MS0.190.15, 0.24
OW + MS0.240.19, 0.30
OB + No MS0.140.12, 0.16
OB + MS0.390.34, 0.45
Table 4. Unadjusted associations of factors/covariates with AFLD (n = 3967).
VariablePR95% CIp-Value
Age, mean (SD)1.011.00–1.020.242
Sex
   MaleReference
   Female0.570.46–0.71<0.0001
Education
   <High SchoolReference
   High School graduate or GED0.910.69–1.200.495
   Some College or AA degree0.750.55–1.020.068
   College graduate or above0.420.27–0.64<0.0001
Ethnicity
   HispanicReference
   Non-Hispanic White0.660.52–0.840.001
   Non-Hispanic Black0.470.34–0.66<0.0001
   Asian/Native American0.550.38–0.800.002
Marital Status
   Never MarriedReference
   Married1.030.77–1.380.82
   Living with a partner1.371.01–1.850.044
   Widowed/Divorced/Separated1.070.73–1.560.715
   Missing/Refused0.830.49–1.410.477
Income
   <45KReference
   45–100K0.900.71–1.130.35
   >100K0.820.58–1.160.254
   Missing0.960.63–1.460.84
Unhealthy BehaviorNo as Reference
   Yes3.322.32–4.75<0.0001
Cardiac SyndromeNo as Reference
   Yes2.601.99–3.40<0.0001
Obesity status
   NormalReference
   Overweight2.651.83–3.83<0.0001
   Obese5.934.23–8.31<0.0001
MOP 1
   NW + MHReference
   NM + MU1.140.64–2.060.649
   OW + MH1.320.64–2.700.446
   OW + MU3.542.12–5.91<0.0001
   OB + MH3.712.19–6.27<0.0001
   OB + MU7.034.27–11.58<0.0001
MOP 2
   NW + No MSReference
   NM + MS1.000.45–2.230.997
   OW + No MS2.031.34–3.090.001
   OW + MS4.923.32–7.31<0.0001
   OB + No MS3.902.73–5.58<0.0001
   OB + MS8.095.60–1.71<0.0001
PR: prevalence ratio.
Table 5. Adjusted Association of MOPs with AFLD.
VariablesPR95% CIp-Value
MOP 1
   NW + MHReference
   NM + MU1.130.62–2.050.684
   OW + MH1.210.59–2.520.594
   OW + MU3.181.87–5.39<0.0001
   OB + MH3.211.92–5.38<0.0001
   OB + MU6.003.58–10.04<0.0001
MOP 2
   NW + No MSReference
   NM + MS1.050.46–2.380.913
   OW + No MS1.921.25–2.930.003
   OW + MS4.262.80–6.48<0.0001
   OB + No MS3.692.52–5.38<0.0001
   OB + MS6.734.51–10.05<0.0001
The model was adjusted for age, sex, education, ethnicity, marital status, income, and unhealthy behavior.
Table 6. Adjusted Association of MOPs with AFLD Stratified by Sex.
MaleFemale
OR95% CIp-ValueOR95% CIp-Value
MOP 1
NW + MHReference
NM + MU0.700.32–1.550.3751.580.69–3.580.271
OW + MH1.110.45–2.740.8171.580.66–3.800.294
OW + MU4.302.33–7.92<0.00012.190.97–4.920.058
OB + MH4.502.27–8.89<0.00012.060.80–5.310.132
OB + MU8.194.41–15.23<0.00014.442.21–8.91<0.001
MOP 2
NW + No MSReference
NM + MS0.610.12–2.960.5270.900.30–2.650.84
OW + No MS2.771.69–4.54<0.00011.420.76–2.660.264
OW + MS7.514.70–11.97<0.00012.151.12–4.110.022
OB + No MS5.943.71–9.50<0.00012.221.19–4.140.014
OB + MS10.926.86–17.37<0.00014.082.33–7.13<0.001
Table 7. Baseline Characteristics Stratified by a 4-Tier 2023 Consensus Nomenclature Severity Gradient.
Baseline CharacteristicsPure ALD
(0 Anomalies)
n = 17
Mild MetALD
(1 Anomaly)
n = 84
Moderate MetALD
(2 Anomalies)
n = 158
Severe MetALD
(≥3 Anomalies)
n = 273
Total Cohort
n = 532
p-Value
Cohort Fraction, n (%)17 (2.53)84 (15.79)158 (29.70)273 (51.32)532 (100.00)
Gender, n (%) 0.0418
Male12 (76.93)58 (60.90)86 (52.49)183 (69.50)339 (63.31)
Female5 (23.07)26 (39.10)72 (47.51)90 (30.50)193 (36.69)
Education Level, n (%) 0.4599
 <High School5 (22.70)21 (19.15)31 (12.90)67 (16.25)124 (15.89)
 High School Graduate/GED2 (23.69)28 (28.89)52 (36.94)77 (26.99)159 (30.13)
 Some College or AA degree6 (38.83)21 (29.28)47 (28.77)101 (40.42)175 (35.18)
 College Graduate or above4 (14.78)14 (22.68)28 (21.39)28 (16.34)74 (18.79)
Ethnicity, n (%) 0.1176
 Hispanic8 (43.13)23 (17.58)69 (32.98)107 (27.69)207 (28.03)
 Non-Hispanic White6 (47.29)31 (67.58)50 (51.13)108 (59.11)195 (57.81)
 Non-Hispanic Black2 (7.32)15 (8.35)23 (9.20)28 (5.51)68 (7.09)
 Others1 (2.25)15 (6.48)16 (6.70)30 (7.68)62 (7.07)
Marital Status, n (%) 0.0698
 Never Married8 (53.56)41 (40.40)41 (25.83)73 (25.89)163 (28.88)
 Married2 (14.14)17 (32.92)53 (36.97)117 (45.92)189 (40.42)
 Living with Partner4 (19.37)15 (12.79)31 (21.82)45 (16.33)95 (17.46)
 Widow/Divorced/Separated1 (5.55)4 (7.50)18 (9.23)31 (10.18)54 (9.36)
 Missing/Unknown2 (7.38)7 (6.38)15 (6.15)7 (1.67)31 (3.88)
Income Classification, n (%) 0.2823
 <45K10 (64.14)43 (40.41)74 (41.73)146 (38.68)273 (40.50)
 45–100K5 (25.64)20 (21.27)39 (24.98)81 (35.34)145 (29.81)
 >100K1 (3.91)13 (31.87)27 (25.43)33 (20.01)74 (23.08)
 Missing1 (6.31)8 (6.44)18 (7.86)13 (5.96)40 (6.61)
Unhealthy Behavior, n (%) 0.4962
 No0 (0.00)6 (14.61)15 (11.23)13 (7.81)34 (9.70)
 Yes17 (100.00)78 (85.39)143 (88.77)260 (92.19)498 (90.30)
Note: Percentages inside parentheses represent design-weighted, complex survey column proportions. Whole integers represent absolute unweighted sample observation counts. p-values reflect the Second-Order Rao–Scott adjusted design-based Pearson F-test.
Disclaimer/Publisher’s Note: The statements, opinions and data contained in all publications are solely those of the individual author(s) and contributor(s) and not of MDPI and/or the editor(s). MDPI and/or the editor(s) disclaim responsibility for any injury to people or property resulting from any ideas, methods, instructions or products referred to in the content.