1. Introduction
Breast cancer remains the most common malignancy in women worldwide, with 2.3 million new cases recorded in 2022 according to GLOBOCAN data [
1]. Neoadjuvant chemotherapy (NAC) is the standard approach in locally advanced disease, achieving pathologic complete response (pCR) in 6–25% of patients; those who attain pCR carry a meaningfully better overall survival [
2]. Contrast-enhanced MRI (CE-MRI) has become the dominant non-invasive modality for monitoring treatment response—though the evidence base for this position is less settled than its routine use might suggest. A meta-analysis spanning 54 studies found specificity reaching 0.92, yet sensitivity stalled at 0.64 [
3]. Diffusion-weighted imaging (DWI) outperformed CE-MRI with an area under the curve (AUC) of 0.94, and a series of 1062 patients identified 1.22 × 10
−3 mm
2/s as the optimal post-NAC apparent diffusion coefficient (ADC) threshold for distinguishing residual disease from complete response [
4].
The limited sensitivity of CE-MRI traces back to several converging problems: fibrosis, non-mass enhancement (NME), and peritumoural oedema all generate false-positive signals, while size measurement inconsistencies vary by molecular subtype [
3,
4]. An individual patient data meta-analysis found that MRI–pathology agreement limits extended to ±3.8 cm—a discrepancy that directly calls into question the reliability of CE-MRI as a standalone decision-making tool [
5]. Meta-regression of dynamic contrast-enhanced MRI studies further revealed that no covariate could account for the I
2 = 58–65% heterogeneity across studies, pointing to a lack of acquisition and interpretation standardisation as the root of threshold instability [
2,
6]. Pre-treatment ADC has shown considerable overlap between responders and non-responders. The percentage change in ADC (ΔADC%) appears more discriminating, but sample sizes ranging from 24 to 174 patients and the absence of subtype-specific cut-off values have limited its clinical translation [
1]. Models combining MRI with Ki-67 carry the same problem in a different form—I
2 = 77% and unresolved protocol heterogeneity [
7].
Against this backdrop, studies that evaluate post-NAC CE-MRI accuracy together with post-treatment ADC and ΔADC, while accounting for molecular subtype differences, remain underrepresented in the literature. The biological rationale is straightforward: tumour cell death in cases achieving pCR increases free water diffusivity, which should raise both post-treatment ADC and ΔADC and, in principle, help resolve the false-positive cases that CE-MRI cannot. The stakes are highest in exactly these patients—the ones CE-MRI judges to be complete responders—because the error that matters here is not over-treatment but its opposite: when CE-MRI reports a clear tumour bed while residual disease is in fact present, the real hazard is that the patient is undertreated or wrongly considered for de-escalation, not that surgery is carried out needlessly. Any step in that direction would first have to be confirmed in prospective, externally validated cohorts. For that reason we approached post-treatment ADC primarily as a confirmatory step in this group rather than as a general post-NAC biomarker. We therefore set out to assess the diagnostic accuracy of post-NAC CE-MRI for confirming pCR and to determine whether ADC and ΔADC contribute independently to distinguishing pCR from residual disease and whether applying a post-treatment ADC threshold to the CE-MRI complete responders could correctly reclassify the false positives without missing any true responders. We evaluated these questions using sensitivity, specificity, positive predictive value (PPV), negative predictive value (NPV), and receiver operating characteristic (ROC) parameters as the primary benchmarks.
2. Materials and Methods
2.1. Study Population
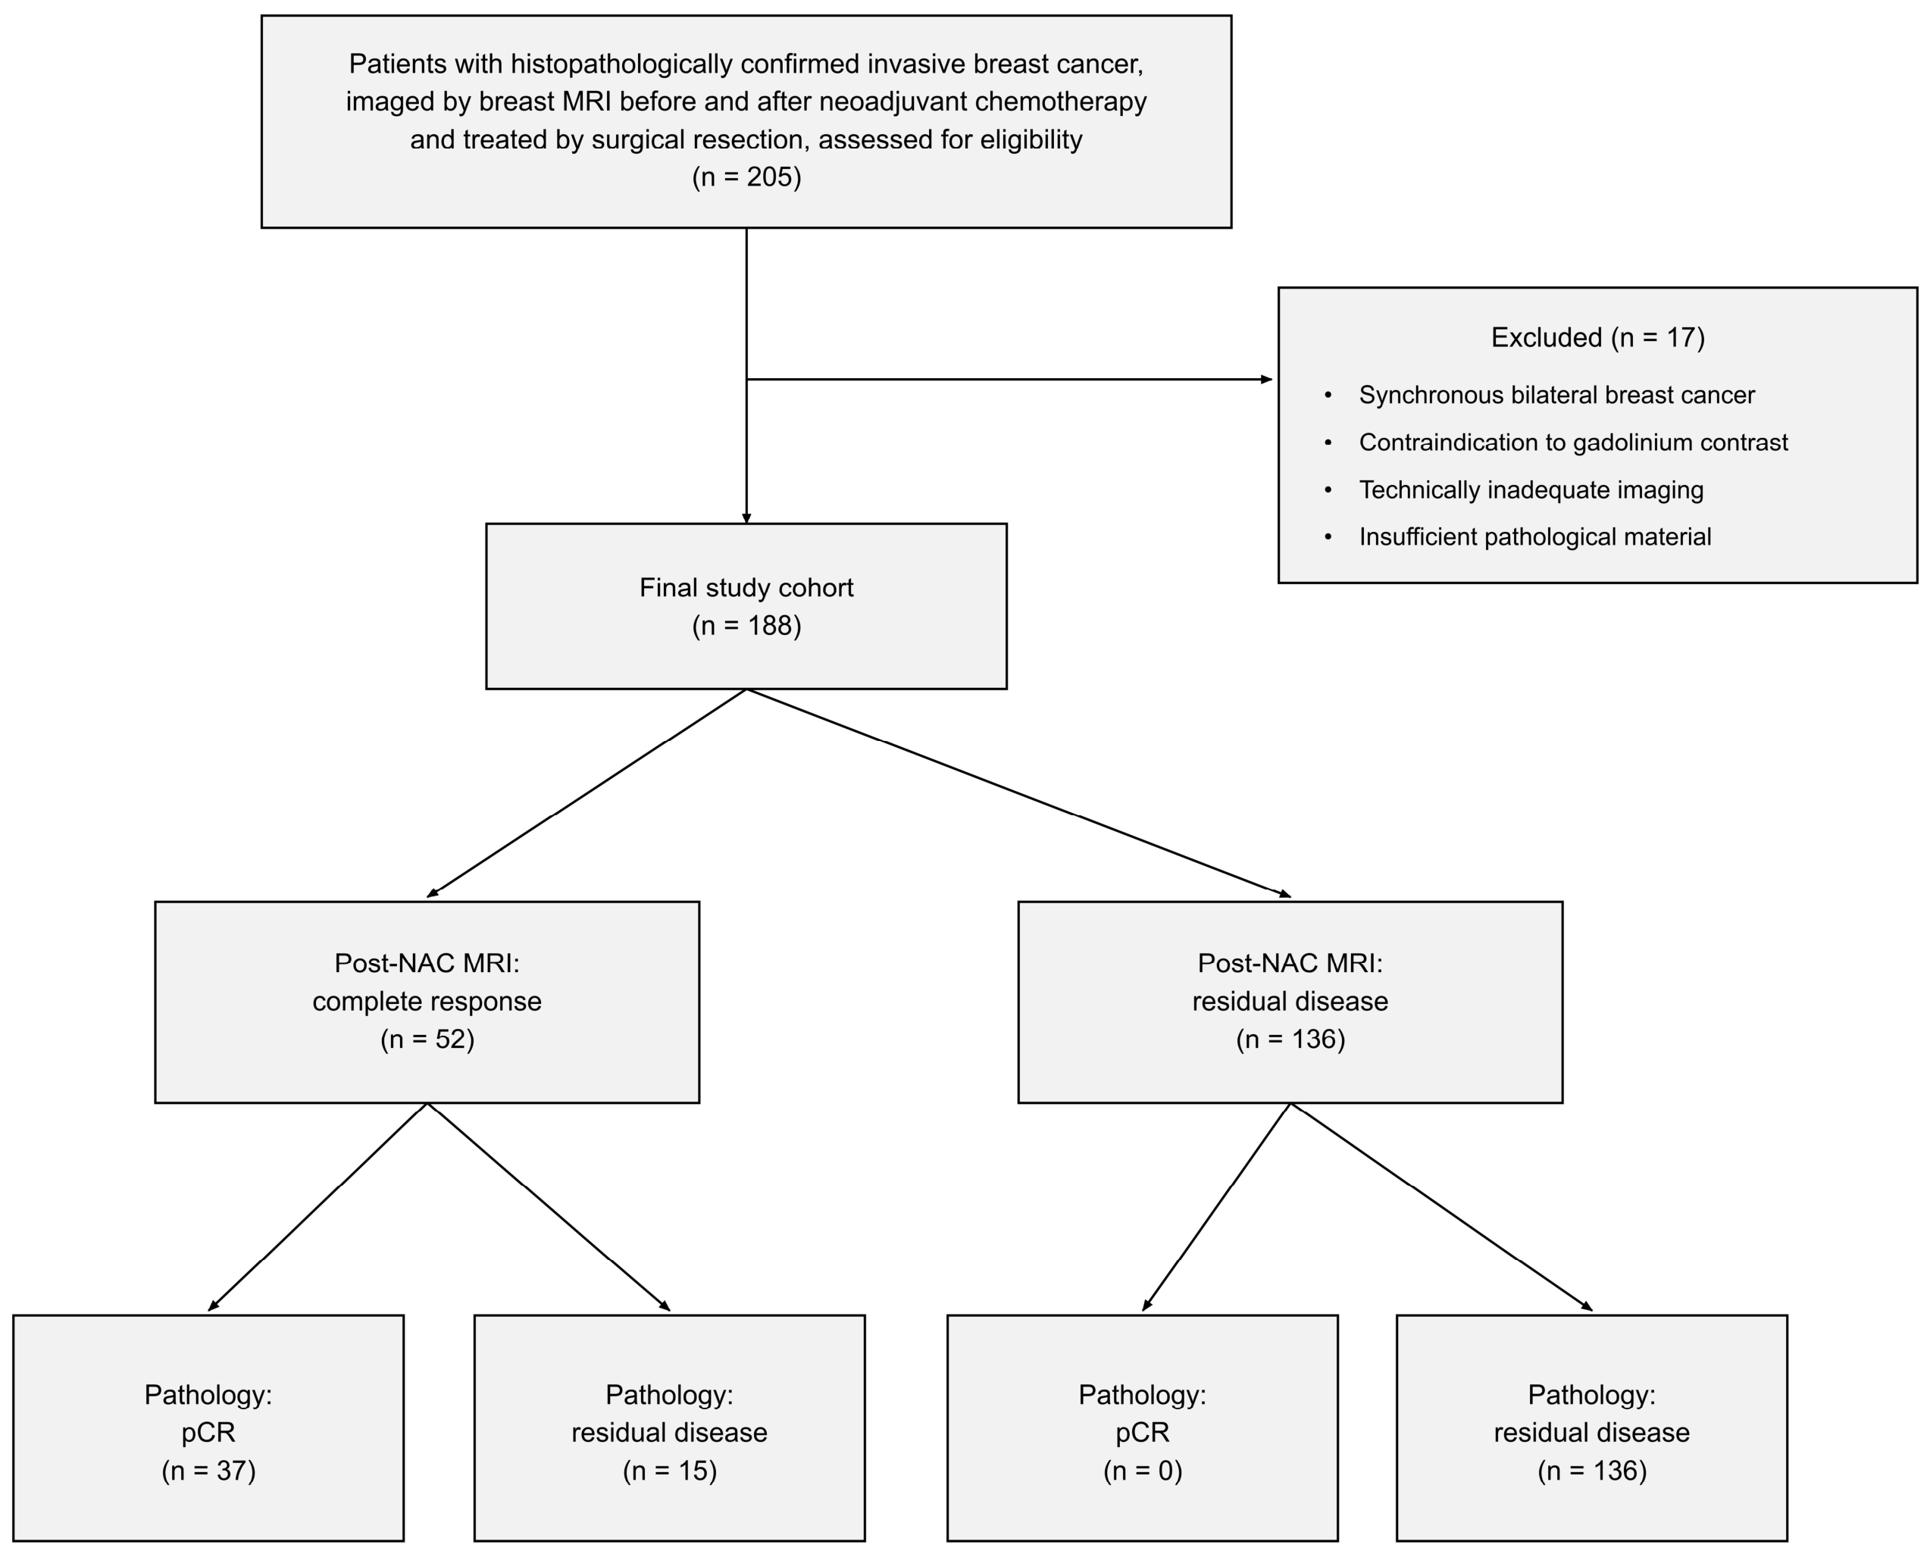
This single-centre retrospective cohort study enrolled patients with histopathologically confirmed invasive breast cancer who had undergone breast MRI both before and after neoadjuvant chemotherapy (NAC) and subsequently proceeded to surgical resection. Consecutive patients managed at our institution between January 2017 and December 2023 were screened for eligibility. Patients with synchronous bilateral breast cancer, a contraindication to gadolinium-based contrast agents, technically inadequate imaging, or insufficient pathological material were excluded. Of 205 patients assessed for eligibility, 17 met an exclusion criterion, leaving 188 patients in the final analysis (
Figure 1). Age, maximum tumour diameter, Ki-67 proliferation index, and receptor status—oestrogen receptor (ER), progesterone receptor (PR), and human epidermal growth factor receptor 2 (HER2)—were retrieved from medical records. Post-treatment ADC was evaluated both across the whole cohort and, specifically, as a second-step confirmatory test in patients classified as complete responders on contrast-enhanced MRI (CE-MRI).
2.2. Imaging Protocol and Measurements
All MRI examinations were performed on the same 3.0 Tesla scanner using a standardised breast protocol. On pre-treatment imaging, T2-weighted signal characteristics were classified into five categories (hypointense, hyperintense, isointense, iso-hyperintense, and iso-hypointense). Tumour morphology was systematically recorded: shape (irregular or non-irregular), margin characteristics (spiculated, irregular, or other), and internal enhancement pattern (heterogeneous, homogeneous, or rim-type). The kinetic curve was classified according to late-phase signal behaviour as Type 1 (progressive increase), Type 2 (plateau), or Type 3 (washout). Cases in which signal intensity increased by ≥100% within the first two minutes after injection were designated as rapid enhancers; the remainder were classified as slow. Multifocality, multicentricity, peritumoural oedema, skin thickening, nipple involvement, chest wall involvement, and the presence of non-mass enhancement (NME) were also recorded as part of the imaging assessment.
Examinations were reviewed independently by two breast radiologists with 8 and 12 years of breast-imaging experience who were blinded to the pathological outcome, and disagreements were resolved by consensus. On diffusion-weighted imaging (DWI; b = 0 and 800 s/mm
2), regions of interest were drawn manually within the tumour at the highest b-value, targeting the area of most restricted diffusion on a single representative slice while avoiding cystic, necrotic, and haemorrhagic areas. Pre-treatment minimum and maximum apparent diffusion coefficient values [Pre-ADC (min) and Pre-ADC (max), ×10
−6 mm
2/s] were measured in this way [
8,
9]. Inter-observer reproducibility of ADC measurements was assessed in a random subset of 50 cases, yielding an intraclass correlation coefficient of 0.91, indicating excellent agreement.
After completion of NAC, the same MRI protocol was repeated; post-treatment ADC (Post-ADC) and residual tumour long-axis diameter in millimetres were recorded. The median interval between post-NAC MRI and surgery was 21 days, with a range of 7–42 days. Two separate enhancement readings were taken from each post-treatment study, and both were made by the same two blinded radiologists in consensus. The first was a simple binary record of whether any focal contrast enhancement was visible within the tumour bed, documented as present or absent; this reading was deliberately inclusive and registered even faint, non-suspicious enhancement. MRI response was categorised as complete response, partial response, stable disease, or indeterminate; complete response was defined as the complete absence of abnormal contrast enhancement in the tumour bed, where abnormal enhancement was specified in advance as a residual enhancing mass or non-mass lesion judged suspicious for tumour at the tumour-bed site. Minimal benign background parenchymal enhancement was not counted as abnormal and did not, by itself, exclude a complete-response reading. Any residual enhancing mass or non-mass lesion meeting this threshold was classified as partial response or stable disease, and examinations in which enhancement could not be reliably characterised were classified as indeterminate. For binary comparisons, the latter three categories were combined into a single “residual disease” group. Because the binary present/absent descriptor and the response categorisation followed different rules, a tumour bed could be marked as showing enhancement on the binary descriptor and still be read as a complete responder, as long as that enhancement stayed faint and below the threshold set for abnormal residual disease. The percentage change in ADC (ΔADC) was calculated as: ΔADC (%) = [(Post-ADC − Pre-ADC (min))/Pre-ADC (min)] × 100 [
9,
10].
2.3. Surgical Management and Pathological Assessment
The NAC regimen was determined by the multidisciplinary oncology board, and all patients who completed chemotherapy proceeded to surgical resection. Patients received standard anthracycline- and taxane-based chemotherapy regimens, and HER2-positive patients received anti-HER2 therapy; dual HER2 blockade and immunotherapy were not used in this cohort. The choice between breast-conserving surgery and mastectomy was made by the board, incorporating tumour response and patient preference. All resection and axillary specimens were examined by an experienced breast pathologist following a standardised protocol. Pathologic complete response (pCR) was defined as the complete absence of residual invasive and in situ tumour in the primary tumour bed and sampled lymph nodes; residual ductal carcinoma in situ was not considered compatible with pCR (ypT0 ypN0 definition applied) [
11].
2.4. Statistical Analysis
The distribution of continuous variables was assessed with the Shapiro–Wilk test; all continuous variables departed from normality (p < 0.001) and are therefore reported as a median with an interquartile range (IQR). Between-group comparisons of pCR and non-pCR cases used the Mann–Whitney U test. Categorical variables are presented as counts and percentages. Chi-square testing was applied when all expected cell counts were ≥5; Fisher’s exact test was used for 2 × 2 tables with expected counts below this threshold, including cells with zero observations, and the Freeman–Halton exact test was applied to larger contingency tables. Indeterminate examinations were grouped with residual disease for the binary analysis, and no study variable had missing data.
Throughout the analysis the target (positive) condition was pathological complete response, and an MRI complete-response reading was treated as the positive test result; sensitivity, specificity, and the predictive values are accordingly expressed with respect to pCR rather than to the detection of residual disease. The agreement between post-treatment MRI assessment and pathological outcome was quantified by sensitivity, specificity, positive predictive value (PPV), negative predictive value (NPV), and overall accuracy. Confidence intervals were derived by the Wilson score method, and categorical concordance between MRI and pathology was expressed as Cohen’s kappa coefficient. The predictive value of ADC parameters for pCR was evaluated by receiver operating characteristic (ROC) curve analysis and the area under the curve (AUC), with 95% confidence intervals estimated by 2000-iteration bootstrap resampling and optimal thresholds identified by the Youden index. The optimism of these data-derived thresholds was examined within the same bootstrap framework by computing the optimism-corrected AUC, and the stability of each cut-off was summarised as its median and interquartile range across resamples. The incremental value of post-treatment ADC beyond CE-MRI was assessed both by direct comparison of diagnostic performance and by applying the Post-ADC threshold as a sequential confirmatory step within CE-MRI complete responders. Independent predictors of pCR were evaluated by logistic regression; because only 37 patients achieved pCR, the multivariable analysis was kept deliberately parsimonious and estimated by Firth penalised regression. As ΔADC is mathematically derived from Post-ADC, the two parameters were entered into separate models, and ER and PR were not modelled together with HER2 owing to receptor-status collinearity. Because the biological heterogeneity of HER2-positive and HER2-negative subgroups may confound pre-treatment ADC performance, pre-ADC parameters were also examined by HER2-stratified ROC analysis, with pCR and non-pCR cases compared separately within each subgroup. Post-ADC and ΔADC thresholds derived from the full-cohort analysis were applied as fixed reference values in subgroup analyses. A two-tailed p < 0.05 was considered statistically significant throughout.
2.5. Ethics
The study was conducted in accordance with the Declaration of Helsinki and approved by the Institutional Ethics Committee of Adıyaman University (Protocol No: 2024/7-11; date of approval: 17 September 2024). Given the retrospective design, the requirement for individual written informed consent was waived by the ethics committee; all patient data were fully anonymised prior to analysis.
4. Discussion
The question of whether post-NAC imaging can reliably confirm pCR has gained clinical urgency as de-escalation strategies—omitting axillary dissection, reducing adjuvant therapy—become increasingly tied to response assessment. We raise this only as the clinical context that motivated the study; our single-centre findings are not in themselves grounds for any such de-escalation, which would first require prospective, externally validated evidence. Our findings reinforce CE-MRI’s strength as a rule-out tool while exposing the limits that make it insufficient as a standalone arbiter of pCR. The 15 false-positive cases are not a marginal finding; they mean that roughly one in three patients whom MRI labelled as complete responders still harboured residual disease at pathology. That gap is where Post-ADC and ΔADC matter most, and it is the gap we set out to close: applied to these same complete responders—the 52 patients whose tumour beds showed no abnormal enhancement on CE-MRI—a post-treatment ADC threshold reclassified 10 of the 15 false positives as residual disease while keeping every true responder correctly identified (
Table 7).
Post-treatment CE-MRI achieved 100% sensitivity and 100% NPV, placing it well above the pooled sensitivity of 0.83 reported in the broader literature—no true pCR case was missed [
12]. Our specificity (90.1%) and accuracy (92.0%) were close to those reported by Zhang et al. in a series of 177 patients (97.44% and 93.79%, respectively), though our PPV (71.2%) fell somewhat short of their 77.78% [
13]. The Cohen’s kappa of 0.781 exceeded both the 0.60 recorded in the non-immunotherapy triple-negative breast cancer (TNBC) subgroup and the overall cohort value of 0.57 in Dhungana et al., suggesting that MRI–pathology concordance may be stronger in standard chemotherapy-treated populations unaffected by immunotherapy-related inflammatory changes [
14]. Yet the PPV of 71.2% is hard to ignore: nearly three in ten MRI-designated complete responders did not achieve pCR. Wu et al. reported that a biologically based model built on quantitative MRI raised specificity from 79%, the value obtained with tumour volume alone, to 95% [
15], and our data point the same way: pairing CE-MRI with a diffusion measurement recovers much of the specificity that imaging morphology by itself leaves behind.
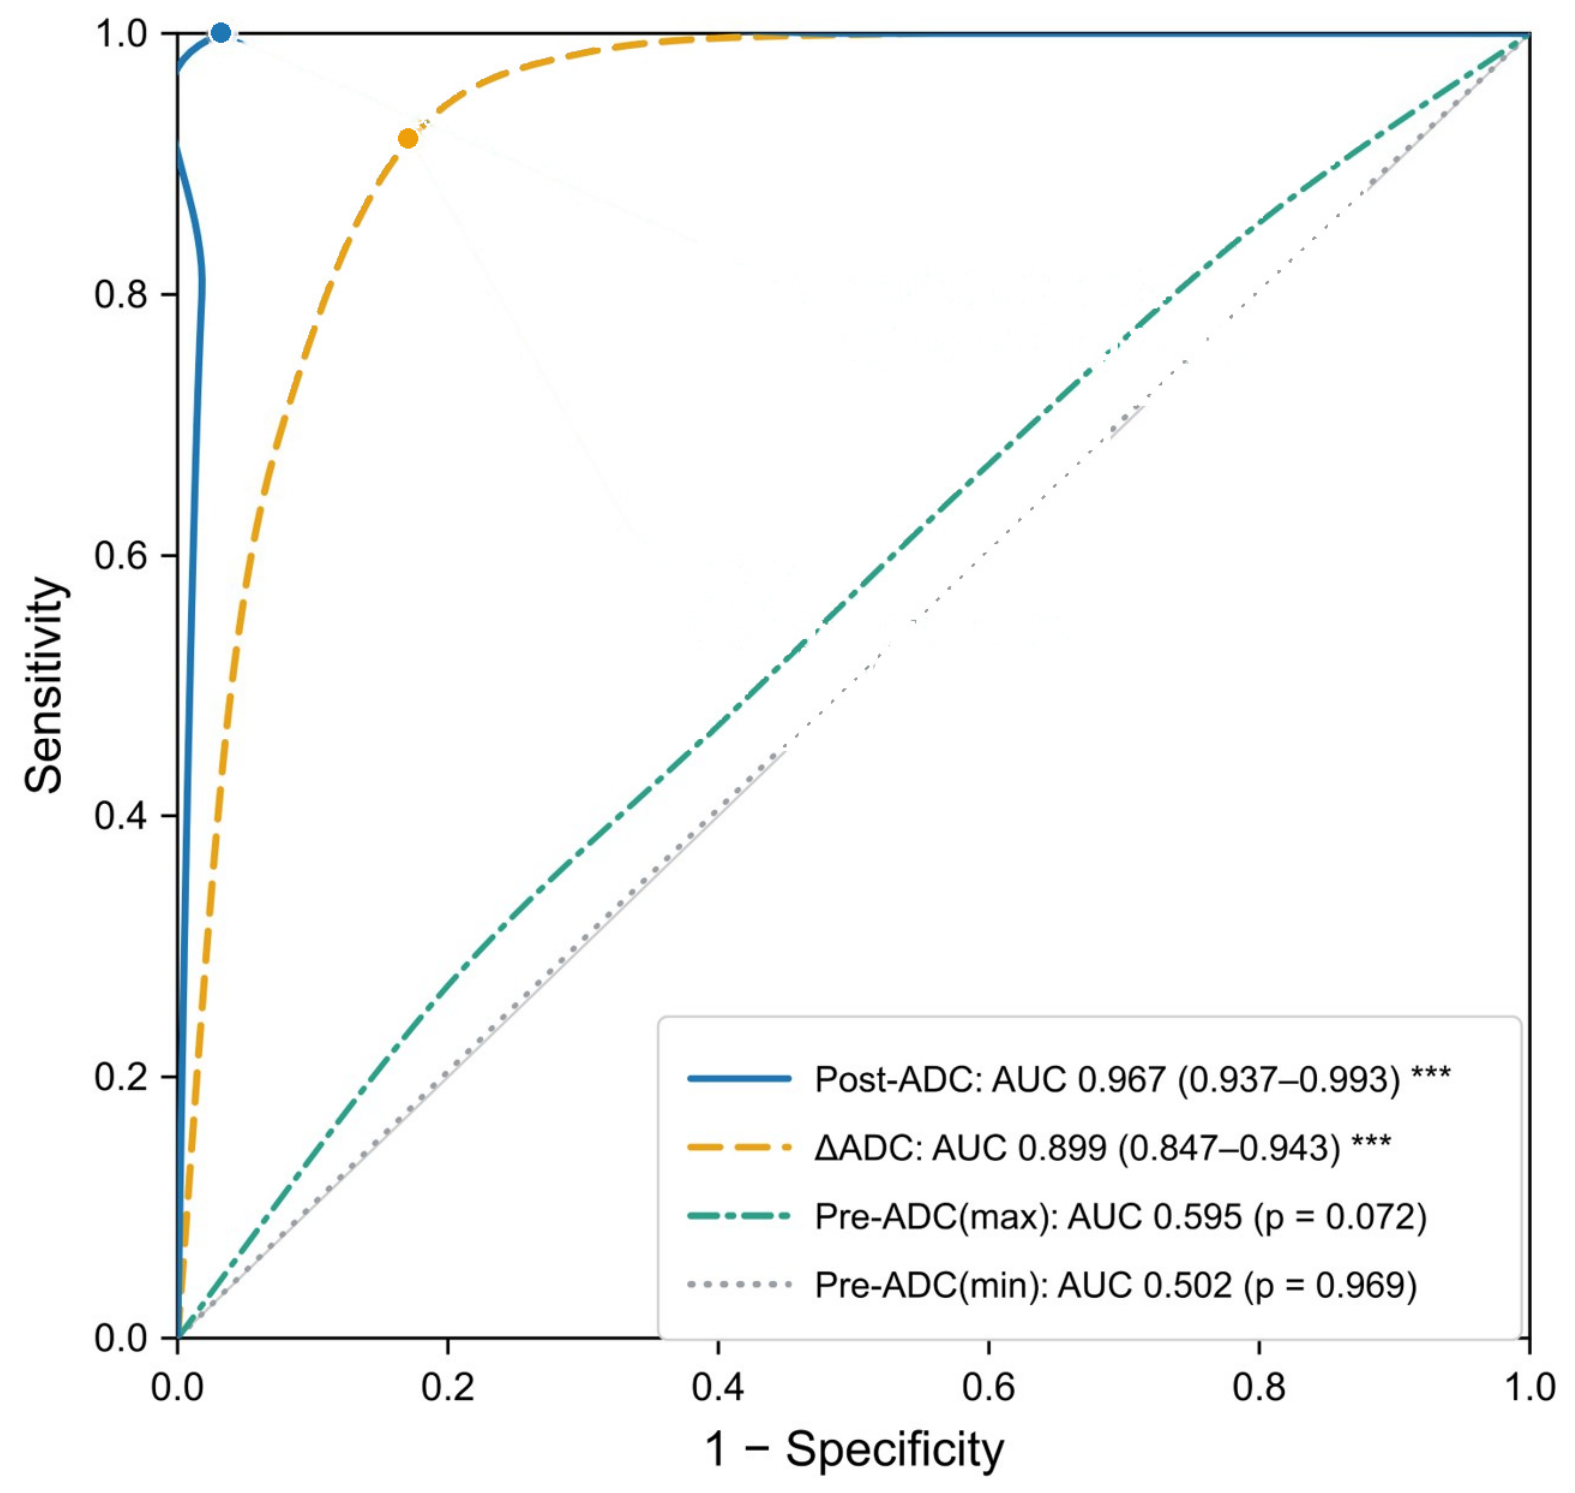
The biological basis for post-treatment ADC elevation in pCR is well established—tumour cell death increases extracellular free water, driving diffusivity upward. Our results confirm this clearly. Median Post-ADC in pCR patients reached 1712 × 10
−6 mm
2/s versus 1115 × 10
−6 mm
2/s in non-pCR patients, and Post-ADC achieved an AUC of 0.967, the highest in this study. The post-treatment ADC values we measured fall in the range reported by Partridge et al., whose whole-tumour ADC reached a mean of about 1.62 × 10
−3 mm
2/s at the post-treatment time point, even though ADC alone discriminated only modestly in that multicentre trial [
16]. That modest stand-alone performance has motivated more elaborate diffusion models, such as the restriction spectrum imaging approach of Andreassen et al., intended to sharpen a response signal that a single ADC threshold can miss [
17]. We attribute the gap between those reports and ours to ROI methodology, b-value selection, and the measurement noise introduced by multicentre technical heterogeneity, all of which tend to blunt ADC’s discriminatory signal. An AUC of 0.967 is unusually high for this task, and we treat it with caution: the threshold was both derived and tested in the same cohort, so some optimism is unavoidable. Bootstrap optimism correction lowered it only slightly, to 0.958, and the cut-off was stable across resamples (
Table 6); after adjustment, Post-ADC also remained an independent predictor of pCR (
Table 8). These checks are reassuring, but they are internal—not a substitute for validation in an independent cohort.
For ΔADC, our optimal threshold of 76.3% substantially exceeds the mid-treatment 50% increase reported in the multicentre series by Partridge et al. [
16]. The difference is consistent with two factors: the measurement consistency that comes with a single-centre protocol, and the more complete tissue response expected at the post-treatment time point compared with interim imaging. Suo et al. found that diffusion change alone predicted pCR with an AUC in the region of 0.75–0.83, rising to 0.905 once oestrogen-receptor and HER2 status were added [
18]. Our data fit the same picture: any focal tumour-bed enhancement was present in 88.1% of non-pCR cases but only 16.2% of pCR cases, adding information beyond Post-ADC alone. Liang et al. similarly reported that appending DCE-MRI parameters to ADC increased specificity from 56.84% to 95.79%, reinforcing the case for multiparametric rather than single-parameter assessment [
19].
HER2 positivity was the strongest baseline predictor of pCR in our cohort (64.9% vs. 28.5%;
p < 0.001). This rate aligns closely with the 61.5% reported by Jung et al. in a purely HER2-positive series and the 62.2% recorded by Falcón González et al. across 310 HER2-positive patients in a real-world setting [
20,
21]. The association between hormone receptor negativity and pCR followed the expected direction; in Fang et al.’s series of 279 patients, the ER/PR-negative HER2-positive subtype reached a pCR rate of 45.83%, whereas the ER/PR-positive HER2-negative group reached only 7.8% [
22].
The Ki-67 finding deserves pause. Median Ki-67 was lower in pCR patients (10% vs. 20%), which may seem counterintuitive. Jung et al. found no significant relationship between Ki-67 and pCR in their HER2-positive series (
p = 0.743), and the most plausible interpretation is that HER2-directed therapy drives response independently of the proliferation index, while high-Ki-67 luminal B tumours in the non-pCR group inflate the group median [
20]. Falcón González et al. identified Ki-67 >20% as an independent predictor in a mixed HER2-positive series but explicitly cautioned that this relationship cannot be disentangled from hormone receptor status [
21]. In the HR-positive/HER2-negative subset, Ki-67 lost independent predictive value on multivariate analysis—consistent with Topal and Başak’s findings—with low ER percentage emerging as the more decisive variable [
23]. The association between younger age and pCR (median 45 vs. 52 years;
p < 0.001) diverges from Fang et al.’s data, and we suspect this reflects the relatively higher proportion of HER2-positive and triple-negative tumours among younger patients in our cohort rather than age as an independent biological determinant [
22].
Peritumoural oedema was markedly more prevalent in pCR patients (70.3% vs. 34.4%;
p < 0.001), a finding consistent with its proposed biological basis in immune activation and increased vascular permeability. Kwon et al. identified post-NAC peritumoural oedema on MRI as the strongest independent prognostic factor for both distant metastasis-free survival and overall survival in luminal breast cancer, with a prognostic separation that exceeded that of pCR itself [
24]. Tumour margin, internal enhancement pattern, and T2-weighted signal characteristics also differed significantly between groups. The complete absence of nipple involvement in pCR patients (0% vs. 14.6%;
p = 0.009) points to a consistent negative association that may reflect more locally advanced disease in that subgroup. Heacock et al., working exclusively with HER2-positive patients, found that neither internal enhancement type (
p = 0.136) nor lesion shape (
p = 0.391) predicted pCR, reinforcing the view that morphological features carry subtype-dependent weight [
25]. Multifocality, multicentricity, skin thickening, chest wall involvement, NME, kinetic curve type, and enhancement rate showed no association with pCR in our analysis—a finding that narrows the pre-treatment MRI features with genuine discriminatory value.
Pre-ADC (min) performed near chance (AUC = 0.502;
p = 0.969), and Pre-ADC (max) failed to reach significance (AUC = 0.595;
p = 0.072) in the full-cohort analysis. Musall et al. similarly found pre-treatment tumour ADC values non-predictive of pCR in a TNBC series, and we interpret both results as a dilution effect: combining HER2-positive and HER2-negative tumours—which carry biologically distinct ADC profiles—in a single analysis obscures any subtype-specific signal [
26]. Lin et al. confirmed the ceiling of single-modality morphological assessment by showing that adding radiomic parameters to clinicopathological features raised pCR prediction AUC from 0.689 to 0.852 [
27].
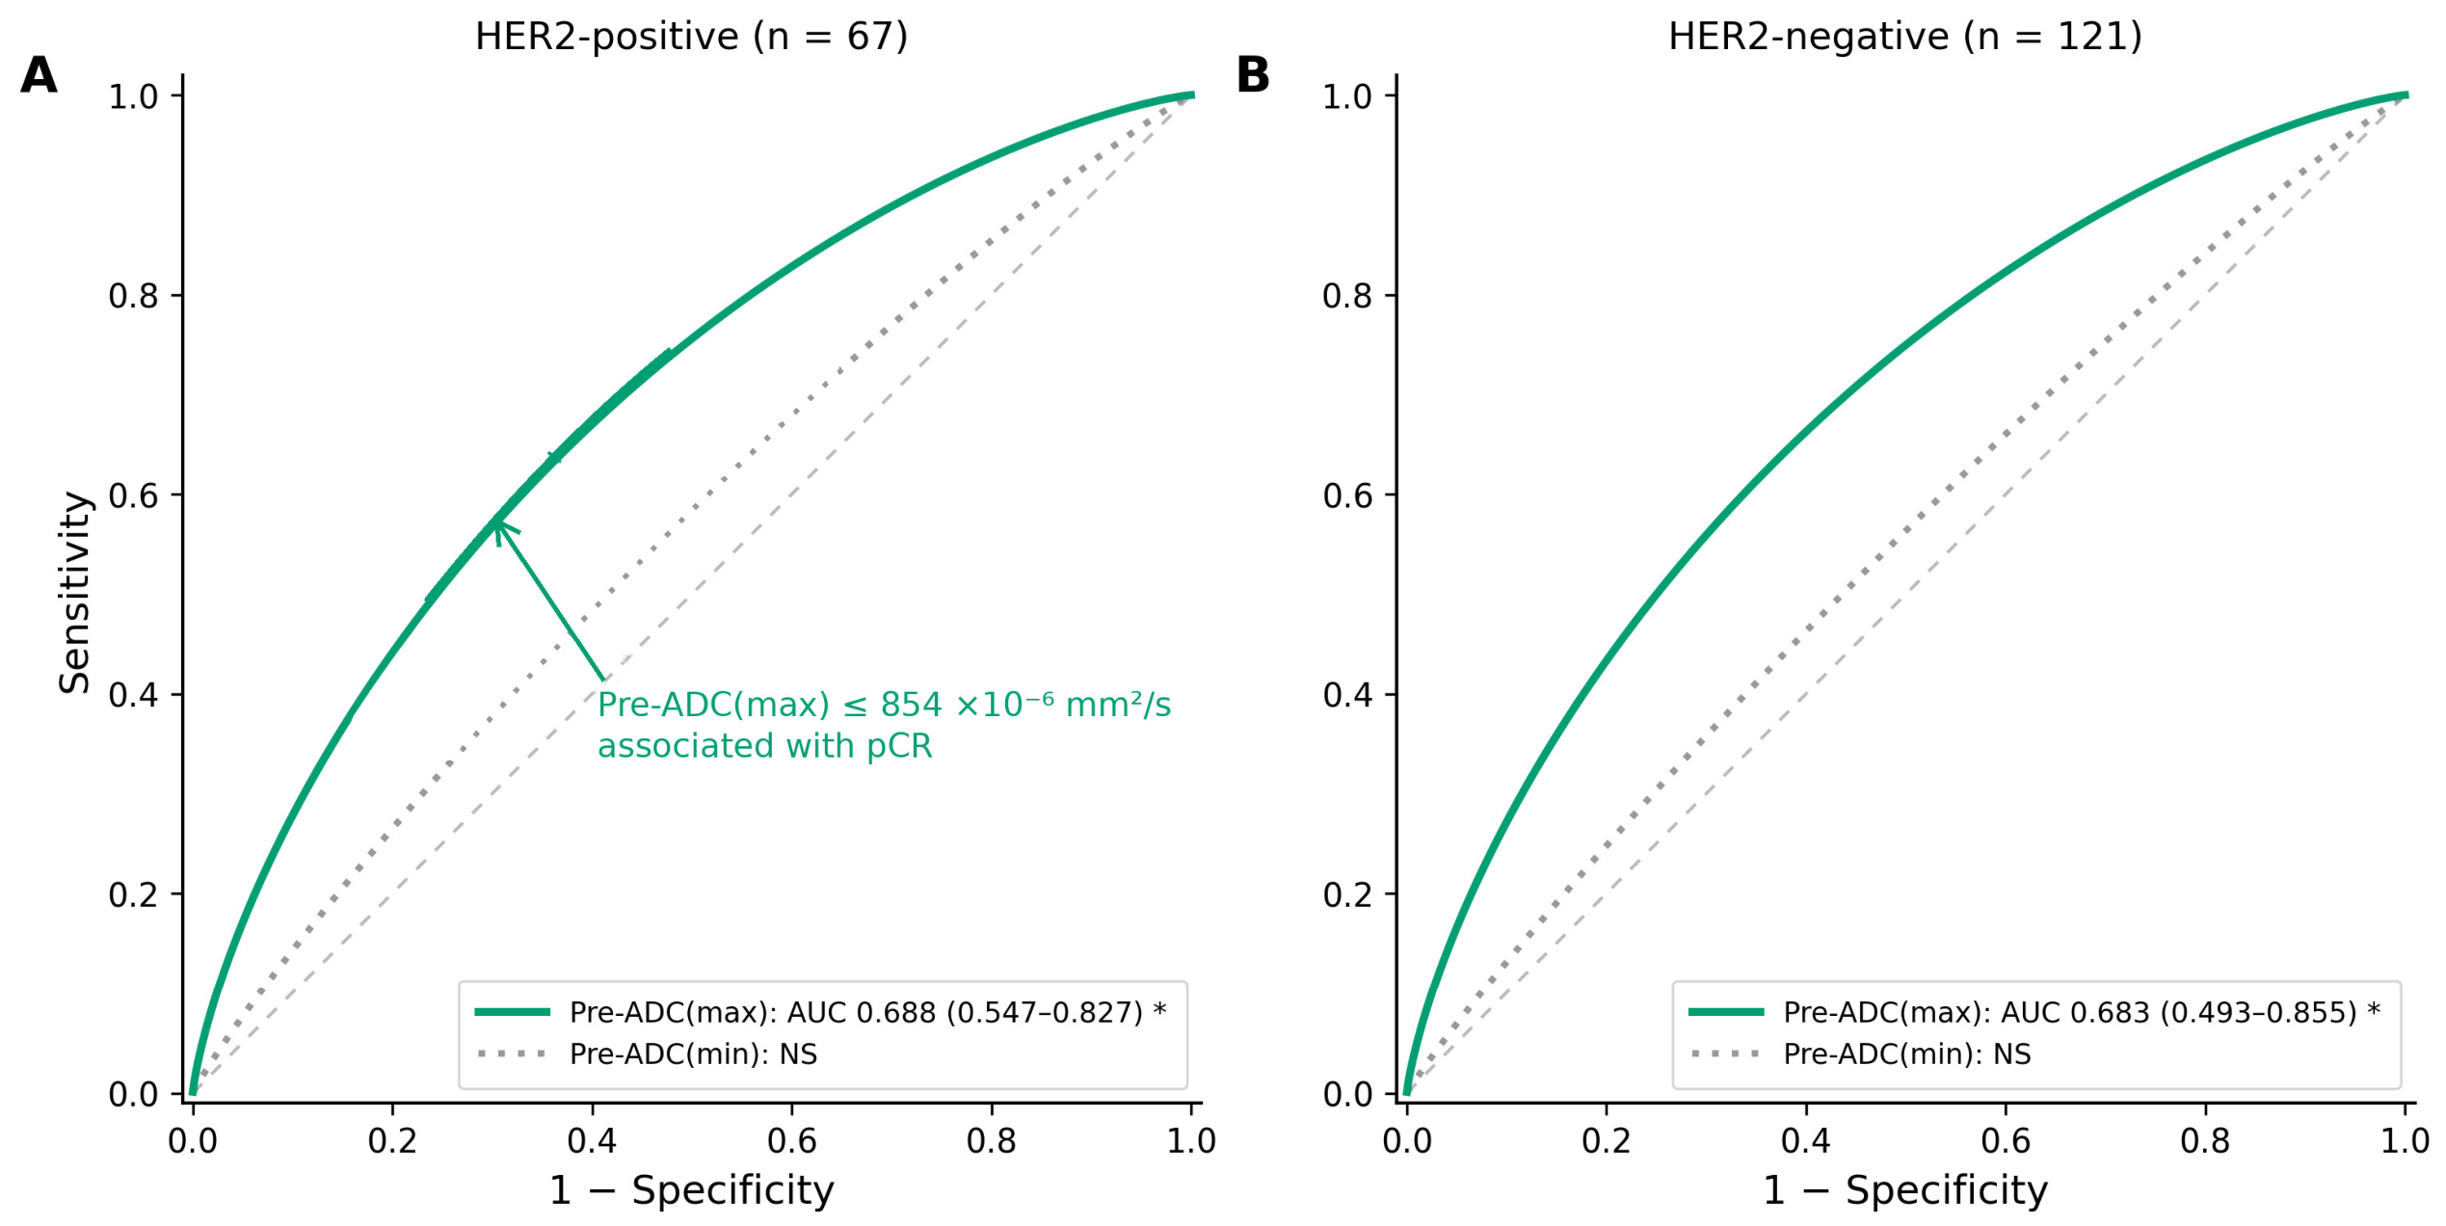
A finding that runs against the usual direction deserves comment. In the HER2-positive subgroup, it was a lower, not a higher, pre-treatment ADC that tracked with pCR, with Pre-ADC (max) values at or below 854 × 10
−6 mm
2/s associated with response (
Table 9,
Figure 3A). A low ADC reflects dense cellularity and restricted water diffusion, and the most plausible interpretation is that the densely cellular, highly proliferative HER2-positive tumours—those expected to respond best to anthracycline–taxane chemotherapy combined with HER2-directed therapy—are the same tumours that go on to achieve pCR, so that a low baseline ADC marks chemosensitive biology rather than resistance. This reading remains speculative. The subgroup is small (
n = 67, with 24 pCR events), the confidence interval around the AUC is wide (0.688, 95% CI 0.547–0.827), and the threshold was both identified and tested in the same cohort. We therefore report the inverse Pre-ADC (max) association as a hypothesis-generating observation that needs confirmation in independent, prospectively assembled HER2-positive cohorts before it can be treated as a reliable predictor.
The subtype dependence of pre-treatment ADC raises a fair question about our post-treatment threshold: can one Post-ADC cut-off reasonably be applied across molecular subtypes? Our data can raise this question but cannot answer it. The predictive signal in pre-treatment ADC was subtype-specific—Pre-ADC (max) reached significance only after HER2 stratification (
Table 9)—whereas post-treatment ADC reflects something more uniform, namely the rise in free water that follows tumour cell death, a downstream marker of response rather than a fingerprint of the original tumour biology. In the cohort as a whole, the single Post-ADC threshold identified the true responders without an obvious subtype-related miss; we deliberately stop short of reading this as a subtype-level result. With only 37 pCR events divided between HER2-positive (
n = 24) and HER2-negative (
n = 13) tumours, the subgroups are far too small to support a firm conclusion, and this observation should be treated as hypothesis-generating rather than as evidence that one threshold performs equally well in every subtype. Zhang et al. showed that MRI accuracy varies by subtype, with the highest predictive value in TNBC and Luminal B tumours [
13], and Partridge et al. documented subtype-dependent differences in the time course of ADC response [
17]. A single threshold may thus prove convenient for confirming response, but whether it is truly adequate within each subtype—or instead needs subtype-specific calibration—is a question our data cannot settle, since we neither derived nor validated separate thresholds within the subgroups.
The retrospective single-centre design is the principal constraint on this study’s generalisability. Referral patterns and institutional selection criteria may not reflect the broader NAC-treated population, and the ADC measurement protocol—specific b-value selection and manual ROI placement—limits direct numerical comparability with studies using different acquisition parameters. A second limitation is statistical. Both the Post-ADC and ΔADC thresholds were derived and tested in the same patients, which inflates their apparent performance; we addressed this with bootstrap optimism correction, and the corrected values stayed close to the originals (
Table 6), but no external cohort has yet confirmed them, and the AUC of 0.967 should be read in that light rather than as a transportable figure. Third, only 37 patients achieved pCR. This small number of events limits how many covariates a regression can responsibly carry, so we kept the multivariable models parsimonious, applied Firth penalisation, and entered collinear predictors separately (
Table 8); even so, the adjusted estimates are better regarded as exploratory than as definitive. Fourth, a single Post-ADC threshold was applied to every subtype, and subtype-specific cut-offs—which a larger cohort would allow—were not derived. What the single-centre design does provide is technical consistency, which likely contributes to the tight ADC thresholds we identified. The cohort’s restriction to standard chemotherapy regimens, with immunotherapy and dual HER2 blockade excluded, removes a source of imaging interpretation noise that has complicated other series. Whether the HER2-stratified ADC behaviour and the sequential confirmation rule we describe hold up in larger, subtype-balanced cohorts assembled prospectively across multiple centres remains to be established; until then, our results are best read as a well-characterised single-centre signal rather than a validated decision rule.