
Atrial Fibrillation, Cerebral Small Vessel Disease and Gender Medicine: Focus on Biomarkers and Neuroimaging

 , , , , , , , and
Abstract
1. Introduction
2. Materials and Methods
2.1. Study Population
2.2. Laboratory Determinations
2.3. Neuroimaging Assessment
- Non-lacunar infarcts: defined as cortical or subcortical (>15 mm in diameter) lesions in vascular territories, they were numerically rated on T1-weighted and T2-FLAIR sequences.
- SVD markers were selected and evaluated according to the STRIVE criteria [22], and included the following:
- ○
- White matter hyperintensities (WMH), rated on axial FLAIR sequences using the modified Fazekas scale [23], which defines three different grades of deep WMH severity: mild (single lesions < 10 mm; areas of “grouped” lesions < 20 mm in any diameter), moderate (single hyperintense lesions between 10 and 20 mm; areas of “grouped” lesions ≥ 20 mm in any diameter; no more than “connecting bridges” between individual lesions), and severe (single lesions or confluent areas of hyperintensity ≥ 20 mm in any diameter).
- ○
- Cerebral microbleeds (CMBs), rated on axial gradient-echo T2-weighted sequences according to the Microbleeds Anatomical Rating Scale (MARS) [24], which identifies “definite” microbleeds as small, rounded or circular, well-defined hypointense lesions within brain parenchyma with clear margins ranging from 2 to 10 mm in size and classified location as deep, infratentorial and lobar.
- ○
- Lacunar infarcts: lacunes of presumed vascular origin were detected and counted on T1 and T2 FLAIR sequences; they are defined as small (3–15 mm in diameter), round or ovoid, subcortical, fluid-filled cavities, usually surrounded by a hyperintense rim.
- ○
- Enlarged perivascular spaces (EPVS), defined as fluid-filled spaces following small vessels course, with a round shape < 3 mm of diameter at basal ganglia (bgEPVS) level, hypointense in axial T1 images and rated estimating their absolute number in 3 slices of that anatomical region on the more injured side, and then categorized in the five-level scale: 0 = none, 1 = 1–10, 2 = 11–20, 3 = 21–40, 4 = >40 PVS per region [25].
- ○
- SVD score (range 0–4: 0 = no signs, 1 = 1 sign, 2 = 2 signs, 3 = 3 signs, 4 = ≥3 signs), which incorporates 4 established neuroimaging biomarkers of SVD and aims to capture the overall burden of cerebral SVD [26]. The score was calculated as follows: presence of ≥1 lacunes (+1 point); presence of ≥1 MBs (+1 point); moderate/abundant (grade 2–4) bgEPVS (+1 point); moderate to severe WMHs
2.4. Statistical Analysis
3. Results
3.1. Circulating Biomarkers According to Cerebral Alterations by MRI Evaluation (Comparative Analysis Based on Sex)
3.1.1. Lacunar and Non-Lacunar Infarcts
3.1.2. Cerebral Microbleeds
3.1.3. White Matter Hyperintensity (WMH)
3.1.4. Enlarged Perivascular Spaces Basal Ganglia (bgEPVS)
3.1.5. SVD Score
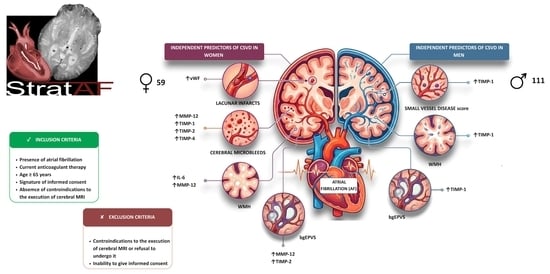
3.2. Multivariate Analysis
- Elevated vWF levels for the presence of lacunar infarcts in women [OR 3.24 (1.23–8.55), p = 0.018];
- Elevated MMP-12, TIMP-1, TIMP-2, and TIMP-4 levels for the presence of cerebral microbleeds (CMBs) in women [OR 7.76 (1.60–37.69), p = 0.021; OR 1.90 (1.02–3.52), p = 0.042; OR 2.46 (1.27–4.80), p = 0.008; and OR 2.36 (1.12–4.95), p = 0.023, respectively];
- Elevated IL-6 and MMP-2 levels for the presence of white matter hyperintensities in women [OR 10.65 (1.31–86.67), p = 0.027; OR 3.36 (1.23–9.15), p = 0.018, respectively];
- Elevated TIMP-1 levels for the presence of white matter hyperintensities in men [OR 2.10 (1.08–4.08), p = 0.030];
- Elevated MMP-12 and TIMP-2 levels for the presence of basal ganglia EPVS (bgEPVS) in women [OR 2.57 (1.22–5.93), p = 0.027; OR 2.15 (1.03–4.53), p = 0.043, respectively];
- Elevated TIMP-1 levels for the presence of bgEPVS in men [OR 2.20 (1.11–4.38), p = 0.025];
- Elevated TIMP-1 levels for SVD positivity in men [OR 7.25 (2.18–24.15), p = 0.001] (Figure 2).
4. Discussion
5. Conclusions
Author Contributions
Funding
Institutional Review Board Statement
Informed Consent Statement
Data Availability Statement
Acknowledgments
Conflicts of Interest
References
- Van Gelder, I.C.; Rienstra, M.; Bunting, K.V.; Casado-Arroyo, R.; Caso, V.; Crijns, H.J.G.M.; De Potter, T.J.R.; Dwight, J.; Guasti, L.; Hanke, T.; et al. ESC Scientific Document Group 2024 ESC Guidelines for the management of atrial fibrillation developed in collaboration with the European Association for Cardio-Thoracic Surgery (EACTS). Eur. Heart J. 2024, 45, 3314–3414. [Google Scholar] [CrossRef] [PubMed]
- Seiffge, D.J.; De Marchis, G.M.; Koga, M.; Paciaroni, M.; Wilson, D.; Cappellari, M.; Macha, K.; Tsivgoulis, G.; Ambler, G.; Arihiro, S.; et al. RAF, RAF-DOAC, CROMIS-2, SAMURAI, NOACISP, Erlangen, and Verona registry collaborators. Ischemic Stroke despite Oral Anticoagulant Therapy in Patients with Atrial Fibrillation. Ann. Neurol. 2020, 87, 677–687. [Google Scholar] [CrossRef]
- Senoo, K.; Lip, G.Y.; Lane, D.A.; Büller, H.R.; Kotecha, D. Residual Risk of Stroke and Death in Anticoagulated Patients According to the Type of Atrial Fibrillation: AMADEUS Trial. Stroke 2015, 46, 2523–2528. [Google Scholar] [CrossRef]
- Tao, W.; Liu, J.; Ye, C.; Kwapong, W.R.; Wang, A.; Wang, Z.; Chen, S.; Liu, M. Relationships between cerebral small vessel diseases markers and cognitive performance in stroke-free patients with atrial fibrillation. Front. Aging Neurosci. 2023, 14, 1045910. [Google Scholar] [CrossRef]
- Banerjee, G.; Chan, E.; Ambler, G.; Wilson, D.; Cipolotti, L.; Shakeshaft, C.; Cohen, H.; Yousry, T.; Al-Shahi Salman, R.; Lip, G.Y.H.; et al. Cognitive Impairment Before Atrial Fibrillation-Related Ischemic Events: Neuroimaging and Prognostic Associations. J. Am. Heart Assoc. 2020, 9, e014537. [Google Scholar] [CrossRef]
- Jokinen, H.; Koikkalainen, J.; Laakso, H.M.; Melkas, S.; Nieminen, T.; Brander, A.; Korvenoja, A.; Rueckert, D.; Barkhof, F.; Scheltens, P.; et al. Global Burden of Small Vessel Disease-Related Brain Changes on MRI Predicts Cognitive and Functional Decline. Stroke 2020, 51, 170–178. [Google Scholar] [CrossRef] [PubMed]
- Kobayashi, A.; Iguchi, M.; Shimizu, S.; Uchiyama, S. Silent cerebral infarcts and cerebral white matter lesions in patients with nonvalvular atrial fibrillation. J. Stroke Cerebrovasc. Dis. 2012, 21, 310–317. [Google Scholar] [CrossRef]
- Horstmann, S.; Möhlenbruch, M.; Wegele, C.; Rizos, T.; Laible, M.; Rauch, G.; Veltkamp, R. Prevalence of atrial fibrillation and association of previous antithrombotic treatment in patients with cerebral microbleeds. Eur. J. Neurol. 2015, 22, 1355–1362. [Google Scholar] [CrossRef]
- Wiggins, M.E.; Jones, J.; Tanner, J.J.; Schmalfuss, I.; Hossein Aalaei-Andabili, S.; Heilman, K.M.; Libon, D.J.; Beaver, T.; Price, C.C. Pilot Investigation: Older Adults with Atrial Fibrillation Demonstrate Greater Brain Leukoaraiosis in Infracortical and Deep Regions Relative to Non-Atrial Fibrillation Peers. Front. Aging Neurosci. 2020, 12, 271. [Google Scholar] [CrossRef]
- Jin, L.; Liu, Y.; Huang, Q. Research progress in atrial fibrillation with cerebral small vessel disease. Zhong Nan Da Xue Xue Bao Yi Xue Ban. 2022, 47, 258–264. [Google Scholar] [PubMed]
- Zhang, Z.; Zhang, D.; Cai, X.; Yang, Y.; Sun, J.; Niu, G.; Xu, Z.; Jing, J.; Wang, Y.; Wang, Y.; et al. Association of Systemic Inflammatory Markers with Cerebral Small Vessel Disease Progression: A Community-Based Prospective Study. Neurology 2026, 106, e214711. [Google Scholar] [CrossRef] [PubMed]
- Low, A.; Mak, E.; Rowe, J.B.; Markus, H.S.; O’Brien, J.T. Inflammation and cerebral small vessel disease: A systematic review. Ageing Res. Rev. 2019, 53, 100916. [Google Scholar] [CrossRef]
- Qin, P.; Ho, F.K.; Celis-Morales, C.A.; Pell, J.P. Association between systemic inflammation biomarkers and incident cardiovascular disease in 423,701 individuals: Evidence from the UK biobank cohort. Cardiovasc. Diabetol. 2025, 24, 162. [Google Scholar] [CrossRef]
- Arba, F.; Piccardi, B.; Palumbo, V.; Giusti, B.; Nencini, P.; Gori, A.M.; Sereni, A.; Nesi, M.; Pracucci, G.; Bono, G.; et al. MAGIC Study Group. Small Vessel Disease Is Associated with Tissue Inhibitor of Matrix Metalloproteinase-4 After Ischaemic Stroke. Transl. Stroke Res. 2019, 10, 44–51. [Google Scholar] [CrossRef]
- Cheung, Y.; Foley, M.; Bradley, D.; Cassidy, T.; Collins, R.; Cronin, S.; Dolan, E.; Gorey, S.; Khadjooi, K.; Induruwa, I.; et al. Clinical and Biomarker Determinants for Recurrent Stroke in Patients with Atrial Fibrillation: A Systematic Review and Meta-Analysis. Neurology 2025, 104, e210061. [Google Scholar] [CrossRef]
- Kremer, C.; Lorenzano, S.; Kruuse, C. Editorial: Sex differences in cerebrovascular diseases. Front. Neurol. 2023, 13, 1128177. [Google Scholar] [CrossRef] [PubMed]
- Parent, O.; Osborne, S.; Devenyi, G.A.; Bussy, A.; Costantino, M.; Fouquet, J.; Rodriguez, D.Q.; Dadar, M.; Chakravarty, M.M. Sex differences in white matter hyperintensity pathophysiology. Alzheimers Dement. 2025, 21, e100338. [Google Scholar] [CrossRef]
- Trentini, A.; Manfrinato, M.C.; Castellazzi, M.; Bellini, T. Sex-Related Differences of Matrix Metalloproteinases (MMPs): New Perspectives for These Biomarkers in Cardiovascular and Neurological Diseases. J. Pers. Med. 2022, 12, 1196. [Google Scholar] [CrossRef] [PubMed]
- Alfano, F.; Cesari, F.; Gori, A.M.; Berteotti, M.; Salvadori, E.; Giusti, B.; Bertelli, A.; Kura, A.; Barbato, C.; Formelli, B.; et al. The Role of Extracellular Matrix and Inflammation in the Stratification of Bleeding and Thrombotic Risk of Atrial Fibrillation on Oral Anticoagulant Therapy: Insights from Strat-Af Study. J. Clin. Med. 2023, 12, 6866. [Google Scholar] [CrossRef]
- Poggesi, A.; Barbato, C.; Galmozzi, F.; Camilleri, E.; Cesari, F.; Chiti, S.; Diciotti, S.; Galora, S.; Giusti, B.; Gori, A.M.; et al. Role of Biological Markers for Cerebral Bleeding Risk STRATification in Patients with Atrial Fibrillation on Oral Anticoagulants for Primary or Secondary Prevention of Ischemic Stroke (Strat-AF Study): Study Design and Methodology. Medicina 2019, 55, 626. [Google Scholar] [CrossRef]
- Wiseman, S.J.; Meijboom, R.; Valdés Hernández, M.D.C.; Pernet, C.; Sakka, E.; Job, D.; Waldman, A.D.; Wardlaw, J.M. Longitudinal multi-centre brain imaging studies: Guidelines and practical tips for accurate and reproducible imaging endpoints and data sharing. Trials 2019, 20, 21. [Google Scholar] [CrossRef]
- Wardlaw, J.M.; Smith, E.E.; Biessels, G.J.; Cordonnier, C.; Fazekas, F.; Frayne, R.; Lindley, R.I.; O’Brien, J.T.; Barkhof, F.; Benavente, O.R.; et al. Neuroimaging standards for research into small vessel disease and its contribution to ageing and neurodegeneration. Lancet Neurol. 2013, 12, 822–838. [Google Scholar] [CrossRef]
- Pantoni, L.; Basile, A.M.; Pracucci, G.; Asplund, K.; Bogousslavsky, J.; Chabriat, H.; Erkinjuntti, T.; Fazekas, F.; Ferro, J.M.; Hennerici, M.; et al. Impact of age-related cerebral white matter changes on the transition to disability—The LADIS study: Rationale, design and methodology. Neuroepidemiology 2005, 24, 51–62. [Google Scholar] [CrossRef]
- Gregoire, S.M.; Chaudhary, U.J.; Brown, M.M.; Yousry, T.A.; Kallis, C.; Jäger, H.R.; Werring, D.J. The Microbleed Anatomical Rating Scale (MARS): Reliability of a tool to map brain microbleeds. Neurology 2009, 73, 1759–1766. [Google Scholar]
- Wardlaw, J.M.; Benveniste, H.; Nedergaard, M.; Zlokovic, B.V.; Mestre, H.; Lee, H.; Doubal, F.N.; Brown, R.; Ramirez, J.; MacIntosh, B.J.; et al. Perivascular spaces in the brain: Anatomy, physiology and pathology. Nat. Rev. Neurol. 2020, 16, 137–153. [Google Scholar] [CrossRef]
- Lau, K.K.; Li, L.; Schulz, U.; Simoni, M.; Chan, K.H.; Ho, S.L.; Cheung, R.T.F.; Küker, W.; Mak, H.K.F.; Rothwell, P.M. Total small vessel disease score and risk of recurrent stroke: Validation in 2 large cohorts. Neurology 2017, 88, 2260–2267. [Google Scholar] [CrossRef] [PubMed]
- Kario, K.; Matsuo, T.; Kobayashi, H.; Asada, R.; Matsuo, M. ‘Silent’ cerebral infarction is associated with hypercoagulability, endothelial cell damage, and high Lp(a) levels in elderly Japanese. Arterioscler. Thromb. Vasc. Biol. 1996, 16, 734–741. [Google Scholar] [CrossRef] [PubMed]
- Cui, N.; Hu, M.; Khalil, R.A. Biochemical and Biological Attributes of Matrix Metalloproteinases. Prog. Mol. Biol. Transl. Sci. 2017, 147, 1–73. [Google Scholar]
- Visse, R.; Nagase, H. Matrix metalloproteinases and tissue inhibitors of metalloproteinases: Structure, function, and biochemistry. Circ. Res. 2003, 92, 827–839. [Google Scholar] [CrossRef]
- Inzitari, D.; Giusti, B.; Nencini, P.; Gori, A.M.; Nesi, M.; Palumbo, V.; Piccardi, B.; Armillis, A.; Pracucci, G.; Bono, G.; et al. MAGIC Study Group. MMP9 variation after thrombolysis is associated with hemorrhagic transformation of lesion and death. Stroke 2013, 44, 2901–2903. [Google Scholar] [CrossRef] [PubMed]
- Bos, D.; Wolters, F.J.; Darweesh, S.K.L.; Vernooij, M.W.; de Wolf, F.; Ikram, M.A.; Hofman, A. Cerebral small vessel disease and the risk of dementia: A systematic review and meta-analysis of population-based evidence. Alzheimers Dement. 2018, 14, 1482–1492. [Google Scholar] [CrossRef] [PubMed]
- Cannistraro, R.J.; Badi, M.; Eidelman, B.H.; Dickson, D.W.; Middlebrooks, E.H.; Meschia, J.F. CNS small vessel disease: A clinical review. Neurology 2019, 92, 1146–1156. [Google Scholar] [CrossRef]
- Sachdev, P.S.; Parslow, R.; Wen, W.; Anstey, K.J.; Easteal, S. Sex differences in the causes and consequences of white matter hyperintensities. Neurobiol. Aging 2009, 30, 946–956. [Google Scholar] [CrossRef]
- Jasienska, G.; Bribiescas, R.G.; Furberg, A.S.; Helle, S.; Núñez-de la Mora, A. Human reproduction and health: An evolutionary perspective. Lancet 2017, 390, 510–520. [Google Scholar] [CrossRef]
- de Lange, A.G.; Barth, C.; Kaufmann, T.; Anatürk, M.; Suri, S.; Ebmeier, K.P.; Westlye, L.T. The maternal brain: Region-specific patterns of brain aging are traceable decades after childbirth. Hum. Brain Mapp. 2020, 41, 4718–4729. [Google Scholar] [CrossRef]
- Cote, S.; Perron, T.L.; Baillargeon, J.P.; Bocti, C.; Lepage, J.F.; Whittingstall, K. Association of Cumulative Lifetime Exposure to Female Hormones with Cerebral Small Vessel Disease in Postmenopausal Women in the UK Biobank. Neurology 2023, 101, e1970–e1978. [Google Scholar] [CrossRef]
- Trenti, A.; Tedesco, S.; Boscaro, C.; Trevisi, L.; Bolego, C.; Cignarella, A. Estrogen, Angiogenesis, Immunity and Cell Metabolism: Solving the Puzzle. Int. J. Mol. Sci. 2018, 19, 859. [Google Scholar] [CrossRef]
- Lohner, V.; Pehlivan, G.; Sanroma, G.; Miloschewski, A.; Schirmer, M.D.; Stöcker, T.; Reuter, M.; Breteler, M.M.B. Relation Between Sex, Menopause, and White Matter Hyperintensities: The Rhineland Study. Neurology 2022, 99, e935–e943. [Google Scholar] [CrossRef] [PubMed]
- Mishra, S.R.; Chung, H.F.; Waller, M.; Mishra, G.D. Duration of estrogen exposure during reproductive years, age at menarche and age at menopause, and risk of cardiovascular disease events, all-cause and cardiovascular mortality: A systematic review and meta-analysis. BJOG 2021, 128, 809–821. [Google Scholar] [CrossRef] [PubMed]
- Espeland, M.A.; Rapp, S.R.; Shumaker, S.A.; Brunner, R.; Manson, J.E.; Sherwin, B.B.; Hsia, J.; Margolis, K.L.; Hogan, P.E.; Wallace, R.; et al. Women’s Health Initiative Memory Study. Conjugated equine estrogens and global cognitive function in postmenopausal women: Women’s Health Initiative Memory Study. JAMA 2004, 291, 2959–2968. [Google Scholar] [CrossRef]
- Shimizu, Y.; Sawada, N.; Iwasaki, M.; Shikimoto, R.; Nozaki, S.; Mimura, M.; Tsugane, S. Japan Public Health Center-based Prospective Study Group. Reproductive history and risk of cognitive impairment in Japanese women. Maturitas 2019, 128, 22–28. [Google Scholar] [CrossRef]
- Luo, B.L.; He, S.P.; Zhang, Y.F.; Yang, Q.W.; Zhuang, J.C.; Zhu, R.J.; Zheng, Y.Q.; Su, H.M. Correlation between matrix metalloproteinase-2, matrix metalloproteinase-9, and tissue inhibitor of metalloproteinases-1 and white matter hyperintensities in patients with cerebral small vessel disease based on cranial magnetic resonance 3D imaging. Magn. Reson. Imaging 2024, 113, 110213. [Google Scholar] [CrossRef]
- Zhang, D.P.; Peng, Y.F.; Zhang, H.L.; Ma, J.G.; Zhao, M.; Yin, S.; Wei, T.T. Basilar Artery Tortuosity Is Associated with White Matter Hyperintensities by TIMP-1. Front. Neurosci. 2019, 13, 836. [Google Scholar] [CrossRef]


| Demographic and Clinical Characteristics | Total Cohort (n = 170) |
|---|---|
| Age [years], (mean ± SD) | 77.7 ± 6.8 |
| Female sex, n (%) | 59 (34.7%) |
| Schooling [years], (mean ± SD) | 9.1 ± 4.3 |
| Stroke, n (%) | 38 (22.4%) |
| Coronary artery disease, n (%) | 18 (10.6%) |
| Heart failure, n (%) | 25 (14.7%) |
| Peripheral arterial disease, n (%) | 14 (8%) |
| Hypertension, n (%) | 140 (82.4%) |
| Diabetes, n (%) | 22 (12.9%) |
| Dyslipidaemia, n (%) | 87 (51.2%) |
| Physical activity (lack of), n (%) | 110 (64.7%) |
| Smoke, n (%) | 105 (61.8%) |
| Alcohol consumption, n (%) | 91 (53.5%) |
| BMI [kg/m2], (mean ± SD) | 26.3 ± 3.9 |
| CHA2DS2-VASc Score (mean ± SD) | 3.69 ± 1.49 |
| HAS-BLED (mean ± SD) | 1.85 ± 0.89 |
| Women (n = 59) | Men (n = 111) | p | |||
|---|---|---|---|---|---|
| Age [years], (mean ± SD) | 78.5 ± 7.4 | 77.43 ± 6.36 | 0.333 | ||
| Schooling [years], (mean ± SD) | 7.1 ± 3.4 | 10.55 ± 4.30 | <0.001 | ||
| BMI [kg/m2], (mean ± SD) | 26.4 ± 4.37 | 26.30 ± 3.60 | 0.804 | ||
| CHA2DS2-VASc (mean ± SD) | 4.5 ± 1.5 | 3.3 ± 1.4 | <0.001 | ||
| HAS-BLED (mean ± SD) | 1.9 ± 0.9 | 1.8 ± 0.9 | 0.859 | ||
| Women (n = 59) | Men (n = 111) | p | |||
| Yes | No | Yes | No | ||
| Stroke, n (%) | 18 | 41 | 20 | 91 | 0.063 |
| Coronary artery disease, n (%) | 3 | 56 | 15 | 96 | 0.089 |
| Heart failure, n (%) | 8 | 51 | 17 | 94 | 0.758 |
| Peripheral arterial disease, n (%) | 3 | 56 | 11 | 100 | 0.276 |
| Hypertension, n (%) | 49 | 10 | 91 | 20 | 0.862 |
| Diabetes, n (%) | 7 | 52 | 15 | 96 | 0.760 |
| Dyslipidaemia, n (%) | 37 | 22 | 50 | 61 | 0.028 |
| Physical activity (lack of), n (%) | 12 | 47 | 48 | 63 | 0.003 |
| Smoke [current], n (%) | 2 | 57 | 10 | 101 | 0.173 |
| Smoke [previous], n (%) | 19 | 40 | 76 | 35 | <0.001 |
| Alcohol consumption, n (%) | 21 | 38 | 70 | 41 | <0.001 |
| IL-4 [pg/mL] | IL-6 [pg/mL] | IL-8 [pg/mL] | IL-10 [pg/mL] | TNF-α [pg/mL] | CCL-2 [pg/mL] | CXCL-10 [pg/mL] | ICAM-1 [ng/mL] | VCAM-1 [ng/mL] | VEGF [pg/mL] | PAI-1 [ng/mL] | vWF [%] | EMMPRIN [ng/mL] | MMP-2 [ng/mL] | MMP-7 [ng/mL] | MMP-8 [ng/mL] | MMP-9 [ng/mL] | MMP-12 [ng/mL] | TIMP-1 [ng/mL] | TIMP-2 [ng/mL] | TIMP-3 [ng/mL] | TIMP-4 [ng/mL] | |||
|---|---|---|---|---|---|---|---|---|---|---|---|---|---|---|---|---|---|---|---|---|---|---|---|---|
| Lacunar infarcts | Women (n = 59) | Present (n = 9) | 12.81 | 2.73 | 12.06 | 0.92 | 2.04 | 330.89 | 14.91 | 380.37 | 1740.10 | 116.25 | 9.35 | 217.80 | 4.36 | 532.82 | 3.39 | 6.07 | 259.25 | 309.12 | 181.77 | 141.11 | 52.59 | 3.75 |
| (9.46–36.03) | (1.74–6.31) | (6.92–16.28) | (0.27–3.63) | (1.53–5.39) | (285.75–447.78) | (10.62–24.39) | (301.20–538.41) | (1456.05–1968.15) | (52.70–129.84) | (4.81–22.88) | (179.65–234.25) | (2.50–7.11) | (448.76–800.74) | (2.63–6.07) | (4.33–16.38) | (151.54–478.12) | (125.27–590.88) | (148.64–261.00) | (123.29–224.65) | (26.04–61.04) | (2.85–7.83) | |||
| Absent (n = 50) | 12.81 | 1.85 | 7.74 | 2.89 | 2.29 | 341.32 | 16.31 | 341.49 | 1398.30 | 76.48 | 9.29 | 147.10 | 5.78 | 494.95 | 4.80 | 7.20 | 301.61 | 450.10 | 159.15 | 123.38 | 32.53 | 3.54 | ||
| (5.30–26.75) | (0.38–3.58) | (4.65–11.58) | (0.41–3.56) | (1.01–4.00) | (232.29–492.44) | (9.97–21.16) | (273.07–415.38) | (950.72–2351.98) | (37.65–113.80) | (6.98–14.44) | (127.60–200.05) | (4.35–6.88) | (384.99–660.17) | (2.77–6.10) | (1.98–13.02) | (170.83–413.36) | (72.57–594.96) | (124.53–216.77) | (97.82–163.74) | (17.61–51.01) | (2.39–5.24) | |||
| p | 0.410 | 0.170 | 0.073 | 0.398 | 0.534 | 0.850 | 0.800 | 0.332 | 0.255 | 0.214 | 0.726 | 0.004 | 0.217 | 0.229 | 0.550 | 0.784 | 0.916 | 0.784 | 0.177 | 0.146 | 0.250 | 0.354 | ||
| Men (n = 111) | Present (n = 28) | 6.60 | 1.35 | 9.66 | 2.89 | 2.02 | 332.46 | 14.00 | 329.80 | 1201.90 | 77.38 | 9.19 | 195.70 | 6.21 | 527.52 | 6.01 | 9.12 | 323.59 | 132.64 | 187.26 | 147.33 | 43.98 | 2.88 | |
| (2.54–34.48) | (0.30–1.98) | (7.26–13.78) | (0.23–3.50) | (0.59–3.16) | (252.66–425.36) | (11.00–20.96) | (244.58–764.08) | (961.36–1828.50) | (44.22–110.42) | (6.71–15.76) | (130.05–217.23) | (4.40–7.58) | (459.95–625.43) | (4.35–7.13) | (4.11–17.68) | (185.72–572.08) | (50.50–487.40) | (163.53–233.35) | (119.28–200.90) | (30.52–65.07) | (2.33–6.32) | |||
| Absent (n = 83) | 10.81 | 1.56 | 8.14 | 3.20 | 2.30 | 308.67 | 14.34 | 319.52 | 1480.00 | 53.61 | 9.03 | 158.90 | 5.17 | 529.83 | 5.97 | 7.88 | 312.24 | 309.12 | 157.40 | 124.95 | 34.43 | 2.95 | ||
| (5.00–30.48) | (0.30–3.25) | (5.32–13.24) | (0.32–3.56) | (1.06–4.25) | (218.76–421.91) | (9.96–24.76) | (251.23–500.96) | (1010.00–2114.40) | (33.64–88.53) | (7.25–16.42) | (128.00–210.20) | (3.81–6.55) | (439.71–627.23) | (3.42–7.24) | (4.00–13.70) | (199.03–465.70) | (65.70–594.96) | (129.82–198.55) | (95.82–168.77) | (25.45–50.02) | (2.12–3.67) | |||
| p | 0.729 | 0.316 | 0.176 | 0.137 | 0.300 | 0.541 | 0.796 | 0.770 | 0.138 | 0.142 | 0.623 | 0.394 | 0.159 | 0.607 | 0.701 | 0.661 | 0.701 | 0.389 | 0.009 | 0.105 | 0.082 | 0.214 |
| IL-4 [pg/mL] | IL-6 [pg/mL] | IL-8 [pg/mL] | IL-10 [pg/mL] | TNF-α [pg/mL] | CCL-2 [pg/mL] | CXCL-10 [pg/mL] | ICAM-1 [ng/mL] | VCAM-1 [ng/mL] | VEGF [pg/mL] | PAI-1 [ng/mL] | vWF [%] | EMMPRIN [ng/mL] | MMP-2 [ng/mL] | MMP-7 [ng/mL] | MMP-8 [ng/mL] | MMP-9 [ng/mL] | MMP-12 [ng/mL] | TIMP-1 [ng/mL] | TIMP-2 [ng/mL] | TIMP-3 [ng/mL] | TIMP-4 [ng/mL] | |||
|---|---|---|---|---|---|---|---|---|---|---|---|---|---|---|---|---|---|---|---|---|---|---|---|---|
| Non lacunar infarcts | Women (n = 59) | Present (n = 22) | 12.81 | 1.71 | 5.99 | 2.50 | 2.29 | 319.06 | 16.35 | 338.70 | 1404.65 | 78.85 | 12.40 | 173.60 | 5.69 | 512.60 | 5.16 | 7.05 | 320.63 | 450.10 | 178.18 | 136.96 | 40.14 | 3.93 |
| (5.98–31.00) | (1.49–2.99) | (4.11–11.37) | (0.40–3.46) | (2.02–5.01) | (268.11–569.97) | (10.32–21.71) | (286.43–565.77) | (885.97–2255.53) | (46.33–120.26) | (9.26–17.29) | (124.45–201.80) | (3.78–7.46) | (412.47–653.96) | (2.63–6.54) | (1.98–12.43) | (162.33–423.14) | (81.34–594.96) | (152.05–259.75) | (104.10–220.94) | (26.80–67.36) | (2.53–6.12) | |||
| Absent (n = 37) | 12.81 | 2.21 | 8.69 | 3.00 | 2.00 | 345.99 | 15.77 | 342.99 | 1518.80 | 78.44 | 8.37 | 154.30 | 5.78 | 470.58 | 4.23 | 7.07 | 279.06 | 450.10 | 148.81 | 118.07 | 30.49 | 3.52 | ||
| (5.20–32.83) | (0.38–4.60) | (5.05–12.53) | (0.32–3.91) | (0.73–4.00) | (237.61–456.94) | (10.13–22.20) | (278.17–413.43) | (1050.95–2059.40) | (40.94–121.33) | (6.46–11.13) | (131.30–207.70) | (4.35–6.87) | (386.51–711.62) | (2.77–5.59) | (3.51–15.59) | (178.93–416.30) | (49.73–594.96) | (123.80–209.22) | (98.10–158.30) | (17.18–49.74) | (2.54–5.33) | |||
| p | 0.969 | 0.666 | 0.256 | 0.212 | 0.530 | 0.969 | 0.766 | 0.808 | 0.610 | 0.944 | 0.020 | 0.999 | 0.760 | 0.713 | 0.348 | 0.938 | 0.808 | 0.540 | 0.101 | 0.327 | 0.124 | 0.666 | ||
| Men (n = 111) | Present (n = 37) | 13.80 | 1.49 | 8.51 | 3.21 | 2.03 | 309.83 | 15.04 | 318.96 | 1350.00 | 55.94 | 11.96 | 197.30 | 5.41 | 536.47 | 6.20 | 7.87 | 264.77 | 221.62 | 161.46 | 139.16 | 35.51 | 2.89 | |
| (5.50–37.59) | (0.30–2.86) | (6.74–13.27) | (0.58–3.73) | (1.06–4.10) | (222.00–392.07) | (11.90–25.83) | (247.99–542.97) | (1036.05–2022.90) | (43.01–109.94) | (7.47–18.42) | (155.30–221.70) | (3.80–7.11) | (455.32–656.91) | (4.19–7.24) | (3.27–11.72) | (177.62–369.81) | (41.46–511.55) | (131.07–210.82) | (112.08–187.90) | (27.56–51.53) | (2.47–3.90) | |||
| Absent (n = 74) | 6.60 | 1.56 | 8.16 | 2.89 | 2.21 | 314.02 | 13.29 | 325.63 | 1364.50 | 59.97 | 8.61 | 150.60 | 5.32 | 523.07 | 5.90 | 8.35 | 349.67 | 309.12 | 167.64 | 125.51 | 36.11 | 2.97 | ||
| (4.93–29.67) | (0.38–2.95) | (4.26–13.54) | (0.30–3.56) | (0.65–4.17) | (221.11–443.07) | (9.70–21.30) | (250.93–559.72) | (995.59–1983.23) | (32.56–90.31) | (6.96–13.20) | (120.40–204.60) | (3.84–7.00) | (428.05–622.74) | (3.56–7.11) | (4.46–17.30) | (204.19–557.44) | (65.70–590.88) | (132.65–205.18) | (95.53–182.55) | (24.80–54.51) | (2.13–4.04) | |||
| p | 0.272 | 0.566 | 0.451 | 0.465 | 0.925 | 0.374 | 0.134 | 0.965 | 0.993 | 0.418 | 0.111 | 0.011 | 0.923 | 0.316 | 0.592 | 0.149 | 0.040 | 0.166 | 0.947 | 0.364 | 0.982 | 0.840 |
| IL-4 [pg/mL] | IL-6 [pg/mL] | IL-8 [pg/mL] | IL-10 [pg/mL] | TNF-α [pg/mL] | CCL-2 [pg/mL] | CXCL-10 [pg/mL] | ICAM-1 [ng/mL] | VCAM-1 [ng/mL] | VEGF [pg/mL] | PAI-1 [ng/mL] | vWF [%] | EMMPRIN [ng/mL] | MMP-2 [ng/mL] | MMP-7 [ng/mL] | MMP-8 [ng/mL] | MMP-9 [ng/mL] | MMP-12 [ng/mL] | TIMP-1 [ng/mL] | TIMP-2 [ng/mL] | TIMP-3 [ng/mL] | TIMP-4 [ng/mL] | |||
|---|---|---|---|---|---|---|---|---|---|---|---|---|---|---|---|---|---|---|---|---|---|---|---|---|
| CMBs | Women (n = 59) | Present (n = 8) | 29.4 | 2.73 | 14.99 | 0.95 | 3.03 | 345.13 | 11.67 | 345.96 | 1825.05 | 71.43 | 9.47 | 161.50 | 6.97 | 656.87 | 5.53 | 8.80 | 308.55 | 594.96 | 248.23 | 223.73 | 61.78 | 6.30 |
| (6.10–40.28) | (0.78–4.36) | (9.08–18.55) | (0.26–3.35) | (0.69–6.21) | (267.74–843.49) | (8.58–15.96) | (297.98–406.85) | (1071.80–2452.03) | (53.41–112.62) | (7.01–10.71) | (109.20–207.50) | (5.80–10.21) | (468.51–1041.50) | (3.51–6.31) | (3.00–17.07) | (133.45–392.61) | (456.97–693.21) | (201.01–328.27) | (152.04–352.69) | (41.30–82.99) | (4.33–9.16) | |||
| Absent (n = 51) | 12.81 | 1.85 | 7.42 | 2.89 | 2.04 | 338.48 | 16.37 | 341.75 | 1406.20 | 78.44 | 8.99 | 163.95 | 5.51 | 493.74 | 4.50 | 6.78 | 299.81 | 414.58 | 154.55 | 118.07 | 31.92 | 3.36 | ||
| (5.40–23.92) | (0.65–3.77) | (4.65–11.58) | (0.44–3.56) | (1.51–4.00) | (242.92–485.08) | (10.86–22.30) | (274.28–463.87) | (1006.50–2044.30) | (37.71–127.60) | (6.69–15.93) | (131.05–203.63) | (4.23–6.50) | (389.08–643.47) | (2.61–6.28) | (3.51–12.97) | (178.16–420.08) | (46.35–586.80) | (125.26–202.86) | (98.05–146.91) | (18.04–50.02) | (2.40–4.66) | |||
| p | 0.312 | 0.825 | 0.008 | 0.098 | 0.868 | 0.626 | 0.135 | 0.929 | 0.341 | 0.965 | 0.628 | 0.851 | 0.054 | 0.073 | 0.430 | 0.550 | 0.713 | 0.026 | 0.008 | 0.002 | 0.006 | 0.003 | ||
| Men (n =111) | Present (n = 21) | 6.10 | 1.56 | 8.14 | 3.21 | 2.53 | 243.99 | 16.99 | 314.15 | 1249.50 | 75.34 | 10.63 | 159.80 | 5.89 | 619.67 | 6.04 | 6.99 | 295.33 | 309.12 | 189.57 | 148.67 | 38.82 | 3.18 | |
| (3.77–29.94) | (0.34–1.94) | (6.59–13.20) | (0.32–3.99) | (0.59–3.83) | (206.76–382.26) | (12.21–25.20) | (243.82–703.03) | (1034.48–2022.90) | (35.15–120.13) | (7.05–13.29) | (129.70–217.30) | (3.18–7.64) | (501.03–676.19) | (2.99–8.10) | (3.40–13.66) | (204.09–513.40) | (49.73–594.96) | (128.97–217.29) | (111.06–201.02) | (28.13–63.08) | (1.86–5.60) | |||
| Absent (n = 90) | 11.81 | 1.50 | 8.64 | 2.92 | 2.04 | 314.02 | 13.54 | 323.63 | 1404.55 | 56.36 | 8.85 | 178.50 | 5.32 | 511.15 | 5.97 | 8.22 | 319.50 | 309.12 | 163.93 | 131.02 | 35.51 | 2.89 | ||
| (5.00–33.47) | (0.30–3.12) | (5.40–14.19) | (0.30–3.52) | (1.06–4.17) | (221.11–435.15) | (9.92–23.75) | (251.68–513.74) | (1002.63–1983.23) | (36.32–89.44) | (7.11–16.71) | (127.00–212.70) | (3.99–6.60) | (433.51–596.67) | (3.68–7.09) | (4.19–14.61) | (190.29–482.20) | (63.58–527.74) | (132.65–199.03) | (96.45–177.86) | (24.80–51.94) | (2.16–3.97) | |||
| p | 0.472 | 0.904 | 0.792 | 0.351 | 0.934 | 0.259 | 0.283 | 0.769 | 0.781 | 0.577 | 0.949 | 0.988 | 0.952 | 0.013 | 0.718 | 0.472 | 0.811 | 0.781 | 0.707 | 0.396 | 0.436 | 0.787 |
| IL-4 [pg/mL] | IL-6 [pg/mL] | IL-8 [pg/mL] | IL-10 [pg/mL] | TNF-α [pg/mL] | CCL-2 [pg/mL] | CXCL-10 [pg/mL] | ICAM-1 [ng/mL] | VCAM-1 [ng/mL] | VEGF [pg/mL] | PAI-1 [ng/mL] | vWF [%] | EMMPRIN [ng/mL] | MMP-2 [ng/mL] | MMP-7 [ng/mL] | MMP-8 [ng/mL] | MMP-9 [ng/mL] | MMP-12 [ng/mL] | TIMP-1 [ng/mL] | TIMP-2 [ng/mL] | TIMP-3 [ng/mL] | TIMP-4 [ng/mL] | |||
|---|---|---|---|---|---|---|---|---|---|---|---|---|---|---|---|---|---|---|---|---|---|---|---|---|
| WMH | Women (n = 59) | Score 2–3 (n = 39) | 12.81 | 2.24 | 5.97 | 3.00 | 2.53 | 328.41 | 16.31 | 355.66 | 1518.80 | 78.44 | 10.28 | 172.650 | 5.53 | 532.82 | 4.69 | 7.51 | 324.64 | 450.10 | 170.64 | 133.68 | 38.82 | 4.13 |
| (5.60–35.81) | (1.49–5.17) | (4.65–11.58) | (0.32–3.56) | (1.51–5.00) | (273.90–458.84) | (10.41–20.54) | (285.74–491.33) | (1113.50–2191.30) | (48.65–121.23) | (7.07–17.04) | (131.30–218.78) | (4.03–6.90) | (448.32–730.37) | (2.79–5.922) | (3.60–15.30) | (179.71–424.08) | (46.35–594.96) | (138.48–249.46) | (99.04–214.85) | (21.36–65.68) | (2.58–6.04) | |||
| Score 0–1 (n = 20) | 9.76 | 1.53 | 10.31 | 2.89 | 2.02 | 358.84 | 15.54 | 342.37 | 1050.95 | 78.85 | 8.84 | 158.50 | 5.81 | 439.16 | 4.39 | 5.17 | 215.29 | 379.61 | 142.59 | 120.50 | 33.00 | 2.94 | ||
| (5.58–23.39) | (0.32–2.97) | (6.60–13.48) | (0.46–3.46) | (0.69–3.51) | (209.52–507.16) | (7.64–23.53) | (273.40–406.18) | (698.11–2010.73) | (37.52–113.20) | (6.28–11.05) | (123.80–181.60) | (4.67–6.85) | (364.36–519.80) | (2.69–6.47) | (1.85–12.31) | (129.82–390.89) | (83.42–553.97) | (119.35–188.27) | (99.25–140.37) | (18.36–45.55) | (2.40–3.96) | |||
| p | 0.547 | 0.042 | 0.078 | 0.331 | 0.320 | 0.949 | 0.592 | 0.701 | 0.179 | 0.511 | 0.256 | 0.223 | 0.597 | 0.022 | 0.867 | 0.280 | 0.212 | 0.724 | 0.087 | 0.405 | 0.370 | 0.099 | ||
| Men (n =111) | Score 2–3 (n = 73) | 12.81 | 1.56 | 8.94 | 2.89 | 2.53 | 317.15 | 14.51 | 332.93 | 1445.90 | 55.94 | 8.67 | 158.90 | 5.30 | 550.00 | 5.94 | 8.02 | 341.06 | 391.61 | 174.84 | 138.56 | 38.57 | 3.16 | |
| (5.30–36.03) | (0.34–3.16) | (5.67–13.20) | (0.30–3.56) | (1.06–4.20) | (219.38–422.57) | (14.51–24.35) | (248.81–583.79) | (999.83–2112.90) | (36.36–93.91) | (7.12–16.47) | (121.75–207.15) | (3.80–7.15) | (464.11–636.44) | (3.71–7.04) | (4.12–14.61) | (204.19–503.79) | (64.33–594.96) | (137.98–210.82) | (105.79–195.44) | (27.56–58.82) | (2.16–4.81) | |||
| Score 0–1 (n = 38) | 6.37 | 0.99 | 8.26 | 3.21 | 2.04 | 310.36 | 13.61 | 315.29 | 1337.75 | 61.21 | 9.16 | 191.60 | 5.40 | 459.15 | 6.12 | 7.41 | 303.41 | 87.96 | 150.12 | 122.28 | 30.49 | 2.66 | ||
| (3.64–23.88) | (0.30–2.17) | (5.06–13.92) | (1.06–3.58) | (0.65–3.06) | (224.29–415.37) | (9.66–23.30) | (268.79–465.49) | (1024.98–1951.30) | (32.10–111.41) | (6.97–16.02) | (135.58–213.03) | (3.83–6.90) | (411.93–565.90) | (2.95–7.84) | (3.82–12.80) | (176.53–435.01) | (58.04–450.10) | (120.12–181.45) | (94.30–154.62) | (22.16–46.11) | (1.92–3.54) | |||
| p | 0.275 | 0.226 | 0.816 | 0.378 | 0.400 | 0.877 | 0.524 | 0.901 | 0.452 | 0.931 | 0.869 | 0.799 | 0.995 | 0.012 | 0.555 | 0.745 | 0.469 | 0.067 | 0.023 | 0.058 | 0.122 | 0.075 |
| IL-4 [pg/mL] | IL-6 [pg/mL] | IL-8 [pg/m] | IL-10 [pg/m] | TNF-α [pg/mL] | CCL-2 [pg/mL] | CXCL-10 [pg/mL] | ICAM-1 [ng/mL] | VCAM-1[ng/mL] | VEGF [pg/mL] | PAI-1 [ng/mL] | vWF [%] | EMMPRIN [ng/mL] | MMP-2 [ng/mL] | MMP-7 [ng/mL] | MMP-8 [ng/mL] | MMP-9 [ng/mL] | MMP-12 [ng/mL] | TIMP-1 [ng/mL] | TIMP-2 [ng/mL] | TIMP-3 [ng/mL] | TIMP-4 [ng/mL] | |||
|---|---|---|---|---|---|---|---|---|---|---|---|---|---|---|---|---|---|---|---|---|---|---|---|---|
| bgEPVS | Women (n = 59) | Present (n = 30) | 12.81 | 1.98 | 8.75 | 2.89 | 2.04 | 355.41 | 16.11 | 332.19 | 1621.6 | 60.43 | 8.93 | 175.60 | 5.79 | 526.44 | 4.15 | 6.78 | 318.51 | 584.12 | 169.12 | 138.15 | 38.82 | 4.02 |
| (5.30–32.61) | (1.49–5.40) | (5.44–13.32) | (0.61–3.46) | (0.73–4.50) | (262.32–571.88) | (10.39–21.91) | (264.93–507.81) | (1037.30–2294.40) | (38.53–118.09) | (5.74–13.85) | (129.20–210.70) | (4.35–7.78) | (398.94–668.58) | (2.58–5.53) | (3.97–12.06) | (170.94–409.15) | (327.72–612.28) | (148.52–236.37) | (112.91–196.54) | (25.72–55.20) | (2.72–6.37) | |||
| Absent (n = 29) | 12.81 | 1.94 | 5.98 | 3.23 | 2.28 | 322.89 | 16.96 | 359.47 | 1391.40 | 78.16 | 9.60 | 151.65 | 5.66 | 455.83 | 5.26 | 6.82 | 283.98 | 283.50 | 138.29 | 116.54 | 31.20 | 3.41 | ||
| (5.55–28.52) | (0.38–3.48) | (4.65–10.58) | (0.31–4.55) | (1.20–4.00) | (228.99–397.79) | (9.78–20.92) | (297.77–413.67) | (908.94–1997.23) | (46.81–114.64) | (6.87–13.44) | (131.15–202.78) | (4.25–6.87) | (375.42–677.35) | (2.87–7.14) | (1.71–14.76) | (154.55–419.03) | (40.99–450.10) | (118.62–208.78) | (86.93–143.42) | (15.88–53.65) | (2.35–4.79) | |||
| p | 0.798 | 0.538 | 0.172 | 0.387 | 0.905 | 0.120 | 0.854 | 0.374 | 0.429 | 0.638 | 0.698 | 0.655 | 0.861 | 0.228 | 0.151 | 0.719 | 0.743 | 0.003 | 0.092 | 0.042 | 0.384 | 0.136 | ||
| Men (n =111) | Present (n = 72) | 12.81 | 1.56 | 9.33 | 3.21 | 2.53 | 326.68 | 13.49 | 328.62 | 1424.40 | 66.41 | 8.60 | 163.90 | 5.61 | 540.58 | 5.81 | 8.01 | 330.28 | 319.73 | 173.42 | 142.00 | 38.70 | 3.10 | |
| (5.10–32.69) | (0.38–3.51) | (5.93–14.44) | (0.30–3.56) | (1.06–4.25) | (225.23–441.34) | (10.04–23.19) | (251.83–584.99) | (979.08–2147.70) | (37.15–111.16) | (7.15–16.51) | (126.60–213.00) | (4.37–7.61) | (435.16–627.28) | (3.26–7.13) | (3.90–14.06) | (216.41–483.71) | (76.16–542.51) | (142.92–211.32) | (109.98–192.599) | (28.68–56.69) | (2.29–5.04) | |||
| Absent (n = 39) | 6.50 | 0.81 | 7.12 | 2.89 | 2.03 | 279.09 | 15.42 | 314.39 | 1347.80 | 49.88 | 9.33 | 178.50 | 4.79 | 505.60 | 6.07 | 7.36 | 284.13 | 164.41 | 154.32 | 120.42 | 34.09 | 2.67 | ||
| (2.54–21.03) | (0.30–1.89) | (4.22–10.79) | (0.30–3.56) | (0.70–3.01) | (213.43–391.25) | (10.86–25.04) | (243.59–484.78) | (1037.43–1886.23) | (32.10–79.81) | (6.79–12.75) | (128.30–205.30) | (3.38–6.39) | (451.40–620.19) | (4.88–7.31) | (3.98–13.86) | (174.68–475.02) | (53.11–603.62) | (114.72–194.56) | (91.55–161.85) | (19.30–50.77) | (2.04–3.85) | |||
| p | 0.417 | 0.019 | 0.065 | 0.551 | 0.378 | 0.315 | 0.457 | 0.521 | 0.799 | 0.106 | 0.542 | 0.876 | 0.121 | 0.487 | 0.481 | 0.857 | 0.508 | 0.657 | 0.018 | 0.046 | 0.084 | 0.160 |
| IL-4 [pg/mL] | IL-6 [pg/mL] | IL-8 [pg/mL] | IL-10 [pg/mL] | TNF-α [pg/mL] | CCL-2 [pg/mL] | CXCL-10 [pg/mL] | ICAM-1 [ng/mL] | VCAM-1 [ng/mL] | VEGF [pg/mL] | PAI-1 [ng/mL] | vWF [%] | EMMPRIN [ng/mL] | MMP-2 [ng/mL] | MMP-7 [ng/mL] | MMP-8 [ng/mL] | MMP-9 [ng/mL] | MMP-12 [ng/mL] | TIMP-1 [ng/mL] | TIMP-2 [ng/mL] | TIMP-3 [ng/mL] | TIMP-4 [ng/mL] | |||
|---|---|---|---|---|---|---|---|---|---|---|---|---|---|---|---|---|---|---|---|---|---|---|---|---|
| SVDs | Women (n = 59) | At least one sign (n = 28) | 12.81 | 2.23 | 8.85 | 2.89 | 2.95 | 336.67 | 15.94 | 333.92 | 1667.15 | 78.69 | 9.47 | 186.85 | 5.75 | 556.20 | 3.92 | 7.63 | 309.33 | 585.46 | 178.18 | 144.01 | 41.46 | 4.37 |
| (5.73–34.21) | (1.49–5.52) | (4.77–15.22) | (0.30–3.46) | (1.07–5.77) | (256.53–533.83) | (10.52–21.06) | (269.41–532.19) | (1075.55–2345.95) | (46.21–120.91) | (6.55–12.65) | (137.88–227.70) | (3.95–8.08) | (448.54–739.46) | (2.54–5.66) | (3.53–15.73) | (167.33–404.75) | (270.69–620.93) | (149.16–253.90) | (116.89–240.59) | (27.56–66.80) | (3.05–6.54) | |||
| No signs (n = 31) | 12.81 | 1.73 | 8.0 5 | 2.89 | 2.03 | 341.05 | 16.37 | 342.99 | 1312.40 | 77.87 | 8.99 | 146.65 | 5.53 | 465.93 | 4.87 | 6.78 | 288.90 | 309.12 | 138.48 | 114.31 | 30.49 | 2.89 | ||
| (5.40–25.87) | (0.38–3.38 | (4.65–10.62) | (0.44–3.56) | (1.10–3.51) | (227.89–455.04) | (8.61–22.99) | (282.06–408.06) | (888.10–2044.30) | (37.46–113.39) | (7.13–15.93) | (126.00–198.20) | (4.31–6.50) | (365.75–598.17) | (2.86–6.53) | (1.91–12.97) | (173.21–424.08) | (45.01–463.50) | (112.96–202.86) | (84.31–136.99) | (15.73–46.61) | (2.31–4.02) | |||
| p | 0.648 | 0.155 | 0.189 | 0.398 | 0.342 | 0.509 | 0.982 | 0.933 | 0.184 | 0.791 | 0.702 | 0.049 | 0.891 | 0.074 | 0.431 | 0.595 | 0.970 | 0.015 | 0.011 | 0.003 | 0.032 | 0.009 | ||
| Men (n =111) | At least one sign (n = 71) | 12.81 | 1.56 | 9.33 | 2.89 | 2.53 | 317.86 | 14.34 | 328.62 | 1445.90 | 61.58 | 8.67 | 163.90 | 5.63 | 556.06 | 5.90 | 8.22 | 341.06 | 359.51 | 177.31 | 138.56 | 38.82 | 3.12 | |
| (5.10–35.81) | (0.38–3.07) | (5.93–13.24) | (0.30–3.50) | (1.06–4.25) | (225.23–421.91) | (10.74–23.19) | (250.98–627.24) | (979.08–2147.70) | (37.46–108.71) | (7.15–16.42) | (124.60–211.00) | (4.13–7.61) | (460.00–653.05) | (3.70–7.11) | (4.00–14.76) | (220.49–549.24) | (62.96–594.96) | (141.79–211.09) | (106.63–196.96) | (28.59–58.76) | (2.14–5.40) | |||
| No signs (n = 40) | 6.50 | 0.81 | 7.77 | 3.20 | 2.04 | 309.25 | 14.15 | 317.89 | 1337.75 | 49.52 | 9.16 | 185.00 | 4.97 | 468.36 | 6.05 | 7.20 | 303.41 | 87.96 | 150.12 | 123.48 | 30.49 | 2.67 | ||
| (4.18–27.56) | (0.30–2.54) | (4.54–13.00) | (0.55–3.63) | (0.78–3.75) | (218.55–427.18) | (10.15–24.48) | (246.20–471.79) | (1034.68–1771.58) | (31.00–83.05) | (6.91–16.30) | (128.90–212.70) | (3.82–6.14) | (424.51–557.19) | (3.17–7.31) | (4.14–11.94) | (180.01–405.05) | (62.96–495.36) | (115.48–175.69) | (93.68–155.97) | (21.36–46.91) | (2.14–3.66) | |||
| p | 0.497 | 0.073 | 0.248 | 0.479 | 0.453 | 0.976 | 0.929 | 0.708 | 0.589 | 0.162 | 0.724 | 0.711 | 0.165 | 0.014 | 0.801 | 0.687 | 0.708 | 0.267 | 0.009 | 0.060 | 0.061 | 0.124 |
Disclaimer/Publisher’s Note: The statements, opinions and data contained in all publications are solely those of the individual author(s) and contributor(s) and not of MDPI and/or the editor(s). MDPI and/or the editor(s) disclaim responsibility for any injury to people or property resulting from any ideas, methods, instructions or products referred to in the content. |
© 2026 by the authors. Licensee MDPI, Basel, Switzerland. This article is an open access article distributed under the terms and conditions of the Creative Commons Attribution (CC BY) license.
Share and Cite
Alfano, F.; Berteotti, M.; Cesari, F.; Gori, A.M.; Salvadori, E.; Giusti, B.; Bertelli, A.; Bicchi, L.; Fratini, F.; Formelli, B.; et al. Atrial Fibrillation, Cerebral Small Vessel Disease and Gender Medicine: Focus on Biomarkers and Neuroimaging. J. Clin. Med. 2026, 15, 4427. https://doi.org/10.3390/jcm15124427
Alfano F, Berteotti M, Cesari F, Gori AM, Salvadori E, Giusti B, Bertelli A, Bicchi L, Fratini F, Formelli B, et al. Atrial Fibrillation, Cerebral Small Vessel Disease and Gender Medicine: Focus on Biomarkers and Neuroimaging. Journal of Clinical Medicine. 2026; 15(12):4427. https://doi.org/10.3390/jcm15124427
Chicago/Turabian StyleAlfano, Francesco, Martina Berteotti, Francesca Cesari, Anna Maria Gori, Emilia Salvadori, Betti Giusti, Alessia Bertelli, Luca Bicchi, Filippo Fratini, Benedetta Formelli, and et al. 2026. "Atrial Fibrillation, Cerebral Small Vessel Disease and Gender Medicine: Focus on Biomarkers and Neuroimaging" Journal of Clinical Medicine 15, no. 12: 4427. https://doi.org/10.3390/jcm15124427
APA StyleAlfano, F., Berteotti, M., Cesari, F., Gori, A. M., Salvadori, E., Giusti, B., Bertelli, A., Bicchi, L., Fratini, F., Formelli, B., Barucci, E., Salti, G., Fainardi, E., Ginestroni, A., Chiti, S., Poggesi, A., & Marcucci, R. (2026). Atrial Fibrillation, Cerebral Small Vessel Disease and Gender Medicine: Focus on Biomarkers and Neuroimaging. Journal of Clinical Medicine, 15(12), 4427. https://doi.org/10.3390/jcm15124427