
The Impact of Obesity on Prostate Cancer and Progression to Castration Resistance—Real-World Data from a Romanian Center

 ,
,  , and
, and
Abstract
:1. Introduction
2. Materials and Methods
3. Results
4. Discussion
5. Conclusions
Author Contributions
Funding
Institutional Review Board Statement
Informed Consent Statement
Data Availability Statement
Conflicts of Interest
References
- WHO. WHO European Regional Obesity Report 2022; WHO: Geneva, Switzerland, 2022. Available online: https://www.who.int/europe/publications/i/item/9789289057738 (accessed on 12 March 2025).
- Bentham, J.; Di Cesare, M.; Bilano, V.; Bixby, H.; Zhou, B.; Stevens, G.A.; Riley, L.M.; Taddei, C.; Hajifathalian, K.; Lu, Y.; et al. Worldwide Trends in Body-Mass Index, Underweight, Overweight, and Obesity from 1975 to 2016: A Pooled Analysis of 2416 Population-Based Measurement Studies in 128·9 Million Children, Adolescents, and Adults. Lancet 2017, 390, 2627–2642. [Google Scholar] [CrossRef]
- World Obesity Federation. World Obesity Atlas 2025; World Obesity Federation: London, UK, 2025; Available online: https://data.worldobesity.org/publications/?cat=23 (accessed on 12 March 2025).
- Sung, H.; Ferlay, J.; Siegel, R.L.; Laversanne, M.; Soerjomataram, I.; Jemal, A.; Bray, F. Global Cancer Statistics 2020: GLOBOCAN Estimates of Incidence and Mortality Worldwide for 36 Cancers in 185 Countries. CA. Cancer J. Clin. 2021, 71, 209–249. [Google Scholar] [CrossRef] [PubMed]
- Lauby-Secretan, B.; Scoccianti, C.; Loomis, D.; Grosse, Y.; Bianchini, F.; Straif, K. Body Fatness and Cancer—Viewpoint of the IARC Working Group. N. Engl. J. Med. 2016, 375, 794–798. [Google Scholar] [CrossRef] [PubMed]
- Avgerinos, K.I.; Spyrou, N.; Mantzoros, C.S.; Dalamaga, M. Obesity and Cancer Risk: Emerging Biological Mechanisms and Perspectives. Metabolism 2019, 92, 121–135. [Google Scholar] [CrossRef]
- Vickman, R.E.; Franco, O.E.; Moline, D.C.; Vander Griend, D.J.; Thumbikat, P.; Hayward, S.W. The Role of the Androgen Receptor in Prostate Development and Benign Prostatic Hyperplasia: A Review. Asian J. Urol. 2020, 7, 191–202. [Google Scholar] [CrossRef]
- Huggins, C.; Hodges, C. V Studies on Prostatic Cancer. I. The Effect of Castration, of Estrogen and of Androgen Injection on Serum Phosphatases in Metastatic Carcinoma of the Prostate. Cancer Res. 1941, 1, 293–297. [Google Scholar]
- EAU Guidelines Office, Arnhem, The Netherlands. Available online: http://uroweb.org/guidelines/compilations-of-all-guidelines/ (accessed on 22 April 2025).
- Discacciati, A.; Orsini, N.; Wolk, A. Body Mass Index and Incidence of Localized and Advanced Prostate Cancer-a Dose-Response Meta-Analysis of Prospective Studies. Ann. Oncol. 2012, 23, 1665–1671. [Google Scholar] [CrossRef]
- Vidal, A.C.; Howard, L.E.; Moreira, D.M.; Castro-Santamaria, R.; Andriole, G.L.; Freedland, S.J. Obesity Increases the Risk for High-Grade Prostate Cancer: Results from the REDUCE Study. Cancer Epidemiol. Biomarkers Prev. 2014, 23, 2936–2942. [Google Scholar] [CrossRef]
- Gacci, M.; Russo, G.I.; De Nunzio, C.; Sebastianelli, A.; Salvi, M.; Vignozzi, L.; Tubaro, A.; Morgia, G.; Serni, S. Meta-Analysis of Metabolic Syndrome and Prostate Cancer. Prostate Cancer Prostatic Dis. 2017, 20, 146–155. [Google Scholar] [CrossRef]
- Mitsuzuka, K.; Arai, Y. Metabolic Changes in Patients with Prostate Cancer during Androgen Deprivation Therapy. Int. J. Urol. 2018, 25, 45–53. [Google Scholar] [CrossRef]
- Tzortzis, V.; Samarinas, M.; Zachos, I.; Oeconomou, A.; Pisters, L.L.; Bargiota, A. Adverse Effects of Androgen Deprivation Therapy in Patients with Prostate Cancer: Focus on Metabolic Complications. Hormones 2017, 16, 115–123. [Google Scholar] [CrossRef] [PubMed]
- Gupta, D.; Lee Chuy, K.; Yang, J.C.; Bates, M.; Lombardo, M.; Steingart, R.M. Cardiovascular and Metabolic Effects of Androgen-Deprivation Therapy for Prostate Cancer. J. Oncol. Pract. 2018, 14, 580–587. [Google Scholar] [CrossRef] [PubMed]
- Braunstein, L.Z.; Chen, M.-H.; Loffredo, M.J.; Kantoff, P.W.; D’Amico, A.V. Obesity and the Odds of Weight Gain Following Androgen Deprivation Therapy for Prostate Cancer: Toward a Risk Adapted Approach for ADT Use. J. Clin. Oncol. 2014, 32, 5045. [Google Scholar] [CrossRef]
- Buyyounouski, M.K.; Choyke, P.L.; McKenney, J.K.; Sartor, O.; Sandler, H.M.; Amin, M.B.; Kattan, M.W.; Lin, D.W. Prostate Cancer–Major Changes in the American Joint Committee on Cancer Eighth Edition Cancer Staging Manual. CA. Cancer J. Clin. 2017, 67, 245–253. [Google Scholar] [CrossRef] [PubMed]
- Epstein, J.I.; Egevad, L.; Amin, M.B.; Delahunt, B.; Srigley, J.R.; Humphrey, P.A. The 2014 International Society of Urological Pathology (ISUP) Consensus Conference on Gleason Grading of Prostatic Carcinoma: Definition of Grading Patterns and Proposal for a New Grading System. Am. J. Surg. Pathol. 2016, 40, 244–252. [Google Scholar] [CrossRef] [PubMed]
- Popovici, D.; Stanisav, C.; Pricop, M.; Dragomir, R.; Saftescu, S.; Ciurescu, D. Associations between Body Mass Index and Prostate Cancer: The Impact on Progression-Free Survival. Medicina 2023, 59, 289. [Google Scholar] [CrossRef]
- Popa, S.; Moţa, M.; Popa, A.; Moţa, E.; Serafinceanu, C.; Guja, C.; Catrinoiu, D.; Hâncu, N.; Lichiardopol, R.; Bala, C.; et al. Prevalence of Overweight/Obesity, Abdominal Obesity and Metabolic Syndrome and Atypical Cardiometabolic Phenotypes in the Adult Romanian Population: PREDATORR Study. J. Endocrinol. Invest. 2016, 39, 1045–1053. [Google Scholar] [CrossRef]
- Gandaglia, G.; Pellegrino, F.; Golozar, A.; De Meulder, B.; Abbott, T.; Achtman, A.; Imran Omar, M.; Alshammari, T.; Areia, C.; Asiimwe, A.; et al. Clinical Characterization of Patients Diagnosed with Prostate Cancer and Undergoing Conservative Management: A PIONEER Analysis Based on Big Data. Eur. Urol. 2024, 85, 457–465. [Google Scholar] [CrossRef]
- Bañez, L.L.; Hamilton, R.J.; Partin, A.W.; Vollmer, R.T.; Sun, L.; Rodriguez, C.; Wang, Y.; Terris, M.K.; Aronson, W.J.; Presti, J.C.J.; et al. Obesity-Related Plasma Hemodilution and PSA Concentration among Men with Prostate Cancer. JAMA 2007, 298, 2275–2280. [Google Scholar] [CrossRef]
- Bonn, S.E.; Sjölander, A.; Tillander, A.; Wiklund, F.; Grönberg, H.; Bälter, K. Body Mass Index in Relation to Serum Prostate-Specific Antigen Levels and Prostate Cancer Risk. Int. J. Cancer 2016, 139, 50–57. [Google Scholar] [CrossRef]
- Aref, A.T.; Vincent, A.D.; O’Callaghan, M.E.; Martin, S.A.; Sutherland, P.D.; Hoy, A.J.; Butler, L.M.; Wittert, G.A. The Inverse Relationship between Prostate Specific Antigen (PSA) and Obesity. Endocr. Relat. Cancer 2018, 25, 933–941. [Google Scholar] [CrossRef] [PubMed]
- Lin, D.; Liu, T.; Chen, L.; Chen, Z. Body Mass Index in Relation to Prostate-Specific Antigen-Related Parameters. BMC Urol. 2021, 21, 1–5. [Google Scholar] [CrossRef] [PubMed]
- Klaassen, Z.; Howard, L.E.; Moreira, D.M.; Andriole, G.L.J.; Terris, M.K.; Freedland, S.J. Association of Obesity-Related Hemodilution of Prostate-Specific Antigen, Dihydrotestosterone, and Testosterone. Prostate 2017, 77, 466–470. [Google Scholar] [CrossRef] [PubMed]
- Parikesit, D.; Mochtar, C.A.; Umbas, R.; Hamid, A.R.A.H. The Impact of Obesity towards Prostate Diseases. Prostate Int. 2016, 4, 1–6. [Google Scholar] [CrossRef]
- Rivera-Izquierdo, M.; Pérez de Rojas, J.; Martínez-Ruiz, V.; Pérez-Gómez, B.; Sánchez, M.-J.; Khan, K.S.; Jiménez-Moleón, J.J. Obesity as a Risk Factor for Prostate Cancer Mortality: A Systematic Review and Dose-Response Meta-Analysis of 280,199 Patients. Cancers 2021, 13, 4169. [Google Scholar] [CrossRef]
- Romero-Corral, A.; Montori, V.M.; Somers, V.K.; Korinek, J.; Thomas, R.J.; Allison, T.G.; Mookadam, F.; Lopez-Jimenez, F. Association of Bodyweight with Total Mortality and with Cardiovascular Events in Coronary Artery Disease: A Systematic Review of Cohort Studies. Lancet 2006, 368, 666–678. [Google Scholar] [CrossRef]
- Wang, L.; Liu, W.; He, X.; Chen, Y.; Lu, J.; Liu, K.; Cao, K.; Yin, P. Association of Overweight and Obesity with Patient Mortality after Acute Myocardial Infarction: A Meta-Analysis of Prospective Studies. Int. J. Obes. 2016, 40, 220–228. [Google Scholar] [CrossRef]
- Shen, F.-C.; Chen, M.-E.; Wu, W.-T.; Kuo, I.-C.; Niu, S.-W.; Lee, J.-J.; Hung, C.-C.; Chang, J.-M.; Hwang, S.-J. Normal Weight and Waist Obesity Indicated by Increased Total Body Fat Associated with All-Cause Mortality in Stage 3-5 Chronic Kidney Disease. Front. Nutr. 2022, 9, 982519. [Google Scholar] [CrossRef]
- Yamauchi, Y.; Hasegawa, W.; Yasunaga, H.; Sunohara, M.; Jo, T.; Takami, K.; Matsui, H.; Fushimi, K.; Nagase, T. Paradoxical Association between Body Mass Index and In-Hospital Mortality in Elderly Patients with Chronic Obstructive Pulmonary Disease in Japan. Int. J. Chron. Obstruct. Pulmon. Dis. 2014, 9, 1337–1346. [Google Scholar] [CrossRef]
- Guo, Y.; Zhang, T.; Wang, Z.; Yu, F.; Xu, Q.; Guo, W.; Wu, C.; He, J. Body Mass Index and Mortality in Chronic Obstructive Pulmonary Disease: A Dose-Response Meta-Analysis. Medicine 2016, 95, e4225. [Google Scholar] [CrossRef]
- Han, S.J.; Boyko, E.J. The Evidence for an Obesity Paradox in Type 2 Diabetes Mellitus. Diabetes Metab. J. 2018, 42, 179–187. [Google Scholar] [CrossRef] [PubMed]
- Lee, D.H.; Giovannucci, E.L. The Obesity Paradox in Cancer: Epidemiologic Insights and Perspectives. Curr. Nutr. Rep. 2019, 8, 175–181. [Google Scholar] [CrossRef] [PubMed]
- Martini, A.; Shah, Q.N.; Waingankar, N.; Sfakianos, J.P.; Tsao, C.-K.; Necchi, A.; Montorsi, F.; Gallagher, E.J.; Galsky, M.D. The Obesity Paradox in Metastatic Castration-Resistant Prostate Cancer. Prostate Cancer Prostatic Dis. 2022, 25, 472–478. [Google Scholar] [CrossRef] [PubMed]
- Gerdtsson, A.; Poon, J.B.; Thorek, D.L.; Mucci, L.A.; Evans, M.J.; Scardino, P.; Abrahamsson, P.-A.; Nilsson, P.; Manjer, J.; Bjartell, A.; et al. Anthropometric Measures at Multiple Times Throughout Life and Prostate Cancer Diagnosis, Metastasis, and Death. Eur. Urol. 2015, 68, 1076–1082. [Google Scholar] [CrossRef]
- Porcaro, A.B.; Tafuri, A.; Sebben, M.; Processali, T.; Pirozzi, M.; Amigoni, N.; Rizzetto, R.; Shakir, A.; Cerruto, M.A.; Brunelli, M.; et al. High Body Mass Index Predicts Multiple Prostate Cancer Lymph Node Metastases after Radical Prostatectomy and Extended Pelvic Lymph Node Dissection. Asian J. Androl. 2020, 22, 323–329. [Google Scholar] [CrossRef]
- Porcaro, A.B.; Tafuri, A.; Sebben, M.; Processali, T.; Pirozzi, M.; Amigoni, N.; Rizzetto, R.; Shakir, A.; Cacciamani, G.E.; Brunelli, M.; et al. Body Mass Index and Prostatic-Specific Antigen Are Predictors of Prostate Cancer Metastases in Patients Undergoing Robot-Assisted Radical Prostatectomy and Extended Pelvic Lymph Node Dissection. Minerva Urol. Nefrol. 2019, 71, 516–523. [Google Scholar] [CrossRef]
- Tafuri, A.; Amigoni, N.; Rizzetto, R.; Sebben, M.; Shakir, A.; Gozzo, A.; Odorizzi, K.; De Michele, M.; Gallina, S.; Bianchi, A.; et al. Obesity Strongly Predicts Clinically Undetected Multiple Lymph Node Metastases in Intermediate- and High-Risk Prostate Cancer Patients Who Underwent Robot Assisted Radical Prostatectomy and Extended Lymph Node Dissection. Int. Urol. Nephrol. 2020, 52, 2097–2105. [Google Scholar] [CrossRef]
- Rivera-Izquierdo, M.; Pérez de Rojas, J.; Martínez-Ruiz, V.; Arrabal-Polo, M.Á.; Pérez-Gómez, B.; Jiménez-Moleón, J.J. Obesity and Biochemical Recurrence in Clinically Localised Prostate Cancer: A Systematic Review and Meta-Analysis of 86,490 Patients. Prostate Cancer Prostatic Dis. 2022, 25, 411–421. [Google Scholar] [CrossRef]
- Keto, C.J.; Aronson, W.J.; Terris, M.K.; Presti, J.C.; Kane, C.J.; Amling, C.L.; Freedland, S.J. Obesity Is Associated with Castration-Resistant Disease and Metastasis in Men Treated with Androgen Deprivation Therapy after Radical Prostatectomy: Results from the SEARCH Database. BJU Int. 2012, 110, 492–498. [Google Scholar] [CrossRef]
- Flanagan, J.; Gray, P.K.; Hahn, N.; Hayes, J.; Myers, L.J.; Carney-Doebbeling, C.; Sweeney, C.J. Presence of the Metabolic Syndrome Is Associated with Shorter Time to Castration-Resistant Prostate Cancer. Ann. Oncol. 2011, 22, 801–807. [Google Scholar] [CrossRef]
- Chandrasekar, T.; Yang, J.C.; Gao, A.C.; Evans, C.P. Mechanisms of Resistance in Castration-Resistant Prostate Cancer (CRPC). Transl. Androl. Urol. 2015, 4, 365–380. [Google Scholar] [CrossRef] [PubMed]
- Xue, B.; Wu, S.; Sharkey, C.; Tabatabaei, S.; Wu, C.-L.; Tao, Z.; Cheng, Z.; Strand, D.; Olumi, A.F.; Wang, Z. Obesity-Associated Inflammation Induces Androgenic to Estrogenic Switch in the Prostate Gland. Prostate Cancer Prostatic Dis. 2020, 23, 465–474. [Google Scholar] [CrossRef] [PubMed]
- Di Zazzo, E.; Galasso, G.; Giovannelli, P.; Di Donato, M.; Bilancio, A.; Perillo, B.; Sinisi, A.A.; Migliaccio, A.; Castoria, G. Estrogen Receptors in Epithelial-Mesenchymal Transition of Prostate Cancer. Cancers 2019, 11, 1418. [Google Scholar] [CrossRef] [PubMed]


| Age, mean ± SD (years) | 67.11 ± 8.05 |
| Weight, median (IQR) (kg) | 84.93 (20) |
| BMI, median (IQR) (kg/m2) | 27.83 (6.02) |
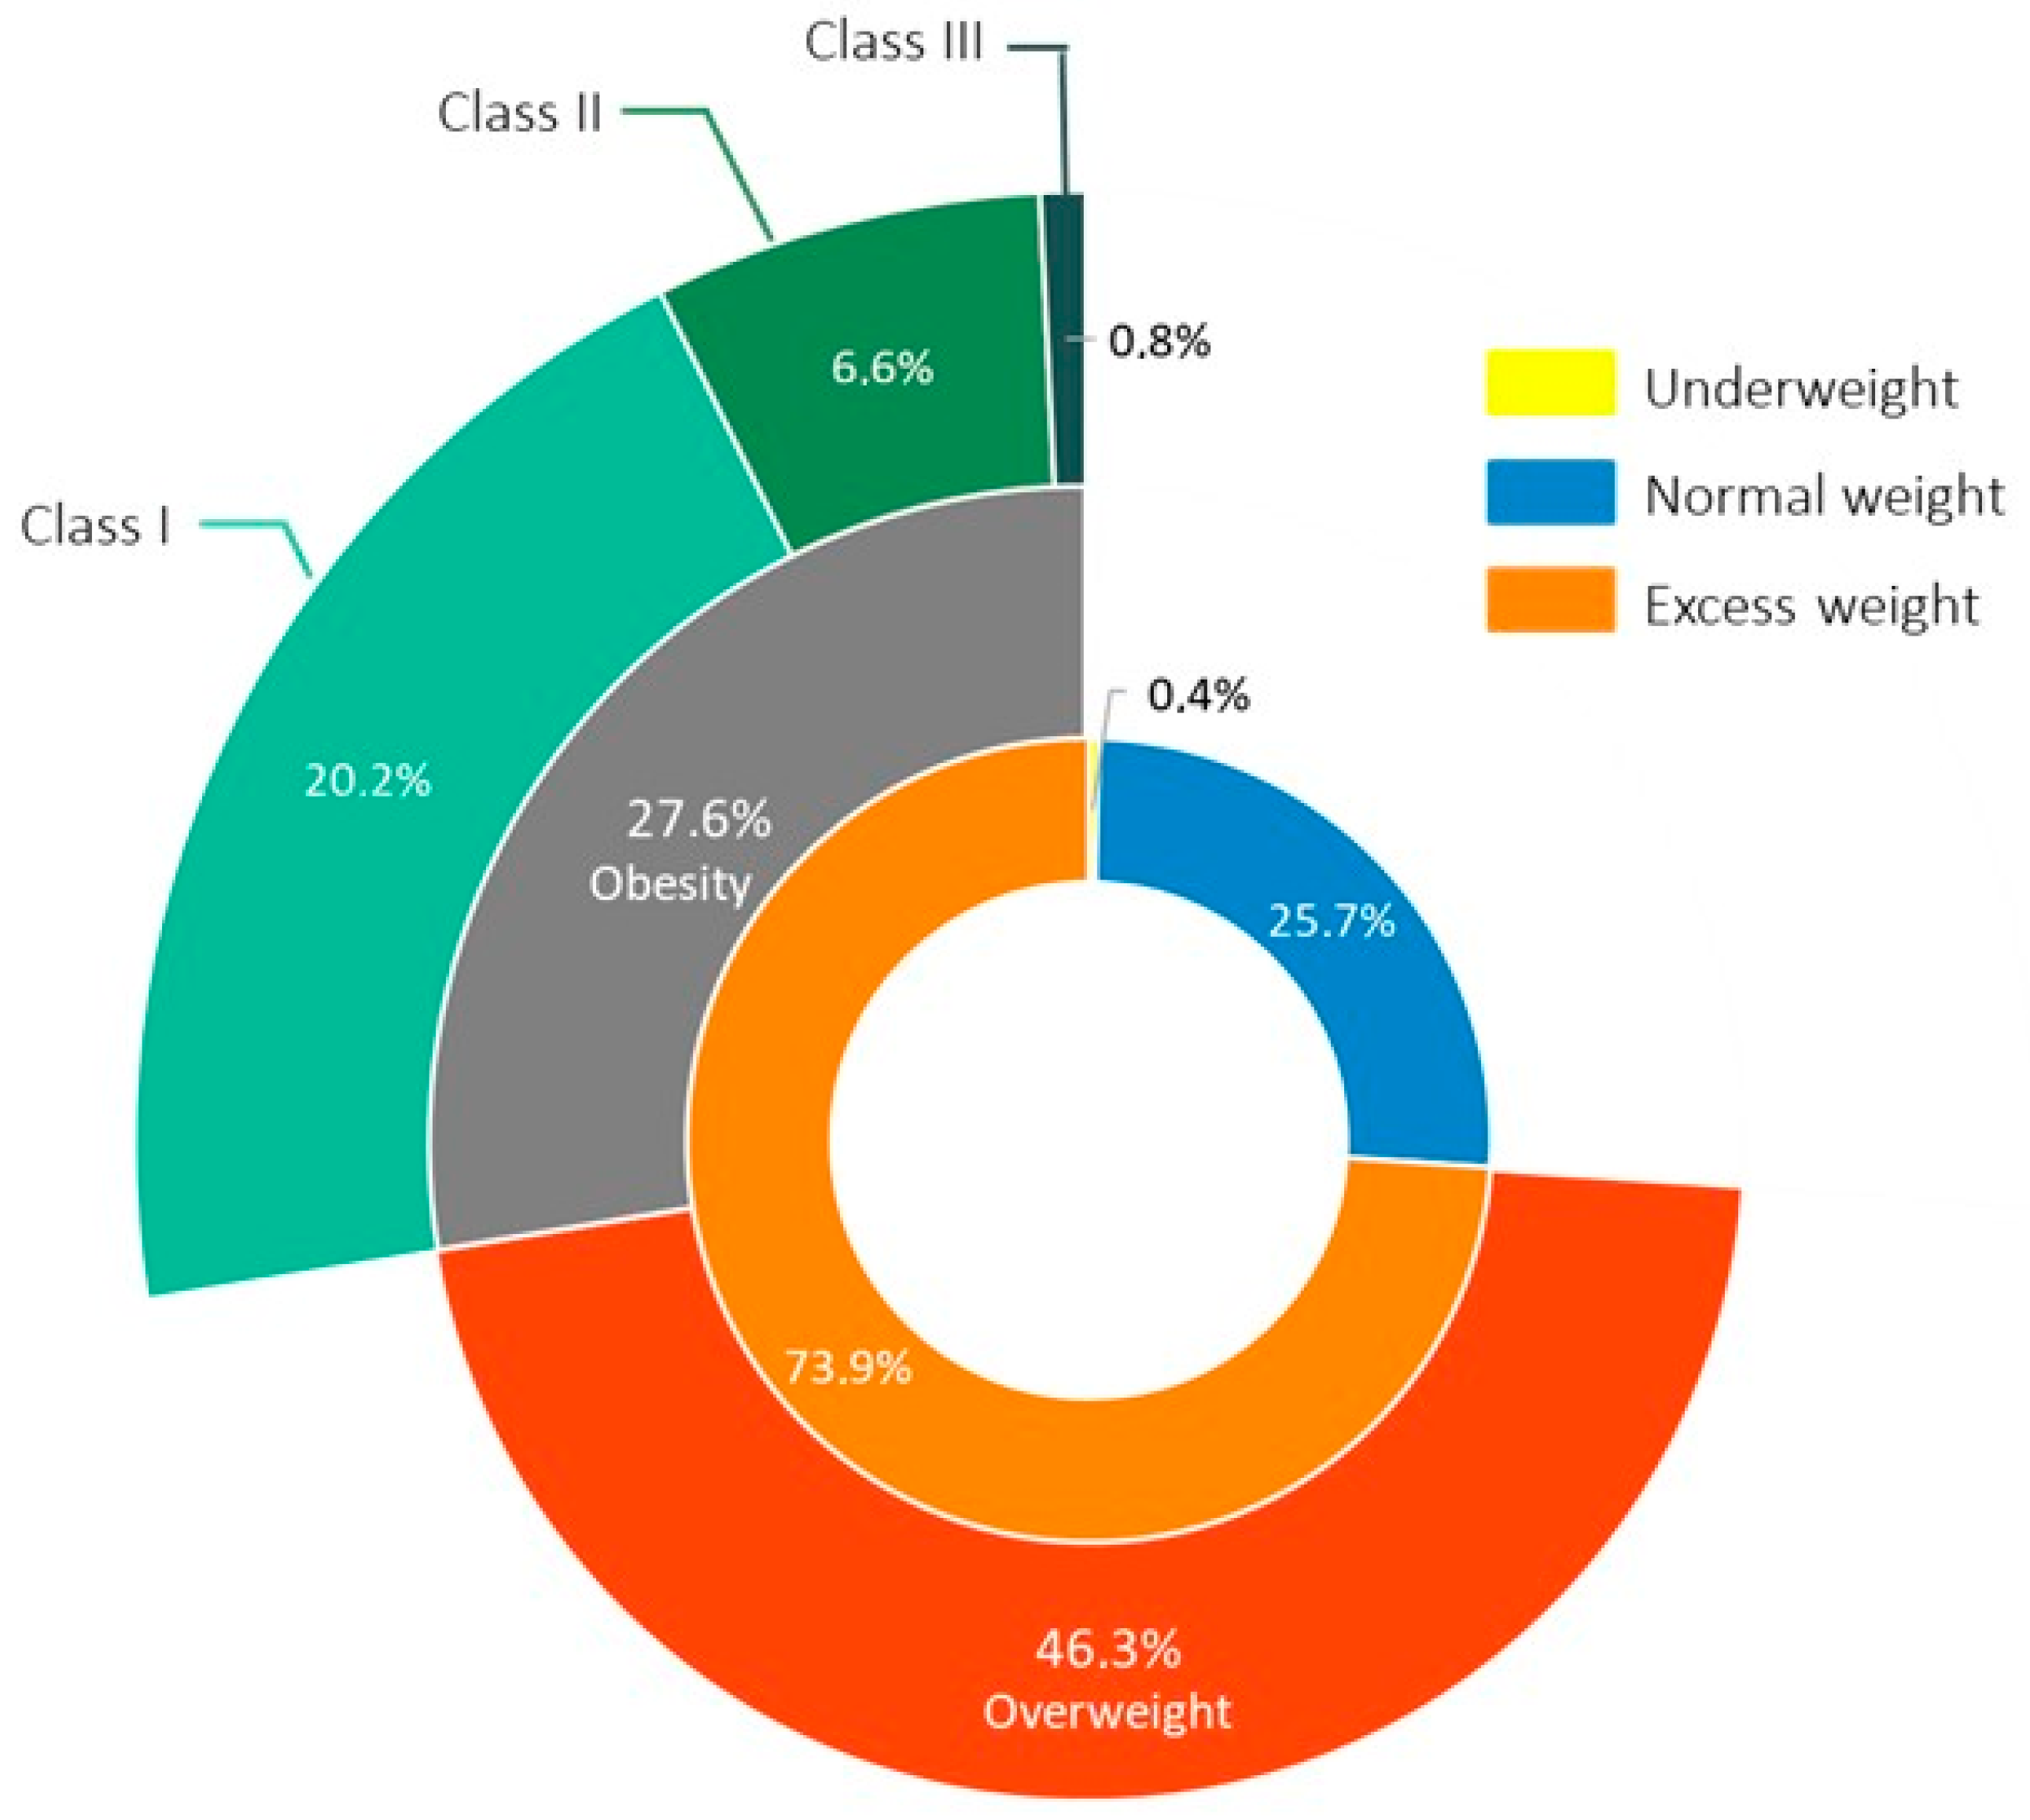
| Obesity, N (%) | 71 (27.6%) |
| Nutritional status, N (%) Underweight Normal weight Overweight Obesity class I Obesity class II Obesity class III | 1 (0.4%) 66 (25.7%) 119 (46.3%) 52 (20.2%) 17 (6.6%) 2 (0.8%) |
| Hypertension, N (%) | 116 (45.1%) |
| Dyslipidemia, N (%) | 35 (13.6%) |
| Diabetes mellitus, N (%) | 45 (17.5%) |
| Family history for neoplasia, N (%) | 38 (14.8%) |
| PSA, median (IQR) (ng/mL) | 12.8 (29.4) |
| Gleason Score, median (IQR) | 7 (1) |
| Grade Group, N (%) I II III IV V Missing | 41 (16%) 53 (20.6%) 47 (18.3%) 40 (15.6%) 44 (17.1%) 32 (12.5%) |
| Metastases at diagnosis, N (%) | 59 (23%) |
| 10-year all-cause mortality, % | 14.9% |
| Parameter | Patients with Obesity N = 71 (27.6%) | Patients without Obesity N = 186 (72.4%) | p |
|---|---|---|---|
| Age, mean ± SD (years) | 65.25 ± 6.96 | 67.82 ± 8.34 | 0.022 |
| PSA, median (IQR) (ng/mL) | 10.13 (22.71) | 14.75 (34.73) | 0.016 |
| Gleason Score, median (IQR) | 7 (1) | 7 (1) | 0.236 |
| Grade group, N (%) | 0.446 | ||
| I–III | 37 (52.1%) | 104 (55.9%) | |
| IV–V | 26 (36.6%) | 58 (31.2%) | |
| Missing | 8 (11.3%) | 24 (12.9%) | |
| Metastases at diagnosis, N (%) | 12 (16.9) | 47 (25.3) | 0.154 |
| Parameter | M1 N = 59 (23%) | M0 N = 198 (77%) | p |
|---|---|---|---|
| Age, mean ± SD (years) | 67.64 ± 7.98 | 66.94 ± 8.08 | 0.559 |
| 10-year all-cause mortality (%) | 37.5% | 8.3% | <0.001 |
| PSA, median (IQR) (ng/mL) | 52.09 (119) | 11 (16.95) | <0.001 |
| Gleason Score, median (IQR) | 8 (2) | 7 (1) | 0.002 |
| Grade group, N (%) I–III IV–V Missing | 20 (33.9%) 29 (49.2%) 10 (16.9%) | 121 (61.1%) 55 (27.8%) 22 (11.1%) | <0.001 * |
| Weight, median (IQR) (kg) | 76 (16) | 83.5 (21) | 0.001 |
| BMI, median (IQR) (kg/m2) | 26.3 (5.54) | 27.14 (5.98) | 0.033 |
| Obesity, N (%) | 12 (20.3) | 59 (29.8) | 0.154 |
| Parameter | Biochemical Recurrence N = 17 (51.5%) | Biochemical Remission N = 16 (48.5%) | p |
|---|---|---|---|
| Age at diagnosis, mean ± SD (years) | 64.31 ± 6.51 | 62.31 ± 5.61 | 0.359 |
| Deceased, N (%) | 1 (5.9) | 1 (6.2) | 0.965 |
| PSA at diagnosis, median (IQR) (ng/mL) | 11 (10.83) | 8.21 (5.36) | 0.081 |
| Gleason Score, median (IQR) | 7 (2) | 7 (1) | 0.526 |
| Grade group, N (%) I–III IV–V Missing | 11 (64.7%) 6 (35.3%) - | 11 (68.8%) 4 (25%) 1 (6.2%) | 0.599 |
| Weight at diagnosis, median (IQR) (kg) | 84 (19) | 80 (20) | 0.465 |
| BMI at diagnosis, median (IQR) (kg/m2) | 28.39 (4.94) | 25.22 (5.92) | 0.127 |
| Obesity, N (%) | 7 (41.2) | 3 (18.8) | 0.161 |
| Time to recurrence, median (IQR) (months) | 27.5 (48) | - | - |
| Parameter | CRPC N = 38 (42.7%) | CSPC N = 51 (57.3%) | p |
|---|---|---|---|
| Age at diagnosis, mean ± SD (years) | 66.45 ± 7 | 67.45 ± 6.83 | 0.499 |
| 10-year all-cause mortality rate (%) | 37.1% | 4.3% | <0.001 |
| PSA at diagnosis, median (IQR) (ng/mL) | 63.53 (132.8) | 14.9 (26.4) | 0.001 |
| Gleason Score, median (IQR) | 8 (2) | 7 (1) | 0.006 |
| Grade group, N (%) I–III IV–V Missing | 10 (26.3%) 21 (55.3%) 7 (18.4%) | 33 (64.7%) 14 (27.5%) 4 (7.8%) | 0.001 |
| Weight at diagnosis, median (IQR) (kg) | 80 (17) | 84 (19) | 0.243 |
| BMI at diagnosis, median (IQR) (kg/m2) | 26.64 (4.28) | 27.31 (6.3) | 0.709 |
| Obesity, N (%) | 7 (18.4) | 18 (35.3) | 0.080 |
| Time to resistance, median (IQR) (months) | 14.5 (14) | - | - |
Disclaimer/Publisher’s Note: The statements, opinions and data contained in all publications are solely those of the individual author(s) and contributor(s) and not of MDPI and/or the editor(s). MDPI and/or the editor(s) disclaim responsibility for any injury to people or property resulting from any ideas, methods, instructions or products referred to in the content. |
© 2025 by the authors. Licensee MDPI, Basel, Switzerland. This article is an open access article distributed under the terms and conditions of the Creative Commons Attribution (CC BY) license (https://creativecommons.org/licenses/by/4.0/).
Share and Cite
Mustață, T.; Jinga, D.C.; Lazăr, I.; Martin, S.C.; Sîrbu, A.E.; Fica, S. The Impact of Obesity on Prostate Cancer and Progression to Castration Resistance—Real-World Data from a Romanian Center. J. Clin. Med. 2025, 14, 3146. https://doi.org/10.3390/jcm14093146
Mustață T, Jinga DC, Lazăr I, Martin SC, Sîrbu AE, Fica S. The Impact of Obesity on Prostate Cancer and Progression to Castration Resistance—Real-World Data from a Romanian Center. Journal of Clinical Medicine. 2025; 14(9):3146. https://doi.org/10.3390/jcm14093146
Chicago/Turabian StyleMustață, Theodor, Dan Corneliu Jinga, Ioana Lazăr, Sorina Carmen Martin, Anca Elena Sîrbu, and Simona Fica. 2025. "The Impact of Obesity on Prostate Cancer and Progression to Castration Resistance—Real-World Data from a Romanian Center" Journal of Clinical Medicine 14, no. 9: 3146. https://doi.org/10.3390/jcm14093146
APA StyleMustață, T., Jinga, D. C., Lazăr, I., Martin, S. C., Sîrbu, A. E., & Fica, S. (2025). The Impact of Obesity on Prostate Cancer and Progression to Castration Resistance—Real-World Data from a Romanian Center. Journal of Clinical Medicine, 14(9), 3146. https://doi.org/10.3390/jcm14093146