

The Role of Positron Emission Tomography Imaging in Primary Bone Tumours: A Narrative Review


Abstract
1. Introduction
2. Brief History of PET Imaging
3. Basic Science Behind PET Imaging
4. Application to Primary Bone Tumours
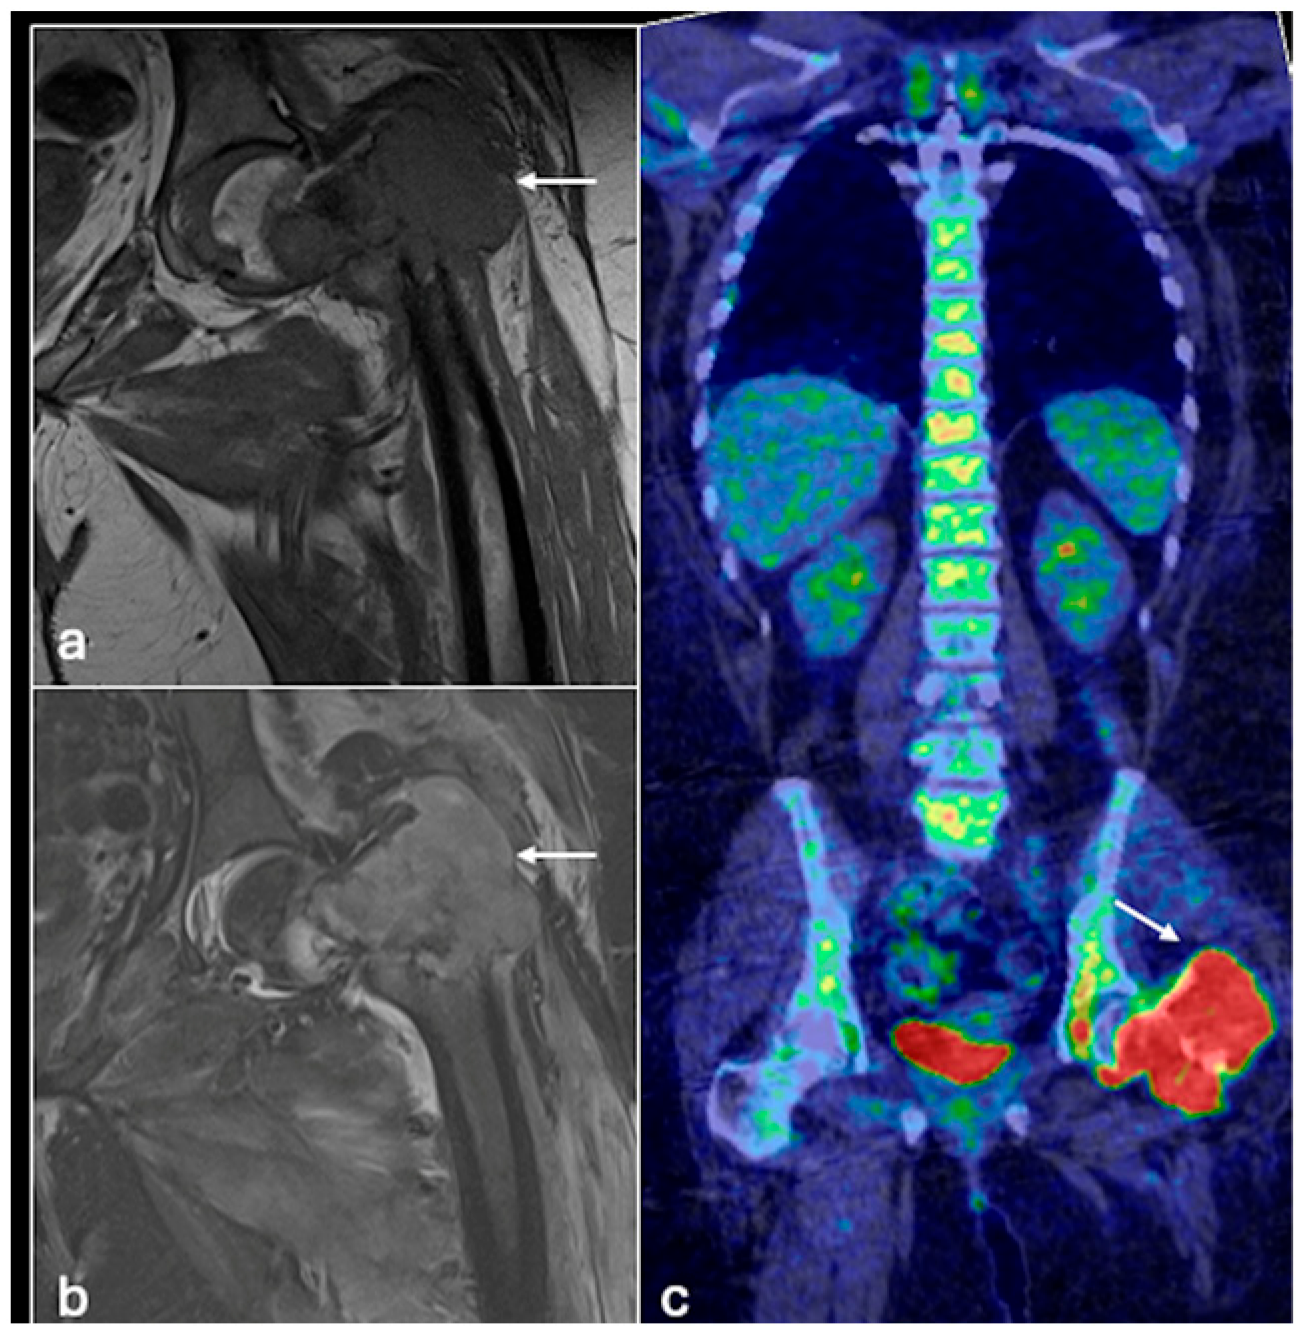
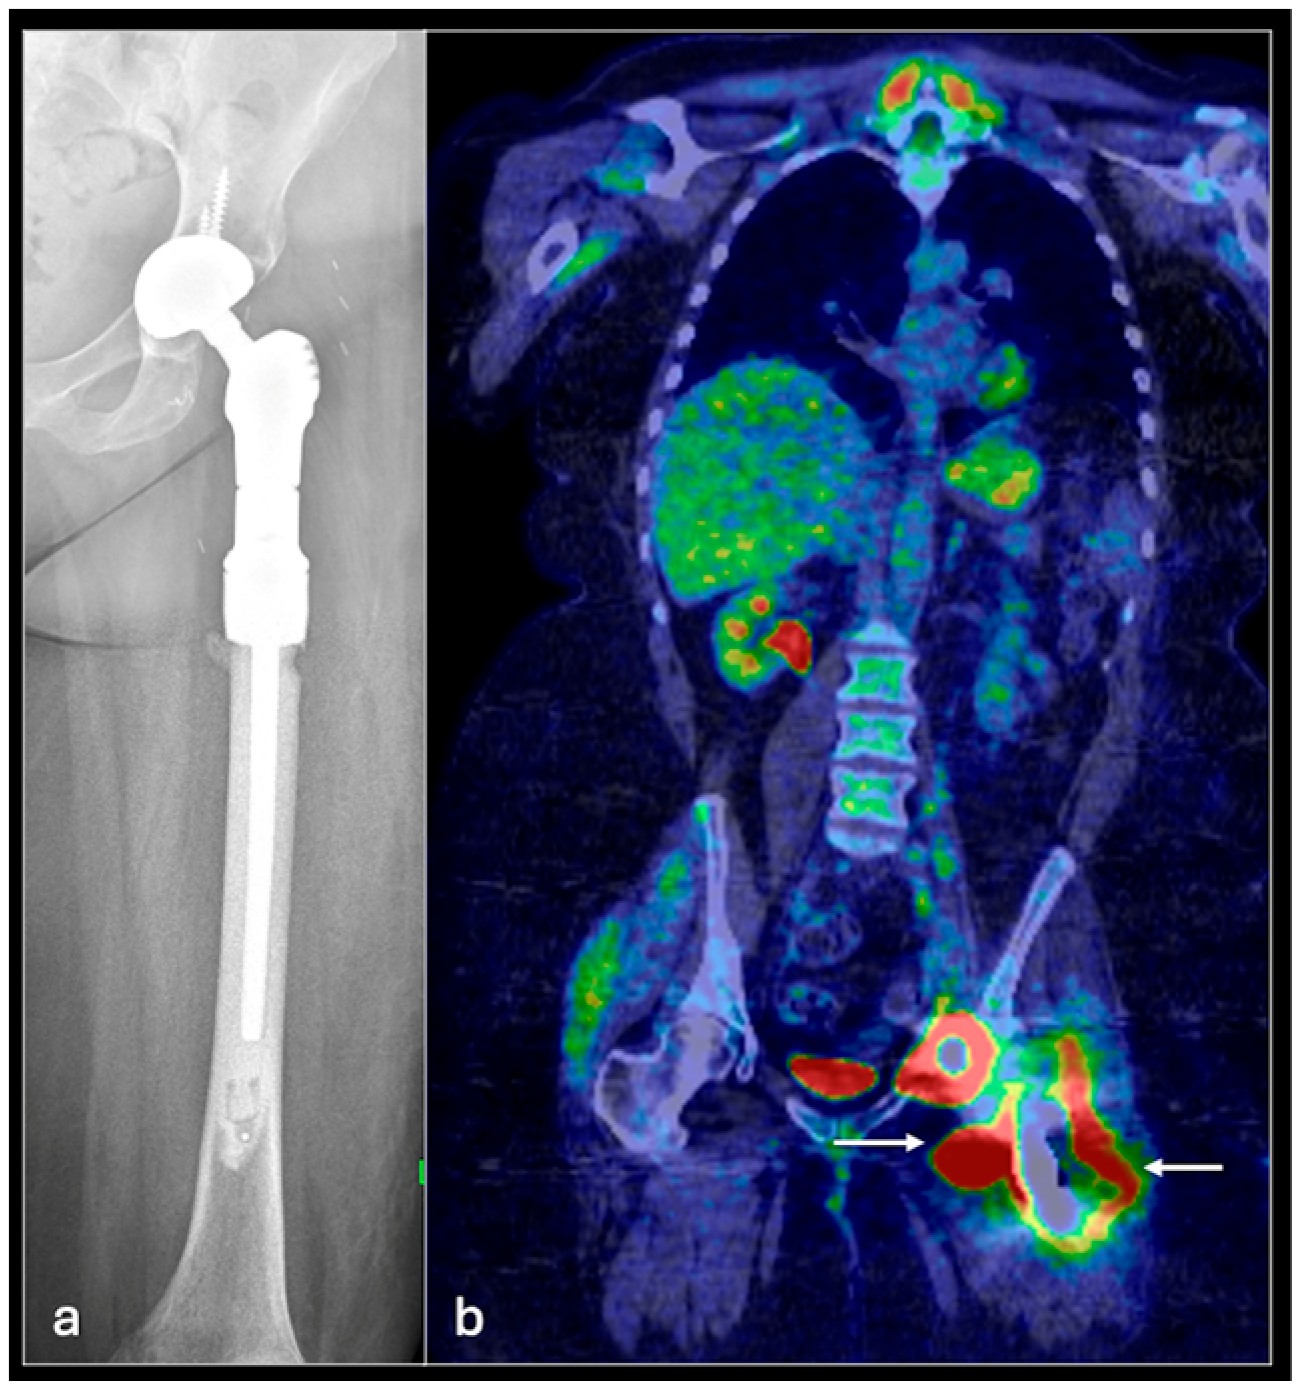
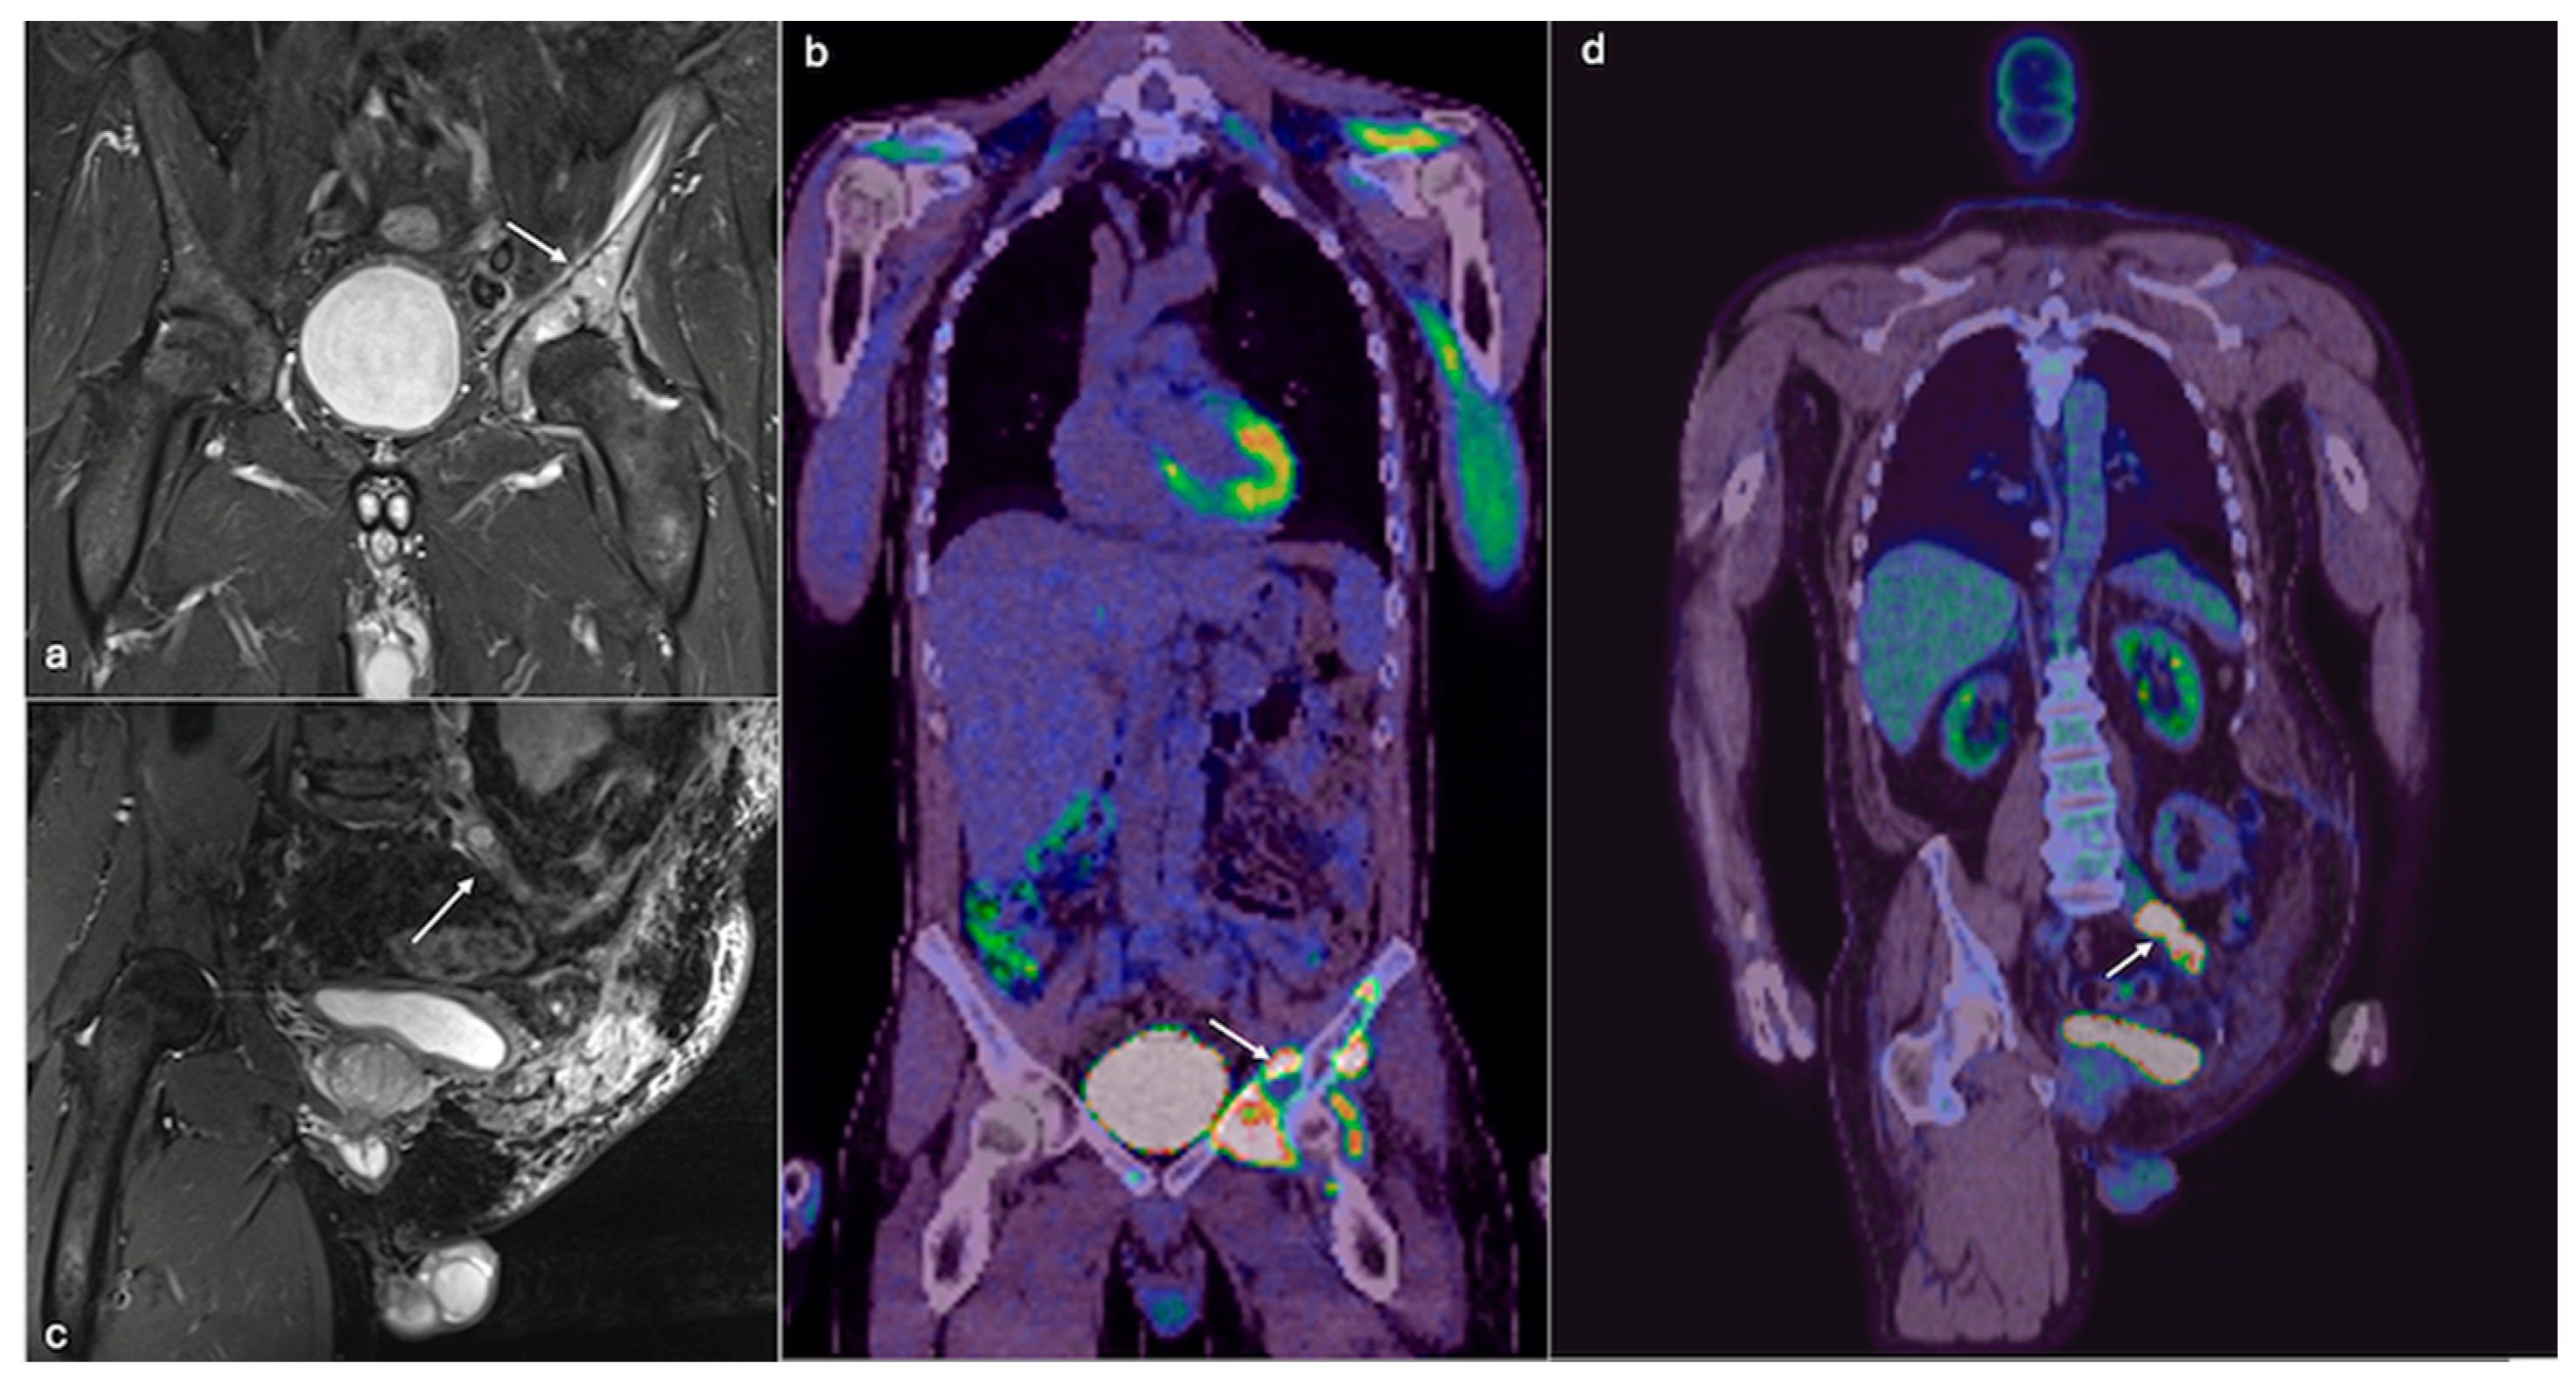
4.1. Osteosarcoma
4.2. Chondrosarcoma
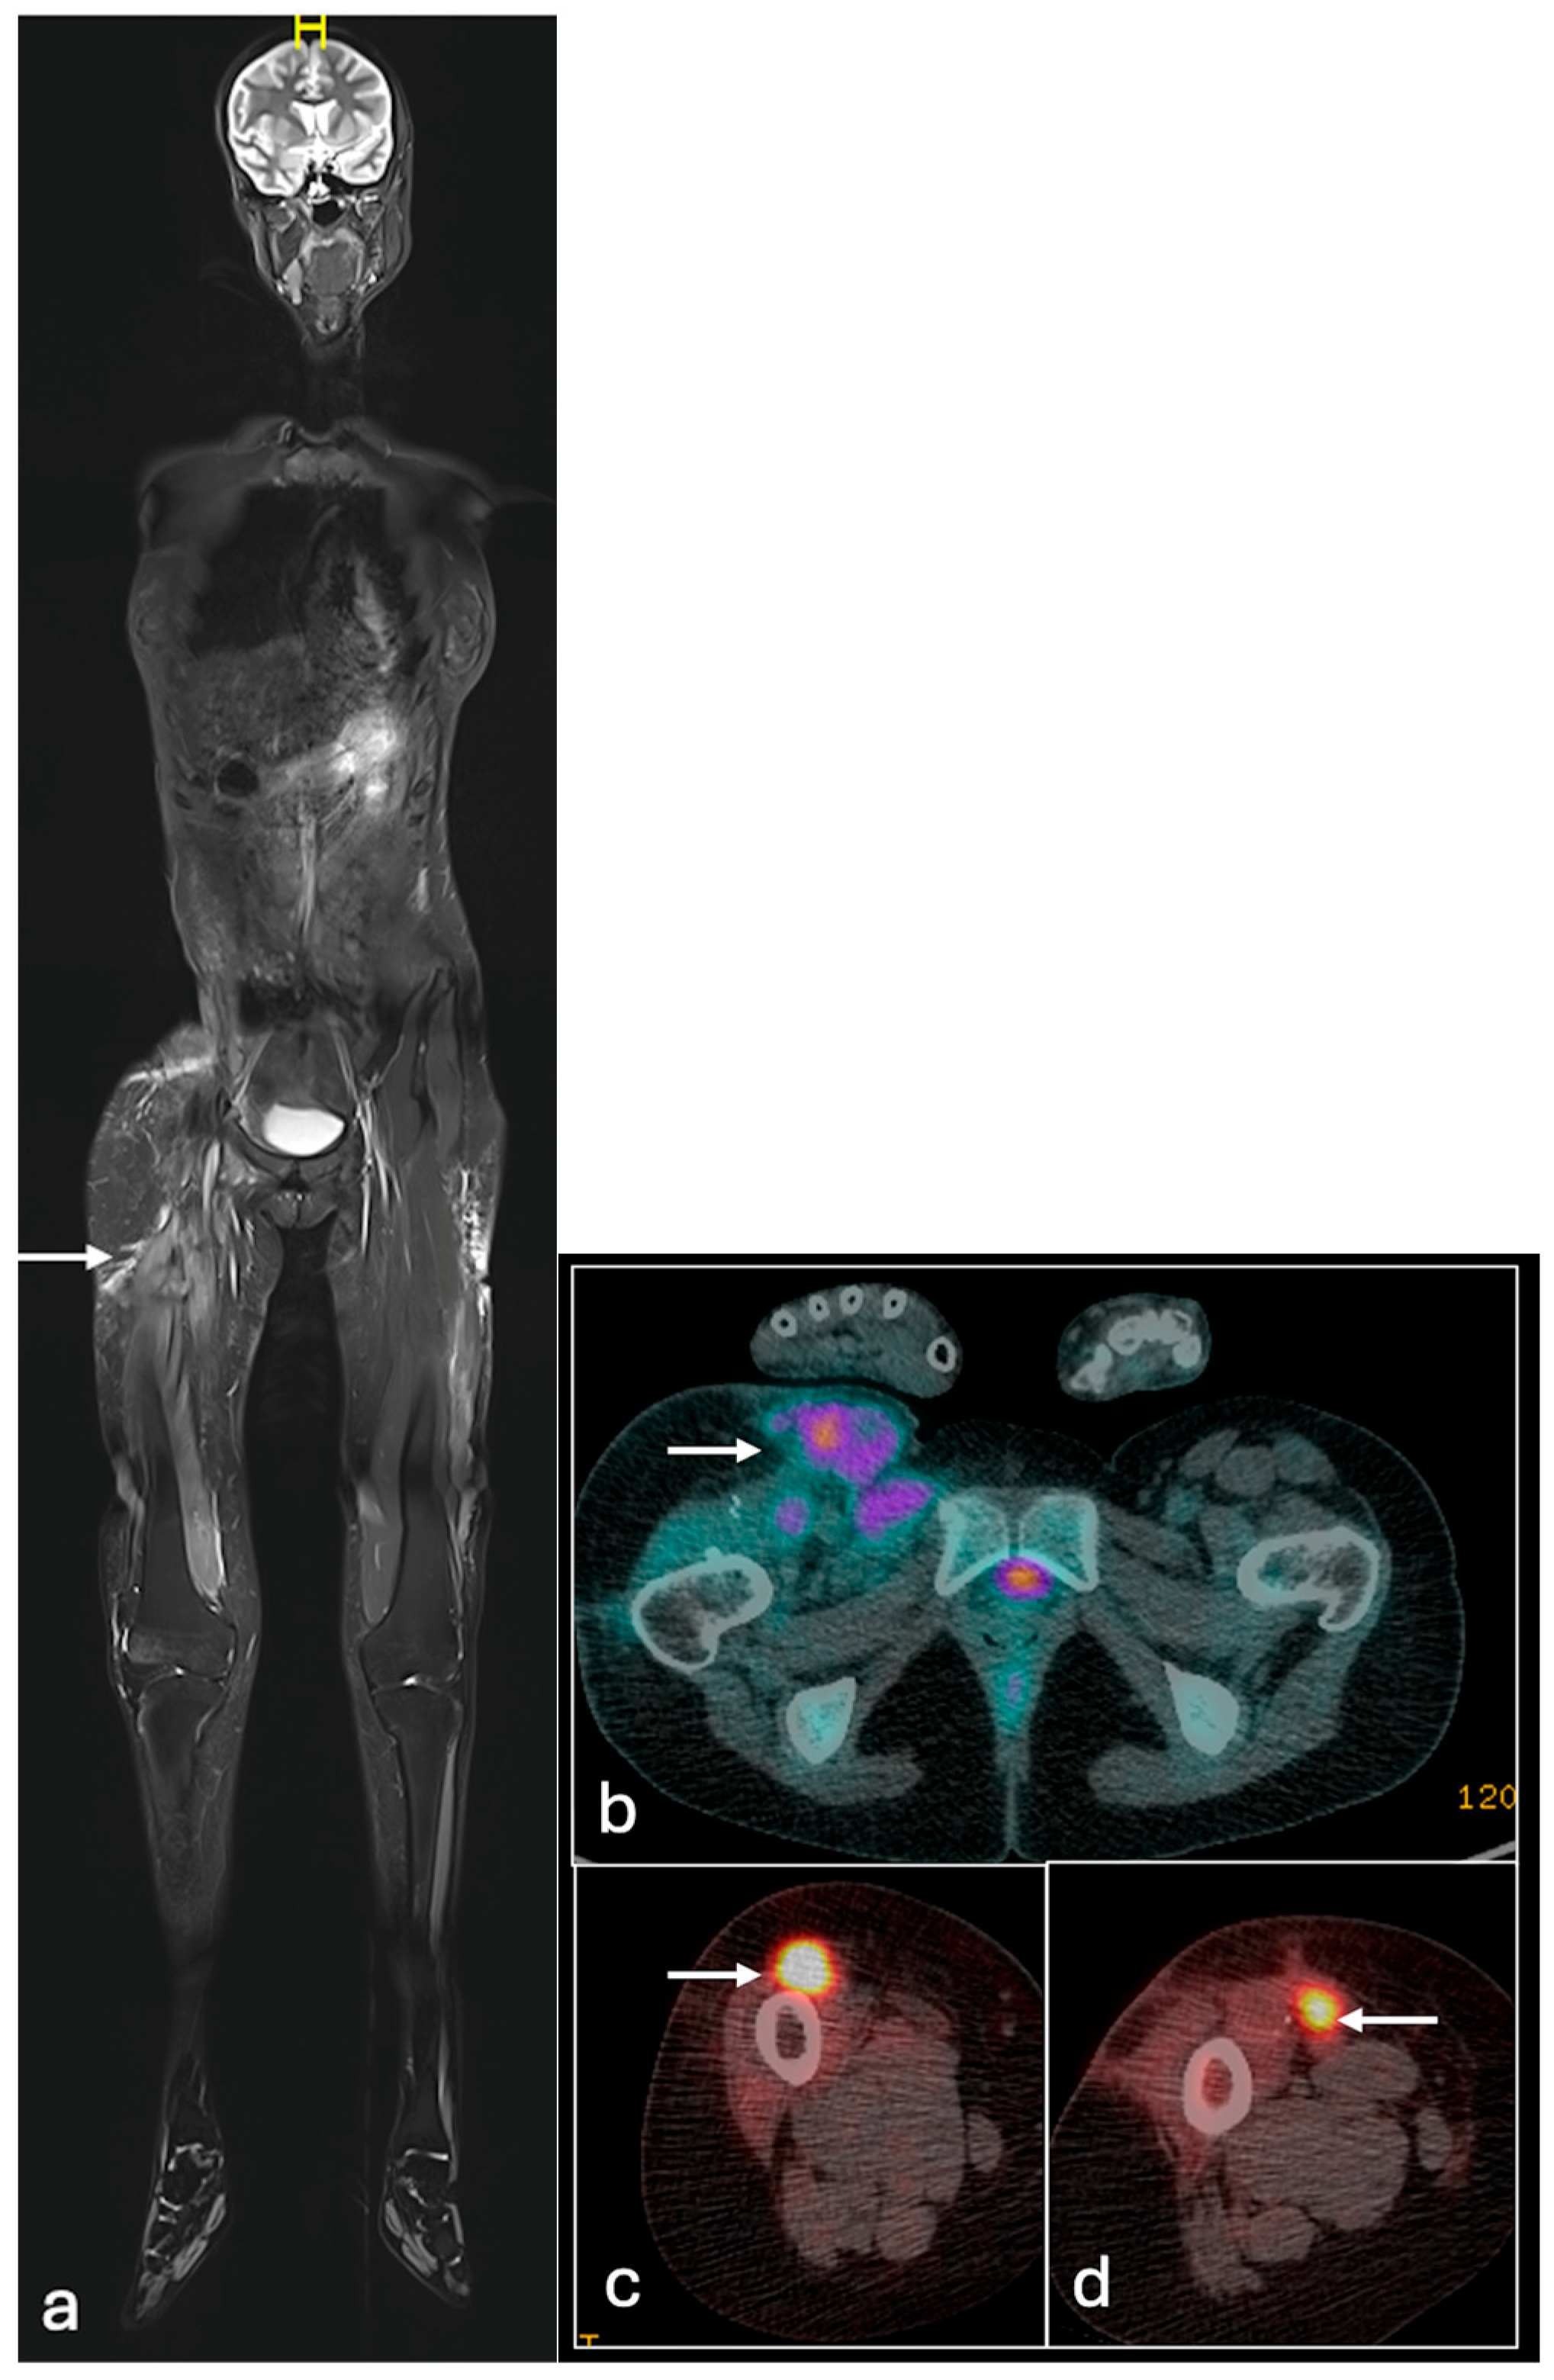
4.3. Ewing Sarcoma
5. Limitations and Future Research Directions
Author Contributions
Funding
Conflicts of Interest
Abbreviations
| STIR | Short tau Inversion Recovery |
| T2FS | T2 fat suppressed |
| EPR | Endoprosthetic replacement |
| FDG | Fluorodeoxyglucose |
| CT | Computed tomography |
| MRI | magnetic resonance imaging |
| PET | Positron emission tomography |
| SUV | Standard Uptake Value |
| MTV | Metabolic tumour volume |
| TLG | Total lesion glycolysis |
| ES | Ewing sarcoma |
| AUC | Area under the curve |
| CI | Confidence Interval |
| DMSA | Dimercaptosuccinic Acid |
| MDP | Methyl Diphosphonate |
| SUVmax | SUV maximum |
References
- Edeiken, J.; Karasick, D. Imaging in bone cancer. CA Cancer J. Clin. 1987, 37, 239–245. [Google Scholar] [CrossRef] [PubMed]
- Gatta, G.; Capocaccia, R.; Botta, L.; Mallone, S.; De Angelis, R.; Ardanaz, E.; Comber, H.; Dimitrova, N.; Leinonen, M.K.; Siesling, S.; et al. Burden and centralised treatment in Europe of rare tumours: Results of RARECAREnet—A population-based study. Lancet Oncol. 2017, 18, 1022–1039. [Google Scholar] [CrossRef] [PubMed]
- Gerrand, C.; Athanasou, N.; Brennan, B.; Grimer, R.; Judson, I.; Morland, B.; Peake, D.; Seddon, B.; Whelan, J. UK guidelines for the management of bone sarcomas. Clin. Sarcoma Res. 2016, 6, 7. [Google Scholar] [CrossRef]
- Liu, Y. The role of 18F-FDG PET/CT in staging and restaging primary bone lymphoma. Nucl. Med. Commun. 2017, 38, 319–324. [Google Scholar] [CrossRef] [PubMed]
- Torres Espallardo, I. PET/CT: Underlying physics, instrumentation, and advances. Radiología 2017, 59, 431–445. [Google Scholar] [CrossRef] [PubMed]
- Votaw, J.R. The AAPM/RSNA physics tutorial for residents. Physics of PET. Radiographics 1995, 15, 1179–1190. [Google Scholar] [CrossRef] [PubMed]
- Brenner, W.; Bohuslavizki, K.H.; Eary, J.F. PET imaging of osteosarcoma. J. Nucl. Med. 2003, 44, 930–942. [Google Scholar] [PubMed]
- Oh, C.; Bishop, M.W.; Cho, S.Y.; Im, H.J.; Shulkin, B.L. 18F-FDG PET/CT in the Management of Osteosarcoma. J. Nucl. Med. 2023, 64, 842–851. [Google Scholar] [CrossRef] [PubMed]
- London, K.; Stege, C.; Cross, S.; Onikul, E.; Graf, N.; Kaspers, G.; Dalla-Pozza, L.; Howman-Giles, R. 18F-FDG PET/CT compared to conventional imaging modalities in pediatric primary bone tumors. Pediatr. Radiol. 2012, 42, 418–430. [Google Scholar] [CrossRef]
- Strobel, K.; Exner, U.E.; Stumpe, K.D.; Hany, T.F.; Bode, B.; Mende, K.; Veit-Haibach, P.; von Schulthess, G.K.; Hodler, J. The additional value of CT images interpretation in the differential diagnosis of benign vs. malignant primary bone lesions with 18F-FDG-PET/CT. Eur. J. Nucl. Med. Mol. Imaging 2008, 35, 2000–2008. [Google Scholar] [CrossRef] [PubMed]
- Hassan, M.S.; Ariyaratne, S.; Azzopardi, C.; Iyengar, K.P.; Davies, A.M.; Botchu, R. The clinical significance of indeterminate pulmonary nodules in patients with primary bone sarcoma: A systematic review. Br. J. Radiol. 2024, 97, 747–756. [Google Scholar] [CrossRef] [PubMed]
- Tsoi, K.M.; Lowe, M.; Tsuda, Y.; Lex, J.R.; Fujiwara, T.; Almeer, G.; Gregory, J.; Stevenson, J.; Evans, S.E.; Botchu, R.; et al. How Are Indeterminate Pulmonary Nodules at Diagnosis Associated with Survival in Patients with High-Grade Osteosarcoma? Clin. Orthop. Relat. Res. 2021, 479, 298–308. [Google Scholar] [CrossRef] [PubMed]
- Liu, F.; Zhang, Q.; Zhou, D.; Dong, J. Effectiveness of 18F-FDG PET/CT in the diagnosis and staging of osteosarcoma: A meta-analysis of 26 studies. BMC Cancer 2019, 19, 323. [Google Scholar] [CrossRef] [PubMed]
- Plaza de Las Heras, I.; García Cañamaque, L.; Quílez Caballero, E.; Camacho-Arias, M.; Cárdenas Soriano, M.D.P.; Martel Villagrán, J. Positron emission tomography-magnetic resonance imaging applications in pediatric musculoskeletal tumors. Quant. Imaging Med. Surg. 2024, 14, 7825–7838. [Google Scholar] [CrossRef] [PubMed] [PubMed Central]
- Lim, H.J.; Johnny Ong, C.A.; Tan, J.W.; Ching Teo, M.C. Utility of positron emission tomography/computed tomography (PET/CT) imaging in the evaluation of sarcomas: A systematic review. Crit. Rev. Oncol./Hematol. 2019, 143, 1–13. [Google Scholar] [CrossRef] [PubMed]
- Yadgarov, M.Y.; Berikashvili, L.B.; Rakova, E.S.; Konopleva, E.I.; Karachunskiy, A.I.; Likar, Y.N. Prognostic significance of [18F]FDG PET metabolic parameters in osteosarcoma and Ewing’s sarcoma: A systematic review and network meta-analysis. Clin. Transl. Imaging 2024, 12, 703–715. [Google Scholar] [CrossRef]
- Li, H.; Zhao, H.; Wang, B.; Wang, X.; Wang, Z.; Zheng, S.; He, A.; Sun, Y.; Min, D.; Shen, Z.; et al. 18F-FDG positron emission tomography for the assessment of histological response to neoadjuvant chemotherapy in osteosarcomas: A meta-analysis. Surg. Oncol. 2012, 21, e165–e170. [Google Scholar] [CrossRef] [PubMed]
- Im, H.J.; Kim, T.S.; Park, S.Y.; Min, H.S.; Kim, J.H.; Kang, H.G.; Park, S.E.; Kwon, M.M.; Yoon, J.H.; Park, H.J.; et al. Prediction of tumour necrosis fractions using metabolic and volumetric 18F-FDG PET/CT indices, after one course and at the completion of neoadjuvant chemotherapy, in children and young adults with osteosarcoma. Eur. J. Nucl. Med. Mol. Imaging 2012, 39, 39–49. [Google Scholar] [CrossRef]
- Kattepur, A.K.; Jones, R.L.; Gulia, A. Dedifferentiated chondrosarcoma: Current standards of care. Future Oncol. 2021, 17, 4983–4991. [Google Scholar] [CrossRef] [PubMed]
- Laitinen, M.K.; Stevenson, J.D.; Parry, M.C.; Sumathi, V.; Grimer, R.J.; Jeys, L.M. The role of grade in local recurrence and the disease-specific survival in chondrosarcomas. Bone Jt. J. 2018, 100-B, 662–666. [Google Scholar] [CrossRef]
- Jo, I.; Gould, D.; Schlicht, S.; Taubman, K.; Choong, P. Diagnostic accuracy of functional imaging modalities for chondrosarcoma: A systematic review and meta-analysis. J. Bone Oncol. 2019, 19, 100262. [Google Scholar] [CrossRef] [PubMed] [PubMed Central]
- Zhang, Q.; Xi, Y.; Li, D.; Yuan, Z.; Dong, J. The utility of 18F-FDG PET and PET/CT in the diagnosis and staging of chondrosarcoma: A meta-analysis. J. Orthop. Surg. Res. 2020, 15, 229. [Google Scholar] [CrossRef] [PubMed] [PubMed Central]
- McLoughlin, E.; Davies, A.M.; Iqbal, A.; James, S.L.; Botchu, R. The diagnostic significance of pulmonary nodules on CT thorax in chondrosarcoma of bone. Clin. Radiol. 2020, 75, 395.e7–395.e16. [Google Scholar] [CrossRef] [PubMed]
- Zöllner, S.K.; Amatruda, J.F.; Bauer, S.; Collaud, S.; de Álava, E.; DuBois, S.G.; Hardes, J.; Hartmann, W.; Kovar, H.; Metzler, M.; et al. Ewing Sarcoma-Diagnosis, Treatment, Clinical Challenges and Future Perspectives. J. Clin. Med. 2021, 10, 1685. [Google Scholar] [CrossRef] [PubMed] [PubMed Central]
- Wan, Z.H.; Huang, Z.H.; Chen, L.B. Survival outcome among patients with Ewing’s sarcoma of bones and joints: A population-based cohort study. Sao Paulo Med. J. 2017, 136, 116–122. [Google Scholar] [CrossRef] [PubMed] [PubMed Central]
- Bosma, S.E.; Ayu, O.; Fiocco, M.; Gelderblom, H.; Dijkstra, P.D.S. Prognostic factors for survival in Ewing sarcoma: A systematic review. Surg. Oncol. 2018, 27, 603–610. [Google Scholar] [CrossRef] [PubMed]
- Jehanno, N.; Corradini, N.; Gaspar, N.; Brahmi, M.; Valentin, T.; Rivière, C.R.; Lervat, C.; Probert, J.; Entz-Werle, N.; Mansuy, L.; et al. Role of 18F-FDG-PET/CT in the initial staging of very high-risk Ewing Sarcoma in a prospective multicentric Phase II Study: Is there still a place for bone marrow sampling? Br. J. Cancer 2024, 131, 1605–1612. [Google Scholar] [CrossRef]
- Huang, T.; Li, F.; Yan, Z.; Ma, Y.; Xiong, F.; Cai, X.; Zhang, Q.; Liu, F.; Dong, J. Effectiveness of 18F-FDG PET/CT in the diagnosis, staging and recurrence monitoring of Ewing sarcoma family of tumors: A meta-analysis of 23 studies. Medicine 2018, 97, e13457. [Google Scholar] [CrossRef] [PubMed] [PubMed Central]
- Quartuccio, N.; Fox, J.; Kuk, D.; Wexler, L.H.; Baldari, S.; Cistaro, A.; Schöder, H. Pediatric bone sarcoma: Diagnostic performance of ¹⁸F-FDG PET/CT versus conventional imaging for initial staging and follow-up. AJR Am. J. Roentgenol. 2015, 204, 153–160. [Google Scholar] [CrossRef] [PubMed]
- Tsoi, K.M.; Tan, D.; Stevenson, J.; Evans, S.; Jeys, L.M.; Botchu, R. Indeterminate pulmonary nodules are not associated with worse overall survival in Ewing Sarcoma. J. Clin. Orthop. Trauma 2021, 16, 58–64. [Google Scholar] [CrossRef]
- Aryal, A.; Kumar, V.S.; Shamim, S.A.; Gamanagatti, S.; Khan, S.A. What Is the Comparative Ability of 18F-FDG PET/CT, 99mTc-MDP Skeletal Scintigraphy, and Whole-body MRI as a Staging Investigation to Detect Skeletal Metastases in Patients with Osteosarcoma and Ewing Sarcoma? Clin. Orthop. Relat. Res. 2021, 479, 1768–1779. [Google Scholar] [CrossRef] [PubMed]
- Smets, A.M.; Deurloo, E.E.; Slager, T.J.E.; Stoker, J.; Bipat, S. Whole-body magnetic resonance imaging for detection of skeletal metastases in children and young people with primary solid tumors—Systematic review. Pediatr. Radiol. 2018, 48, 241–252. [Google Scholar] [CrossRef] [PubMed]
- Mori, Y.; Novruzov, E.; Schmitt, D.; Cardinale, J.; Watabe, T.; Choyke, P.L.; Alavi, A.; Uwe Haberkorn, U.; Giesel, F.L. Clinical applications of fibroblast activation protein inhibitor positron emission tomography (FAPI-PET). npj Imaging 2024, 2, 48. [Google Scholar] [CrossRef]
- Anupindi, S.A.; Bedoya, M.A.; Lindell, R.B.; Rambhatla, S.J.; Zelley, K.; Nichols, K.E.; Chauvin, N.A. Diagnostic Performance of Whole-Body MRI as a Tool for Cancer Screening in Children with Genetic Cancer-Predisposing Conditions. AJR Am. J. Roentgenol. 2015, 205, 400–408. [Google Scholar] [CrossRef]
- Costelloe, C.M.; Chuang, H.H.; Madewell, J.E. FDG PET/CT of primary bone tumors. AJR Am. J. Roentgenol. 2014, 202, W521–W531. [Google Scholar] [CrossRef] [PubMed]
- Koerber, S.A.; Finck, R.; Dendl, K.; Uhl, M.; Lindner, T.; Kratochwil, C.; Röhrich, M.; Rathke, H.; Ungerechts, G.; Adeberg, S.; et al. Novel FAP ligands enable improved imaging contrast in sarcoma patients due to FAPI-PET/CT. Eur. J. Nucl. Med. Mol. Imaging 2021, 48, 3918–3924. [Google Scholar] [CrossRef]
- Kessler, L.; Ferdinandus, J.; Hirmas, N.; Bauer, S.; Dirksen, U.; Zarrad, F.; Nader, M.; Chodyla, M.; Milosevic, A.; Umutlu, L.; et al. 68Ga-FAPI as a Diagnostic Tool in Sarcoma: Data from the 68Ga-FAPI PET Prospective Observational Trial. J. Nucl. Med. 2022, 63, 89–95. [Google Scholar] [CrossRef]


| Osteosarcoma | Ewing’s Sarcoma | Chondrosarcoma | |
|---|---|---|---|
| BONE SCINITGRAPHY | |||
| Sensitivity | 67% [31] | 50% [31] | 100% [33] |
| Specificity | 78% [31] | 95% [31] | 94.7% [33] |
| Positive predictive value | 50% [31] | 80% [31] | 45.5% [33] |
| Negative predictive value | 88% [31] | 84% [31] | 100% [33] |
| PET-CT | |||
| Sensitivity | 100% [31] | 88% [31] | 100% [33] |
| Specificity | 100% [31] | 100% [31] | 88.5% [33] |
| Positive predictive value | 100% [31] | 100% [31] | 50% [33] |
| Negative predictive value | 100% [31] | 96% [31] | 100% [33] |
| WHOLE-BODY MRI | |||
| Sensitivity | 83% [31] | 88% [31] | 100% * |
| Specificity | 94% [31] | 95% [31] | 94% * |
| Positive predictive value | 83% [31] | 88% [31] | 25% * |
| Negative predictive value | 94% [31] | 95% [31] | 100% * |
Disclaimer/Publisher’s Note: The statements, opinions and data contained in all publications are solely those of the individual author(s) and contributor(s) and not of MDPI and/or the editor(s). MDPI and/or the editor(s) disclaim responsibility for any injury to people or property resulting from any ideas, methods, instructions or products referred to in the content. |
© 2025 by the authors. Licensee MDPI, Basel, Switzerland. This article is an open access article distributed under the terms and conditions of the Creative Commons Attribution (CC BY) license (https://creativecommons.org/licenses/by/4.0/).
Share and Cite
Hassan, S.; Suvarna, R.; Uldin, H.; Hussein, M.; Botchu, R. The Role of Positron Emission Tomography Imaging in Primary Bone Tumours: A Narrative Review. J. Clin. Med. 2025, 14, 2624. https://doi.org/10.3390/jcm14082624
Hassan S, Suvarna R, Uldin H, Hussein M, Botchu R. The Role of Positron Emission Tomography Imaging in Primary Bone Tumours: A Narrative Review. Journal of Clinical Medicine. 2025; 14(8):2624. https://doi.org/10.3390/jcm14082624
Chicago/Turabian StyleHassan, Shihabul, Rishabh Suvarna, Hasaam Uldin, Mohsin Hussein, and Rajesh Botchu. 2025. "The Role of Positron Emission Tomography Imaging in Primary Bone Tumours: A Narrative Review" Journal of Clinical Medicine 14, no. 8: 2624. https://doi.org/10.3390/jcm14082624
APA StyleHassan, S., Suvarna, R., Uldin, H., Hussein, M., & Botchu, R. (2025). The Role of Positron Emission Tomography Imaging in Primary Bone Tumours: A Narrative Review. Journal of Clinical Medicine, 14(8), 2624. https://doi.org/10.3390/jcm14082624