
Epigenetic Age in Prader–Willi Syndrome and Essential Obesity: A Comparison with Chronological and Vascular Ages
 ,
,  , , , and
Abstract
1. Introduction
2. Materials and Methods
2.1. Study Design and Subjects
2.2. Anthropometric Measurements
2.3. Metabolic Variables
2.4. Blood Pressure
2.5. Calculation of Framingham Risk Score and Vascular Age
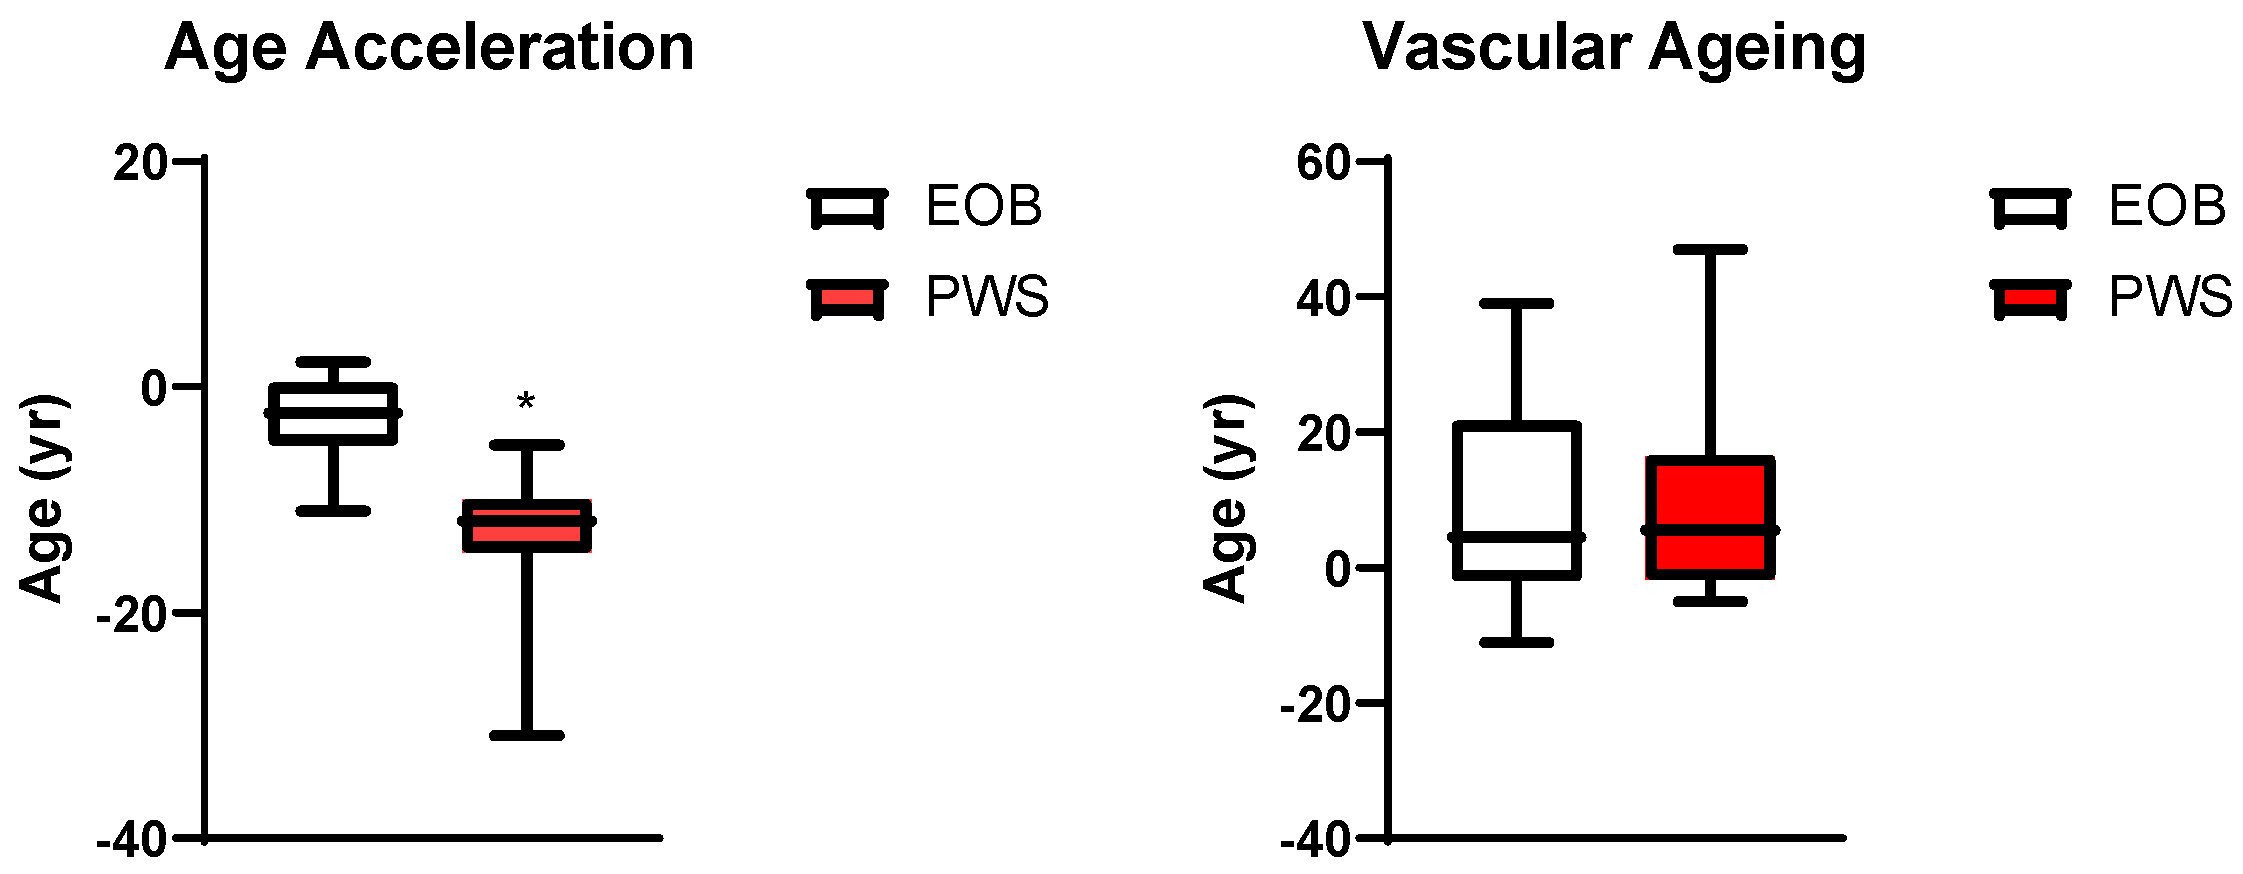
2.6. Determination of the Age Acceleration
- −
- 3.268477847518173.26847784751817 is the Intercept of the model, representing baseline epigenetic age;
- −
- 0.4654455490106530.465445549010653 is the coefficient for methylation level at C7-ELOVL2C7-ELOVL2, derived from regression analysis [18].
2.7. Statistical Analysis
3. Results
4. Discussion
5. Conclusions
Author Contributions
Funding
Institutional Review Board Statement
Informed Consent Statement
Data Availability Statement
Acknowledgments
Conflicts of Interest
Abbreviations
| BMI | body mass index; |
| bpm | beats per minute; |
| DBP | diastolic blood pressure; |
| DNAm | DNA methylation; |
| F | female; |
| FSR | Framingham score risk; |
| HDL-C | high-density lipoprotein cholesterol; |
| HOMA-IR | homeostatic model assessment for insulin resistance; |
| HR | heart rate; |
| hsCRP | high sensitivity C reactive protein; |
| IGF-1 | insulin-like growth factor 1; |
| LDL-C | low-density lipoprotein cholesterol; |
| M | male; |
| ns | not significant |
| PWS | Prader–Willi syndrome; |
| SBP | systolic blood pressure; |
| T-C | total cholesterol; |
| TG | triglycerides; |
| VA | vascular age; |
| WC | waist circumference; |
| yr | year. |
References
- Butler, M.G.; Miller, J.L.; Forster, J.L. Prader-Willi Syndrome—Clinical Genetics, Diagnosis and Treatment Approaches: An Update. Curr. Pediatr. Rev. 2019, 15, 207–244. [Google Scholar] [CrossRef] [PubMed]
- Angulo, M.A.; Butler, M.G.; Cataletto, M.E. Prader-Willi syndrome: A review of clinical, genetic, and endocrine findings. J. Endocrinol. Investig. 2015, 38, 1249–1263. [Google Scholar] [CrossRef] [PubMed]
- Bittel, D.C.; Butler, M.G. Prader-Willi syndrome: Clinical genetics, cytogenetics and molecular biology. Expert Rev. Mol. Med. 2005, 7, 1–20. [Google Scholar] [CrossRef]
- Butler, M.G. Prader-Willi Syndrome and Chromosome 15q11.2 BP1-BP2 Region: A Review. Int. J. Mol. Sci. 2023, 24, 4271. [Google Scholar] [CrossRef] [PubMed]
- Mian-Ling, Z.; Yun-Qi, C.; Chao-Chun, Z. Prader-Willi Syndrome: Molecular Mechanism and Epigenetic Therapy. Curr. Gene Ther. 2020, 20, 36–43. [Google Scholar] [CrossRef] [PubMed]
- Cavaillé, J. Box C/D small nucleolar RNA genes and the Prader-Willi syndrome: A complex interplay. Wiley Interdiscip. Rev. RNA 2017, 8, e1417. [Google Scholar] [CrossRef]
- Tauber, M.; Diene, G. Prader-Willi syndrome: Hormone therapies. Handb. Clin. Neurol. 2021, 181, 351–367. [Google Scholar] [PubMed]
- Tauber, M.; Hoybye, C. Endocrine disorders in Prader-Willi syndrome: A model to understand and treat hypothalamic dysfunction. Lancet Diabetes Endocrinol. 2021, 9, 235–246. [Google Scholar] [CrossRef] [PubMed]
- Laurier, V.; Lapeyrade, A.; Copet, P.; Demeer, G.; Silvie, M.; Bieth, E.; Coupaye, M.; Poitou, C.; Lorenzini, F.; Labrousse, F.; et al. Medical, psychological and social features in a large cohort of adults with Prader-Willi syndrome: Experience from a dedicated centre in France. J. Intellect. Disabil. Res. 2015, 59, 411–421. [Google Scholar] [CrossRef]
- Sinnema, M.; Maaskant, M.A.; van Schrojenstein Lantman-de Valk, H.M.; van Nieuwpoort, I.C.; Drent, M.L.; Curfs, L.M.; Schrander-Stumpel, C.T.R.M. Physical health problems in adults with Prader-Willi syndrome. Am. J. Med. Genet. A 2011, 155 Pt A, 2112–2124. [Google Scholar] [CrossRef]
- Whittington, J.E.; Holland, A.J.; Webb, T.; Butler, J.; Clarke, D.; Boer, H. Population prevalence and estimated birth incidence and mortality rate for people with Prader-Willi syndrome in one UK Health Region. J. Med. Genet. 2001, 38, 792–798. [Google Scholar] [CrossRef] [PubMed]
- Coppus, A.M. People with intellectual disability: What do we know about adulthood and life expectancy? Dev. Disabil. Res. Rev. 2013, 18, 6–16. [Google Scholar] [CrossRef]
- Dykens, E.M. Aging in rare intellectual disability syndromes. Dev. Disabil. Res. Rev. 2013, 18, 75–83. [Google Scholar] [CrossRef] [PubMed]
- Sinnema, M.; Schrander-Stumpel, C.T.; Maaskant, M.A.; Boer, H.; Curfs, L.M. Aging in Prader-Willi syndrome: Twelve persons over the age of 50 years. Am. J. Med. Genet. A 2012, 158 Pt A, 1326–1336. [Google Scholar] [CrossRef]
- Whittington, J.E.; Holland, A.J.; Webb, T. Ageing in people with Prader-Willi syndrome: Mortality in the UK population cohort and morbidity in an older sample of adults. Psychol. Med. 2015, 45, 615–621. [Google Scholar] [CrossRef] [PubMed]
- Izadi, M.; Sadri, N.; Abdi, A.; Serajian, S.; Jalalei, D.; Tahmasebi, S. Epigenetic biomarkers in aging and longevity: Current and future application. Life Sci. 2024, 351, 122842. [Google Scholar] [CrossRef] [PubMed]
- Castagnola, M.J.; Medina-Paz, F.; Zapico, S.C. Uncovering Forensic Evidence: A Path to Age Estimation through DNA Methylation. Int. J. Mol. Sci. 2024, 25, 4917. [Google Scholar] [CrossRef] [PubMed]
- Zbieć-Piekarska, R.; Spólnicka, M.; Kupiec, T.; Parys-Proszek, A.; Makowska, Ż.; Pałeczka, A.; Kucharczyk, K.; Płoski, R.; Branicki, W. Development of a forensically useful age prediction method based on DNA methylation analysis. Forensic Sci. Int. Genet. 2015, 17, 173–179. [Google Scholar] [CrossRef] [PubMed]
- Daunay, A.; Baudrin, L.G.; Deleuze, J.F.; How-Kit, A. Evaluation of six blood-based age prediction models using DNA methylation analysis by pyrosequencing. Sci. Rep. 2019, 9, 8862. [Google Scholar] [CrossRef] [PubMed]
- Ghanemi, A.; Yoshioka, M.; St-Amand, J. Aging and Obesity Shared Patterns: From Molecular Pathogenesis to Epigenetics. Diseases 2021, 9, 87. [Google Scholar] [CrossRef]
- Rigamonti, A.E.; Bollati, V.; Favero, C.; Albetti, B.; Caroli, D.; Abbruzzese, L.; Cella, S.G.; Sartorio, A. Effect of a 3-Week Multidisciplinary Body Weight Reduction Program on the Epigenetic Age Acceleration in Obese Adults. J. Clin. Med. 2022, 11, 4677. [Google Scholar] [CrossRef]
- Cuende, J.I. Vascular Age Versus Cardiovascular Risk: Clarifying Concepts. Rev. Esp. Cardiol. 2016, 69, 243–246. [Google Scholar] [CrossRef]
- Gorostegi-Anduaga, I.; Pérez-Asenjo, J.; Aispuru, G.R.; Fryer, S.M.; Alonso-Colmenero, A.; Romaratezabala, E.; Maldonado-Martín, S. Assessment of cardiovascular risk and vascular age in overweight/obese adults with primary hypertension: The EXERDIET-HTA study. Blood Press. Monit. 2017, 22, 154–160. [Google Scholar] [CrossRef]
- Donze, S.H.; Codd, V.; Damen, L.; Goedegebuure, W.J.; Denniff, M.; Samani, N.J.; van der Velden, J.A.E.M.; Hokken-Koelega, A.C.S. Evidence for Accelerated Biological Aging in Young Adults with Prader-Willi Syndrome. J. Clin. Endocrinol. Metab. 2020, 105, 2053–2059. [Google Scholar] [CrossRef] [PubMed]
- Bonora, E.; Targher, G.; Alberiche, M.; Bonadonna, R.C.; Saggiani, F.; Zenere, M.B.; Monauni, T.; Muggeo, M. Homeostasis model assessment closely mirrors the glucose clamp technique in the assessment of insulin sensitivity: Studies in subjects with various degrees of glucose tolerance and insulin sensitivity. Diabetes Care 2000, 23, 57–63. [Google Scholar] [CrossRef] [PubMed]
- D’Agostino Sr, R.B.; Vasan, R.S.; Pencina, M.J.; Wolf, P.A.; Cobain, M.; Massaro, J.M.; Kannel, W.B. General cardiovascular risk profile for use in primary care: The Framingham Heart Study. Circulation 2008, 117, 743–753. [Google Scholar] [CrossRef] [PubMed]
- Bartke, A.; Hascup, E.; Hascup, K.; Masternak, M.M. Growth Hormone and Aging: New Findings. World J. Mens. Health. 2021, 39, 454–465. [Google Scholar] [CrossRef] [PubMed]
- Li, X.; Li, C.; Zhang, W.; Wang, Y.; Qian, P.; Huang, H. Inflammation and aging: Signaling pathways and intervention therapies. Signal. Transduct. Target Ther. 2023, 8, 239. [Google Scholar] [CrossRef] [PubMed]
- Temelli, B.; Zual, Y.A.; Savaş, H.B.; Aksoy, F.; Kumbul Doğuç, D.; Uskun, E.; Varol, E. Circulation levels of acute phase proteins pentraxin 3 and serum amyloid A in atherosclerosis have correlations with periodontal inflamed surface area. J. Appl. Oral Sci. 2018, 26, e20170322. [Google Scholar] [CrossRef] [PubMed]
- Mendiola, A.J.P.; LaSalle, J.M. Epigenetics in Prader-Willi Syndrome. Front. Genet. 2021, 12, 624581. [Google Scholar] [CrossRef] [PubMed]
- Kubota, T.; Miyake, K.; Hariya, N.; Tran Nguyen Quoc, V.; Mochizuki, K. Prader-Willi Syndrome: The Disease that Opened up Epigenomic-Based Preemptive Medicine. Diseases 2016, 4, 15. [Google Scholar] [CrossRef] [PubMed]
- Palma-Gudiel, H.; Fañanás, L.; Horvath, S.; Zannas, A.S. Psychosocial stress and epigenetic aging. Int. Rev. Neurobiol. 2020, 150, 107–128. [Google Scholar] [PubMed]
- Guerrini Usubini, A.; Bottacchi, M.; Bondesan, A.; Caroli, D.; Grugni, G.; Castelnuovo, G.; Sartorio, A. Assessment of Quality of Life and Psychological Well-Being in Italian Adult Subjects with Prader-Willi Syndrome Using the Health Survey Short Form and the Psychological General Well-Being Index Questionnaires. Healthcare 2025, 13, 158. [Google Scholar] [CrossRef] [PubMed]
- Salih, A.; Nichols, T.; Szabo, L.; Petersen, S.E.; Raisi-Estabragh, Z. Conceptual Overview of Biological Age Estimation. Aging Dis. 2023, 14, 583–588. [Google Scholar] [CrossRef]


| Parameter | EOB | PWS | p |
|---|---|---|---|
| N. | 36 | 24 | - |
| Sex (F/M) | 19/17 | 11/13 | ns |
| Age (year) | 43.4 [30.6; 49.5] | 36.8 [26.6; 45.3] | ns |
| Smoker (yes/no) | 9/27 | 21/3 | ns |
| BMI (kg/m2) | 44.8 [41.2; 51.7] | 36.8 [33.9; 44.8] | <0.001 |
| WC (cm) | 127.5 [113.0; 134.0] | 113.5 [109.0; 122.8] | ns |
| FFM (kg) | 55.2 [51.2; 74.8] | 46.4 [43.3; 49.8] | <0.001 |
| FFM (%) | 47.4 [44.0; 51.4] | 53.5 [45.3; 57.5] | ns |
| FM (kg) | 67.3 [57.5; 77.3] | 39.9 [35.4; 54.9] | <0.001 |
| FM (%) | 52.6 [48.6; 56.1] | 46.5 [42.5; 54.7] | ns |
| SBP (mmHg) | 140.0 [130.0; 145.0] | 130.0 [120.0; 130.0] | =0.010 |
| DBP (mmHg) | 80.0 [80.0; 90.0] | 80.0 [80.0; 82.5] | ns |
| HR (bpm) | 83.0 [77.5; 89.3] | 66.5 [64.0; 79.3] | <0.001 |
| Antihypertensive Drugs (yes/no) | 15/21 | 11/13 | ns |
| Glucose (mg/dL) | 100.0 [95.8; 108.0] | 101.0 [85.3; 131.5] | ns |
| Insulin (mU/L) | 24.9 [17.8; 35.7] | 13.2 [8.1; 17.7] | <0.001 |
| HOMA-IR | 6.4 [4.1; 10.6] | 3.5 [2.3; 5.3] | =0.002 |
| HbA1c (%) | 5.7 [5.5; 5.8] | 6.0 [5.6; 7.1] | =0.025 |
| DM (yes/no) | 6/30 | 10/14 | ns |
| Antidiabetic Drugs (yes/no) | 7/29 | 11/13 | ns |
| TC (mg/dL) | 183.5 [167.0; 208.0] | 191.0 [160.8; 214.0] | ns |
| HDL (mg/dL) | 47.5 [39.8; 54.8] | 50.5 [43.8; 54.8] | ns |
| LDL (mg/dL) | 123.0 [104.5; 145.8] | 122.0 [102.0; 147.0] | ns |
| TG (mg/dL) | 138.0 [104.3; 180.5] | 104.0 [74.0; 137.3] | =0.033 |
| hsCRP (mg/dL) | 0.7 [0.4; 1.2] | 0.6 [0.3; 1.0] | ns |
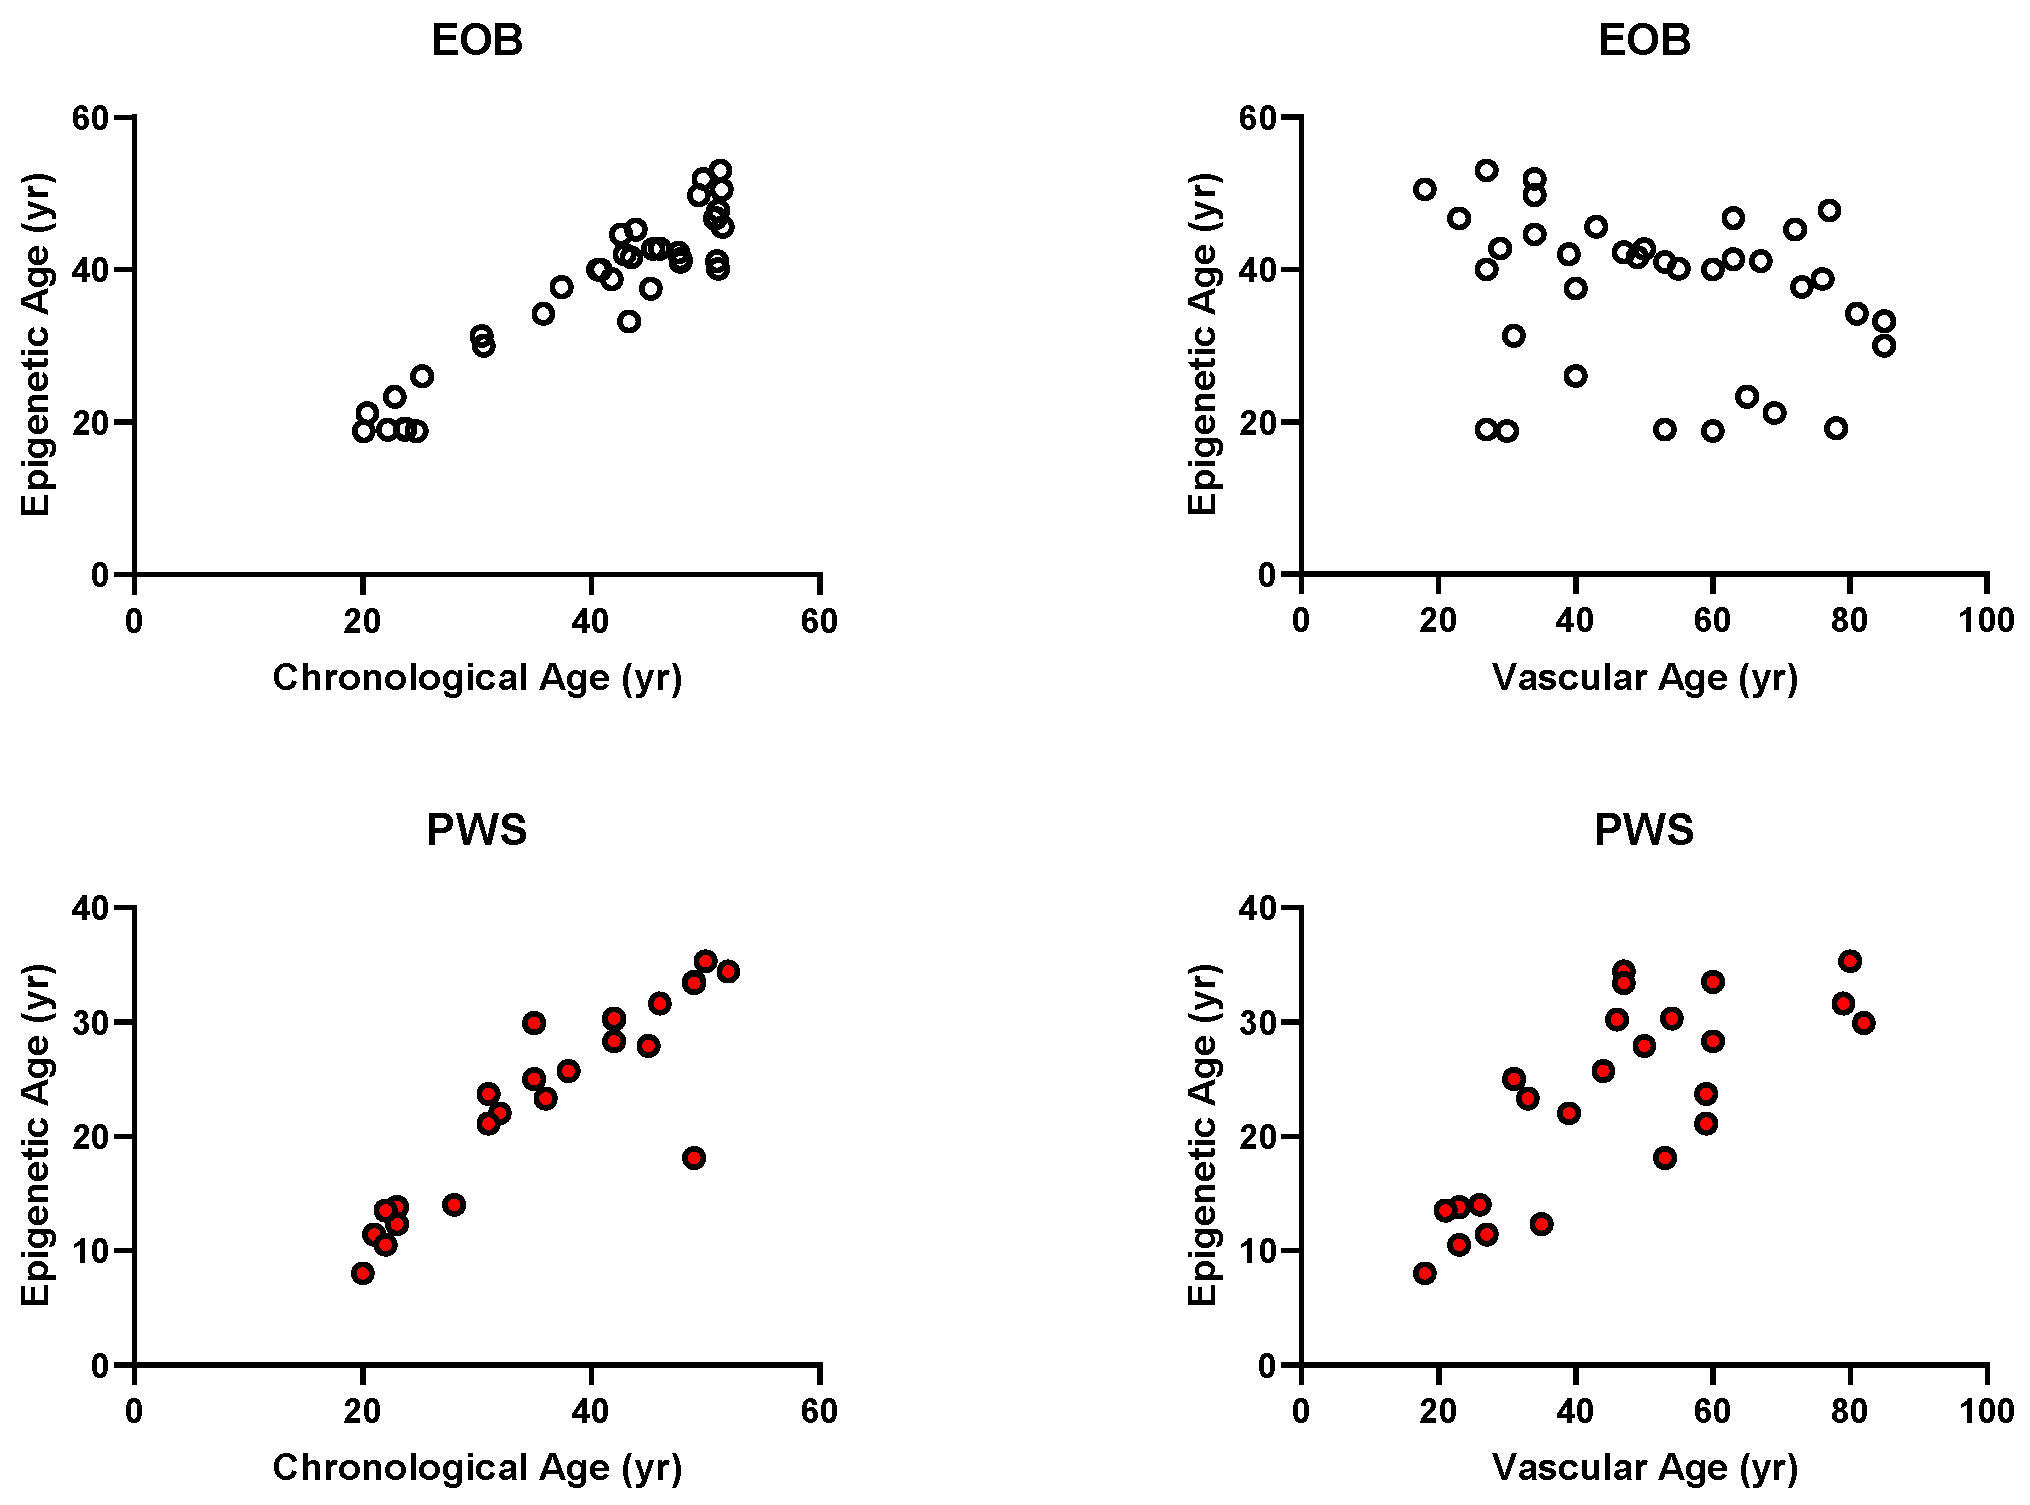
| Epigenetic Age (year) | 40.5 [30.9; 44.8] | 24.4 [14.0; 30.2] | <0.001 |
| VA (year) | 51.5 [34.0; 67.5] | 46.5 [30.0; 59.0] | ns |
| FRS (%) | 4.5 [1.9; 15.0] | 3.7 [1.4; 6.3] | ns |
Disclaimer/Publisher’s Note: The statements, opinions and data contained in all publications are solely those of the individual author(s) and contributor(s) and not of MDPI and/or the editor(s). MDPI and/or the editor(s) disclaim responsibility for any injury to people or property resulting from any ideas, methods, instructions or products referred to in the content. |
© 2025 by the authors. Licensee MDPI, Basel, Switzerland. This article is an open access article distributed under the terms and conditions of the Creative Commons Attribution (CC BY) license (https://creativecommons.org/licenses/by/4.0/).
Share and Cite
Rigamonti, A.E.; Bollati, V.; Albetti, B.; Caroli, D.; Bondesan, A.; Grugni, G.; Cella, S.G.; Sartorio, A. Epigenetic Age in Prader–Willi Syndrome and Essential Obesity: A Comparison with Chronological and Vascular Ages. J. Clin. Med. 2025, 14, 1470. https://doi.org/10.3390/jcm14051470
Rigamonti AE, Bollati V, Albetti B, Caroli D, Bondesan A, Grugni G, Cella SG, Sartorio A. Epigenetic Age in Prader–Willi Syndrome and Essential Obesity: A Comparison with Chronological and Vascular Ages. Journal of Clinical Medicine. 2025; 14(5):1470. https://doi.org/10.3390/jcm14051470
Chicago/Turabian StyleRigamonti, Antonello E., Valentina Bollati, Benedetta Albetti, Diana Caroli, Adele Bondesan, Graziano Grugni, Silvano G. Cella, and Alessandro Sartorio. 2025. "Epigenetic Age in Prader–Willi Syndrome and Essential Obesity: A Comparison with Chronological and Vascular Ages" Journal of Clinical Medicine 14, no. 5: 1470. https://doi.org/10.3390/jcm14051470
APA StyleRigamonti, A. E., Bollati, V., Albetti, B., Caroli, D., Bondesan, A., Grugni, G., Cella, S. G., & Sartorio, A. (2025). Epigenetic Age in Prader–Willi Syndrome and Essential Obesity: A Comparison with Chronological and Vascular Ages. Journal of Clinical Medicine, 14(5), 1470. https://doi.org/10.3390/jcm14051470