
Impact of the COVID-19 Pandemic on the Treatment of Head and Neck Cancers

Abstract
1. Introduction
2. Methods
2.1. Data Source
2.2. Study Population and Covariates
2.2.1. Classification of Mucosal Head and Neck Cancer
2.2.2. Demographic and Clinical Variables
2.2.3. Cancer Staging, Treatment, and Clinical Outcomes
2.3. Statistical Analyses
2.3.1. Descriptive Statistics
2.3.2. Regression Analyses
3. Results
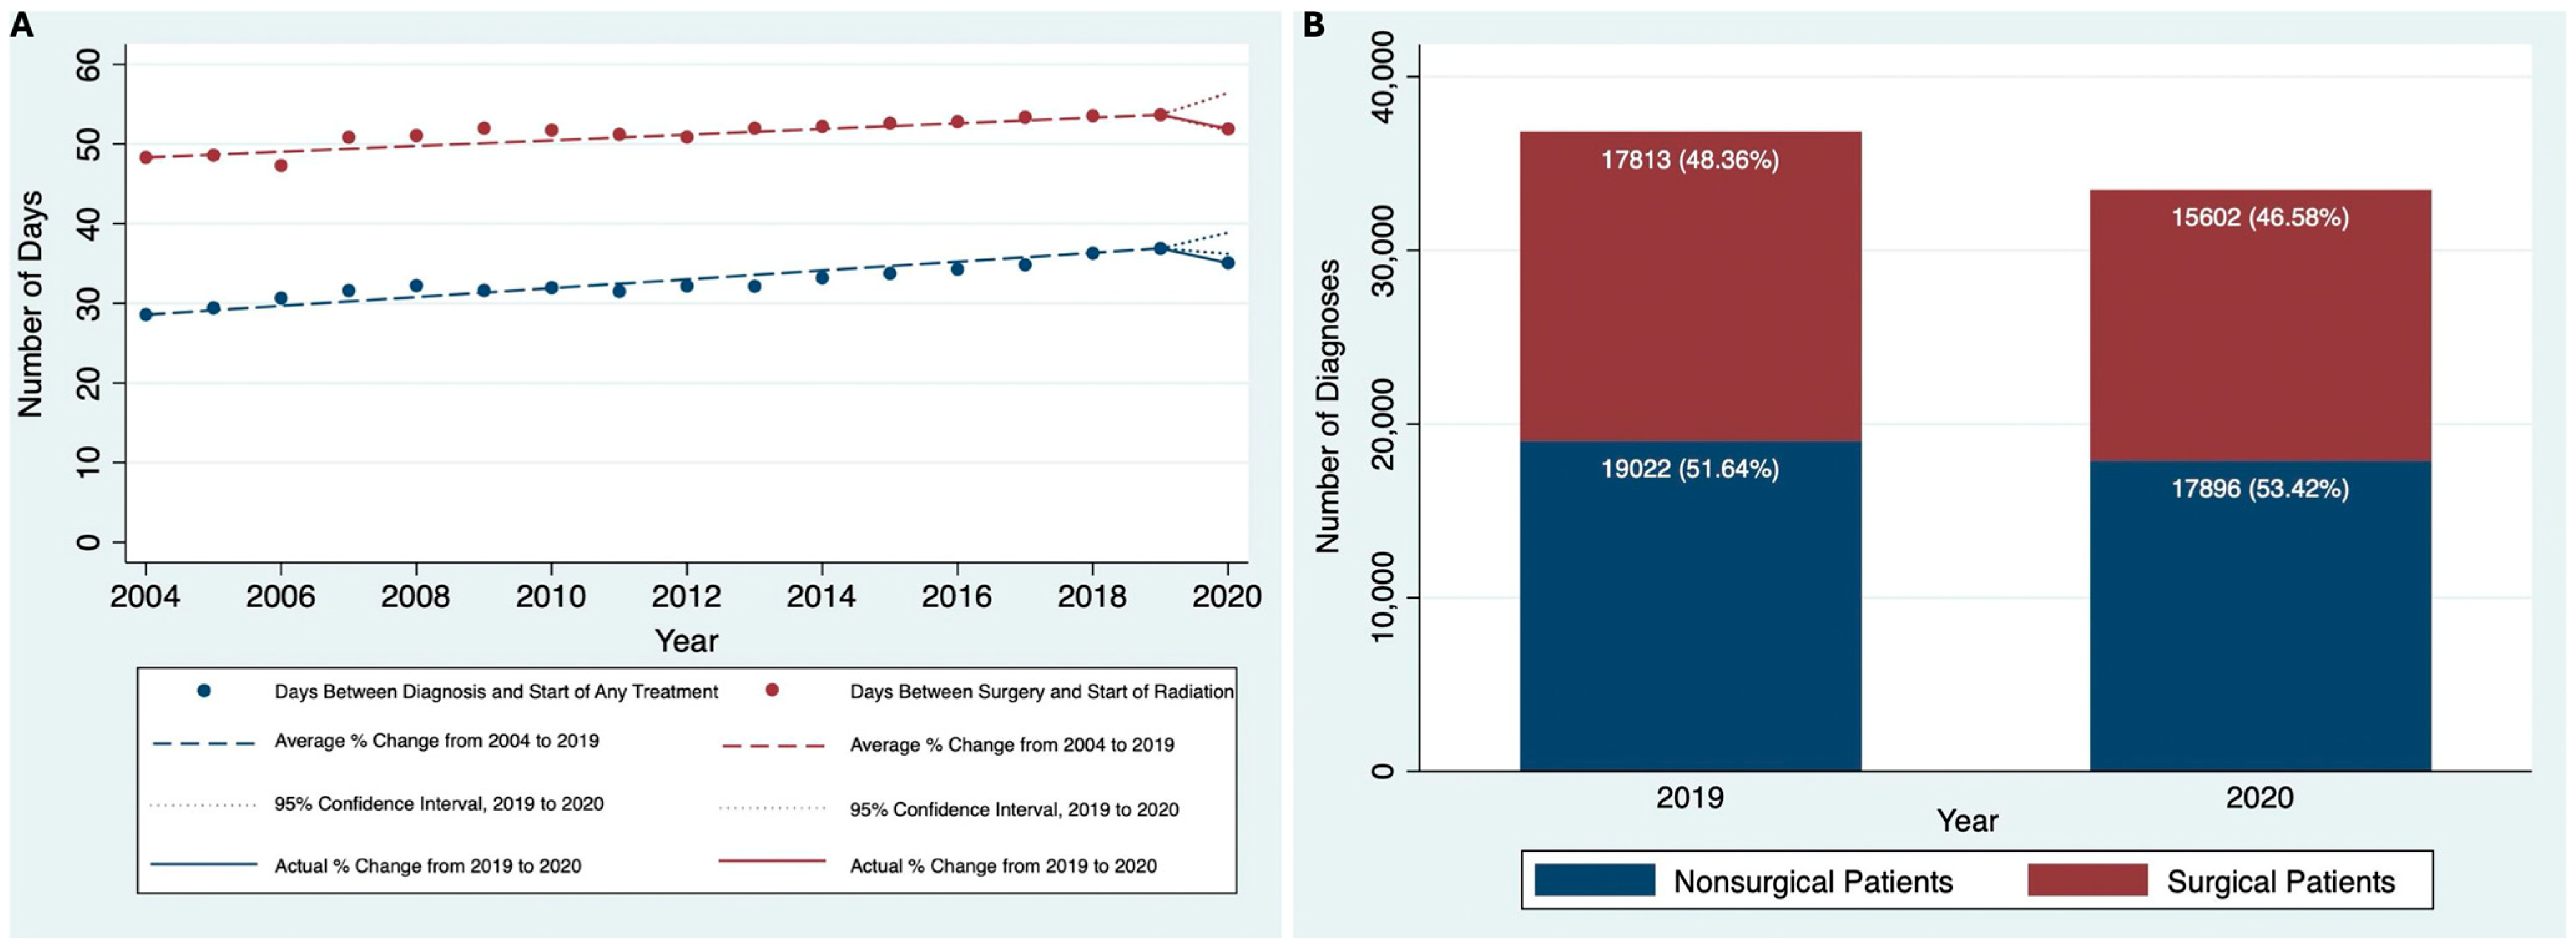
3.1. Changes in HNC Diagnoses and Treatment over Time
3.2. Demographic and Clinical Characteristics of Patients with HNC in 2019 and 2020
3.3. Changes in Treatment Time Metrics from 2019 to 2020
4. Discussion
Author Contributions
Funding
Institutional Review Board Statement
Informed Consent Statement
Data Availability Statement
Conflicts of Interest
Abbreviations
| HNC | Head and Neck Cancer |
| NCDB | National Cancer Database |
| IRB | Institutional Review Board |
| AJCC | American Joint Committee on Cancer |
| APC | Average Percentage Change |
| CI | Confidence Intervals |
| NCCN | National Comprehensive Cancer Network |
| PORT | Postoperative Radiotherapy |
| AAPC | Average Annual Percentage Change |
References
- Moynihan, R.; Sanders, S.; Michaleff, Z.A.; Scott, A.M.; Clark, J.; To, E.J.; Jones, M.; Kitchener, E.; Fox, M.; Johansson, M.; et al. Impact of COVID-19 pandemic on utilisation of healthcare services: A systematic review. BMJ Open 2021, 11, e045343. [Google Scholar] [CrossRef] [PubMed]
- Xu, S.; Glenn, S.; Sy, L.; Qian, L.; Hong, V.; Ryan, D.S.; Jacobsen, S. Impact of the COVID-19 Pandemic on Health Care Utilization in a Large Integrated Health Care System: Retrospective Cohort Study. J. Med. Internet Res. 2021, 23, e26558. [Google Scholar] [CrossRef]
- Roy, C.M.; Bollman, E.B.; Carson, L.M.; Northrop, A.J.; Jackson, E.F.; Moresky, R.T. Assessing the indirect effects of COVID-19 on healthcare delivery, utilization and health outcomes: A scoping review. Eur. J. Public Health 2021, 31, 634–640. [Google Scholar] [CrossRef] [PubMed]
- Hartnett, K.P.; Kite-Powell, A.; DeVies, J.; Coletta, M.A.; Boehmer, T.K.; Adjemian, J.; Gundlapalli, A.V. National Syndromic Surveillance Program Community of Practice Impact of the COVID-19 Pandemic on Emergency Department Visits—United States, 1 January 2019–30 May 2020. MMWR Morb. Mortal. Wkly. Rep. 2020, 69, 699–704. [Google Scholar] [CrossRef]
- Rennert-May, E.; Leal, J.; Thanh, N.X.; Lang, E.; Dowling, S.; Manns, B.; Wasylak, T.; Ronksley, P.E. The impact of COVID-19 on hospital admissions and emergency department visits: A population-based study. PLoS ONE 2021, 16, e0252441. [Google Scholar] [CrossRef]
- Kapsner, L.A.; Kampf, M.O.; Seuchter, S.A.; Gruendner, J.; Gulden, C.; Mate, S.; Mang, J.M.; Schüttler, C.; Deppenwiese, N.; Krause, L.; et al. Reduced Rate of Inpatient Hospital Admissions in 18 German University Hospitals During the COVID-19 Lockdown. Front. Public Health 2021, 8, 594117. [Google Scholar] [CrossRef]
- Rucinska, M.; Nawrocki, S. COVID-19 Pandemic: Impact on Cancer Patients. Int. J. Environ. Res. Public Health 2022, 19, 12470. [Google Scholar] [CrossRef]
- Boettcher, A.N.; Hammoud, D.A.; Weinberg, J.B.; Agarwal, P.; Mendiratta-Lala, M.; Luker, G.D. Cancer Imaging and Patient Care during the COVID-19 Pandemic. Radiol. Imaging Cancer 2020, 2, e200058. [Google Scholar] [CrossRef]
- Hanna, T.P.; King, W.D.; Thibodeau, S.; Jalink, M.; Paulin, G.A.; Harvey-Jones, E.; O’Sullivan, D.E.; Booth, C.M.; Sullivan, R.; Aggarwal, A. Mortality due to cancer treatment delay: Systematic review and meta-analysis. BMJ 2020, 371, m4087. [Google Scholar] [CrossRef]
- Chavez-MacGregor, M.; Lei, X.; Zhao, H.; Scheet, P.; Giordano, S.H. Evaluation of COVID-19 Mortality and Adverse Outcomes in US Patients With or Without Cancer. JAMA Oncol. 2022, 8, 69–78. [Google Scholar] [CrossRef]
- Pathania, A.S.; Prathipati, P.; Abdul, B.A.; Chava, S.; Katta, S.S.; Gupta, S.C.; Gangula, P.R.; Pandey, M.K.; Durden, D.L.; Byrareddy, S.N.; et al. COVID-19 and Cancer Comorbidity: Therapeutic Opportunities and Challenges. Theranostics 2021, 11, 731–753. [Google Scholar] [CrossRef] [PubMed]
- Conti, V.; Corbi, G.; Sabbatino, F.; De Pascale, D.; Sellitto, C.; Stefanelli, B.; Bertini, N.; De Simone, M.; Liguori, L.; Di Paola, I.; et al. Long COVID: Clinical Framing, Biomarkers, and Therapeutic Approaches. J. Pers. Med. 2023, 13, 334. [Google Scholar] [CrossRef] [PubMed]
- Patt, D.; Gordan, L.; Diaz, M.; Okon, T.; Grady, L.; Harmison, M.; Markward, N.; Sullivan, M.; Peng, J.; Zhou, A. Impact of COVID-19 on Cancer Care: How the Pandemic Is Delaying Cancer Diagnosis and Treatment for American Seniors. JCO Clin. Cancer Inform. 2020, 4, 1059–1071. [Google Scholar] [CrossRef]
- Consalvo, F.; De Simone, M.; Scarpa, A.; Acerra, A.; Salzano, F.A.; Fineschi, V.; Santurro, A. Challenges and Complications in the Management of Advanced Oropharyngeal Carcinoma: Role of Post-Mortem Diagnosis and Future Perspectives. J. Clin. Med. 2024, 13, 5198. [Google Scholar] [CrossRef] [PubMed]
- Solis, R.N.; Mehrzad, M.; Faiq, S.; Frusciante, R.P.; Sekhon, H.K.; Abouyared, M.; Bewley, A.F.; Farwell, D.G.; Birkeland, A.C. The Impact of COVID-19 on Head and Neck Cancer Treatment: Before and During the Pandemic. OTO Open 2021, 5, 2473974X211068075. [Google Scholar] [CrossRef]
- Kiong, K.L.; Diaz, E.M.; Gross, N.D.; Diaz, E.M.; Hanna, E.Y. The impact of COVID-19 on head and neck cancer diagnosis and disease extent. Head Neck 2021, 43, 1890–1897. [Google Scholar] [CrossRef]
- Popovic, M.; Fiano, V.; Moirano, G.; Chiusa, L.; Conway, D.I.; Garzino Demo, P.; Gilardetti, M.; Iorio, G.C.; Moccia, C.; Ostellino, O.; et al. The Impact of the COVID-19 Pandemic on Head and Neck Cancer Diagnosis in the Piedmont Region, Italy: Interrupted Time-Series Analysis. Front. Public Health 2022, 10, 809283. [Google Scholar] [CrossRef]
- Zubair, A.; Jamshaid, S.; Scholfield, D.W.; Hariri, A.A.; Ahmed, J.; Ghufoor, K.; Ali, S. Impact of COVID-19 pandemic on head-neck cancer referral and treatment pathway in North East London. Ann. R. Coll. Surg. Engl. 2022, 105, S28–S34. [Google Scholar] [CrossRef]
- Tevetoğlu, F.; Kara, S.; Aliyeva, C.; Yıldırım, R.; Yener, H.M. Delayed presentation of head and neck cancer patients during COVID-19 pandemic. Eur. Arch. Otorhinolaryngol. 2021, 278, 5081–5085. [Google Scholar] [CrossRef]
- Stevens, M.N.; Patro, A.; Rahman, B.; Gao, Y.; Liu, D.; Cmelak, A.; Wiggleton, J.; Kim, Y.J.; Langerman, A.; Mannion, K.; et al. Impact of COVID-19 on presentation, staging, and treatment of head and neck mucosal squamous cell carcinoma. Am. J. Otolaryngol. 2022, 43, 103263. [Google Scholar] [CrossRef]
- Available online: https://www2.census.gov/geo/pdfs/maps-data/maps/reference/us_regdiv.pdf (accessed on 3 April 2023).
- Amin, M.B.; Greene, F.L.; Edge, S.B.; Compton, C.C.; Gershenwald, J.E.; Brookland, R.K.; Meyer, L.; Gress, D.M.; Byrd, D.R.; Winchester, D.P. The Eighth Edition AJCC Cancer Staging Manual: Continuing to build a bridge from a population-based to a more “personalized” approach to cancer staging. CA Cancer J. Clin. 2017, 67, 93–99. [Google Scholar] [CrossRef] [PubMed]
- Graboyes, E.M.; Garrett-Mayer, E.; Ellis, M.A.; Sharma, A.K.; Wahlquist, A.E.; Lentsch, E.J.; Nussenbaum, B.; Day, T.A. Effect of Time to Initiation of Postoperative Radiation Therapy on Survival in Surgically-Managed Head and Neck Cancer. Cancer 2017, 123, 4841–4850. [Google Scholar] [CrossRef] [PubMed]
- Rygalski, C.J.; Zhao, S.; Eskander, A.; Zhan, K.Y.; Mroz, E.A.; Brock, G.; Silverman, D.A.; Blakaj, D.; Bonomi, M.R.; Carrau, R.L.; et al. Time to Surgery and Survival in Head and Neck Cancer. Ann. Surg. Oncol. 2021, 28, 877–885. [Google Scholar] [CrossRef]
- Liao, D.Z.; Schlecht, N.F.; Rosenblatt, G.; Kinkhabwala, C.M.; Leonard, J.A.; Ference, R.S.; Prystowsky, M.B.; Ow, T.J.; Schiff, B.A.; Smith, R.V.; et al. Association of Delayed Time to Treatment Initiation With Overall Survival and Recurrence Among Patients with Head and Neck Squamous Cell Carcinoma in an Underserved Urban Population. JAMA Otolaryngol. Neck Surg. 2019, 145, 1001–1009. [Google Scholar] [CrossRef]
- Pfister, D.G.; Spencer, S.; Adelstein, D.; Adkins, D.; Anzai, Y.; Brizel, D.M.; Bruce, J.Y.; Busse, P.M.; Caudell, J.J.; Cmelak, A.J.; et al. Head and Neck Cancers, Version 2.2020, NCCN Clinical Practice Guidelines in Oncology. J. Natl. Compr. Cancer Netw. JNCCN 2020, 18, 873–898. [Google Scholar] [CrossRef]
- Ladbury, C.; Liu, J.; Nelson, R.; Amini, A.; Maghami, E.; Sampath, S. Prognostic Impact of Primary Tumor Extent and Postoperative Radiation Facility Location in Major Salivary Gland Malignancies. Cureus 2022, 14, e24038. [Google Scholar] [CrossRef]
- Rosenthal, D.I.; Liu, L.; Lee, J.H.; Vapiwala, N.; Chalian, A.A.; Weinstein, G.S.; Chilian, I.; Weber, R.S.; Machtay, M. Importance of the treatment package time in surgery and postoperative radiation therapy for squamous carcinoma of the head and neck. Head Neck 2002, 24, 115–126. [Google Scholar] [CrossRef]
- Effect of COVID-19 Pandemic Lockdowns on Planned Cancer Surgery for 15 Tumour Types in 61 Countries: An International, Prospective, Cohort Study—The Lancet Oncology. Available online: https://www.thelancet.com/journals/lanonc/article/PIIS1470-2045(21)00493-9/fulltext (accessed on 28 February 2024).
- Thompson, J.A.; Lubek, J.E.; Amin, N.; Joy, R.; Dyalram, D.; Ord, R.A.; Taylor, R.J.; Wolf, J.S.; Mehra, R.; Cullen, K.J.; et al. Impact of the Novel Coronavirus 2019 (COVID-19) Pandemic on Head and Neck Cancer Care. Otolaryngol. Head Neck Surg. 2022, 166, 93–100. [Google Scholar] [CrossRef]
- Schoonbeek, R.C.; de Jel, D.V.C.; van Dijk, B.A.C.; Willems, S.M.; Bloemena, E.; Hoebers, F.J.P.; van Meerten, E.; Verbist, B.M.; Smeele, L.E.; Halmos, G.B.; et al. Fewer head and neck cancer diagnoses and faster treatment initiation during COVID-19 in 2020: A nationwide population-based analysis. Radiother. Oncol. 2022, 167, 42–48. [Google Scholar] [CrossRef]
- Yao, P.; Cooley, V.; Kuhel, W.; Tassler, A.; Banuchi, V.; Long, S.; Savenkov, O.; Kutler, D.I. Times to Diagnosis, Staging, and Treatment of Head and Neck Cancer Before and During COVID-19. OTO Open 2021, 5, 2473974X211059429. [Google Scholar] [CrossRef]
- Heimes, D.; Müller, L.K.; Schellin, A.; Naujokat, H.; Graetz, C.; Schwendicke, F.; Goedecke, M.; Beck-Broichsitter, B.; Kämmerer, P.W. Consequences of the COVID-19 Pandemic and Governmental Containment Policies on the Detection and Therapy of Oral Malignant Lesions—A Retrospective, Multicenter Cohort Study from Germany. Cancers 2021, 13, 2892. [Google Scholar] [CrossRef] [PubMed]
- Gršić, K.; Blivajs, I.; Pastorčić Grgić, M.; Prgomet, D.; Lukinović, J.; Vugrinec, O.; Matoc, L.; Miličić, B.; Leović, D. The impact of COVID-19 on head and neck cancer treatment delay. Acta Clin. Croat. 2022, 61, 19–25. [Google Scholar] [CrossRef] [PubMed]
- Shaw, R.; COVIDSurg Collaborative. UK Head and neck cancer surgical capacity during the second wave of the COVID-19 pandemic: Have we learned the lessons? COVIDSurg collaborative. Clin. Otolaryngol. 2021, 46, 729–735. [Google Scholar] [CrossRef] [PubMed]
- Escobar, N.; DiMaggio, C.; Pocock, B.; Pescovitz, A.; McCalla, S.; Joseph, K.-A. Effects of COVID-19 on Surgical Delays in Patients with Breast Cancer in NYC Public Hospitals: A Multicenter Study. Ann. Surg. Oncol. 2023, 30, 23–30. [Google Scholar] [CrossRef]
- Mullangi, S.; Aviki, E.M.; Chen, Y.; Robson, M.; Hershman, D.L. Factors Associated With Cancer Treatment Delay Among Patients Diagnosed With COVID-19. JAMA Netw. Open 2022, 5, e2224296. [Google Scholar] [CrossRef]
- AJMC. Vulnerable populations: Who are they? Am. J. Manag. Care 2006, 12, S348–S352. [Google Scholar]
- Romero Starke, K.; Reissig, D.; Petereit-Haack, G.; Schmauder, S.; Nienhaus, A.; Seidler, A. The isolated effect of age on the risk of COVID-19 severe outcomes: A systematic review with meta-analysis. BMJ Glob. Health 2021, 6, e006434. [Google Scholar] [CrossRef]
- Wiemers, E.E.; Abrahams, S.; AlFakhri, M.; Hotz, V.J.; Schoeni, R.F.; Seltzer, J.A. Disparities in Vulnerability to Severe Complications from COVID-19 in the United States. medRxiv 2020, medRxiv:2020.05.28.20115899. [Google Scholar] [CrossRef]

| 2019 N (%) | 2020 N (%) | p-Value | |
|---|---|---|---|
| Age (in years) | |||
| ≤50 | 3629 (9.81) | 3311 (9.84) | p = 0.059 |
| 51–60 | 9799 (26.48) | 8619 (25.61) | |
| 61–70 | 12,853 (34.73) | 11,776 (34.99) | |
| 70+ | 10,724 (28.98) | 9946 (29.56) | |
| Sex | |||
| Male | 27,413 (74.08) | 24,814 (73.74) | p = 0.233 |
| Female | 9590 (2592) | 8838 (26.26) | |
| Race | |||
| White | 31,748 (85.79) | 28,856 (85.75) | p = 0.068 |
| Black | 3443 (9.30) | 3035 (9.02) | |
| Other | 1814 (4.90) | 1761 (5.23) | |
| Proportion of adults from patient’s ZIP code not graduating high school, 2000 US Census data | |||
| 29.0% | 5409 (17.66) | 4773 (17.22) | p = 0.097 |
| 20% to 28.9% | 7514 (24.54) | 6876 (24.80) | |
| 14% to 19.9% | 7315 (23.89) | 6818 (24.60) | |
| Less than 14% | 10,387 (33.92) | 9254 (33.38) | |
| Median household income for patient’s ZIP code, 2000 US Census data | |||
| <USD 30,000 | 4421 (14.43) | 3873 (13.97) | p = 0.075 |
| USD 30,000–USD 34,999 | 5695 (18.59) | 5327 (19.21) | |
| USD 35,000–USD 45,999 | 8692 (28.38) | 7969 (28.74) | |
| USD 46,000+ | 11,823 (38.60) | 10,555 (38.07) | |
| Distance from facility (miles) | |||
| ≤10 | 12,762 (34.66) | 11,607 (34.65) | p = 0.639 |
| 11 to 20 | 6420 (17.44) | 5937 (17.72) | |
| 21 to 50 | 7008 (19.03) | 6293 (18.78) | |
| 51 to 100 | 3087 (8.38) | 2872 (8.57) | |
| >100 | 7545 (20.49) | 6792 (20.27) | |
| Insurance status | |||
| Uninsured | 1559 (4.32) | 1367 (4.06) | p = 0.302 |
| Private Insurance/ Managed Care | 12,898 (34.85) | 11,656 (34.64) | |
| Medicaid | 3951 (10.68) | 3675 (10.92) | |
| Medicare | 17,456 (47.17) | 15,982 (47.49) | |
| Other | 1101 (2.98) | 972 (2.89) | |
| Charlson–Deyo score | |||
| 0–1 | 33,034 (89.27) | 29,904 (88.86) | p = 0.084 |
| 2–3 | 3971 (10.73) | 3748 (11.14) | |
| Primary site | |||
| Oral Cavity | 11,250 (30.40) | 10,246 (30.45) | p = 0.916 |
| Oropharynx | 15,625 (42.22) | 14,260 (42.37) | |
| Hypopharynx | 1607 (4.34) | 1432 (4.26) | |
| Larynx | 8523 (23.03) | 7714 (22.92) | |
| Readmission | |||
| No unplanned readmission | 35,990 (97.26) | 32,811 (97.50) | p < 0.001 * |
| Unplanned readmission | 628 (1.70) | 583 (1.73) | |
| Unknown | 387 (1.05) | 258 (.77) | |
| Surgical margins | |||
| Negative | 13,569 (36.67) | 11,954 (35.52) | p = 0.001 |
| Positive | 2550 (6.89) | 2241 (6.66) | |
| Unknown | 20,886 (56.44) | 19,457 (57.82) | |
| Facility region | |||
| East | 7189 (19.43) | 6208 (18.45) | p = 0.001 |
| South | 9093 (24.57) | 8518 (25.31) | |
| Midwest | 14,582 (39.41) | 13,429 (39.91) | |
| West | 5371 (14.51) | 4869 (14.47) | |
| Unknown | 770 (2.08) | 628 (1.87) | |
| Rural–urban | |||
| Metro | 28,899 (78.09) | 26,417 (78.50) | p < 0.001 |
| Urban | 6116 (16.53) | 5666 (16.84) | |
| Rural | 792 (2.14) | 678 (2.01) | |
| Unknown | 1198 (3.24) | 891 (2.65) | |
| Treatment | |||
| Surgery Only | 9614 (25.98) | 8306 (24.68) | p < 0.001 |
| Surgery and Radiation | 4147 (11.21) | 3811 (11.32) | |
| Surgery and Chemoradiation | 3490 (9.43) | 2924 (8.69) | |
| Radiation Only | 4496 (12.15) | 4415 (12.23) | |
| Chemoradiation Only | 10,594 (28.63) | 9862 (29.31) | |
| One or More Factors Unknown | 4664 (12.60) | 4634 (13.77) | |
| Pathologic T stage | |||
| T1 | 5521 (14.92) | 4475 (13.30) | p < 0.001 |
| T2 | 3738 (10.10) | 3399 (10.10 | |
| T3 | 1994 (5.39) | 1867 (5.55) | |
| T4 | 2878 (7.78) | 2828 (8.41) | |
| Other/Unknown | 22,873 (61.81) | 21,071 (62.64) | |
| Pathologic N stage | |||
| N0 | 5340 (14.43) | 4881 (14.50) | p = 0.839 |
| N+ | 5923 (16.01) | 5334 (15.85) | |
| Other/Unknown | 25,742 (69.56) | 23,437 (69.65) | |
| Pathologic M stage | |||
| M0 | 16,185 (43.74) | 14,203 (42.21) | p < 0.001 |
| M+ | 434 (1.17) | 406 (1.21) | |
| Other/Unknown | 20,386 (55.09) | 19,043 (56.59) | |
| Clinical T stage | |||
| T1 | 7968 (23.25) | 6800 (21.97) | p < 0.001 |
| T2 | 8576 (25.02) | 7642 (24.69) | |
| T3 | 5381 (15.70) | 5262 (17.00) | |
| T4 | 5157 (15.04) | 5051 (16.32) | |
| Other/Unknown | 7196 (20.99) | 6193 (20.01) | |
| Clinical N stage | |||
| N0 | 15,108 (40.83) | 13,255 (39.39) | p < 0.001 |
| N+ | 16,752 (45.27) | 15,733 (46.75) | |
| Other/Unknown | 5145 (13.90) | 4664 (13.86) | |
| Clinical M stage | |||
| M0 | 31,555 (85.27) | 28,662 (85.17) | p = 0.250 |
| M+ | 1216 (3.29) | 1180 (3.51) | |
| Other/Unknown | 4234 (11.44) | 3810 (11.32) |
| Independent Variable | Mean Difference (Days) | CI | p-Value |
|---|---|---|---|
| Year 2020 (ref: Year 2019) | −2.27 | −2.85 to −1.69 | <0.001 * |
| Age, y (ref: ≤50 y) | |||
| 51–60 y | 1.99 | 0.80 to 3.18 | 0.001 |
| 61–70 y | 1.98 | 0.78 to 3.18 | 0.001 |
| 71 y or older | 0.31 | −1.01 to 1.64 | 0.646 |
| Sex (ref: Male) | 1.39 | 0.68 to 2.11 | <0.001 |
| Race (ref: White) | |||
| Black | 3.64 | 2.51 to 4.77 | <0.001 |
| Other | 0.84 | −0.63 to 2.31 | 0.265 |
| Proportion of adults from patient’s ZIP code not graduating high school, 2000 US Census data (ref: 29.0%+) | |||
| 20% to 28.9% | −0.35 | −1.43 to 0.72 | 0.518 |
| 14% to 19.9% | −0.27 | −1.45 to 0.92 | 0.658 |
| Less than 14% | −1.49 | −2.78 to −0.21 | 0.023 |
| Median household income for patient’s ZIP code, 2000 US Census data (ref: <USD 30,000) | |||
| USD 30,000–USD 34,999 | −1.08 | −2.23 to 0.61 | 0.064 |
| USD 35,000–USD 45,999 | −0.86 | −2.05 to 0.33 | 0.158 |
| USD 46,000+ | −2.03 | −3.35 to −0.70 | 0.003 |
| Distance from treatment facility (ref: 0–10 miles away from treatment facility) | |||
| 11–20 miles | 1.12 | −0.33 to 1.91 | 0.005 |
| 21–50 miles | 2.13 | 1.30 to 2.96 | <0.001 |
| 51–100 miles | 3.66 | 2.49 to 4.83 | <0.001 |
| >100 miles | 7.75 | 6.31 to 9.18 | <0.001 |
| Insurance status (ref: uninsured or unknown) | |||
| Private Insurance or Managed Care | −5.81 | −7.57 to −4.05 | <0.001 |
| Medicaid | 1.99 | −0.02 to 4.00 | 0.053 |
| Medicare | −3.47 | −5.24 to −1.69 | <0.001 |
| Other Government | 0.20 | −2.25 to 2.66 | 0.871 |
| Charlson–Deyo score of 2 or 3 (ref: score of 0 or 1) | 0.31 | −0.65 to 1.27 | 0.533 |
| Tumor site (ref: oral) | |||
| Oropharynx | −10.31 | −11.24 to −9.37 | <0.001 |
| Hypopharynx | −10.05 | −11.57 to −8.53 | <0.001 |
| Larynx | −9.46 | −10.43 to −8.49 | <0.001 |
| Facility region (ref: east) | |||
| South | −2.85 | −3.71 to −1.99 | <0.001 |
| Midwest | 0.02 | −0.83 to 0.87 | 0.957 |
| West | 1.39 | 0.31 to 2.48 | 0.012 |
| Unknown | −4.54 | −6.73 to −2.34 | <0.001 |
| Rural/urban (ref: metro) | |||
| Urban | −0.13 | −1.08 to 0.83 | 0.793 |
| Rural | −4.09 | −5.96 to −2.22 | <0.001 |
| Not available/Unknown | −4.52 | −6.21 to −2.83 | <0.001 |
| Clinical T stage (ref: T1) | |||
| T2 | 4.88 | 4.05 to 5.72 | <0.001 |
| T3 | 7.84 | 6.84 to 8.84 | <0.001 |
| T4 | 9.43 | 8.35 to 10.52 | <0.001 |
| Other/Unknown | −0.82 | −1.84 to 0.21 | 0.118 |
| Clinical N stage (ref: N0) | |||
| N+ | −2.99 | −3.82 to −2.17 | <0.001 |
| Other/Unknown | −2.81 | −4.72 to −0.91 | 0.004 |
| Clinical M stage (ref: M0) | |||
| M+ | −2.30 | −4.21 to −0.39 | 0.018 |
| Other/Unknown | −5.29 | 4.18 to 8.68 | <0.001 |
| Treatment (ref: surgery only) | |||
| Surgery and Adjuvant Radiation | −3.09 | −4.09 to −2.08 | <0.001 |
| Surgery and Adjuvant Chemoradiation | −2.75 | −3.90 to −1.60 | <0.001 |
| Radiation only | 16.86 | 15.70 to 18.02 | <0.001 |
| Definitive Chemoradiation | 10.29 | 9.22 to 11.37 | <0.001 |
| Unknown | 11.18 | 9.34 to 13.01 | <0.001 |
| Time from Surgery to Start of Radiation | Time from Surgery to End of Radiation | |||||
|---|---|---|---|---|---|---|
| Independent Variable | Odds Ratio | 95% Confidence Interval | p-Value | Odds Ratio | 95% Confidence Interval | p-Value |
| Year 2020 (ref: Year 2019) | 0.91 | 0.85 to 0.97 | 0.004 * | 0.88 | 0.83 to 0.93 | <0.001 * |
| Age, y (ref: ≤50 y) | ||||||
| 51–60 y | 1.16 | 1.03 to 1.30 | 0.011 | 1.23 | 1.11 to 1.36 | <0.001 |
| 61–70 y | 1.26 | 1.12 to 1.42 | 0.014 | 1.35 | 1.22 to 1.50 | <0.001 |
| 71 y or older | 1.63 | 1.42 to 1.87 | <0.001 | 1.71 | 1.52 to 1.92 | <0.001 |
| Sex (ref: Male) | 1.18 | 1.09 to 1.28 | <0.001 | 1.10 | 1.03 to 1.18 | 0.003 |
| Race (ref: White) | ||||||
| Black | 1.15 | 1.01 to 1.32 | 0.039 | 1.08 | 0.96 to 1.21 | 0.205 |
| Other | 0.97 | 0.84 to 1.12 | 0.689 | 0.96 | 0.85 to 1.08 | 0.474 |
| Proportion of adults from patient’s ZIP code not graduating high school, 2000 US Census Data (ref: 29.0%+) | ||||||
| 20% to 28.9% | 1.02 | 0.91 to 1.15 | 0.720 | 1.01 | 0.91 to 1.11 | 0.904 |
| 14% to 19.9% | 0.93 | 0.82 to 1.06 | 0.271 | 0.98 | 0.88 to 1.09 | 0.724 |
| Less than 14% | 0.90 | 0.79 to 1.03 | 0.122 | 0.94 | 0.84 to 1.05 | 0.269 |
| Median household income for patient’s ZIP code, 2000 US Census data (ref: <USD 30,000) | ||||||
| USD 30,000–USD 34,999 | 0.86 | 0.76 to 0.98 | 0.028 | 0.85 | 0.76 to 0.95 | 0.005 |
| USD 35,000–USD 45,999 | 0.87 | 0.76 to 0.99 | 0.038 | 0.81 | 0.72 to 0.91 | <0.001 |
| USD 46,000+ | 0.84 | 0.72 to 0.97 | 0.019 | 0.73 | 0.64 to 0.83 | <0.001 |
| Distance from treatment facility (ref: 0–10 miles) | ||||||
| 11–20 miles | 0.98 | 0.90 to 1.07 | 0.684 | 1.02 | 0.94 to 1.10 | 0.627 |
| 21–50 miles | 1.25 | 1.14 to 1.38 | <0.001 | 1.23 | 1.14 to 1.33 | <0.001 |
| 51–100 miles | 1.35 | 1.19 to 1.54 | <0.001 | 1.41 | 1.26 to 1.57 | <0.001 |
| >100 miles | 1.11 | 0.96 to 1.28 | 0.162 | 1.28 | 1.13 to 1.45 | <0.001 |
| Insurance status (ref: uninsured/unknown) | ||||||
| Private Insurance or Managed Care | 0.73 | 0.61 to 0.87 | <0.001 | 0.77 | 0.66 to 0.89 | 0.001 |
| Medicaid | 1.25 | 1.02 to 1.54 | 0.031 | 1.27 | 1.07 to 1.51 | 0.006 |
| Medicare | 0.88 | 0.73 to 1.05 | 0.161 | 0.93 | 0.80 to 1.09 | 0.365 |
| Other Government | 1.02 | 0.78 to 1.34 | 0.869 | 1.07 | 0.85 to 1.34 | 0.581 |
| Charlson–Deyo score of 2–3 (ref: score of 0–1) | 1.17 | 1.04 to 1.31 | 0.011 | 1.18 | 1.07 to 1.31 | 0.001 |
| Tumor site (ref: Oral Cavity) | ||||||
| Oropharynx | 0.47 | 0.43 to 0.51 | <0.001 | 0.58 | 0.53 to 0.62 | <0.001 |
| Hypopharynx | 0.69 | 0.54 to 0.88 | 0.002 | 0.86 | 0.70 to 1.05 | 0.150 |
| Larynx | 0.42 | 0.38 to 0.47 | <0.001 | 0.55 | 0.50 to 0.60 | <0.001 |
| Readmission (ref: no unplanned readmission) | ||||||
| Unplanned Readmission | 1.33 | 1.05 to 1.68 | 0.016 | 1.31 | 1.08 to 1.59 | 0.005 |
| Unknown | 0.73 | 0.53 to 0.99 | 0.042 | 0.73 | 0.55 to 0.97 | 0.033 |
| Facility region (ref: east) | ||||||
| South | 0.75 | 0.68 to 0.83 | <0.001 | 0.89 | 0.82 to 0.97 | 0.006 |
| Midwest | 0.89 | 0.80 to 0.98 | 0.017 | 1.13 | 1.04 to 1.23 | 0.004 |
| West | 0.91 | 0.81 to 1.02 | 0.108 | 0.99 | 0.90 to 1.09 | 0.772 |
| Unknown | 0.84 | 0.67 to 1.06 | 0.144 | 0.99 | 0.82 to 1.20 | 0.908 |
| Rural/urban (ref: metro) | ||||||
| Urban | 0.90 | 0.81 to 1.01 | 0.062 | 0.86 | 0.78 to 0.94 | 0.001 |
| Rural | 0.86 | 0.67 to 1.11 | 0.255 | 0.83 | 0.67 to 1.03 | 0.087 |
| Not available/Unknown | 1.07 | 0.88 to 1.30 | 0.477 | 0.99 | 0.84 to 1.17 | 0.931 |
| Pathologic T stage (ref: stage 1) | ||||||
| T2 | 0.78 | 0.71 to 0.86 | <0.001 | 0.63 | 0.58 to 0.69 | <0.001 |
| T3 | 0.61 | 0.54 to 0.69 | <0.001 | 0.43 | 0.39 to 0.48 | <0.001 |
| T4 | 0.65 | 0.58 to 0.74 | <0.001 | 0.43 | 0.39 to 0.48 | <0.001 |
| Other/Unknown | 3.89 | 3.30 to 4.58 | <0.001 | 3.83 | 3.33 to 4.40 | <0.001 |
| Pathologic N stage (ref: N0) | ||||||
| N+ | 0.41 | 0.37 to 0.45 | <0.001 | 0.37 | 0.34 to 0.40 | <0.001 |
| Other/Unknown | 0.75 | 0.67 to 0.84 | <0.001 | 1.05 | 0.96 to 1.15 | 0.305 |
| Pathologic M stage (ref: M0) | ||||||
| M+ | 3.39 | 2.35 to 4.91 | <0.001 | 4.29 | 3.14 to 5.87 | <0.001 |
| Other/Unknown | 1.57 | 1.34 to 1.85 | <0.001 | 1.31 | 1.15 to 1.50 | <0.001 |
Disclaimer/Publisher’s Note: The statements, opinions and data contained in all publications are solely those of the individual author(s) and contributor(s) and not of MDPI and/or the editor(s). MDPI and/or the editor(s) disclaim responsibility for any injury to people or property resulting from any ideas, methods, instructions or products referred to in the content. |
© 2025 by the authors. Licensee MDPI, Basel, Switzerland. This article is an open access article distributed under the terms and conditions of the Creative Commons Attribution (CC BY) license (https://creativecommons.org/licenses/by/4.0/).
Share and Cite
Lee, M.L.; Finegersh, A.; Chen, M.M. Impact of the COVID-19 Pandemic on the Treatment of Head and Neck Cancers. J. Clin. Med. 2025, 14, 1424. https://doi.org/10.3390/jcm14051424
Lee ML, Finegersh A, Chen MM. Impact of the COVID-19 Pandemic on the Treatment of Head and Neck Cancers. Journal of Clinical Medicine. 2025; 14(5):1424. https://doi.org/10.3390/jcm14051424
Chicago/Turabian StyleLee, Max L., Andrey Finegersh, and Michelle M. Chen. 2025. "Impact of the COVID-19 Pandemic on the Treatment of Head and Neck Cancers" Journal of Clinical Medicine 14, no. 5: 1424. https://doi.org/10.3390/jcm14051424
APA StyleLee, M. L., Finegersh, A., & Chen, M. M. (2025). Impact of the COVID-19 Pandemic on the Treatment of Head and Neck Cancers. Journal of Clinical Medicine, 14(5), 1424. https://doi.org/10.3390/jcm14051424