
Integration of FTIR Spectroscopy and Machine Learning for Kidney Allograft Rejection: A Complementary Diagnostic Tool
 ,
,  ,
,  , , and
Abstract
1. Introduction
2. Materials and Methods
2.1. Study Population
2.2. FTIR Spectra Acquisition
2.3. Data Analysis
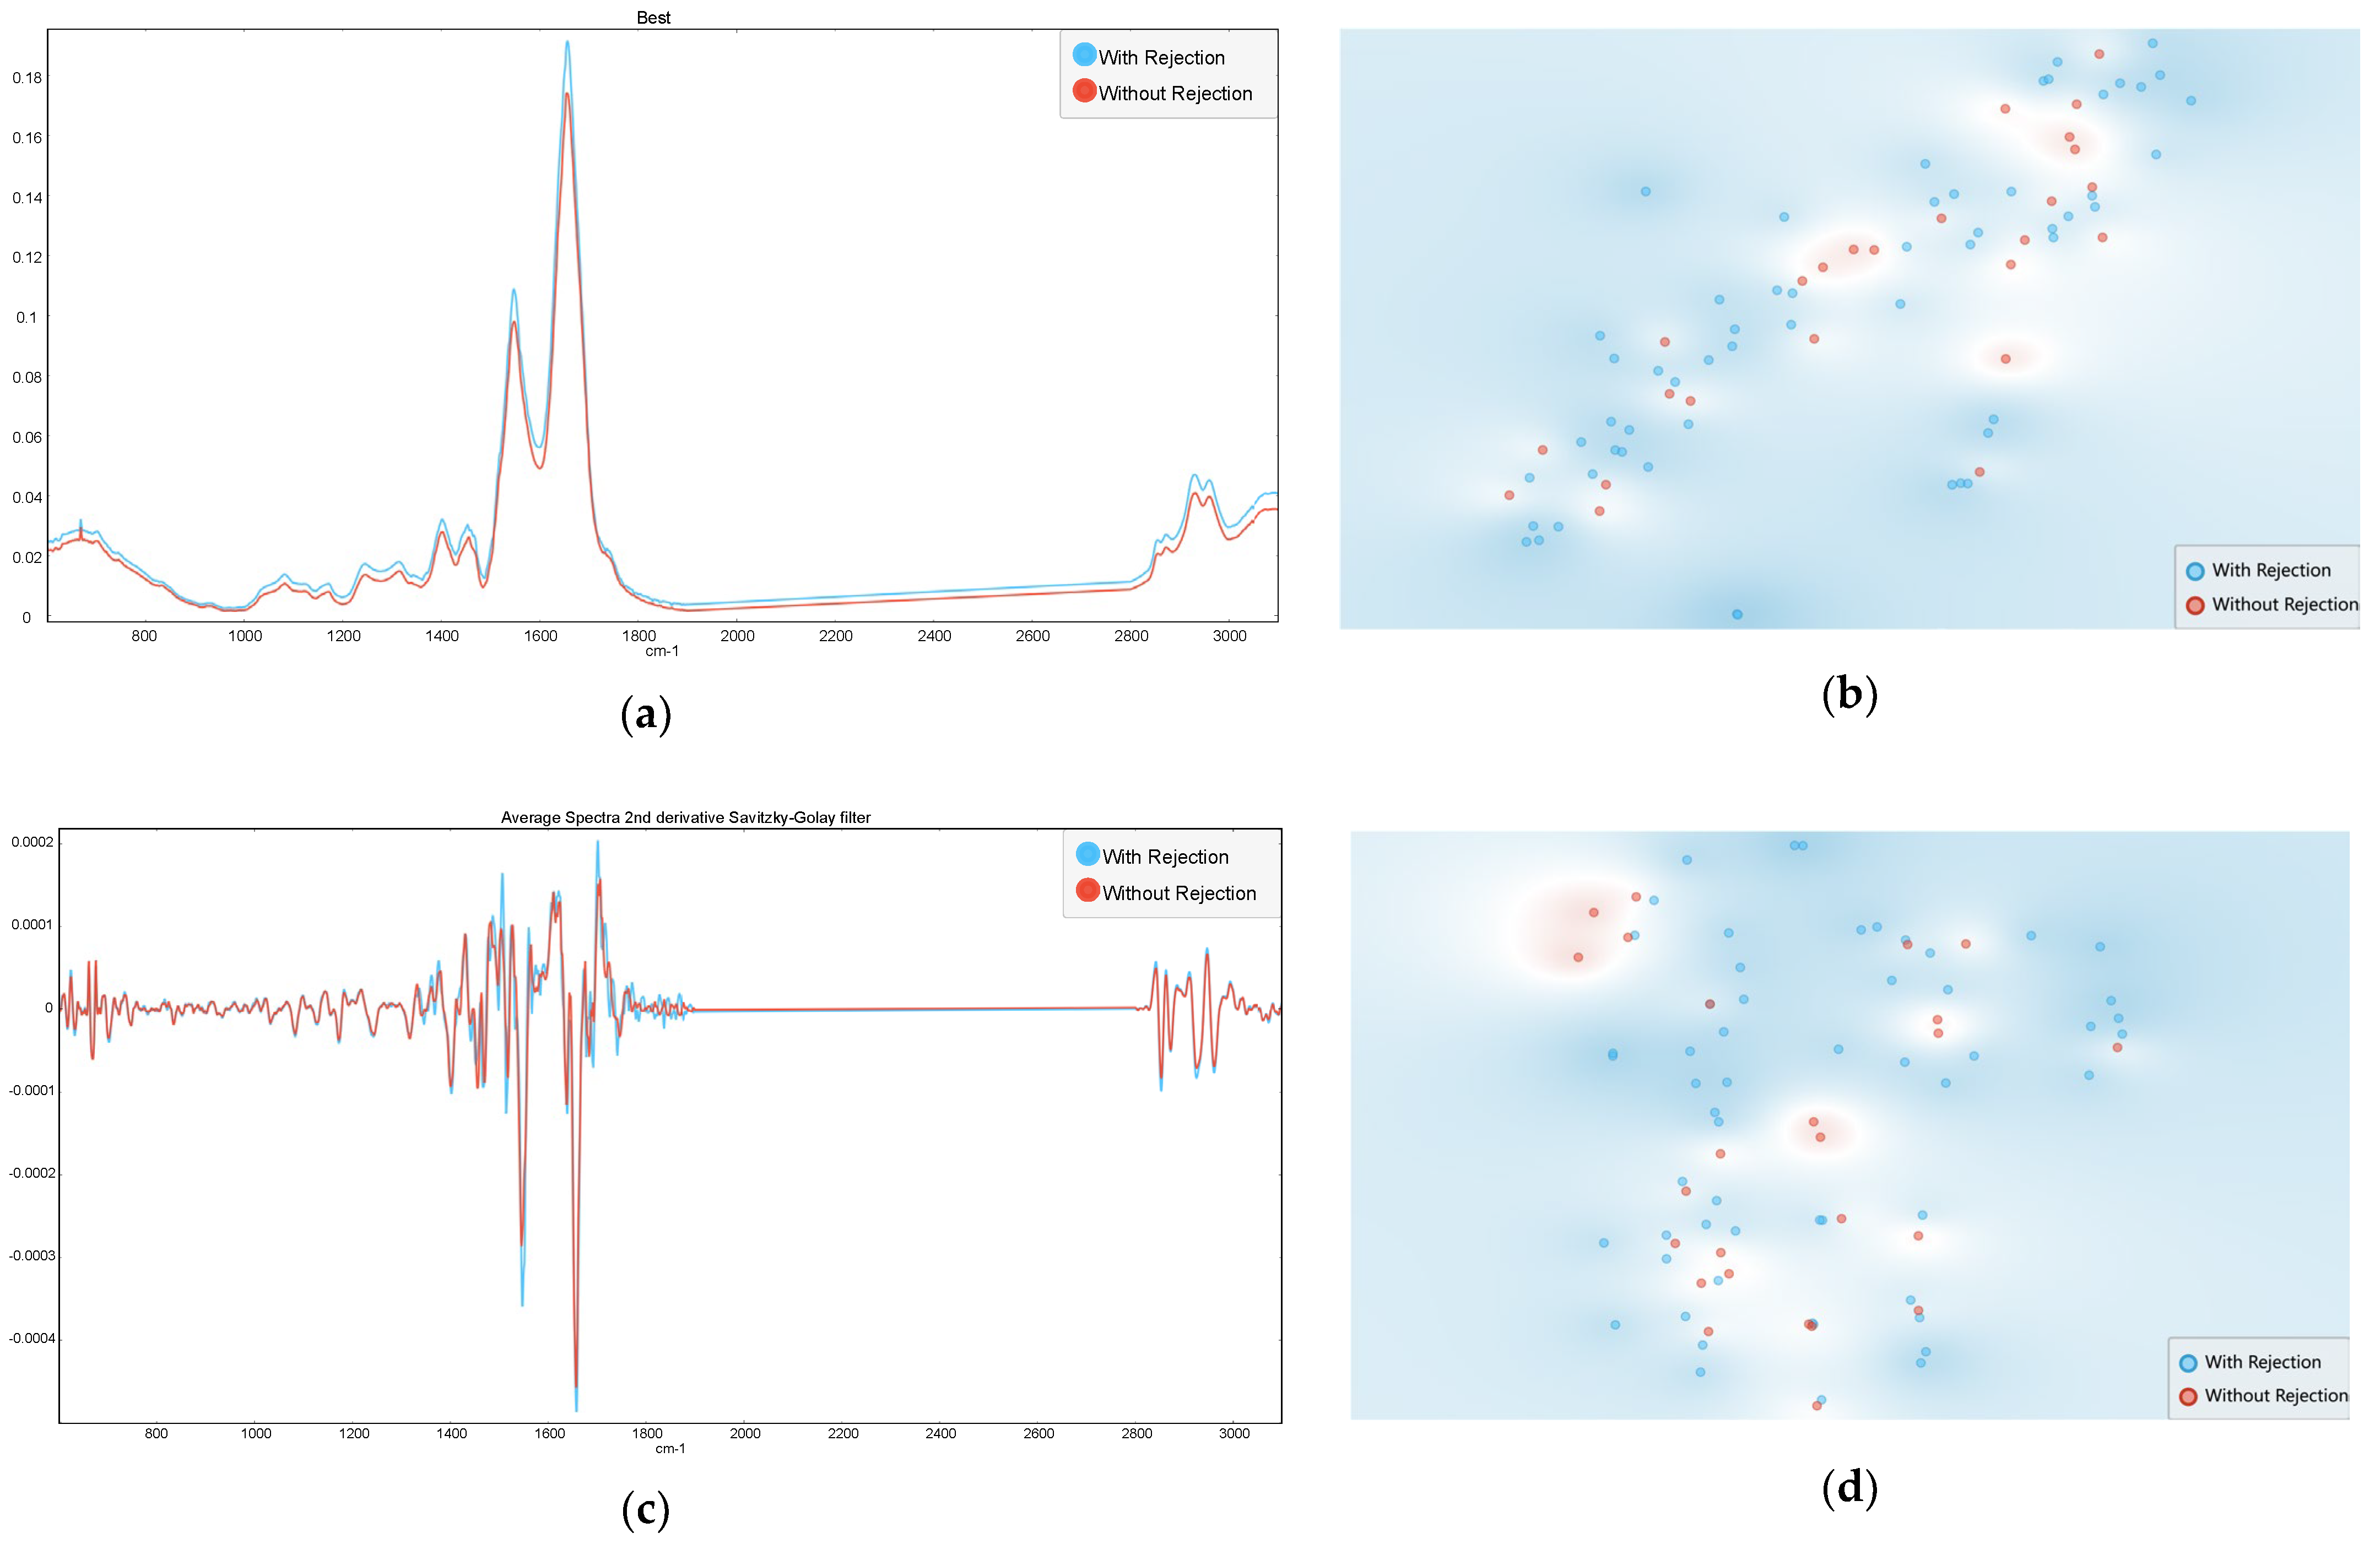
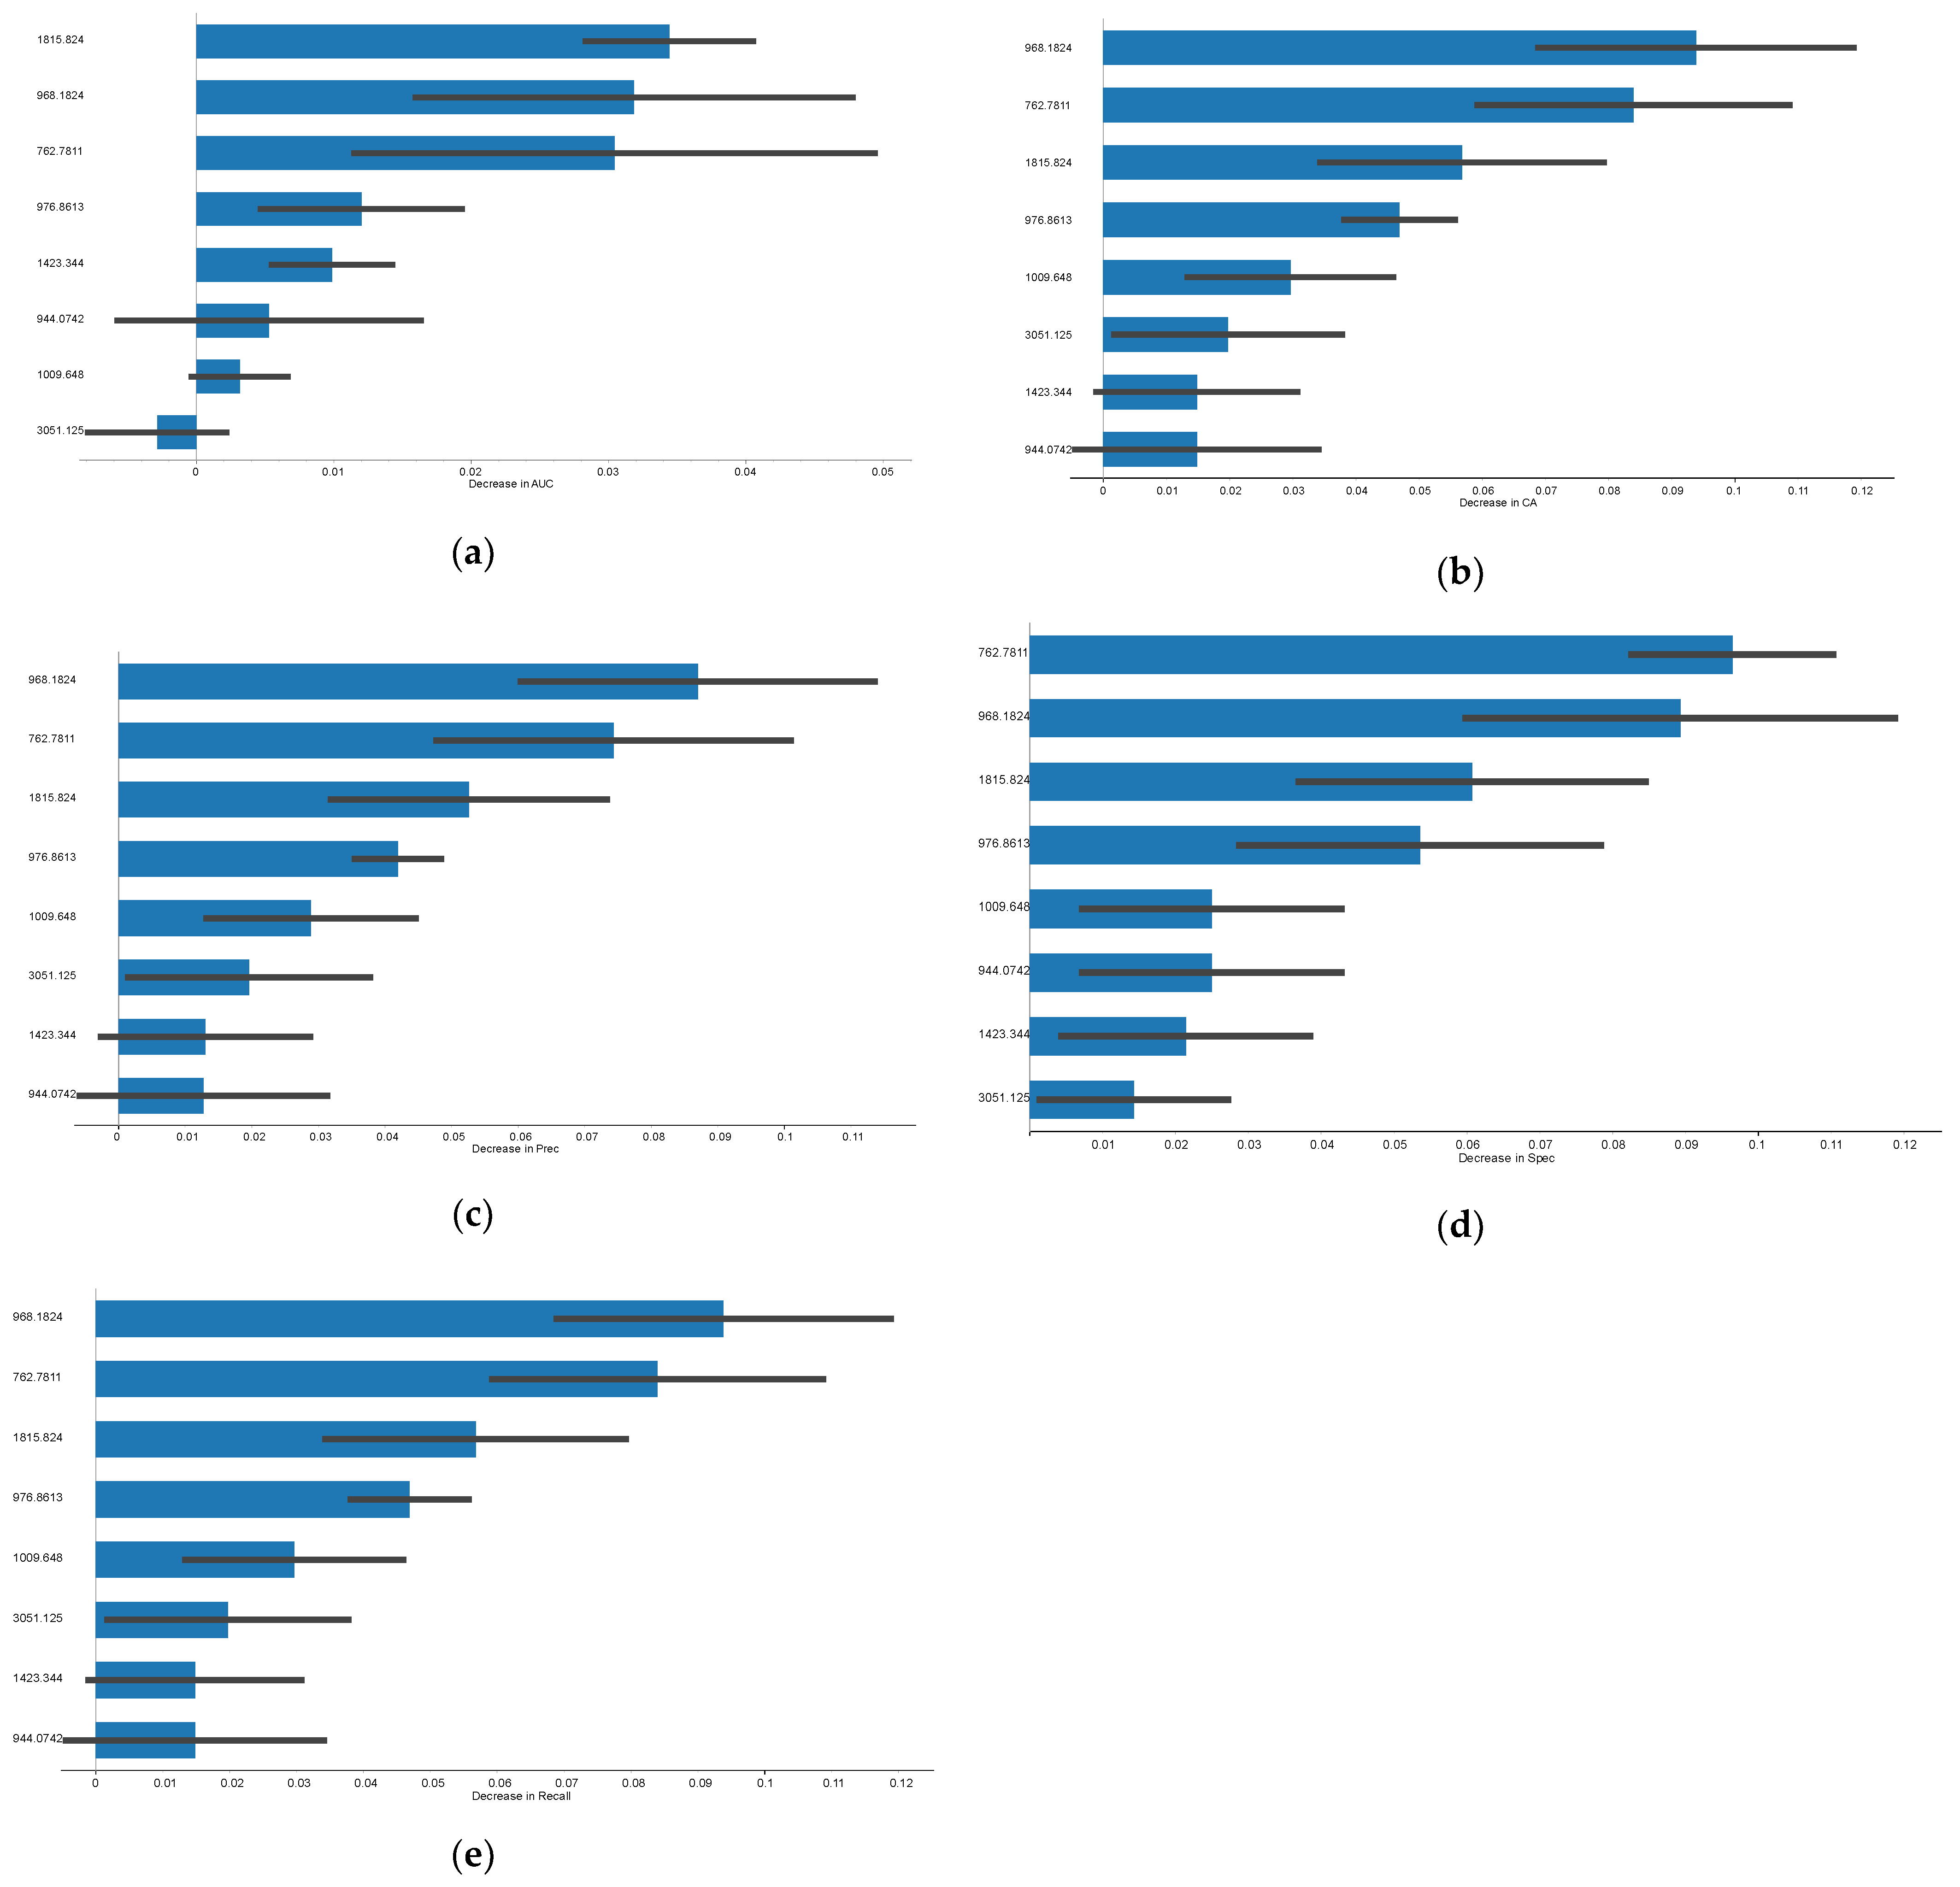
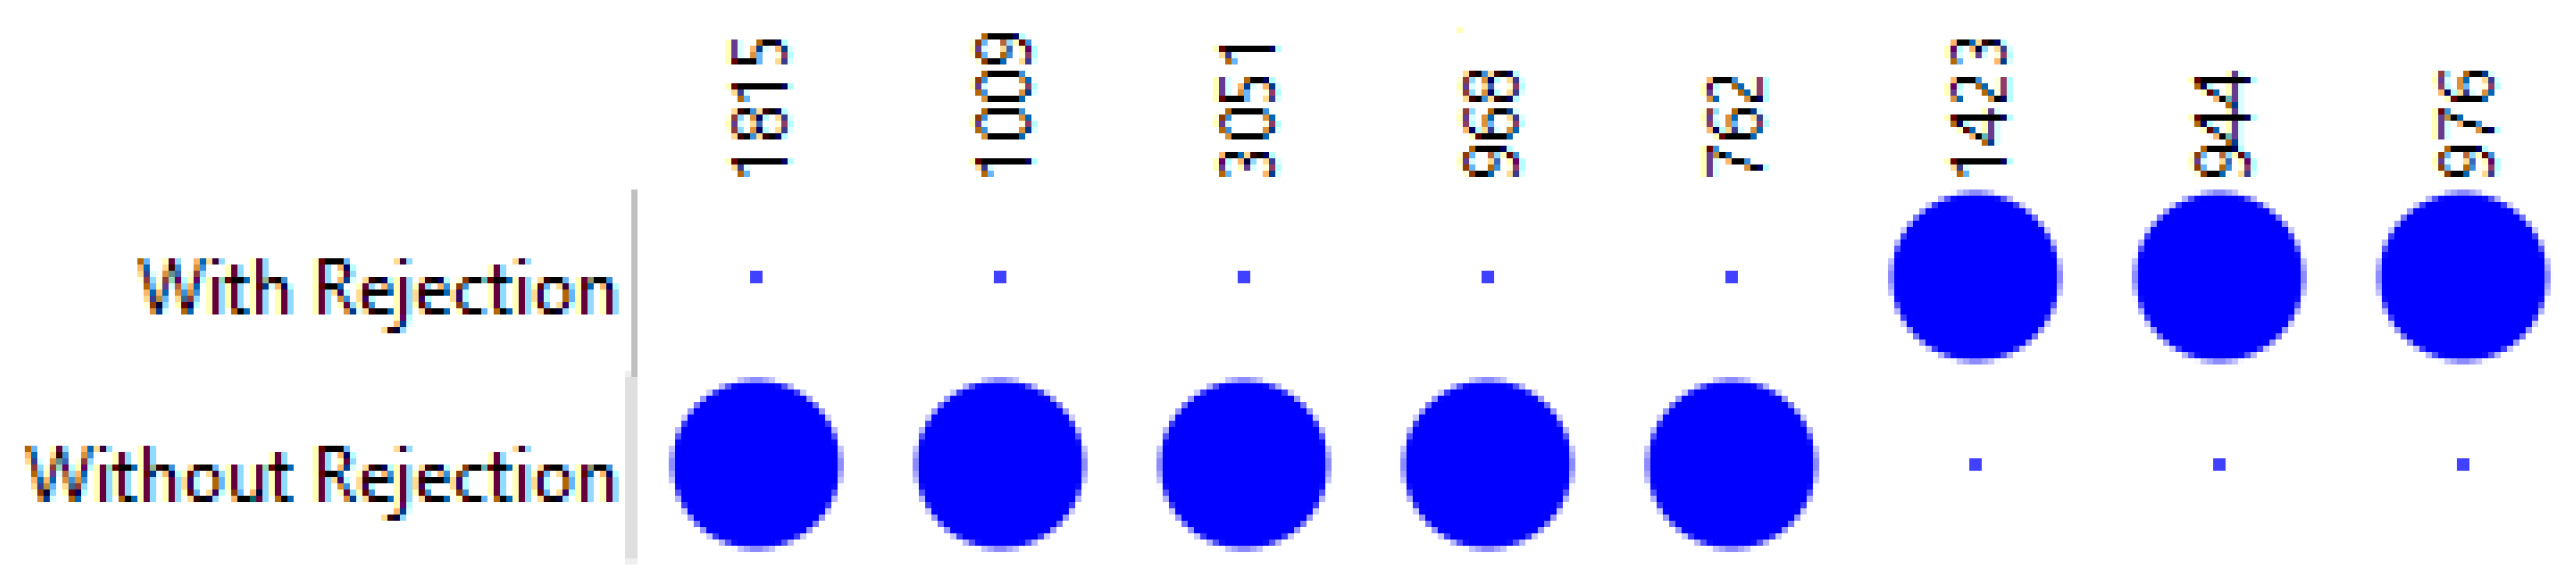
3. Results
3.1. Rejection Versus Non-Rejection
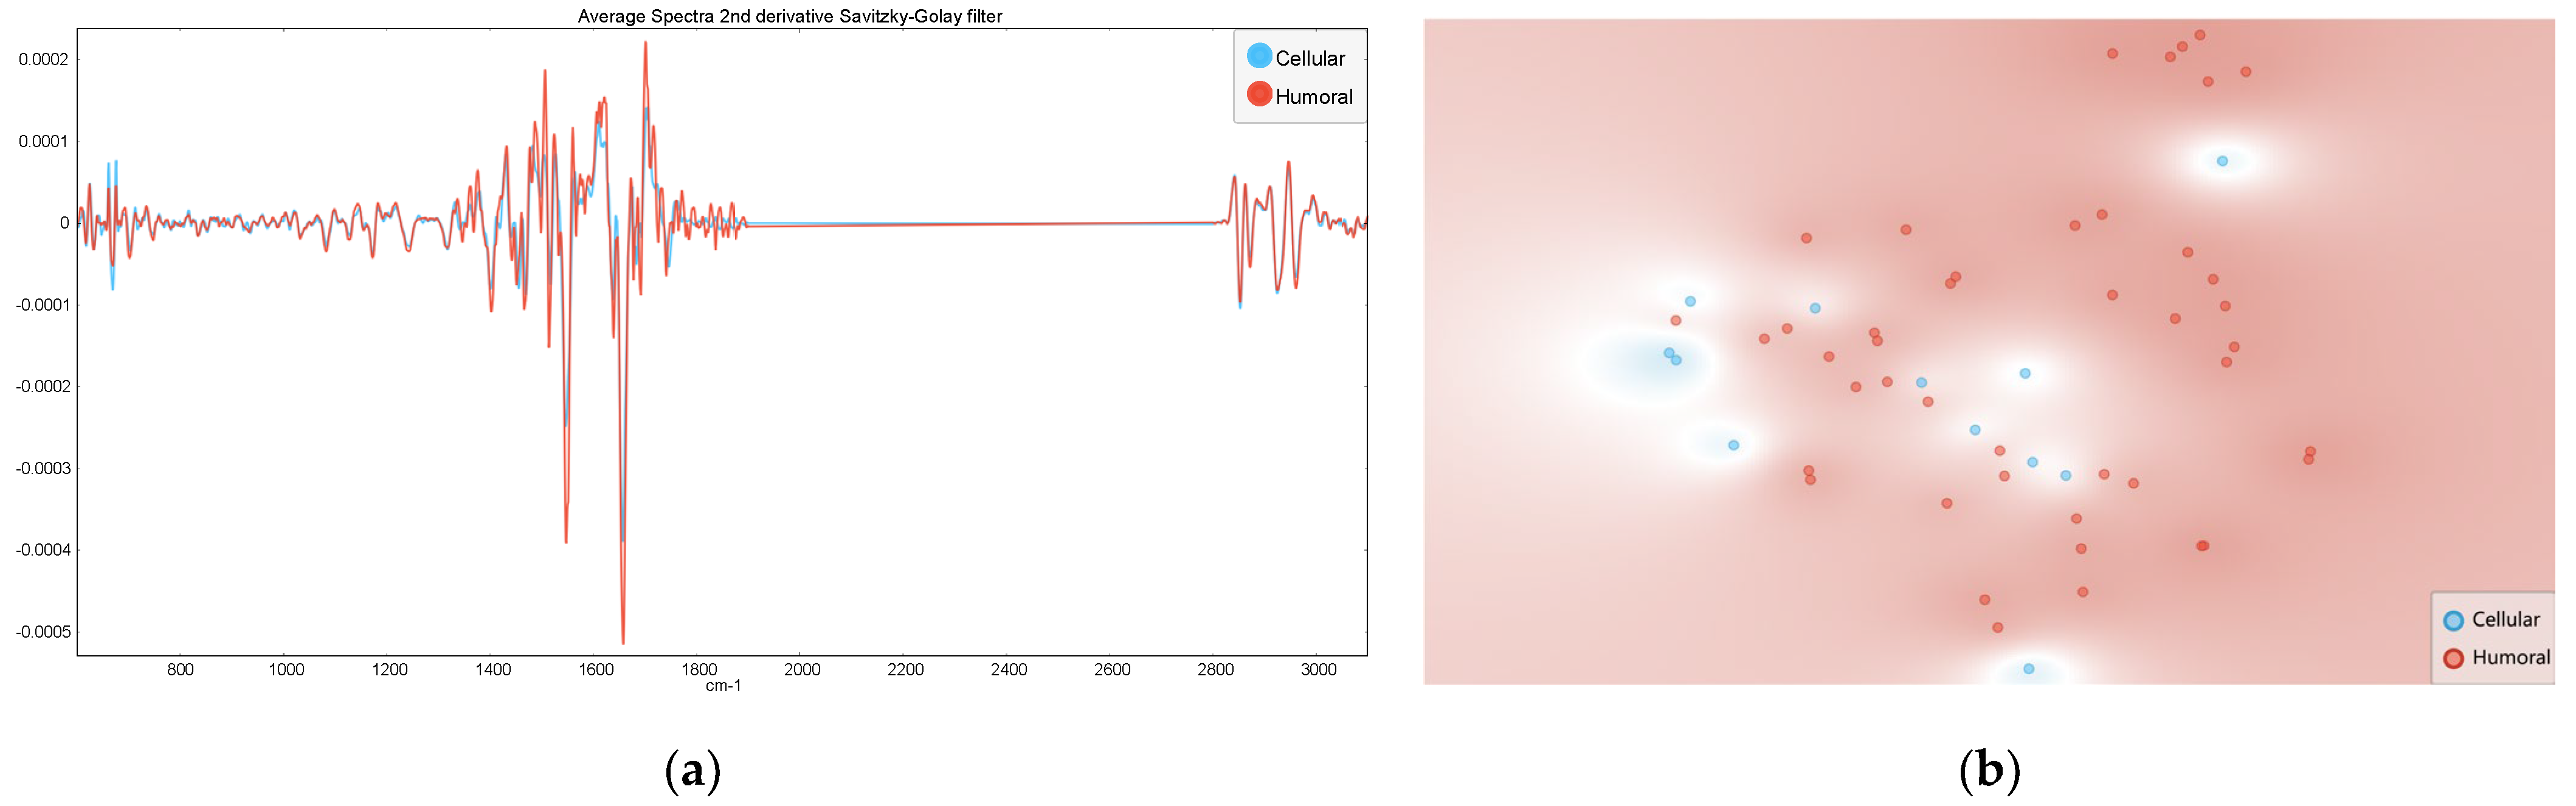
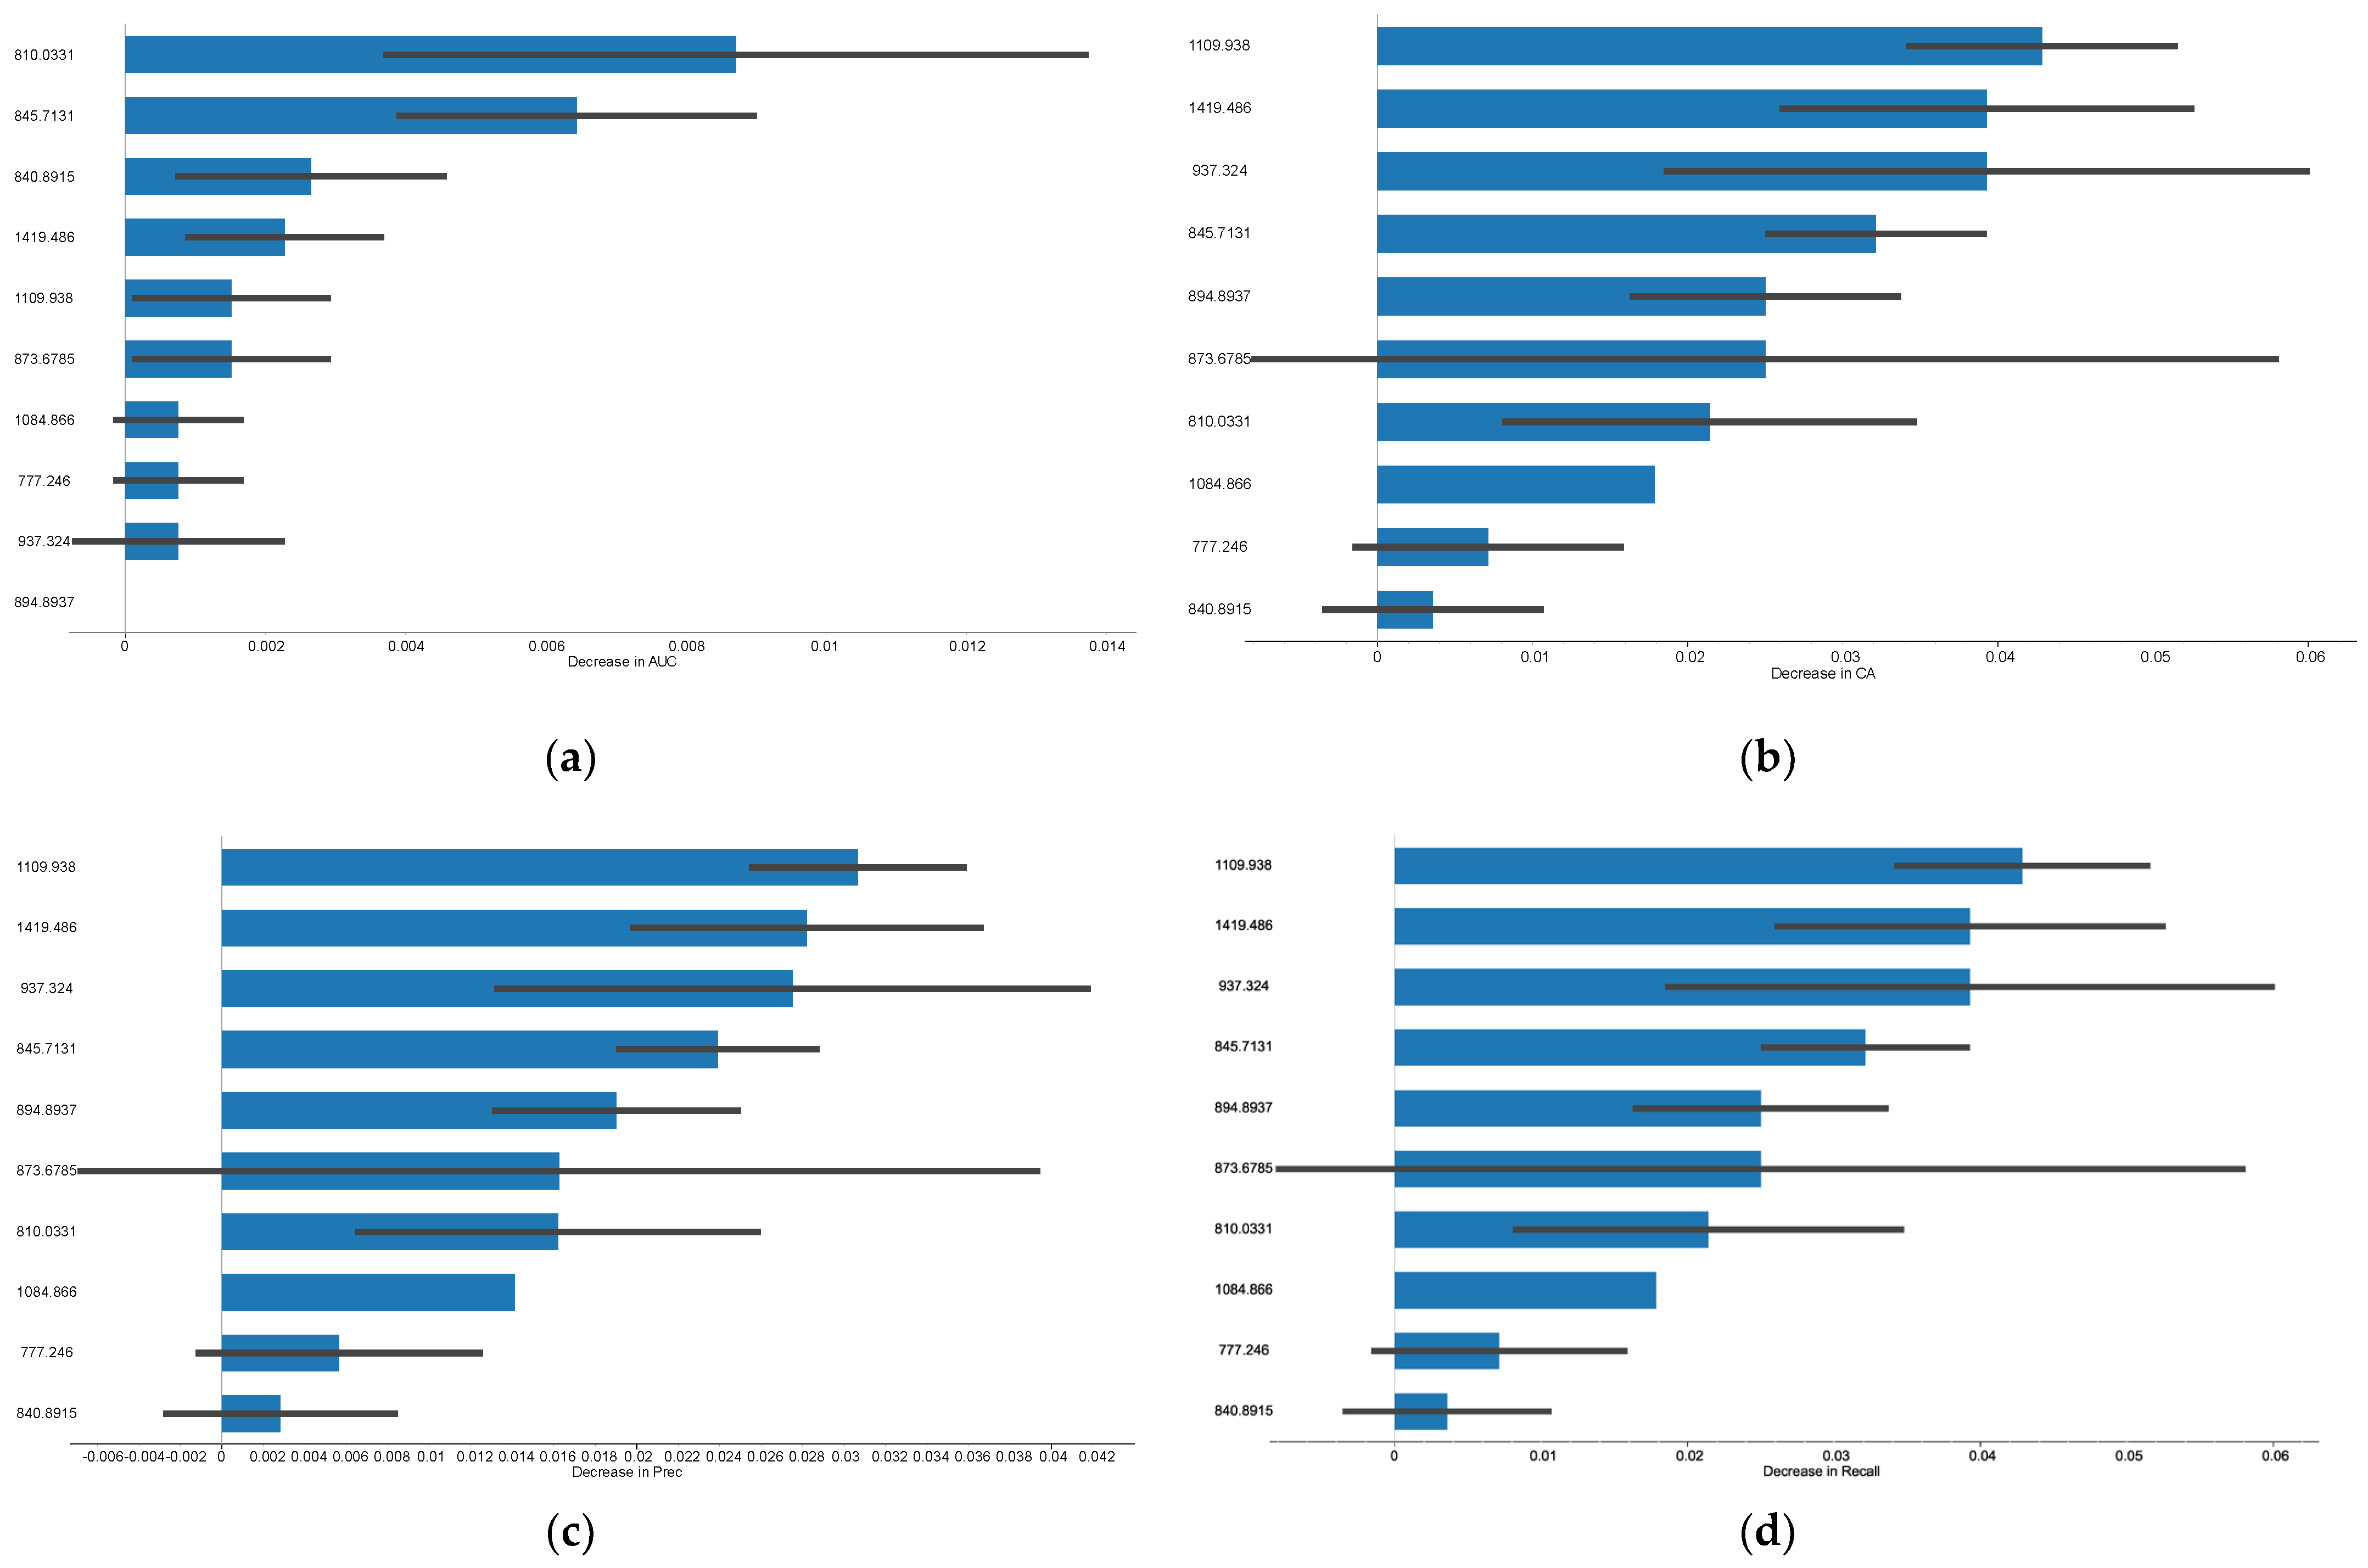
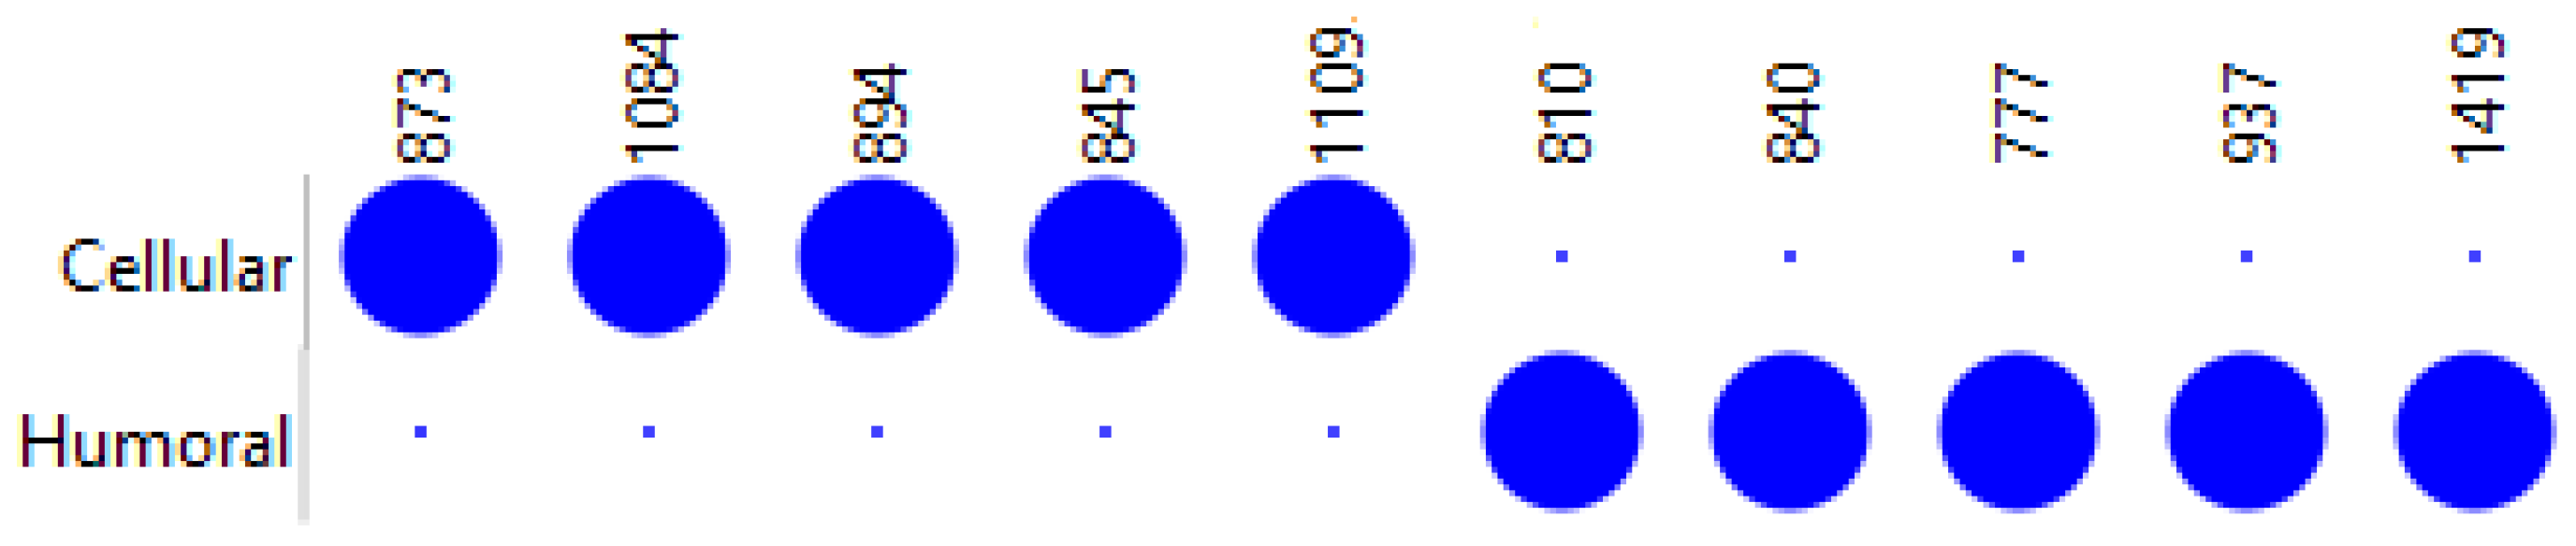
3.2. Humoral Versus Cellular Rejection
4. Discussion
5. Study Limitations and Directions for Future Research
6. Conclusions
7. Patents
Author Contributions
Funding
Institutional Review Board Statement
Informed Consent Statement
Data Availability Statement
Conflicts of Interest
References
- Abecassis, M.; Bartlett, S.T.; Collins, A.J.; Davis, C.L.; Delmonico, F.L.; Friedewald, J.J.; Hays, R.; Howard, A.; Jones, E.; Leichtman, A.B.; et al. Kidney Transplantation as Primary Therapy for End-Stage Renal Disease: A National Kidney Foundation/Kidney Disease Outcomes Quality Initiative (NKF/KDOQITM) Conference. Clin. J. Am. Soc. Nephrol. 2008, 3, 471–480. [Google Scholar] [CrossRef] [PubMed]
- McKeaveney, C.; Noble, H.; Courtney, A.; Griffin, S.; Gill, P.; Johnston, W.; Maxwell, A.; Teasdale, F.; Reid, J. Dialysis, Distress, and Difficult Conversations: Living with a Kidney Transplant. Healthcare 2022, 10, 1177. [Google Scholar] [CrossRef] [PubMed]
- Chadban, S.J.; Ahn, C.; Axelrod, D.A.; Foster, B.J.; Kasiske, B.L.; Kher, V.; Kumar, D.; Oberbauer, R.; Pascual, J.; Pilmore, H.L.; et al. KDIGO Clinical Practice Guideline on the Evaluation and Management of Candidates for Kidney Transplantation. Transplantation 2020, 104, S11–S103. [Google Scholar] [CrossRef]
- Legendre, C.; Canaud, G.; Martinez, F. Factors Influencing Long-Term Outcome after Kidney Transplantation. Transpl. Int. 2014, 27, 19–27. [Google Scholar] [CrossRef]
- Oweira, H.; Ramouz, A.; Ghamarnejad, O.; Khajeh, E.; Ali-Hasan-Al-Saegh, S.; Nikbakhsh, R.; Reißfelder, C.; Rahbari, N.; Mehrabi, A.; Sadeghi, M. Risk Factors of Rejection in Renal Transplant Recipients: A Narrative Review. J. Clin. Med. 2022, 11, 1392. [Google Scholar] [CrossRef]
- Lebranchu, Y.; Baan, C.; Biancone, L.; Legendre, C.; Morales, J.M.; Naesens, M.; Thomusch, O.; Friend, P. Pretransplant Identification of Acute Rejection Risk Following Kidney Transplantation. Transpl. Int. 2014, 27, 129–138. [Google Scholar] [CrossRef]
- Callemeyn, J.; Lamarthée, B.; Koenig, A.; Koshy, P.; Thaunat, O.; Naesens, M. Allorecognition and the Spectrum of Kidney Transplant Rejection. Kidney Int. 2022, 101, 692–710. [Google Scholar] [CrossRef]
- Halloran, P.F. T Cell-mediated Rejection of Kidney Transplants: A Personal Viewpoint. Am. J. Transplant. 2010, 10, 1126–1134. [Google Scholar] [CrossRef]
- Hara, S. Cell Mediated Rejection Revisited: Past, Current, and Future Directions. Nephrology 2018, 23, 45–51. [Google Scholar] [CrossRef]
- Tamargo, C.L.; Kant, S. Pathophysiology of Rejection in Kidney Transplantation. J. Clin. Med. 2023, 12, 4130. [Google Scholar] [CrossRef]
- Wiebe, C.; Rush, D.N.; Gibson, I.W.; Pochinco, D.; Birk, P.E.; Goldberg, A.; Blydt-Hansen, T.; Karpinski, M.; Shaw, J.; Ho, J.; et al. Evidence for the Alloimmune Basis and Prognostic Significance of Borderline T Cell–Mediated Rejection. Am. J. Transplant. 2020, 20, 2499–2508. [Google Scholar] [CrossRef] [PubMed]
- Ho, J.; Okoli, G.N.; Rabbani, R.; Lam, O.L.T.; Reddy, V.K.; Askin, N.; Rampersad, C.; Trachtenberg, A.; Wiebe, C.; Nickerson, P.; et al. Effectiveness of T Cell–Mediated Rejection Therapy: A Systematic Review and Meta-Analysis. Am. J. Transplant. 2022, 22, 772–785. [Google Scholar] [CrossRef]
- Rodriguez-Ramirez, S.; Al Jurdi, A.; Konvalinka, A.; Riella, L.V. Antibody-Mediated Rejection: Prevention, Monitoring and Treatment Dilemmas. Curr. Opin. Organ Transplant. 2022, 27, 405–414. [Google Scholar] [CrossRef] [PubMed]
- Llinàs-Mallol, L.; Raïch-Regué, D.; Pascual, J.; Crespo, M. Alloimmune Risk Assessment for Antibody-Mediated Rejection in Kidney Transplantation: A Practical Proposal. Transplant. Rev. 2023, 37, 100745. [Google Scholar] [CrossRef]
- Gatault, P.; Büchler, M. Unraveling Complexity of Antibody-Mediated Rejections, the Mandatory Way towards an Accurate Diagnosis and a Personalized Treatment. Presse Méd. 2022, 51, 104141. [Google Scholar] [CrossRef]
- Lefaucheur, C.; Louis, K.; Morris, A.B.; Taupin, J.-L.; Nickerson, P.; Tambur, A.R.; Gebel, H.M.; Reed, E.F.; Kobashigawa, J.A.; Chandraker, A.; et al. Clinical Recommendations for Posttransplant Assessment of Anti–HLA (Human Leukocyte Antigen) Donor-Specific Antibodies: A Sensitization in Transplantation: Assessment of Risk Consensus Document. Am. J. Transplant. 2023, 23, 115–132. [Google Scholar] [CrossRef]
- Konvalinka, A.; Tinckam, K. Utility of HLA Antibody Testing in Kidney Transplantation. J. Am. Soc. Nephrol. 2015, 26, 1489–1502. [Google Scholar] [CrossRef]
- Betjes, M.G.H.; Roelen, D.L.; van Agteren, M.; Kal-van Gestel, J. Causes of Kidney Graft Failure in a Cohort of Recipients with a Very Long-Time Follow-Up After Transplantation. Front. Med. 2022, 9, 842419. [Google Scholar] [CrossRef]
- Najafian, B.; Lusco, M.A.; Alpers, C.E.; Fogo, A.B. Approach to Kidney Biopsy: Core Curriculum 2022. Am. J. Kidney Dis. 2022, 80, 119–131. [Google Scholar] [CrossRef]
- Ramalhete, L.M.; Araújo, R.; Ferreira, A.; Calado, C.R.C. Proteomics for Biomarker Discovery for Diagnosis and Prognosis of Kidney Transplantation Rejection. Proteomes 2022, 10, 24. [Google Scholar] [CrossRef]
- Rogulska, K.; Wojciechowska-Koszko, I.; Dołęgowska, B.; Kwiatkowska, E.; Roszkowska, P.; Kapczuk, P.; Kosik-Bogacka, D. The Most Promising Biomarkers of Allogeneic Kidney Transplant Rejection. J. Immunol. Res. 2022, 2022, 6572338. [Google Scholar] [CrossRef]
- Huang, S.C.; Lin, Y.J.; Wen, M.C.; Lin, W.C.; Fang, P.W.; Liang, P.I.; Chuang, H.W.; Chien, H.P.; Chen, T.D. Unsatisfactory Reproducibility of Interstitial Inflammation Scoring in Allograft Kidney Biopsy. Sci. Rep. 2023, 13, 7095. [Google Scholar] [CrossRef]
- Huang, E.; Mengel, M.; Clahsen-van Groningen, M.C.; Jackson, A.M. Diagnostic Potential of Minimally Invasive Biomarkers: A Biopsy-Centered Viewpoint From the Banff Minimally Invasive Diagnostics Working Group. Transplantation 2023, 107, 45–52. [Google Scholar] [CrossRef] [PubMed]
- Ramalhete, L.; Araújo, R.; Ferreira, A.; Calado, C.R.C. Exosomes and Microvesicles in Kidney Transplantation: The Long Road from Trash to Gold. Pathology 2024, 56, 1–10. [Google Scholar] [CrossRef]
- Singh, N.; Samant, H.; Hawxby, A.; Samaniego, M.D. Biomarkers of Rejection in Kidney Transplantation. Curr. Opin. Organ Transplant. 2019, 24, 103–110. [Google Scholar] [CrossRef] [PubMed]
- Beck, J.; Oellerich, M.; Schulz, U.; Schauerte, V.; Reinhard, L.; Fuchs, U.; Knabbe, C.; Zittermann, A.; Olbricht, C.; Gummert, J.F.; et al. Donor-Derived Cell-Free DNA Is a Novel Universal Biomarker for Allograft Rejection in Solid Organ Transplantation. Transplant. Proc. 2015, 47, 2400–2403. [Google Scholar] [CrossRef]
- Eikmans, M.; Gielis, E.M.; Ledeganck, K.J.; Yang, J.; Abramowicz, D.; Claas, F.F.J. Non-Invasive Biomarkers of Acute Rejection in Kidney Transplantation: Novel Targets and Strategies. Front. Med. 2019, 5, 358. [Google Scholar] [CrossRef]
- Clarke, W.; Silverman, B.C.; Zhang, Z.; Chan, D.W.; Klein, A.S.; Molmenti, E.P. Characterization of Renal Allograft Rejection by Urinary Proteomic Analysis. Ann. Surg. 2003, 237, 660–665. [Google Scholar] [CrossRef]
- Cunha, B.R.; Ramalhete, L.; Fonseca, L.P.; Calado, C.R.C. Fourier-Transform Mid-Infrared (FT-MIR) Spectroscopy in Biomedicine. In Essential Techniques for Medical and Life Scientists: A Guide to Contemporary Methods and Current Applications—Part II; Tutar, Y., Ed.; Bentham Science Publishers: Soest, The Netherlands, 2020; ISBN 9789811464867. [Google Scholar]
- Araújo, R.; Ramalhete, L.; Ribeiro, E.; Calado, C. Plasma versus Serum Analysis by FTIR Spectroscopy to Capture the Human Physiological State. BioTech 2022, 11, 56. [Google Scholar] [CrossRef]
- Ramalhete, L.; Araújo, R.; Calado, C.R.C. Discriminating B and T-Lymphocyte from Its Molecular Profile Acquired in a Label-Free and High-Throughput Method. Vib. Spectrosc. 2020, 111, 103177. [Google Scholar] [CrossRef]
- Huber, M.; Kepesidis, K.V.; Voronina, L.; Božić, M.; Trubetskov, M.; Harbeck, N.; Krausz, F.; Žigman, M. Stability of Person-Specific Blood-Based Infrared Molecular Fingerprints Opens up Prospects for Health Monitoring. Nat. Commun. 2021, 12, 1511. [Google Scholar] [CrossRef] [PubMed]
- Ladeira, C.; Araújo, R.; Ramalhete, L.; Teixeira, H.; Calado, C.R.C. Blood Molecular Profile to Predict Genotoxicity from Exposure to Antineoplastic Drugs. Mutat. Res./Genet. Toxicol. Environ. Mutagen. 2023, 891, 503681. [Google Scholar] [CrossRef] [PubMed]
- Roy, S.; Hauer, J.; Maiti, K.S. Development of Non-Invasive Diagnosis Based on FTIR Spectroscopy. Vib. Spectrosc. 2024, 134, 103724. [Google Scholar] [CrossRef]
- Khanmohammadi, M.; Garmarudi, A.B.; Ramin, M.; Ghasemi, K. Diagnosis of Renal Failure by Infrared Spectrometric Analysis of Human Serum Samples and Soft Independent Modeling of Class Analogy. Microchem. J. 2013, 106, 67–72. [Google Scholar] [CrossRef]
- Ramalhete, L.; Araújo, R.; Ferreira, A.; Calado, C.R.C. Label-Free Discrimination of T and B Lymphocyte Activation Based on Vibrational Spectroscopy—A Machine Learning Approach. Vib. Spectrosc. 2023, 126, 103529. [Google Scholar] [CrossRef]
- Ramalhete, L.; Vieira, M.B.; Araújo, R.; Vigia, E.; Aires, I.; Ferreira, A.; Calado, C.R.C. Predicting Cellular Rejection of Renal Allograft Based on the Serum Proteomic Fingerprint. Int. J. Mol. Sci. 2024, 25, 3844. [Google Scholar] [CrossRef]
- Araújo, R.; Ramalhete, L.; Viegas, A.; Von Rekowski, C.P.; Fonseca, T.A.H.; Calado, C.R.C.; Bento, L. Simplifying Data Analysis in Biomedical Research: An Automated, User-Friendly Tool. Methods Protoc. 2024, 7, 36. [Google Scholar] [CrossRef]
- Van der Maaten, L.; Hinton, G. Visualizing Data Using T-SNE. J. Mach. Learn. Res. 2008, 9, 2579–2605. [Google Scholar]
- Oliveira, F.H.M.; Machado, A.R.P.; Andrade, A.O. On the Use of t-Distributed Stochastic Neighbor Embedding for Data Visualization and Classification of Individuals with Parkinson’s Disease. Comput. Math. Methods Med. 2018, 2018, 8019232. [Google Scholar] [CrossRef]
- Vigia, E.; Ramalhete, L.; Ribeiro, R.; Barros, I.; Chumbinho, B.; Filipe, E.; Pena, A.; Bicho, L.; Nobre, A.; Carrelha, S.; et al. Pancreas Rejection in the Artificial Intelligence Era: New Tool for Signal Patients at Risk. J. Pers. Med. 2023, 13, 1071. [Google Scholar] [CrossRef]
- Taheri, S.; Mammadov, M. Learning the Naive Bayes Classifier with Optimization Models. Int. J. Appl. Math. Comput. Sci. 2013, 23, 787–795. [Google Scholar] [CrossRef]
- Brazier, F.; Jouffroy, J.; Martinez, F.; Nguyen-Khoa, T.; Anglicheau, D.; Legendre, C.; Neuraz, A.; Prié, D.; Bienaimé, F. Association of Blood Bicarbonate and PH with Mineral Metabolism Disturbance and Outcome after Kidney Transplantation. Am. J. Transplant. 2020, 20, 1063–1075. [Google Scholar] [CrossRef] [PubMed]
- Demšar, J.; Curk, T.; Erjavec, A.; Gorup, Č.; Hočevar, T.; Milutinovič, M.; Možina, M.; Polajnar, M.; Toplak, M.; Starič, A.; et al. Orange: Data Mining Toolbox in Python. J. Mach. Learn. Res. 2013, 14, 2349–2353. [Google Scholar]
- Fadlelmoula, A.; Catarino, S.O.; Minas, G.; Carvalho, V. A Review of Machine Learning Methods Recently Applied to FTIR Spectroscopy Data for the Analysis of Human Blood Cells. Micromachines 2023, 14, 1145. [Google Scholar] [CrossRef]
- Nejat, M.; Pickering, J.W.; Walker, R.J.; Westhuyzen, J.; Shaw, G.M.; Frampton, C.M.; Endre, Z.H. Urinary Cystatin C Is Diagnostic of Acute Kidney Injury and Sepsis, and Predicts Mortality in the Intensive Care Unit. Crit. Care 2010, 14, R85. [Google Scholar] [CrossRef] [PubMed]
- Merhi, B.; Bayliss, G.; Gohh, R.Y. Role for Urinary Biomarkers in Diagnosis of Acute Rejection in the Transplanted Kidney. World J. Transplant. 2015, 5, 251–261. [Google Scholar] [CrossRef]
- Naesens, M.; Lerut, E.; Emonds, M.-P.; Herelixka, A.; Evenepoel, P.; Claes, K.; Bammens, B.; Sprangers, B.; Meijers, B.; Jochmans, I.; et al. Proteinuria as a Noninvasive Marker for Renal Allograft Histology and Failure. J. Am. Soc. Nephrol. 2016, 27, 281–292. [Google Scholar] [CrossRef]
- Randhawa, P.S. The Molecular Microscope Diagnostic System (MMDx) in Transplantation: A Pathologist’s Perspective. Am. J. Transplant. 2020, 20, 1965–1966. [Google Scholar] [CrossRef]
- Han, H.S.; Lubetzky, M.L. Immune Monitoring of Allograft Status in Kidney Transplant Recipients. Front. Nephrol. 2023, 3, 1293907. [Google Scholar] [CrossRef]
- Chang, J.; Alvarado Verduzco, H.; Toma, K.; Sritharan, S.; Mohan, S.; Husain, S.A. Donor-derived Cell-free DNA and Renal Allograft Rejection in Surveillance Biopsies and Indication Biopsies. Clin. Transplant. 2022, 36, e14561. [Google Scholar] [CrossRef]
- Mayer, K.A.; Doberer, K.; Tillgren, A.; Viard, T.; Haindl, S.; Krivanec, S.; Reindl-Schwaighofer, R.; Eder, M.; Eskandary, F.; Casas, S.; et al. Diagnostic Value of Donor-derived Cell-free DNA to Predict Antibody-mediated Rejection in Donor-specific Antibody-positive Renal Allograft Recipients. Transpl. Int. 2021, 34, 1689–1702. [Google Scholar] [CrossRef]
- Gielis, E.M.; Ledeganck, K.J.; Dendooven, A.; Meysman, P.; Beirnaert, C.; Laukens, K.; De Schrijver, J.; Van Laecke, S.; Van Biesen, W.; Emonds, M.-P.; et al. The Use of Plasma Donor-Derived, Cell-Free DNA to Monitor Acute Rejection after Kidney Transplantation. Nephrol. Dial. Transplant. 2020, 35, 714–721. [Google Scholar] [CrossRef] [PubMed]
- Oellerich, M.; Shipkova, M.; Asendorf, T.; Walson, P.D.; Schauerte, V.; Mettenmeyer, N.; Kabakchiev, M.; Hasche, G.; Gröne, H.-J.; Friede, T.; et al. Absolute Quantification of Donor-Derived Cell-Free DNA as a Marker of Rejection and Graft Injury in Kidney Transplantation: Results from a Prospective Observational Study. Am. J. Transplant. 2019, 19, 3087–3099. [Google Scholar] [CrossRef] [PubMed]
- Reeve, J.; Böhmig, G.A.; Eskandary, F.; Einecke, G.; Gupta, G.; Madill-Thomsen, K.; Mackova, M.; Halloran, P.F. Generating Automated Kidney Transplant Biopsy Reports Combining Molecular Measurements with Ensembles of Machine Learning Classifiers. Am. J. Transplant. 2019, 19, 2719–2731. [Google Scholar] [CrossRef]
- Loupy, A.; Lefaucheur, C.; Vernerey, D.; Chang, J.; Hidalgo, L.G.; Beuscart, T.; Verine, J.; Aubert, O.; Dubleumortier, S.; Duong van Huyen, J.-P.; et al. Molecular Microscope Strategy to Improve Risk Stratification in Early Antibody-Mediated Kidney Allograft Rejection. J. Am. Soc. Nephrol. 2014, 25, 2267–2277. [Google Scholar] [CrossRef]
- Halloran, P.F.; Reeve, J.; Akalin, E.; Aubert, O.; Bohmig, G.A.; Brennan, D.; Bromberg, J.; Einecke, G.; Eskandary, F.; Gosset, C.; et al. Real Time Central Assessment of Kidney Transplant Indication Biopsies by Microarrays: The INTERCOMEX Study. Am. J. Transplant. 2017, 17, 2851–2862. [Google Scholar] [CrossRef]
- Spivey, T.L.; Uccellini, L.; Ascierto, M.L.; Zoppoli, G.; De Giorgi, V.; Delogu, L.G.; Engle, A.M.; Thomas, J.M.; Wang, E.; Marincola, F.M.; et al. Gene Expression Profiling in Acute Allograft Rejection: Challenging the Immunologic Constant of Rejection Hypothesis. J. Transl. Med. 2011, 9, 174. [Google Scholar] [CrossRef]
- Halloran, P.F.; Venner, J.M.; Famulski, K.S. Comprehensive Analysis of Transcript Changes Associated With Allograft Rejection: Combining Universal and Selective Features. Am. J. Transplant. 2017, 17, 1754–1769. [Google Scholar] [CrossRef]
- Sussell, J.; Silverstein, A.R.; Goutam, P.; Incerti, D.; Kee, R.; Chen, C.X.; Batty, D.S.; Jansen, J.P.; Kasiske, B.L. The Economic Burden of Kidney Graft Failure in the United States. Am. J. Transplant. 2020, 20, 1323–1333. [Google Scholar] [CrossRef]
- Yang, F.; Liao, M.; Wang, P.; Yang, Z.; Liu, Y. The Cost-Effectiveness of Kidney Replacement Therapy Modalities: A Systematic Review of Full Economic Evaluations. Appl. Health Econ. Health Policy 2021, 19, 163–180. [Google Scholar] [CrossRef]
- Rush, D. Protocol Biopsies for Renal Transplantation. Saudi J. Kidney Dis. Transplant. 2010, 21, 1–9. [Google Scholar] [CrossRef]
- Hart, A.; Zaun, D.; Itzler, R.; Schladt, D.; Israni, A.; Kasiske, B. Cost, Healthcare Utilization, and Outcomes of Antibody-Mediated Rejection in Kidney Transplant Recipients in the US. J. Med. Econ. 2021, 24, 1011–1017. [Google Scholar] [CrossRef]
- Muduma, G.; Odeyemi, I.; Smith-Palmer, J.; Pollock, R.F. Review of the Clinical and Economic Burden of Antibody-Mediated Rejection in Renal Transplant Recipients. Adv. Ther. 2016, 33, 345–356. [Google Scholar] [CrossRef] [PubMed]
- Puttarajappa, C.M.; Mehta, R.B.; Roberts, M.S.; Smith, K.J.; Hariharan, S. Economic Analysis of Screening for Subclinical Rejection in Kidney Transplantation Using Protocol Biopsies and Noninvasive Biomarkers. Am. J. Transplant. 2021, 21, 186–197. [Google Scholar] [CrossRef] [PubMed]
- Mao, Y.; Bai, J.; Chen, J.; Shou, Z.; He, Q.; Wu, J.; Chen, Y.; Cheng, Y. A Pilot Study of GC/MS-Based Serum Metabolic Profiling of Acute Rejection in Renal Transplantation. Transpl. Immunol. 2008, 19, 74–80. [Google Scholar] [CrossRef] [PubMed]
- Jeong, H.J. Diagnosis of Renal Transplant Rejection: Banff Classification and Beyond. Kidney Res. Clin. Pract. 2020, 39, 17–31. [Google Scholar] [CrossRef]
- Archdekin, B.; Sharma, A.; Gibson, I.W.; Rush, D.; Wishart, D.S.; Blydt-Hansen, T.D. Non-Invasive Differentiation of Non-Rejection Kidney Injury from Acute Rejection in Pediatric Renal Transplant Recipients. Pediatr. Transplant. 2019, 23, e13364. [Google Scholar] [CrossRef]
- Ellis, D.I.; Dunn, W.B.; Griffin, J.L.; Allwood, J.W.; Goodacre, R. Metabolic Fingerprinting as a Diagnostic Tool. Pharmacogenomics 2007, 8, 1243–1266. [Google Scholar] [CrossRef]
- Bonneau, E.; Tétreault, N.; Robitaille, R.; Boucher, A.; De Guire, V. Metabolomics: Perspectives on Potential Biomarkers in Organ Transplantation and Immunosuppressant Toxicity. Clin. Biochem. 2016, 49, 377–384. [Google Scholar] [CrossRef]

| Characteristics | Without Rejection (Samples n = 25) (Patients n = 20) | With Rejection (Samples n = 56) (Patients n = 27) | p-Value |
|---|---|---|---|
| Median or % (SD) | Median or % (SD) | ||
| Age (years) | 45 (12.31) | 43 (13.24) | 0.308 * |
| Gender (% male) | 74% - | 68% | 0.757 ** |
| Gestations | 0.16(0.4) | 0.71 (1.6) | 0.4521 * |
| Donor type (% from deceased donor) | 90% | 89% | 1.00 ** |
| Transplanted organ | |||
| Kidney alone | 65% | 74% | 0.233 ** |
| Kidney plus pancreas | 35% | 26% | |
| Rejection classification grade (based on biopsy) | |||
| Non-rejection | 25 | 0.000 ** | |
| No alteration | 13 (52%) | ||
| Only pancreatic rejection | 2 (8%) | ||
| de novo membranous glomerulonephritis | 2 (8%) | ||
| Polyomavirus-associated nephropathy | 2 (8%) | ||
| de novo glomerulopathy | 2 (8%) | ||
| Primary non-function | 1 (4%) | ||
| Allograft nephritis | 1 (4%) | ||
| Calcineurin Inhibitor Toxicity | 1 (4%) | ||
| Human immunodeficiency virus-associated nephropathy | 1 (4%) | ||
| Cellular | 12 | ||
| Borderline | 1 (8%) | ||
| IA | 8 (67%) | ||
| IB | 1 (8%) | ||
| IIA | 1 (8%) | ||
| III | 1 (8%) | ||
| Humoral | 44 | ||
| Borderline | 3 (7%) | ||
| 1 | 13 (30%) | ||
| 2 | 9 (20%) | ||
| Chronic | 12 (27%) | ||
| Mixed predominant humoral | 7 (16%) | ||
| DSAs (% yes) | 24% | 52% | 0.028 ** |
| PRA CDC Maximum | 13.8 (17.4) | 15.7 (28.5) | 0.450 * |
| HLA mismatches | 0.134 * | ||
| HLA Class I (A and B) | 2.74 (0.9) | 2.48 (1.0) | |
| HLA Class II (DR) | 1.4 (1.0) | 1.03 (0.6) | |
| Serum creatinine | 1.5 (2.1) | 1.8 (2.0) | 0.303 * |
| Blood urea nitrogen | 66 (49) | 60 (37) | 0.881 * |
| Urea | 812(43) | 103 (68) | 0.444 * |
| Characteristics | With Rejection (n = 56) | p-Value | |
|---|---|---|---|
| Cellular (Samples n = 12) (Patients n = 9) | Humoral (Samples n = 44) (Patients n = 24) | ||
| Median or % (SD) | Median or % (SD) | ||
| Age (years) | 46.0 (13.2) | 45.5 (13.5) | 0.65 * |
| Gender (% male) | 55% | 73% | 0.35 ** |
| Gestations | 0.89 (1.5) | 0.64 (1.7) | 0.493 * |
| Donor type (% from deceased donor) | 89% | 86% | 1 ** |
| Transplanted organ | |||
| Kidney alone | 77% | 79% | 1 ** |
| Kidney plus pancreas | 23% | 21% | |
| Rejection classification grade at time of biopsy | |||
| Cellular | |||
| Borderline | 1 (8%) | 0.000 * | |
| IA | 8 (67%) | ||
| IB | 1 (8%) | ||
| IIA | 1 (8%) | ||
| III | 1 (8%) | ||
| Humoral | |||
| Borderline | 3 (7%) | ||
| 1 | 13 (30%) | ||
| 2 | 9 (20%) | ||
| Chronic | 12 (27%) | ||
| Mixed predominant humoral | 7 (16%) | ||
| DSAs (% yes) | 42% | 55% | 0.63 ** |
| PRA CDC Maximum | 4.44 (7.3) | 30.6 (33) | 0.32 * |
| HLA mismatches | |||
| HLA Class I (A and B) | 2.4 (0.9) | 2.5 (1.0) | 0.73 * |
| HLA Class II (DR) | 0.9 (0.8) | 1.1 (0.6) | 0.55 * |
| Serum creatinine | 1.81 (1.2) | 1.17 (2.2) | 0.60 * |
| Blood urea nitrogen | 57 (32) | 44 (39) | 0.45 * |
| Urea | 78 (19) | 74 (71) | 0.908 * |
| Model | AUC-ROC | Accuracy | F1-Score | Precision | Sensitivity | Specificity | |
|---|---|---|---|---|---|---|---|
| 600–1900 cm−1 and 2800–3400 cm−1 | Naïve Bayes | 0.587 | 0.543 | 0.554 * (0.507) ** (0.543) *** | 0.675 * (0.380) ** (0.575) *** | 0.541 * (0.760) ** (0.444) *** | 0.663 * (0.446) ** (0.460) *** |
| eight most informative wavenumber | Naïve Bayes | 0.945 | 0.926 | 0.927 * (0.885) ** (0.945) *** | 0.929 * (0.852) ** (0.963) *** | 0.926 * (0.920) ** (0.929) *** | 0.923 * (0.929) ** (0.920) *** |
| Model | AUC-ROC | Classification Accuracy | F1-Score | Precision | Sensitivity | Specificity | |
|---|---|---|---|---|---|---|---|
| 600–1900 cm−1 and 2800 to 3400 cm−1 | Naïve Bayes | 0.678 | 0.518 | 0.545 * (0.449) ** (0.571) *** | 0.808 * (0.297) ** (0.947) *** | 0.518 * (0.917) ** (0.409) *** | 0.808 * (0.409) ** (0.917) *** |
| 10 most informative s wavenumber | Naïve Bayes | 0.989 | 0.964 | 0.965 * (0.923) ** (0.977) *** | 0.969 * (0.857) ** (1.000) *** | 0.964 * (1.000) ** (0.955) *** | 0.990 * (0.955) ** (1.000) *** |
| No. of Patients | Cutoff | AUC | Sensitivity | Specificity | References | |
|---|---|---|---|---|---|---|
| donor-derived Cell-free DNA | 261 | dd-cfDNA of ≥1% | -- | 0.24 | 0.95 | [51] |
| 75 | dd-cfDNA of ≥1% | 0.89 | 0.80 | 0.80 | [52] | |
| 107 | dd-cfDNA of ≥0.88% | 0.64 | 0.38 | 0.85 | [53] | |
| 189 | dd-cfDNA of ≥0.5% | 0.83 | 0.73 | 0.73 | [54] | |
| Molecular Microscope® diagnostic system | 1745 | -- | 0.87 | 0.85 | -- | [55] |
| 74 | -- | C statistic 0.81 | -- | -- | [56] | |
| 519 | -- | -- | 0.78 | 0.74 | [57] |
Disclaimer/Publisher’s Note: The statements, opinions and data contained in all publications are solely those of the individual author(s) and contributor(s) and not of MDPI and/or the editor(s). MDPI and/or the editor(s) disclaim responsibility for any injury to people or property resulting from any ideas, methods, instructions or products referred to in the content. |
© 2025 by the authors. Licensee MDPI, Basel, Switzerland. This article is an open access article distributed under the terms and conditions of the Creative Commons Attribution (CC BY) license (https://creativecommons.org/licenses/by/4.0/).
Share and Cite
Ramalhete, L.; Araújo, R.; Vieira, M.B.; Vigia, E.; Aires, I.; Ferreira, A.; Calado, C.R.C. Integration of FTIR Spectroscopy and Machine Learning for Kidney Allograft Rejection: A Complementary Diagnostic Tool. J. Clin. Med. 2025, 14, 846. https://doi.org/10.3390/jcm14030846
Ramalhete L, Araújo R, Vieira MB, Vigia E, Aires I, Ferreira A, Calado CRC. Integration of FTIR Spectroscopy and Machine Learning for Kidney Allograft Rejection: A Complementary Diagnostic Tool. Journal of Clinical Medicine. 2025; 14(3):846. https://doi.org/10.3390/jcm14030846
Chicago/Turabian StyleRamalhete, Luís, Rúben Araújo, Miguel Bigotte Vieira, Emanuel Vigia, Inês Aires, Aníbal Ferreira, and Cecília R. C. Calado. 2025. "Integration of FTIR Spectroscopy and Machine Learning for Kidney Allograft Rejection: A Complementary Diagnostic Tool" Journal of Clinical Medicine 14, no. 3: 846. https://doi.org/10.3390/jcm14030846
APA StyleRamalhete, L., Araújo, R., Vieira, M. B., Vigia, E., Aires, I., Ferreira, A., & Calado, C. R. C. (2025). Integration of FTIR Spectroscopy and Machine Learning for Kidney Allograft Rejection: A Complementary Diagnostic Tool. Journal of Clinical Medicine, 14(3), 846. https://doi.org/10.3390/jcm14030846