Article

Body Mass Index and Spinopelvic Alignment as Predictors of Incident Knee Osteoarthritis: An 8-Year Longitudinal Study from the TOEI Cohort of Older Japanese Women

1
Department of Orthopaedic Surgery, Hamamatsu University School of Medicine, Hamamatsu 431-3192, Japan
2
Faculty of Informatics, Shizuoka Institute of Science and Technology, Shizuoka 420-0857, Japan
*
Author to whom correspondence should be addressed.
J. Clin. Med. 2025, 14(20), 7343; https://doi.org/10.3390/jcm14207343
Submission received: 13 September 2025 / Revised: 9 October 2025 / Accepted: 13 October 2025 / Published: 17 October 2025
(This article belongs to the Section Orthopedics)

Abstract

Background/Objectives: Knee osteoarthritis (KOA) is multifactorial, and longitudinal evidence isolating early predictors remains limited. We investigated predictors of incident KOA in community-dwelling older adult Japanese women. Methods: We analyzed 191 knees from 105 women aged ≥50 years (baseline Kellgren–Lawrence (KL) grade 0–1) and followed them for 8 years. Incident KOA was defined as KL ≥ 2 at the 8-year follow-up. Baseline measures included body mass index (BMI), physical function (one-leg stance, functional reach), Geriatric Locomotive Function Scale (GLFS-25), EuroQol 5-Dimension (EQ-5D) questionnaire, standing lateral whole-spine radiographs (sagittal spinopelvic parameters), and standing full-length anteroposterior (AP) lower-limb radiographs (coronal alignment parameters). Incident KOA was defined as KL ≥ 2 at follow-up. Group comparisons, multivariable logistic regression, and receiver operating characteristic analyses were conducted. Results: Incident KOA occurred in 58/191 knees (mean participant age 69.3 ± 6.1 years). Compared with non-incident knees, incident knees had higher BMI (23.8 vs. 21.1 kg/m2), higher GLFS-25, greater pelvic tilt and pelvic incidence minus lumbar lordosis (PI–LL) mismatch (11.5° vs. 5.3°), and lower EQ-5D, medial proximal tibial angle, and joint line obliquity. BMI was the strongest single predictor (area under the curve [AUC] 0.753). PI–LL mismatch showed limited standalone discrimination (AUC 0.596) but improved discrimination when combined with BMI (AUC 0.803). Conclusions: BMI was the primary predictor of incident KOA in this cohort. PI–LL mismatch, while not strongly discriminative alone, acted as a complementary marker consistent with sagittal-alignment-related mechanical stress. Results suggest that early screening and prevention should prioritize weight management, using spinopelvic parameters to refine risk stratification.

1. Introduction

Knee osteoarthritis (KOA) is a leading cause of pain, disability, and reduced quality of life (QOL) in older adults, particularly women [1,2,3]. With the increase in global aging, the burden of KOA is expected to rise dramatically, nearly doubling by 2050 [4,5]. Therefore, identifying modifiable risk factors—ideally prior to disease onset to enable primary prevention and risk-stratified screening—is essential for early intervention and disease prevention.
Previous epidemiological studies identified several risk factors for KOA, including older age, higher body mass index (BMI), female sex, history of knee injury, and impaired musculoskeletal function [6,7,8,9,10]. However, many reports have examined mixed outcomes, often conflating incident KOA with disease progression; focusing on incident KOA may help clarify the highly modifiable targets most relevant for prevention. Recently, attention has shifted toward biomechanical factors beyond the knee joint. Notably, spinal and pelvic alignment may influence knee joint loading [11,12,13]. For example, anterior trunk tilt and decreased lumbar lordosis may increase mechanical stress on the knees and contribute to the development of KOA [14,15,16]. In Asian populations, varus alignments of the proximal tibia may increase medial compartment loading and elevate the risk for KOA [17,18].
However, whether factors such as musculoskeletal decline and spinal alignment abnormalities contribute to incident KOA, or instead reflect secondary changes accompanying KOA progression, remains unclear. Additionally, these factors are frequently interrelated, complicating the isolation of their individual effects. Clarifying their predictive value requires longitudinal studies in individuals without advanced KOA. However, such cohort studies are limited. In particular, longitudinal studies controlling for sex and injury history are lacking.
To minimize the confounding effect of sex differences in joint morphology and KOA risk, this study focused exclusively on women. Therefore, this study aimed to identify the predictors of incident KOA through an 8-year longitudinal analysis of community-dwelling women aged ≥50 years in rural Japan.

2. Materials and Methods

This study was approved by our institutional ethics committee. Written informed consent was obtained from all participants, and the study adhered to the principles of the Declaration of Helsinki (1964).
This study was part of the TOEI study, a community health project conducted in Toei Town, Aichi, Japan. This ongoing biennial survey, initiated in 2012, targets healthy participants aged ≥50 years and includes physical function tests and radiographic evaluations. Participants were residents who were recruited through Toei Hospital or public bulletins. Reports from the TOEI cohort have been published previously [18,19,20].
Of the 225 individuals who participated in the 2012 and 2020 surveys, 148 women were included in the present analysis. The inclusion criteria were age ≥ 50 years and no history of spinal surgery. The exclusion criteria were incomplete questionnaire data (3 participants, 6 knees) and poor-quality radiographs or history of lower-limb surgery (8 participants, 15 knees). A total of 11 participants (21 knees) were excluded. Formal power analysis was not performed owing to the fixed cohort size.
The final analysis included 138 participants (275 knees), of which 191 knees from 105 participants were classified as Kellgren–Lawrence (KL) grade 0 or 1 in 2012 and included in the analysis. In cases where only one knee met this condition, the contralateral knee was classified as KL grade 2.
All participants provided their demographic data in 2012, including age, height, weight, and BMI, and underwent the following assessments. Data regarding occupational and sports history were not collected (a limitation of this study).
  • Physical Function Evaluation
Physical function was evaluated using the one-leg standing time (with eyes open) and the Functional Reach Test (FRT). For the one-leg standing test, each leg was tested twice, and the longest standing time (up to 60 s) was recorded. For the FRT, participants extended one arm forward and leaned their upper body forward without moving their feet, and the maximum distance reached by the fingertips was measured in two trials. Although knee symptoms were not formally assessed, all participants completed the functional tests without difficulty.
  • Questionnaires
Musculoskeletal function was evaluated using the self-administered 25-item Geriatric Locomotive Function Scale (GLFS-25) and the EuroQol 5-Dimension (EQ-5D) questionnaire. The GLFS-25 contains 25 items addressing mobility, activities of daily living, social function, and mental health domains, each scored 0–4 (total score 0–100, with higher scores indicating worse dysfunction) [21,22]. QOL was assessed using the EQ-5D, a standardized health status measure [23]. Higher GLFS-25 and lower EQ-5D index scores indicate greater musculoskeletal impairment.
  • Radiographic Evaluation
Full-spine and full-length lower-limb radiographs were obtained. Standing lateral whole-spine radiographs were obtained with participants looking straight ahead and hands on the clavicles. Standing full-length anteroposterior (AP) lower-limb radiographs were acquired with the knees fully extended and the patellae facing forward. The X-ray tube was positioned 1.5 m from the participant. Images were analyzed using Surgimap Spine software (version 2.3.2.1; Nemaris, New York, NY, USA).
The radiographic parameters (see Figure 1) measured in this study were as follows:
Spinal and pelvic parameters:
  • Sagittal vertical axis (SVA): The horizontal distance between the vertical plumb line dropped from the center of the C7 vertebral body and the posterosuperior corner of the sacrum.
  • Thoracic kyphosis (TK): The angle between the superior endplate of T1 and the inferior endplate of T12.
  • Lumbar lordosis (LL): The angle between the superior endplate of L1 and the superior endplate of S1.
  • Sacral slope (SS): The angle between the superior endplate of S1 and a horizontal reference line.
  • Pelvic tilt (PT): The angle between the line connecting the midpoint of the S1 superior endplate to the femoral head center and a vertical reference line
  • Pelvic incidence (PI): The angle between a line perpendicular to the S1 superior endplate at its midpoint and the line connecting this midpoint to the femoral head center. By definition, PI = SS + PT.
  • PI–LL mismatch: Difference between PI and LL (i.e., PI minus LL).
  • Femoral inclination (FI): The angle between the femoral axis and the vertical reference line. Mean values from both sides were used.
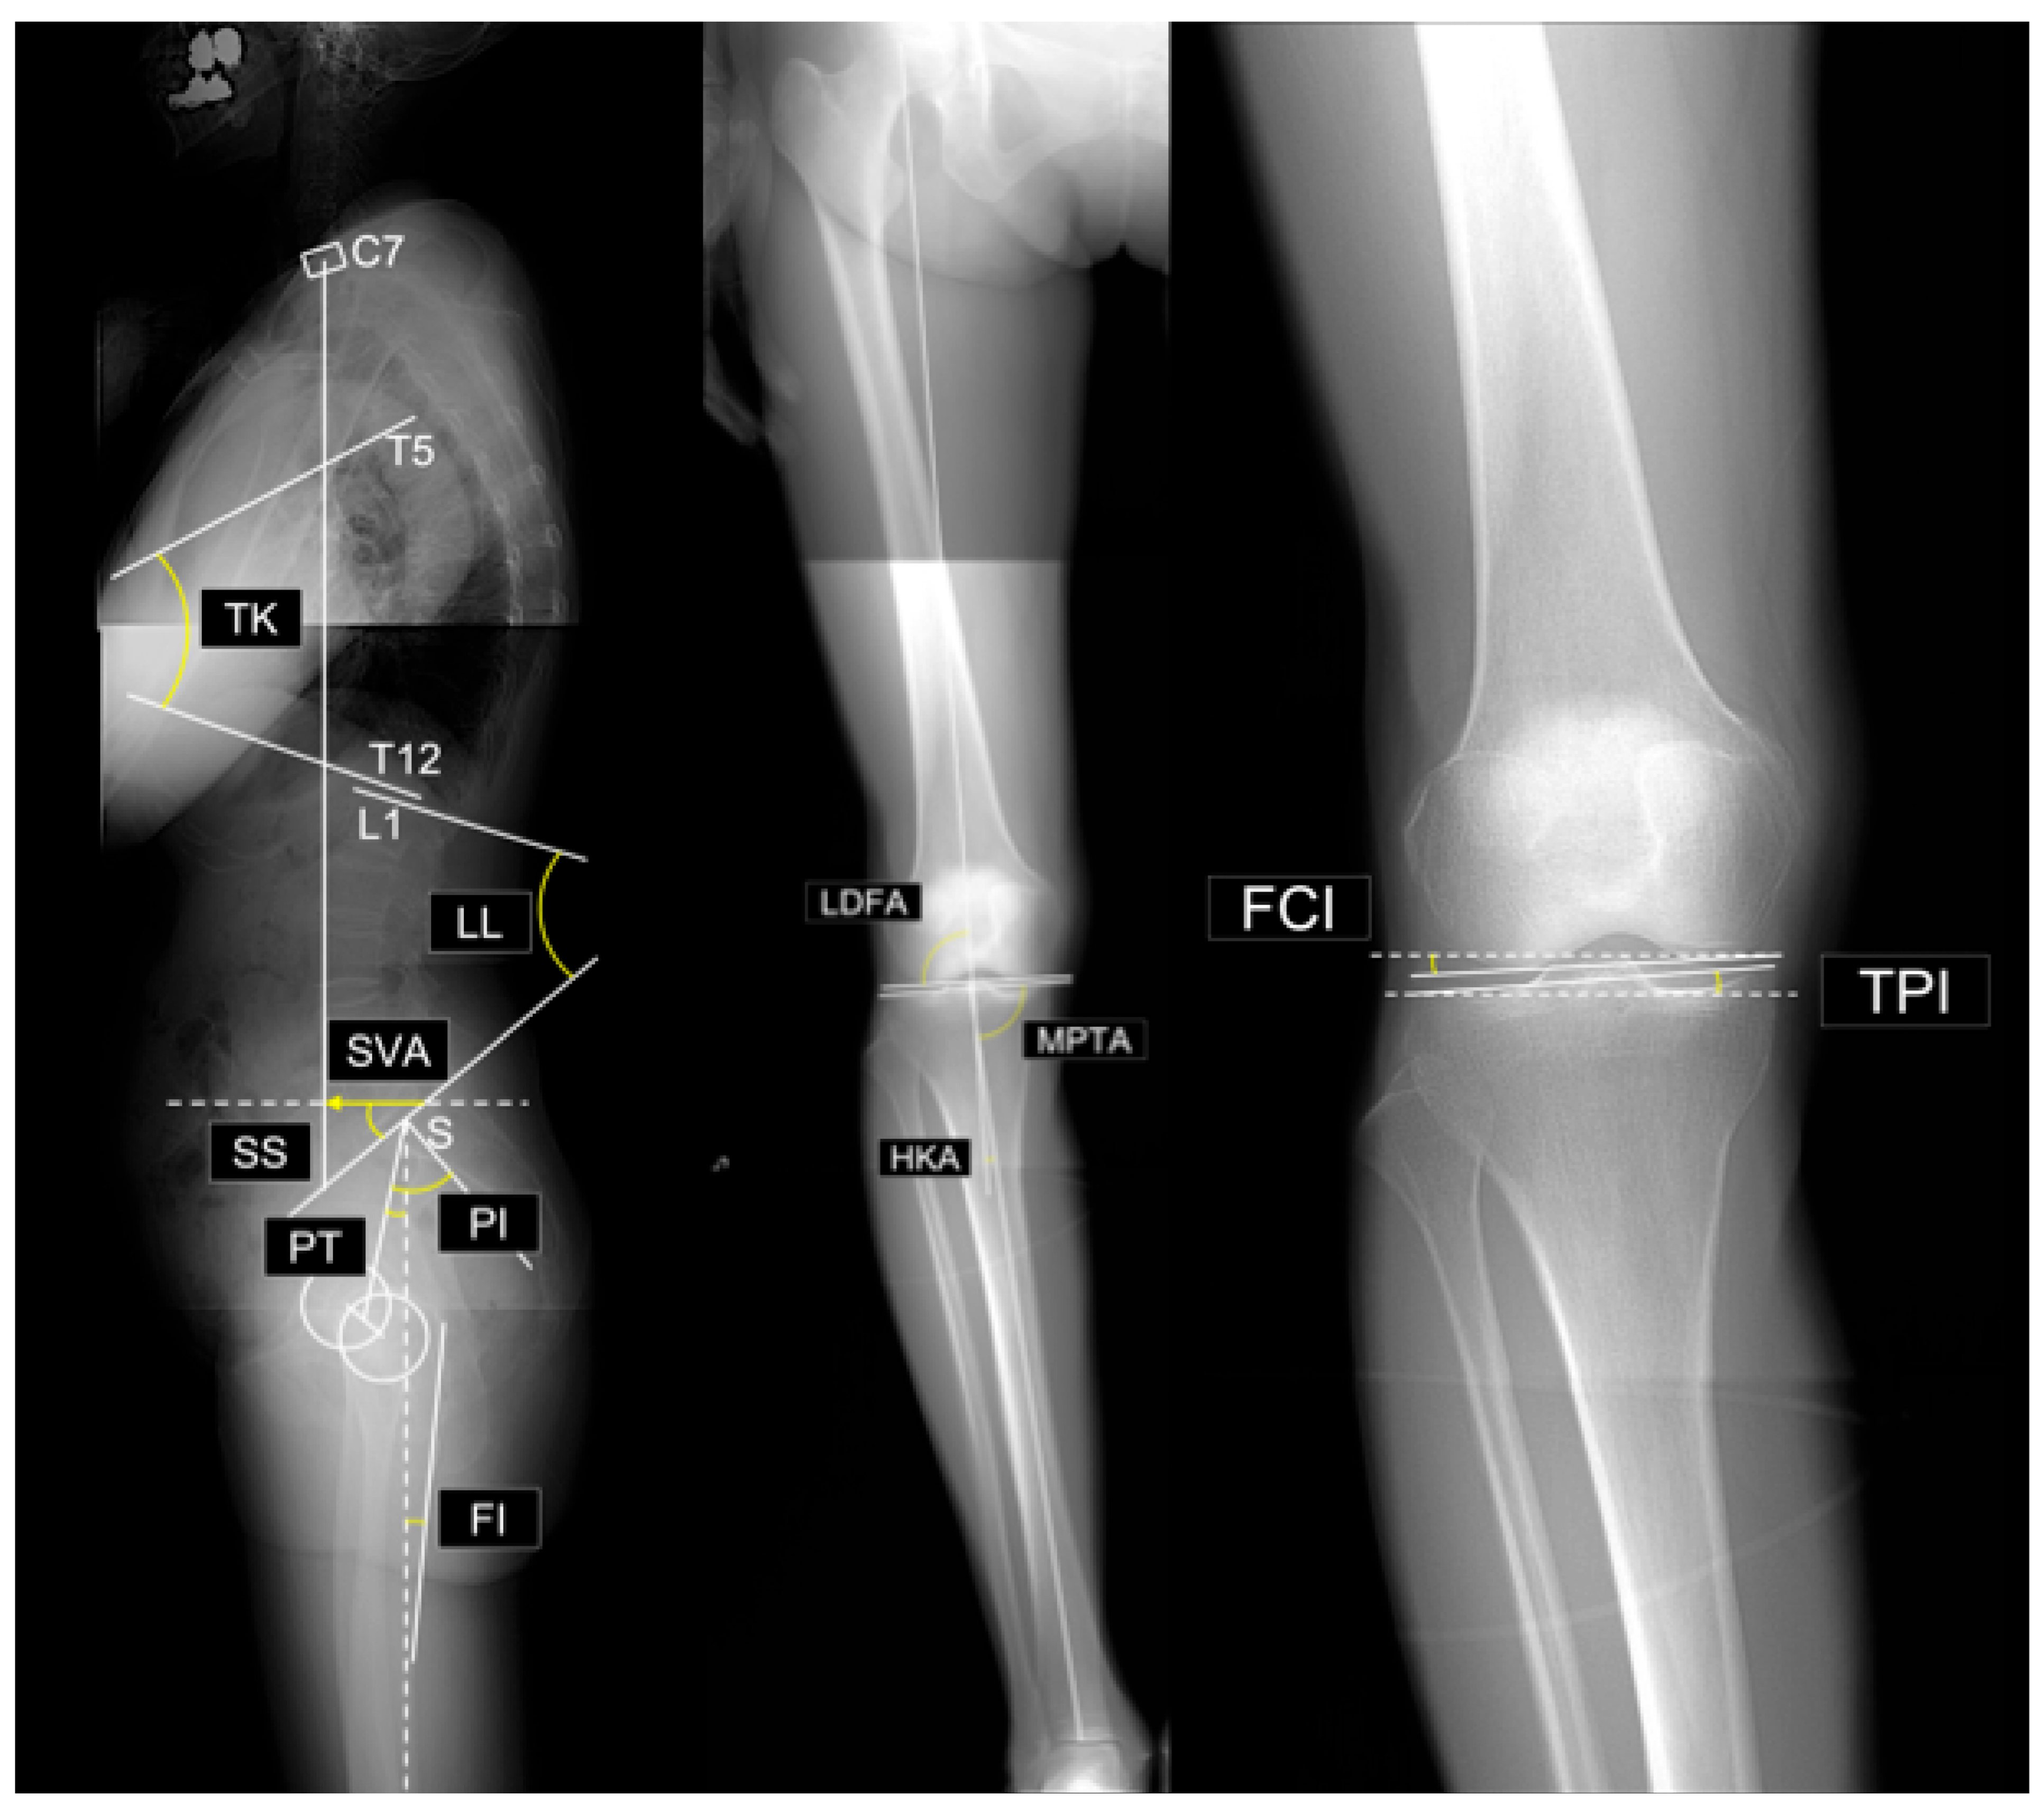
Figure 1. Evaluated radiographic parameters. Abbreviations: SVA, sagittal vertical axis; TK, thoracic kyphosis; LL, lumbar lordosis; SS, sacral slope; PT, pelvic tilt; PI, pelvic incidence; PI–LL, PI minus LL; FI, femoral inclination; LDFA, lateral distal femoral angle; MPTA, medial proximal tibial angle; HKA, hip–knee–ankle angle; FCI, femoral condyle inclination; TPI, tibial plateau inclination.
Jcm 14 07343 g001
Lower limb parameters:
  • Lateral distal femoral angle (LDFA): The lateral angle between the femoral mechanical axis and distal joint line.
  • Medial proximal tibial angle (MPTA): The medial angle between the tibial mechanical axis and proximal joint line.
  • Arithmetic hip–knee–ankle angle (aHKA): Defined as MPTA minus LDFA, representing overall lower-limb alignment. Negative values indicate varus alignment.
  • Joint line obliquity (JLO): Calculated as the sum of the MPTA and LDFA, reflecting the inclination of the joint line relative to the floor in a bipedal standing position. Values less than 180° indicate the apex distal configuration.
  • Hip-knee-ankle angle (HKA): The angle between the mechanical axes of the femur and tibia. A value of 0° represents neutral alignment, and positive values indicate varus alignment.
  • Joint line convergence angle (JLCA): The angle formed by the intersection of the distal femoral and proximal tibial joint lines. Positive values indicate a lateral opening.
  • Femoral condyle inclination (FCI): The inclination of the femoral joint surface relative to the horizontal plane. Negative values indicate lateral distal inclination.
  • Tibial plateau inclination (TPI): inclination of the tibial joint surface relative to the horizontal plane. Negative values indicate medial-distal inclination.
Radiographic analyses were conducted by two board-certified orthopedic surgeons. The intraobserver and interobserver reliability for all alignment parameters and KL grade was high with intraclass correlation coefficients (ICCs) >0.75 (range: 0.792–0.988).
  • Group classification and analysis
Participants with KOA classified as KL grades 0 or 1 in 2012 were included in this study. Those with knees progressing to KL grade ≥2 by 2020 were classified as incident KOA (I group), while those remaining at KL grade 0 or 1 were classified as non-incident KOA (NI group). Mean values of each outcome measure were compared between groups I and NI. Multivariate analysis was performed to identify potential predictors and assess multicollinearity among the outcome measures. For the predictors that remained significant in the multivariate analysis, the optimal cut-off points were determined, and the corresponding cut-off values were calculated.
  • Statistical Analysis
Continuous variables are expressed as mean ± standard deviation, and t-tests were used for group comparisons. To identify the predictive factors, multivariate analysis was performed using binary logistic regression. Stepwise selection was performed using the Wald test, with a significance level of p < 0.01. Receiver operating characteristic (ROC) curve analysis was used to assess diagnostic accuracy. Collinearity was assessed using variance inflation factors (VIFs), and Spearman’s rank correlation was used for correlation analysis. Scatter plots were generated for each variable identified as an independent predictor, with predicted probabilities from the logistic regression model overlaid. A p-value <0.05 was considered statistically significant. To enhance readability, in-text statistics are typically rounded to two decimals, whereas tables report values to four decimals. All performance indices and hypothesis tests were computed using full-precision estimates.
  • Internal validation and performance
Harrell’s bootstrap optimism correction (1000 resamples) was used to estimate and remove overfitting bias (“optimism”) from apparent performance. We report the Brier score (mean squared error of predicted probabilities) and the Brier Skill Score (BSS = 1 − Brier_model/Brier_null), which reflects improvement over a null model that predicts the cohort incidence only. Calibration was summarized by the slope (ideal ≈ 1) and intercept (ideal ≈ 0) from regressing the outcome on the model’s logit predictions.
All computations for statistical testing, data processing, and figure generation were performed in MATLAB R2025a (MathWorks, Natick, MA, USA), employing built-in functions and add-on toolboxes.

3. Results

The mean age of the participants was 69.3 ± 6.1 years (52–82). Of 191 knees, 133 were non-incident (NI group) and 58 incident (I group). No cases of medial femoral condyle osteonecrosis or rheumatoid arthritis were observed in the I group. Incident knees showed higher weight and BMI (23.8 vs. 21.1 kg/m2), higher GLFS-25 scores and lower EQ-5D index values, greater PT and PI–LL mismatch (11.5° vs. 5.3°), and smaller MPTA and JLO (Table 1).
A binary logistic regression analysis was conducted using age, BMI, GLFS-25, EQ-5D, SVA, TK, SS, PT, PI–LL mismatch, MPTA, and LDFA as explanatory variables. BMI and PI–LL mismatch were selected as significant predictors of incident KOA, and the following base model was constructed:
logit = −9.0544 + 0.35634 × BMI + 0.029861 × PI–LL mismatch
With an interaction term, the extended model was
logit = −11.445 + 0.45543 × BMI + 0.28648 × PI–LL mismatch − 0.011004 × BMI × PI–LL mismatch
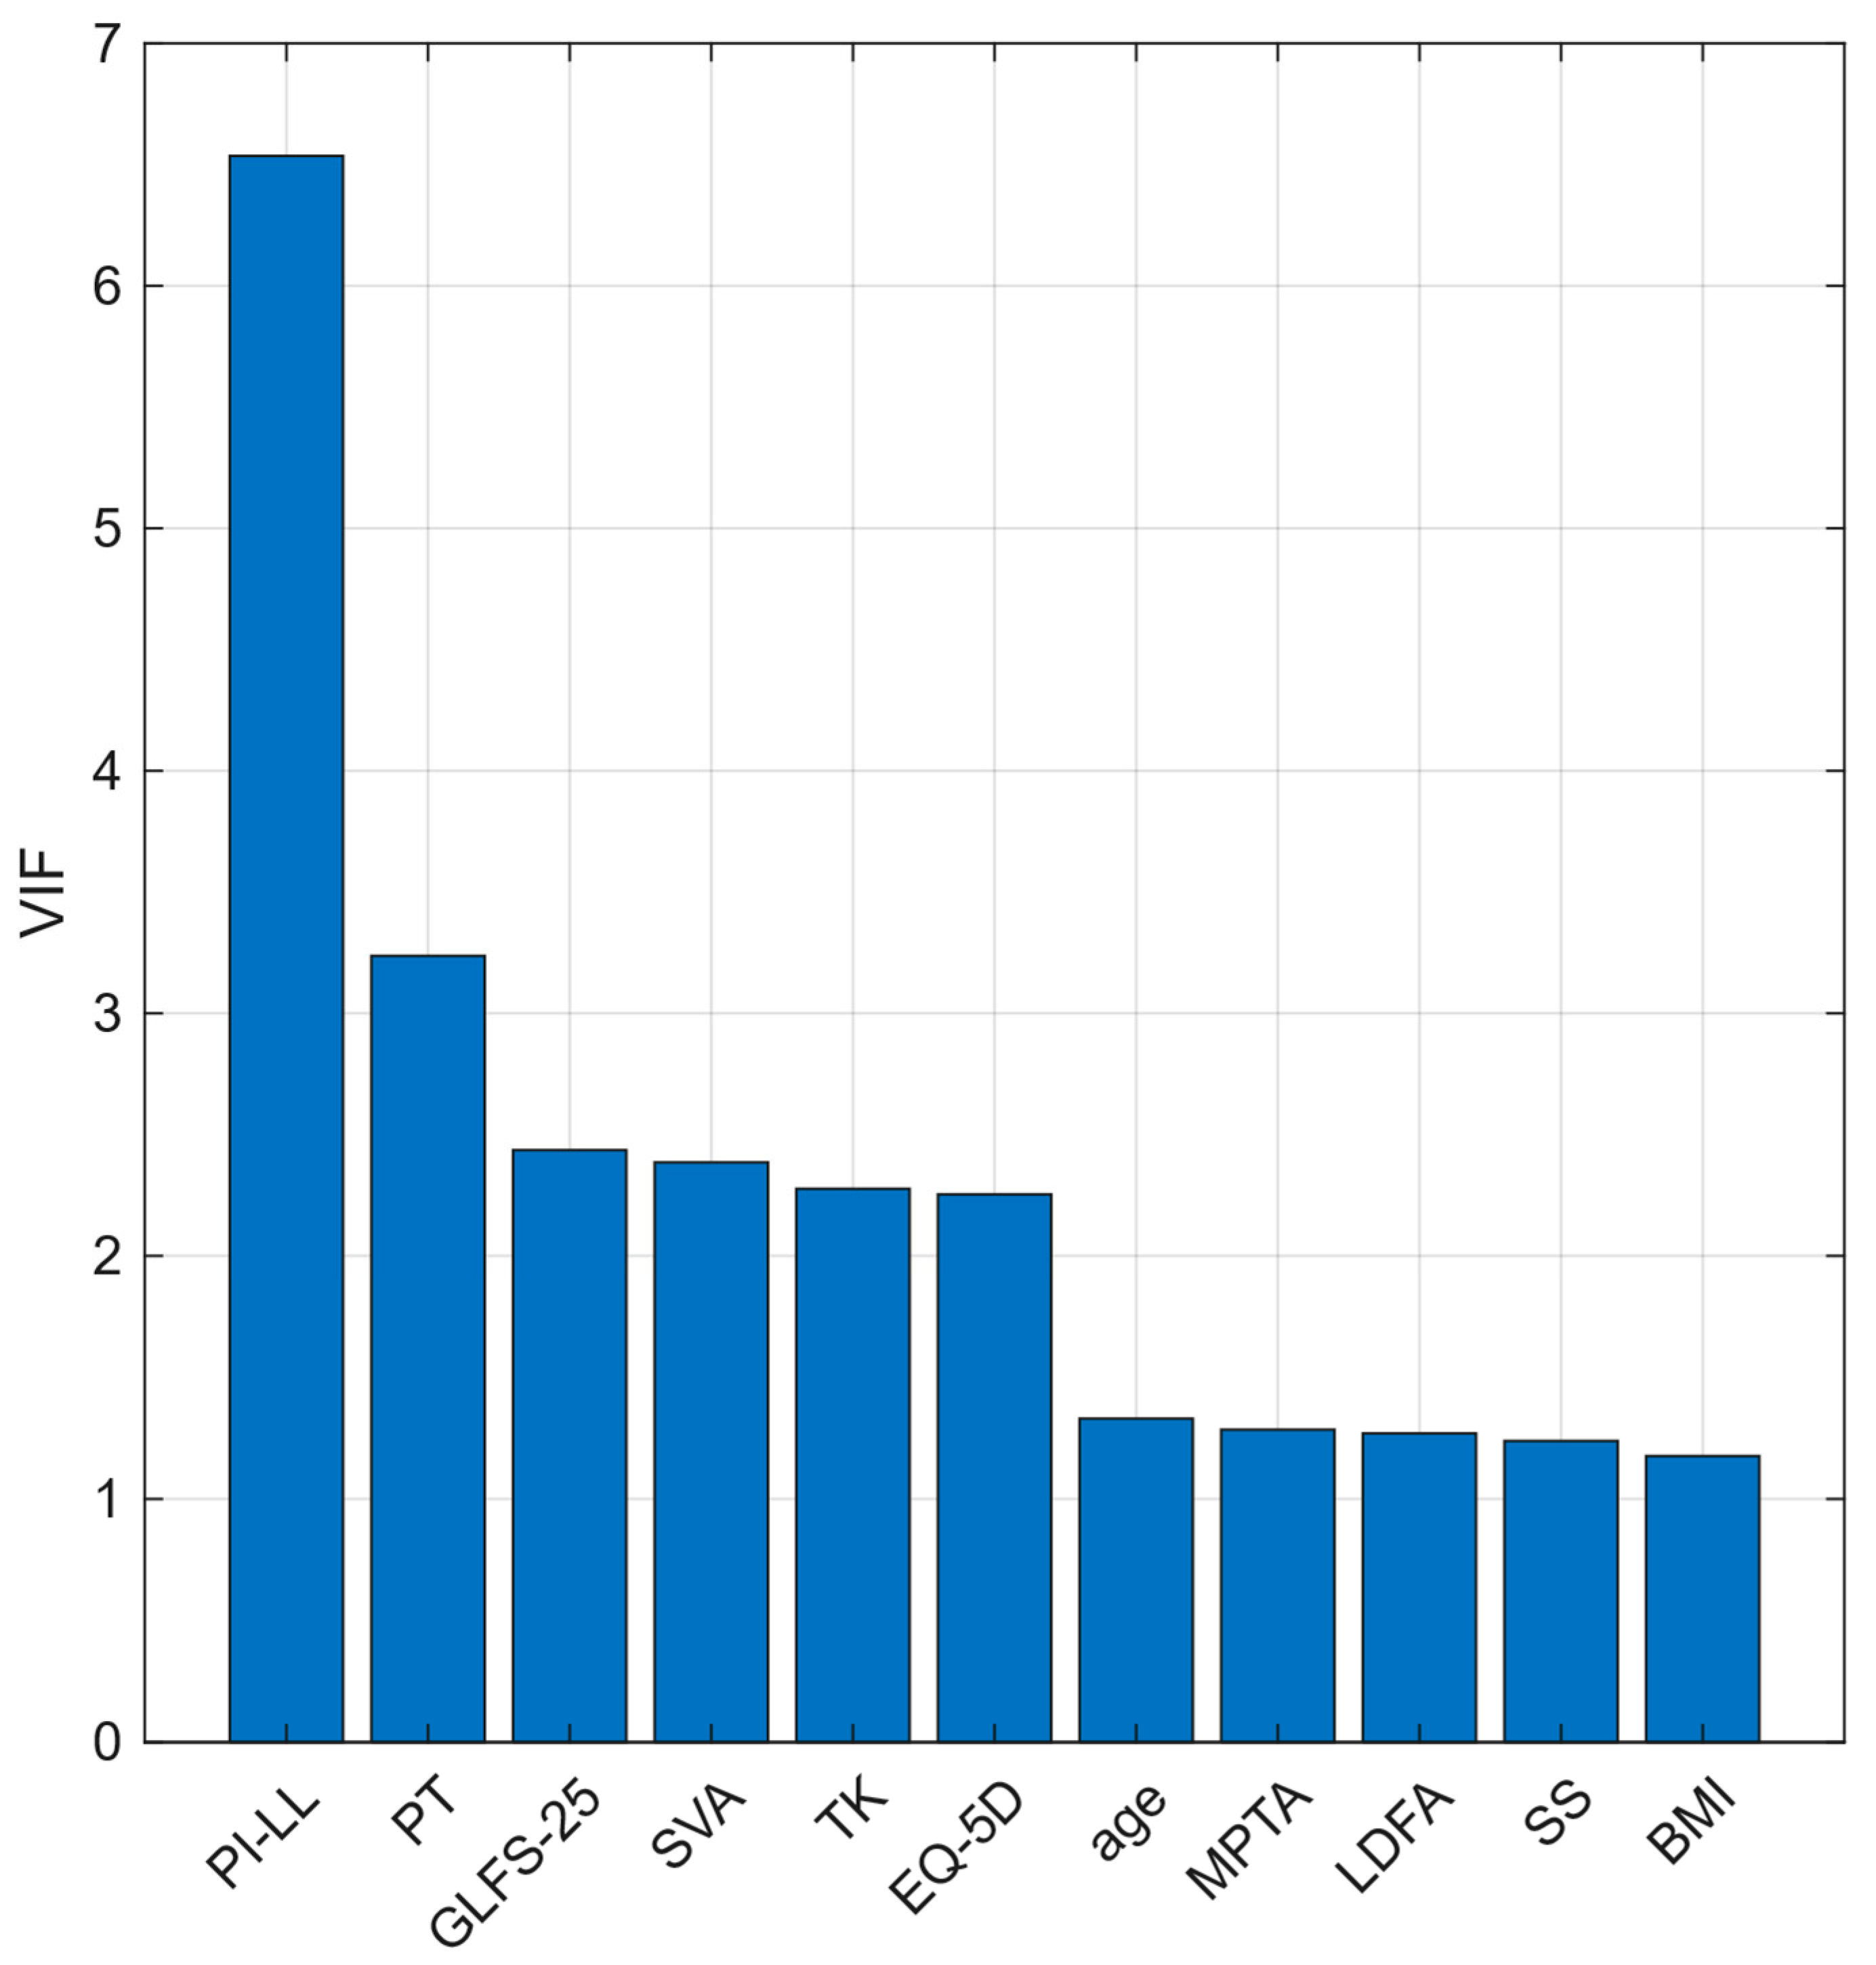
BMI correlated modestly with MPTA and showed the lowest VIF. PI–LL mismatch correlated with multiple sagittal parameters (SVA, TK, SS, PT) and had the highest VIF (Figure 2 and Figure 3).
In ROC analyses, the AUCs of BMI alone, PI–LL mismatch alone, and the combined model (BMI + PI–LL mismatch) were 0.753, 0.596, and 0.803, respectively (Table 3, Figure 4). The ROC-derived BMI cutoff was 22.07 kg/m2. The interaction model’s decision boundary was −0.4066 < −11.445 + 0.45543 × BMI + 0.28648 × PI–LL mismatch − 0.011004 × BMI × PI–LL mismatch.
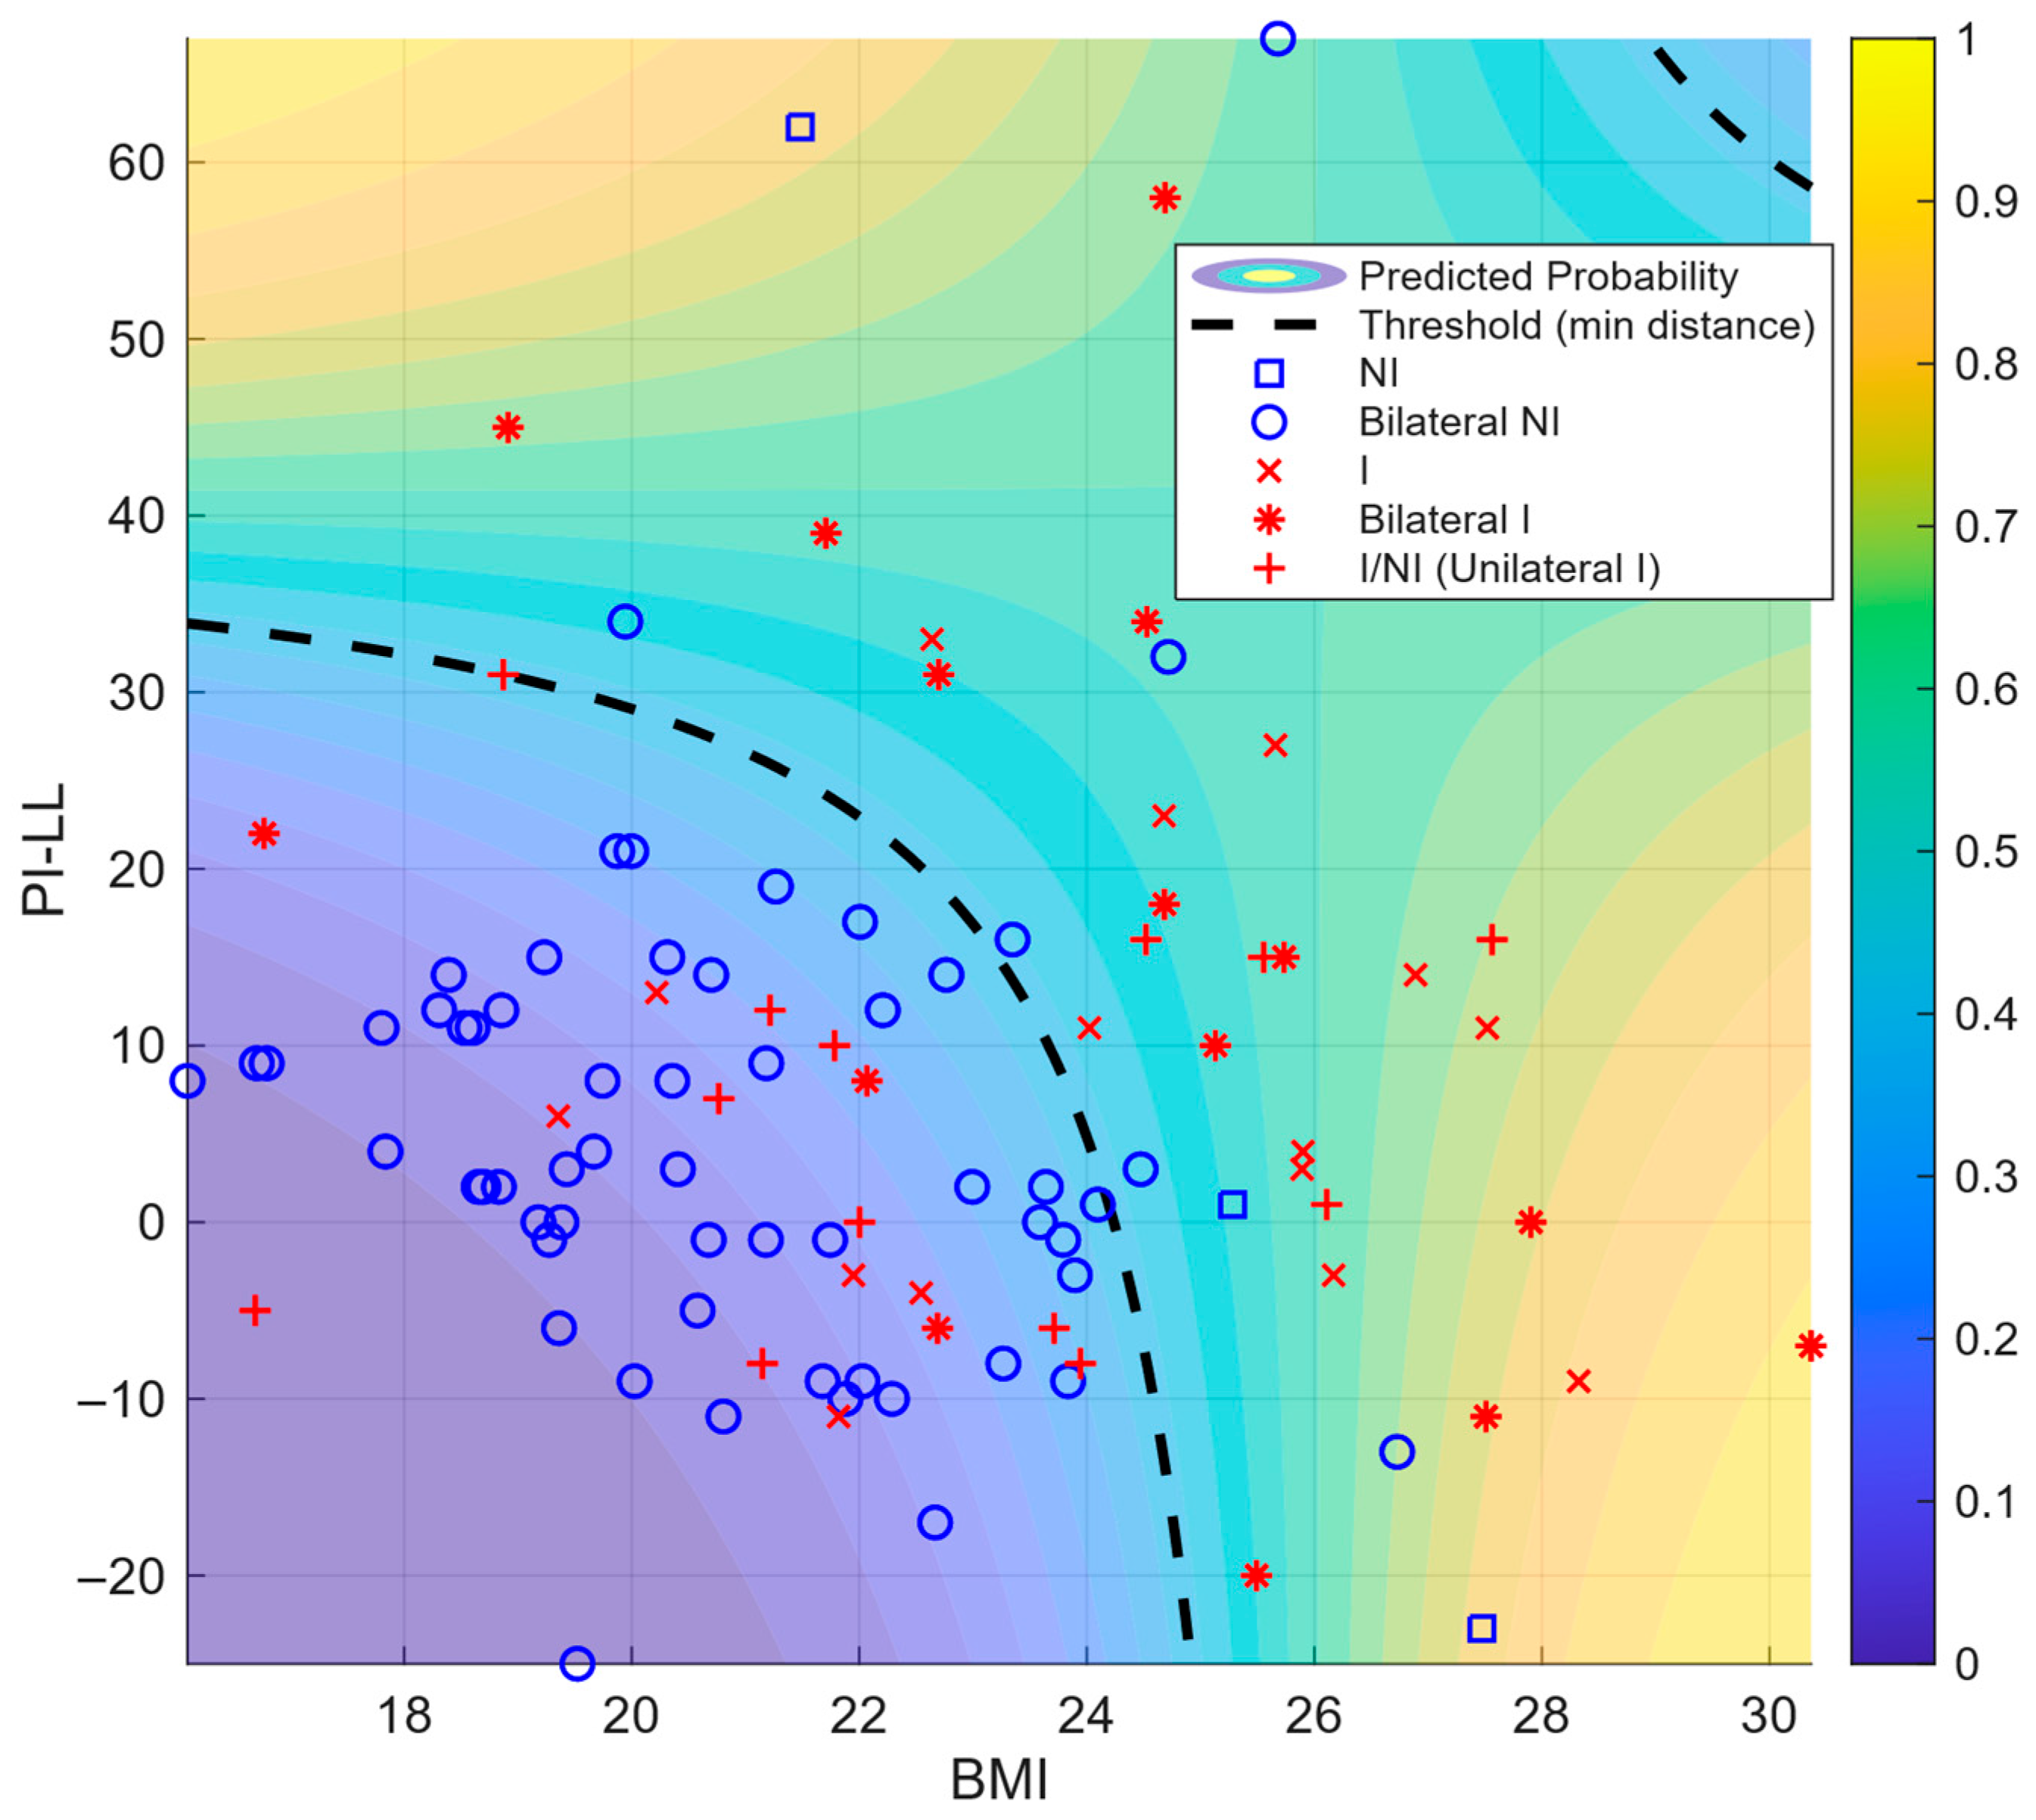
A BMI–PI–LL mismatch heat map visually depicts the lower risk at jointly low values (Figure 5).
Within the multivariable framework, BMI remained the strongest single predictor of incident KOA. Adding a BMI × PI–LL mismatch interaction modestly improved discrimination over the BMI-only model (AUC 0.803 vs. 0.753; Table 3, Figure 4). The predicted-risk surface showed the lowest risk, where both BMI and PI–LL mismatch were low, and higher risk along two complementary bands—(i) higher PI–LL mismatch at lower BMI and (ii) higher BMI at lower PI–LL mismatch—consistent with a negative BMI × PI–LL mismatch interaction (β < 0). The upper-right region (high BMI and high PI–LL mismatch) was sparsely populated and did not exhibit the highest predicted risk (Figure 5). Thus, PI–LL mismatch operates as a complementary risk marker that improves risk stratification beyond BMI.
To address potential overfitting, we applied Harrell’s bootstrap optimism correction (1000 resamples) to the final interaction model. After correction, performance remained robust: AUC = 0.792; Brier score = 0.166; Brier Skill Score = 0.221; calibration slope = 0.925; calibration intercept = 4.586 × 10⁻⁴. These bootstrap-corrected metrics support the stability of the BMI × PI–LL interaction and reinforce its incremental value for risk stratification beyond BMI alone.

4. Discussion

This 8-year cohort study identified BMI as the strongest single predictor of incident KOA, with PI–LL mismatch contributing complementary value despite limited standalone discrimination. To reduce the confounding influence of two well-known risk factors—sex and prior joint injury [7,9]—only women were included, and participants with a history of lower limb surgery were excluded. Univariate differences (BMI, GLFS-25, EQ-5D, PT, PI–LL, MPTA, JLO) aligned with those of prior literature [6,7,10,17,24], whereas age was not a significant predictor, possibly reflecting KOA onset in midlife [25].
BMI is a well-established risk factor for KOA [6,7,10,24,26,27]. Even within a relatively lean cohort (mean BMI 21.9 kg/m2) [28], BMI retained strong predictive value, with a ROC-derived cutoff of 22.07 kg/m2. This heightened susceptibility to load-related stress may be attributed not only to the relatively advanced age of the participants but also to population-specific skeletal morphology and culturally specific lifestyle habits, such as frequent squatting and kneeling, which may predispose Japanese individuals to KOA compared with populations in other countries [17,29,30].
Prior studies have shown that greater PI–LL mismatch is observed in more advanced KOA and is linked to compensatory knee flexion [13,14,16,20,31]. In contrast, our cohort comprised knees with KL 0–1 at baseline and did not exhibit sagittal malalignment that was severe enough to necessitate compensation, indicating a different clinical context. Within this early-stage setting, PI–LL alone showed limited discrimination (AUC 0.596) and correlated with multiple sagittal parameters with the highest VIF, suggesting shared variance with global alignment. Thus, we interpreted these results to indicate that PI–LL is not a strong solo predictor or a direct interventional target. Rather, PI–LL serves as a complementary marker that improves risk stratification when considered in conjunction with BMI.
In keeping with this early-stage context, femoral inclination—a proxy for compensatory knee flexion—was not significantly associated with incident KOA in our data, implying that sagittal imbalance had not yet translated into measurable lower-limb compensation at baseline. Conceptually, sagittal spinopelvic malalignment may begin with a reduction in lumbar lordosis [32]; accordingly, monitoring PI–LL may facilitate early detection of emerging global sagittal imbalance and potential increases in knee joint loading.
Incorporating a BMI × PI–LL interaction improved discrimination versus the BMI-only model (AUC 0.803 vs. 0.753; Table 3, Figure 4). However, the risk surface did not peak where both BMI and PI–LL were high. Instead, risk increased along complementary patterns—higher PI–LL at lower BMI and higher BMI at lower PI–LL—consistent with a negative (antagonistic) interaction on the logit scale (β for BMI × PI–LL = −0.011004), whereby the effect of one predictor attenuates as the other increases.
Clinically, these results suggest that primary prevention should prioritize weight management [26]. Spinopelvic assessment (by PI–LL) can refine BMI-based screening, highlighting risk among lean individuals with sagittal malalignment and among individuals with higher BMI even when PI–LL is low. Trunk and lower-limb muscle weakness may contribute to PI–LL mismatch [33,34], and targeted exercise may improve spinopelvic alignment [34]. Whether modifying these features reduces incident KOA, however, warrants prospective evaluation.
Proximal tibial varus alignment has been implicated as an important biomechanical factor in KOA development [17,35]. In our cohort, the between-group difference in MPTA was <1°, which may reflect a selection effect whereby restricting enrollment to baseline early KOA (KL 0–1) probably underrepresented advanced cases with smaller MPTA, thereby attenuating the apparent contrast. The weak correlation of MPTA with BMI suggests that chronic load may contribute to varus remodeling. However, the clinical impact at baseline appeared small in our study population.
Although this study provides important evidence on predictors of incident KOA in older Japanese women, several limitations warrant mention. First, the two-wave design (2012 and 2020) prevents precise ascertainment of onset, so estimates may be conservative. Second, selection and attrition (e.g., exclusions due to image quality or incomplete questionnaires, and loss to follow-up) could introduce bias; detailed flow is provided, but residual selection bias cannot be excluded. Third, radiographic alignment measures (e.g., PI–LL) are subject to posture-related measurement error, which likely attenuates effects. Fourth, while BMI emerged as a dominant predictor, limited body-composition and muscle-function data constrained our ability to disentangle adiposity from sarcopenic components. Fifth, generalizability is limited to community-dwelling Japanese women aged ≥50 years in a rural setting; external validation is needed. Finally, although logistic regression does not assume normality of predictors, unmeasured or residual confounding (e.g., baseline knee symptoms, lifestyle and activity patterns, comorbidities) may still influence the estimates.
In summary, BMI primarily drives incident KOA risk, and PI–LL complements BMI to improve discrimination, supporting prevention strategies that prioritize weight while using spinopelvic metrics for risk refinement.

5. Conclusions

BMI was the primary predictor of incident KOA, even in a relatively lean population. PI–LL mismatch alone had limited discrimination but complemented BMI to improve prediction, consistent with sagittal-alignment-related mechanical stress. Prevention should prioritize weight management, using spinopelvic parameters to refine individual risk.

Author Contributions

Conceptualization, Y.M. (Yuki Murakami); Methodology, Y.M. (Yuki Murakami) and Y.Y.; Software, Y.Y.; Validation, Y.M. (Yuki Murakami), K.N. and K.H.; Formal analysis, Y.Y. and Y.M. (Yuki Murakami); Investigation, Y.M. (Yuki Murakami), K.N. and K.H.; Data curation, Y.M. (Yuki Murakami), K.N. and K.H.; Visualization, Y.Y.; Writing—original draft preparation, Y.M. (Yuki Murakami) and Y.Y.; Writing—review and editing, M.H. and Y.M. (Yukihiro Matsuyama); Supervision, M.H. and Y.M. (Yukihiro Matsuyama); Project administration, Y.M. (Yuki Murakami). All authors have read and agreed to the published version of the manuscript.

Funding

This research received no external funding.

Institutional Review Board Statement

The present secondary analysis of prospectively collected cohort data (surveys conducted in 2012 and 2020) was approved by the Institutional Review Board of Hamamatsu University School of Medicine (approval code 25-061, approval date 7 July 2025) and conducted in accordance with the Declaration of Helsinki.

Informed Consent Statement

Written informed consent was obtained from all participants at each survey (2012 and 2020). The present analysis used de-identified data.

Data Availability Statement

The dataset contains potentially identifying information from a small community-based cohort and is therefore not publicly available. De-identified data and the MATLAB analysis scripts used in this study are available from the corresponding author on reasonable request and with permission of the Institutional Review Board of Hamamatsu University School of Medicine (approval code 25-061, approval date 7 July 2025). Raw radiographic images cannot be shared publicly due to privacy and ethical restrictions.

Acknowledgments

We thank the residents of Toei Town for their longstanding participation and the clinical staff and radiology technicians at Toei Hospital for their assistance with data acquisition. We are also grateful to the municipal health officers who supported study logistics. No generative AI was used for data analysis or figure generation; the authors take full responsibility for the content.

Conflicts of Interest

The authors declare no conflicts of interest.

Abbreviations

The following abbreviations are used in this manuscript:
BMIBody mass index
FRTFunctional reach test
GLFSGeriatric Locomotive Function Scale
EQ-5DEuroQol 5-dimension
SVASagittal vertical axis
TKThoracic kyphosis
LLLumbar lordosis
SSSacral slope
PTPelvic tilt
PIPelvic incidence
PI–LLPelvic incidence minus lumbar lordosis
FIFemoral inclination
LDFALateral distal femoral angle
MPTAMedial proximal tibial angle
aHKAArithmetic hip–knee–ankle angle
JLOJoint line obliquity
HKAHip–knee–ankle angle
JLCAJoint line convergence angle
FCIFemoral condyle inclination
TPITibial plateau inclination
ΒRegression coefficient
CIConfidence interval
OROdds ratio
AUCArea under the curve
VIFVariance inflation factor
KOAKnee osteoarthritis
ROCReceiver operating characteristics

References

  1. Hunter, D.J.; Bierma-Zeinstra, S. Osteoarthritis. Lancet 2019, 393, 1745–1759. [Google Scholar] [CrossRef]
  2. Li, E.; Tan, J.; Xu, K.; Pan, Y.; Xu, P. Global burden and socioeconomic impact of knee osteoarthritis: A comprehensive analysis. Front. Med. 2024, 11, 1323091. [Google Scholar] [CrossRef]
  3. Summanen, M.; Ukkola-Vuoti, L.; Kurki, S.; Tuominen, S.; Madanat, R. The burden of hip and knee osteoarthritis in Finnish occupational healthcare. BMC Musculoskelet. Disord. 2021, 22, 501. [Google Scholar] [CrossRef]
  4. GBD 2021 Osteoarthritis Collaborators. Global, regional, and national burden of osteoarthritis, 1990–2020 and projections to 2050: A systematic analysis for the Global Burden of Disease Study 2021. Lancet Rheumatol. 2023, 5, e508–e522. [Google Scholar] [CrossRef]
  5. Wallace, I.J.; Worthington, S.; Felson, D.T.; Jurmain, R.D.; Wren, K.T.; Maijanen, H.; Woods, R.J.; Lieberman, D.E. Knee osteoarthritis has doubled in prevalence since the mid-20th century. Proc. Natl. Acad. Sci. USA 2017, 114, 9332–9336. [Google Scholar] [CrossRef]
  6. Dong, Y.; Yan, Y.; Zhou, J.; Zhou, Q.; Wei, H. Evidence on risk factors for knee osteoarthritis in middle-older aged: A systematic review and meta analysis. J. Orthop. Surg. Res. 2023, 18, 634. [Google Scholar] [CrossRef]
  7. Duong, V.; Shaheed, C.A.; Ferreira, M.L.; Narayan, S.W.; Venkatesha, V.; Hunter, D.J.; Zhu, J.; Atukorala, I.; Kobayashi, S.; Goh, S.L.; et al. Risk factors for the development of knee osteoarthritis across the lifespan: A systematic review and meta-analysis. Osteoarthr. Cart. 2025, 31, 1162–1179. [Google Scholar] [CrossRef] [PubMed]
  8. Nishimura, A.; Hasegawa, M.; Kato, K.; Yamada, T.; Uchida, A.; Sudo, A. Risk factors for the incidence and progression of radiographic knee osteoarthritis of the knee among Japanese. Int. Orthop. 2011, 35, 839–843. [Google Scholar] [CrossRef] [PubMed]
  9. Shao, W.; Hou, H.; Han, Q.; Cai, K. Prevalence and risk factors of knee osteoarthritis: A cross-sectional survey in Nanjing, China. Front. Public Health 2024, 12, 1441408. [Google Scholar] [CrossRef]
  10. Yoshimura, N.; Muraki, S.; Oka, H.; Tanaka, S.; Kawaguchi, H.; Nakamura, K.; Akune, T. Accumulation of metabolic risk factors such as overweight, hypertension, dyslipidaemia, and impaired glucose tolerance raises the risk of occurrence and progression of knee osteoarthritis: A 3-year follow-up of the ROAD study. Osteoarthr. Cart. 2012, 20, 1217–1226. [Google Scholar] [CrossRef]
  11. Amarasinghe, P.; Wadugodapitiya, S.; Weerasekara, I. Biomechanical and clinical relationships between lower back pain and knee osteoarthritis: A systematic review. Syst. Rev. 2023, 12, 28. [Google Scholar] [CrossRef]
  12. Obeid, I.; Hauger, O.; Aunoble, S.; Bourghli, A.; Pellet, N.; Vital, J.M. Global analysis of sagittal spinal alignment in major deformities: Correlation between lack of lumbar lordosis and flexion of the knee. Eur. Spine J. 2011, 20 (Suppl. 5), 681–685. [Google Scholar] [CrossRef]
  13. Aksoy, O.T.; Bütün, B. Relationship of spinopelvic alignment on knee osteoarthritis in female patients: A cross-sectional study. J. Back Musculoskelet. Rehabil. 2025, 38, 10538127251321767. [Google Scholar] [CrossRef]
  14. Fu, P.; Xu, W.; Xu, P.; Huang, J.; Guo, J.J. Relationship between spinal imbalance and knee osteoarthritis by using full-body EOS. BMC Musculoskelet. Disord. 2023, 24, 402. [Google Scholar] [CrossRef]
  15. Shimizu, M.; Kobayashi, T.; Chiba, H.; Senoo, I.; Abe, S.; Matsukura, K.; Ito, H. Examination of the changes in lower extremities related to progression of adult spinal deformity: A longitudinal study of over 22 years. Sci. Rep. 2020, 10, 11605. [Google Scholar] [CrossRef]
  16. Wang, J.; Ushirozako, H.; Yamato, Y.; Hasegawa, T.; Yoshida, G.; Banno, T.; Arima, H.; Oe, S.; Yamada, T.; Ide, K.; et al. Why does knee flexion in the standing position occur? Spinal deformity or knee osteoarthritis. J. Orthop. Surg. 2023, 31, 10225536231169575. [Google Scholar] [CrossRef]
  17. Higano, Y.; Hayami, T.; Omori, G.; Koga, Y.; Endo, K.; Endo, N. The varus alignment and morphologic alterations of the proximal tibia affect the onset of medial knee osteoarthritis in rural Japanese women: A case–control study from the longitudinal evaluation of Matsudai Knee Osteoarthritis Survey. J. Orthop. Sci. 2016, 21, 166–171. [Google Scholar] [CrossRef] [PubMed]
  18. Hanada, M.; Hoshino, H.; Koyama, H.; Matsuyama, Y. Relationship between severity of knee osteoarthritis and radiography findings of lower limbs: A cross-sectional study from the TOEI survey. J. Orthop. 2017, 14, 484–488. [Google Scholar] [CrossRef]
  19. Nomoto, K.; Hanada, M.; Hotta, K.; Matsuyama, Y. Distribution of coronal plane alignment of the knee classification does not change as knee osteoarthritis progresses: A longitudinal study from the TOEI study. Knee Surg. Sports Traumatol. Arthrosc. 2023, 31, 5507–5513. [Google Scholar] [CrossRef] [PubMed]
  20. Yasuda, T.; Togawa, D.; Hasegawa, T.; Yamato, Y.; Kobayashi, S.; Yoshida, G.; Banno, T.; Arima, H.; Oe, S.; Hoshino, H.; et al. Relationship between knee osteoarthritis and spinopelvic sagittal alignment in volunteers over 50 years of age. Asian Spine J. 2020, 14, 495–501. [Google Scholar] [CrossRef] [PubMed]
  21. Ide, K.; Yamato, Y.; Hasegawa, T.; Yoshida, G.; Yasuda, T.; Banno, T.; Arima, H.; Oe, S.; Mihara, Y.; Ushirozako, H.; et al. Prospective nursing care certification using the 25-question Geriatric Locomotive Function Scale. Geriatr. Gerontol. Int. 2021, 21, 492–497. [Google Scholar] [CrossRef]
  22. Seichi, A.; Hoshino, Y.; Doi, T.; Akai, M.; Tobimatsu, Y.; Iwaya, T. Development of a screening tool for risk of locomotive syndrome in the elderly: The 25-question Geriatric Locomotive Function Scale. J. Orthop. Sci. 2012, 17, 163–172. [Google Scholar] [CrossRef]
  23. EuroQol Group. EuroQol—A new facility for the measurement of health-related quality of life. Health Policy 1990, 16, 199–208. [Google Scholar] [CrossRef]
  24. Sasaki, E.; Ota, S.; Chiba, D.; Kimura, Y.; Sasaki, S.; Yamamoto, Y.; Tsuda, E.; Nakaji, S.; Ishibashi, Y. Early knee osteoarthritis prevalence is highest among middle-aged adult females with obesity based on new set of diagnostic criteria from a large sample cohort study in the Japanese general population. Knee Surg. Sports Traumatol. Arthrosc. 2020, 28, 984–994. [Google Scholar] [CrossRef]
  25. Briggs, A.M.; Cross, M.J.; Hoy, D.G.; Sànchez-Riera, L.; Blyth, F.M.; Woolf, A.D.; March, L. Musculoskeletal health conditions represent a global threat to healthy aging: A report for the 2015 world health organization world report on ageing and health. Gerontologist 2016, 56 (Suppl. 2), S243–S255. [Google Scholar] [CrossRef]
  26. Messier, S.P.; Mihalko, S.L.; Legault, C.; Miller, G.D.; Nicklas, B.J.; DeVita, P.; Beavers, D.P.; Hunter, D.J.; Lyles, M.F.; Eckstein, F.; et al. Effects of intensive diet and exercise on knee joint loads, inflammation, and clinical outcomes among overweight and obese adults with knee osteoarthritis: The IDEA randomized clinical trial. JAMA 2013, 310, 1263–1273. [Google Scholar] [CrossRef] [PubMed]
  27. Törnblom, M.; Bremander, A.; Aili, K.; Andersson, M.L.E.; Nilsdotter, A.; Haglund, E. Development of radiographic knee osteoarthritis and the associations to radiographic changes and baseline variables in individuals with knee pain: A 2-year longitudinal study. BMJ Open 2024, 14, e081999. [Google Scholar] [CrossRef]
  28. Anuurad, E.; Shiwaku, K.; Nogi, A.; Kitajima, K.; Enkhmaa, B.; Shimono, K.; Yamane, Y. The new BMI criteria for Asians by the regional office for the western pacific region of WHO are suitable for screening of overweight to prevent metabolic syndrome in elder Japanese workers. J. Occup. Health 2003, 45, 335–343. [Google Scholar] [CrossRef]
  29. Muraki, S.; Oka, H.; Akune, T.; En-Yo, Y.; Yoshida, M.; Nakamura, K.; Kawaguchi, H.; Yoshimura, N. Association of occupational activity with joint space narrowing and osteophytosis in the medial compartment of the knee: The ROAD study (OAC5914R2). Osteoarthr. Cart. 2011, 19, 840–846. [Google Scholar] [CrossRef]
  30. Wanezaki, Y.; Suzuki, A.; Takakubo, Y.; Nakajima, T.; Toyono, S.; Toyoshima, S.; Fukushima, S.; Yamamoto, T.; Ito, T.; Takagi, M. Lower limb alignment in healthy Japanese adults. J. Orthop. Sci. 2023, 28, 200–203. [Google Scholar] [CrossRef] [PubMed]
  31. Jalai, C.M.; Diebo, B.G.; Cruz, D.L.; Poorman, G.W.; Vira, S.; Buckland, A.J.; Lafage, R.; Bess, S.; Errico, T.J.; Lafage, V.; et al. The impact of obesity on compensatory mechanisms in response to progressive sagittal malalignment. Spine J. 2017, 17, 681–688. [Google Scholar] [CrossRef]
  32. Ito, K.; Ando, K.; Kobayashi, K.; Nakashima, H.; Hasegawa, Y.; Imagama, S. A longitudinal study of lumbar sagittal change in middle-aged healthy volunteers. Spine Surg. Relat. Res. 2021, 5, 160–164. [Google Scholar] [CrossRef]
  33. Ide, K.; Yamato, Y.; Hasegawa, T.; Yoshida, G.; Banno, T.; Arima, H.; Oe, S.; Mihara, Y.; Ushirozako, H.; Yamada, T.; et al. Sex differences between the relationship of trunk muscle mass and whole body sagittal plane alignment in older adults. J. Orthop. Sci. 2023, 28, 315–320. [Google Scholar] [CrossRef]
  34. Marcos-Pardo, P.J.; Abelleira-Lamela, T.; Vaquero-Cristóbal, R.; Espeso-García, A.; Esparza-Ros, F.; González-Gálvez, N. Improving spinal alignment through innovative resistance training with outdoor fitness equipment in middle-aged and older adults: A randomized controlled trial. Sci. Rep. 2025, 15, 14499. [Google Scholar] [CrossRef] [PubMed]
  35. Palmer, J.S.; Jones, L.D.; Monk, A.P.; Nevitt, M.; Lynch, J.; Beard, D.J.; Javaid, M.K.; Price, A.J. Varus alignment of the proximal tibia is associated with structural progression in early to moderate varus osteoarthritis of the knee. Knee Surg. Sports Traumatol. Arthrosc. 2020, 28, 3279–3286. [Google Scholar] [CrossRef] [PubMed]
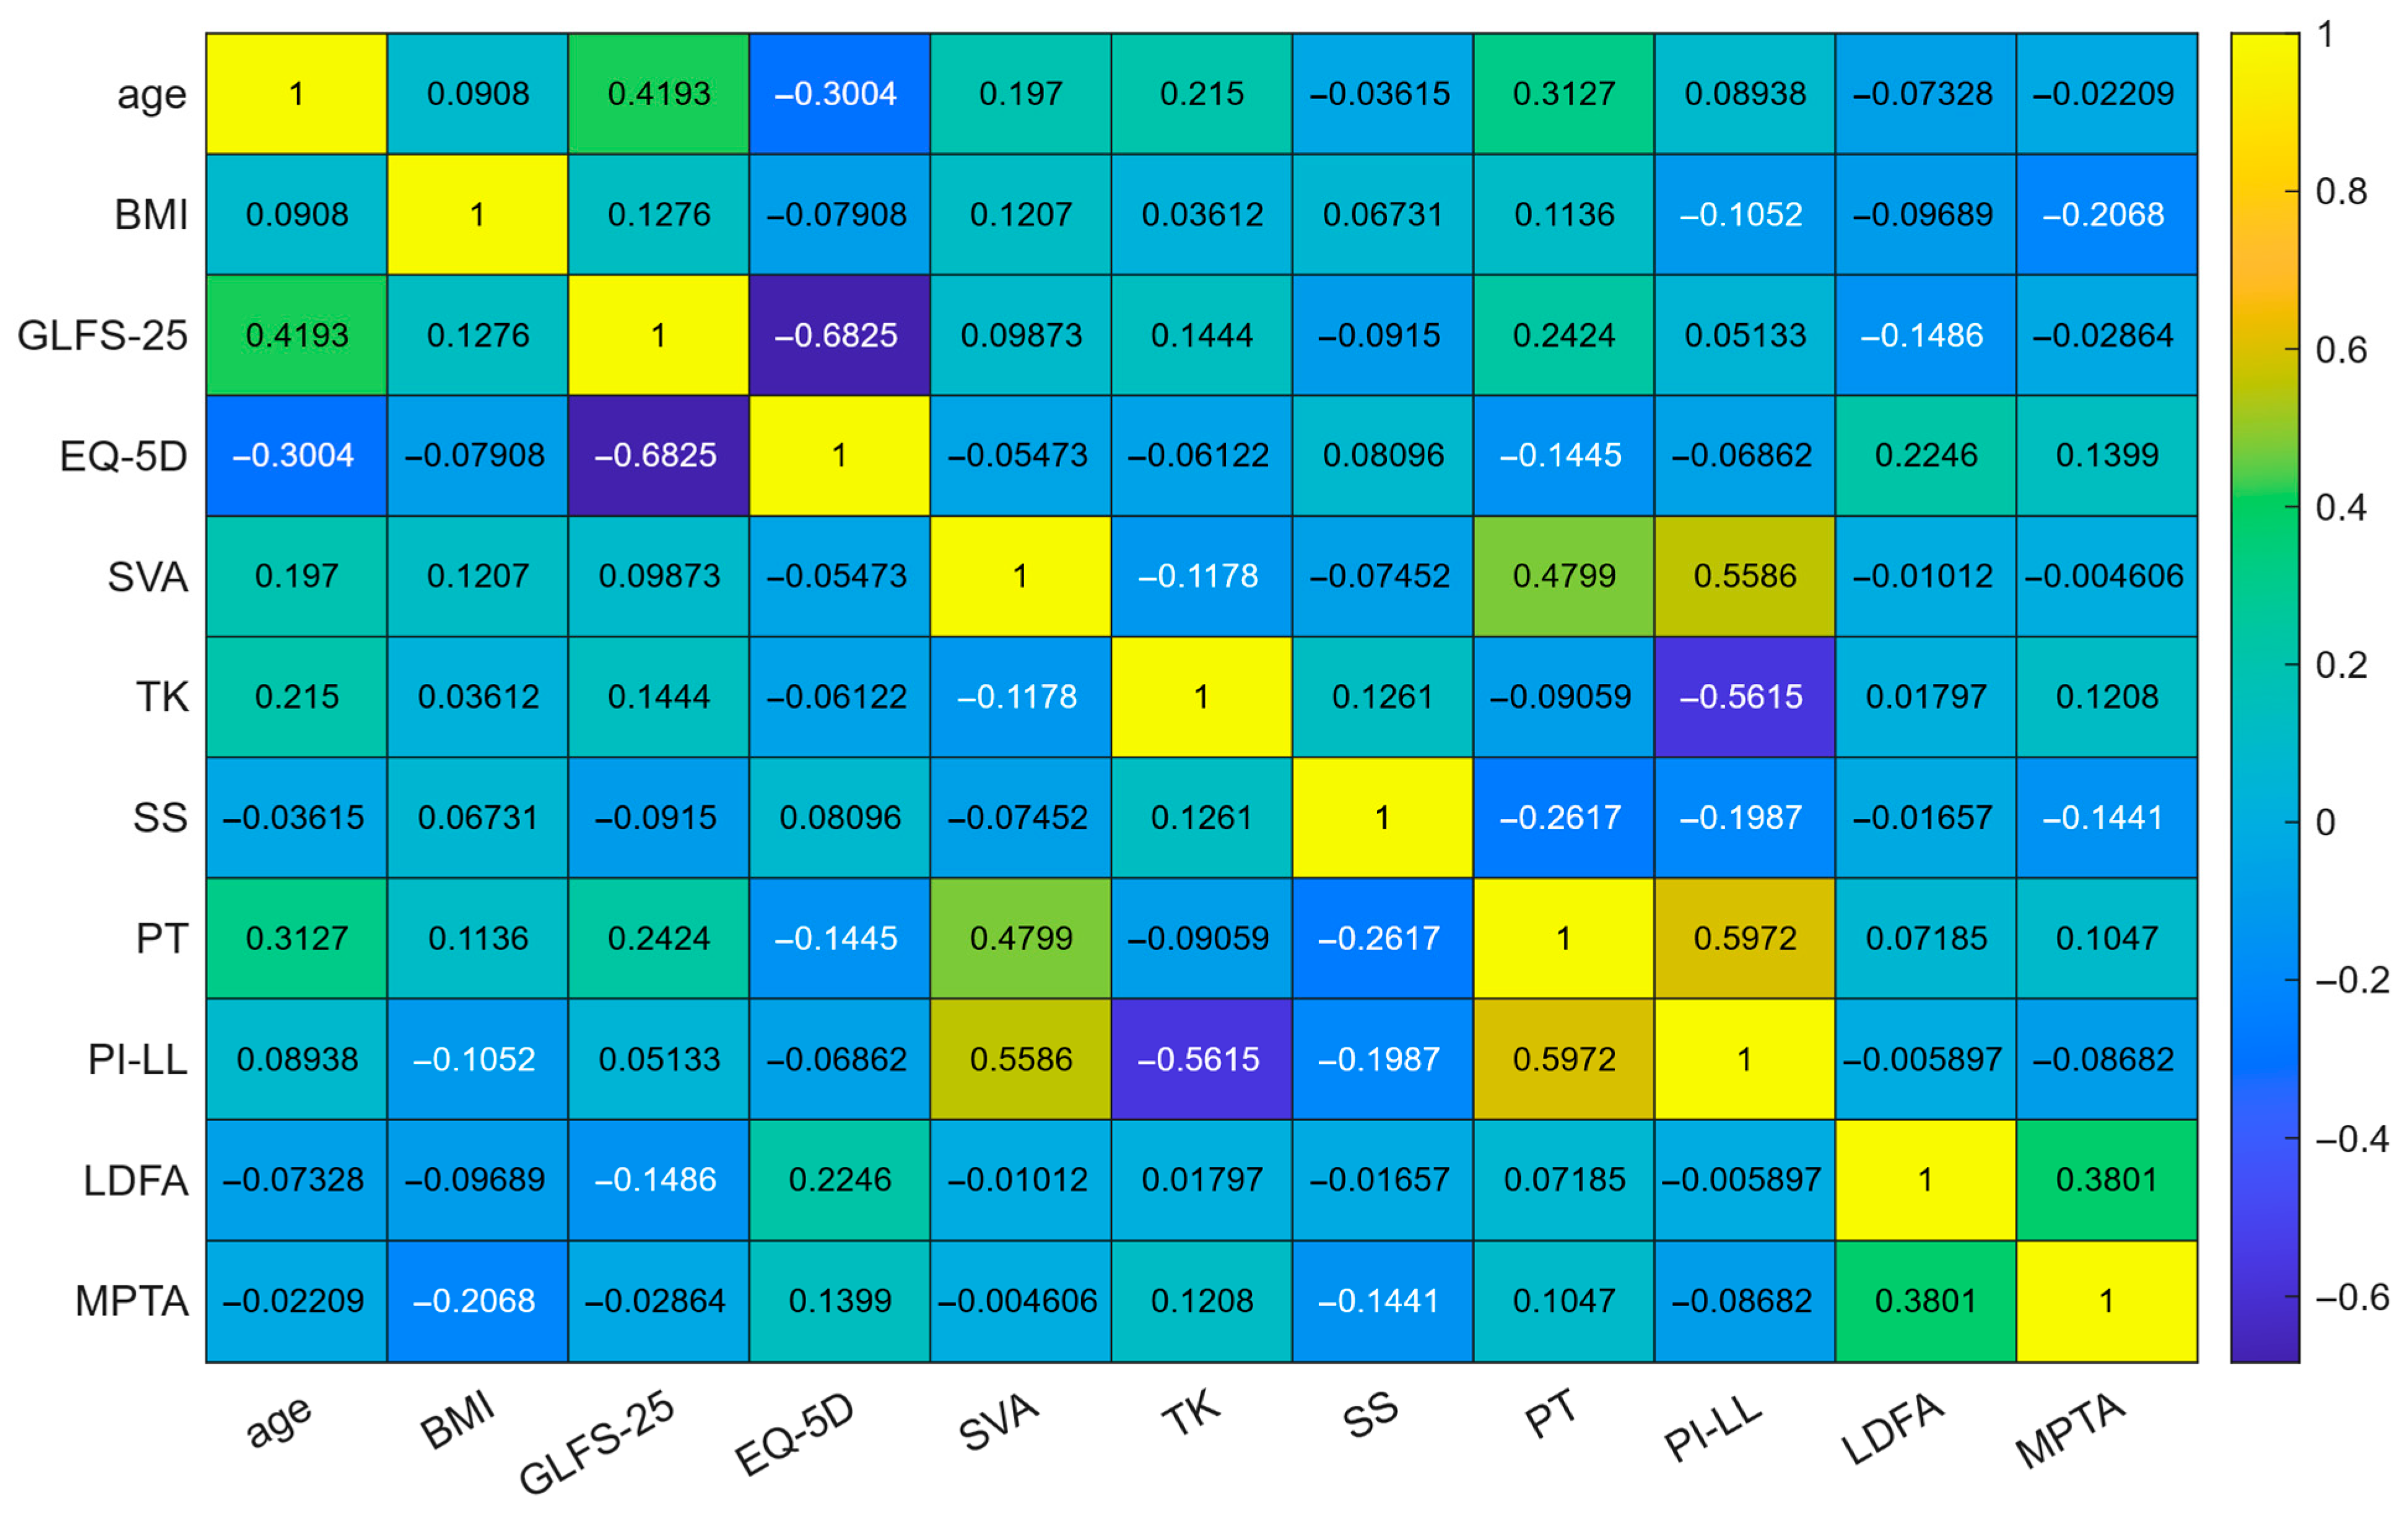
Figure 2. Spearman correlation matrix of baseline variables. Note: Colors encode Spearman’s correlation coefficients (yellow = positive, blue = negative). Numbers denote the coefficients. Abbreviations: BMI, body mass index; GLFS-25, 25-question Geriatric Locomotive Function Scale; EQ-5D, EuroQol 5-dimension; SVA, sagittal vertical axis; TK, thoracic kyphosis; SS, sacral slope; PT, pelvic tilt; PI–LL, pelvic incidence minus lumbar lordosis; LDFA, lateral distal femoral angle; MPTA, medial proximal tibial angle.
Jcm 14 07343 g002
Figure 3. Variance inflation factors (VIFs) of baseline explanatory variables. Note: Higher VIF indicates stronger multicollinearity; PI–LL mismatch had the highest VIF. BMI had the lowest, indicating its contribution to independent information. Abbreviations: VIF, variance inflation factor; BMI, body mass index; GLFS-25, 25-question Geriatric Locomotive Function Scale; EQ-5D, EuroQol 5-dimension; SVA, sagittal vertical axis; TK, thoracic kyphosis; SS, sacral slope; PT, pelvic tilt; PI–LL, pelvic incidence minus lumbar lordosis; LDFA, lateral distal femoral angle; MPTA, medial proximal tibial angle.
Jcm 14 07343 g003
Figure 4. ROC curves for models predicting incident KOA. Note: The combined logistic model using body mass index (BMI) and pelvic incidence–lumbar lordosis (PI–LL) mismatch achieved the highest discrimination (AUC 0.803) compared with BMI alone (AUC 0.753) and PI–LL alone (AUC 0.596). The optimal probability cutoff was selected by the shortest Euclidean distance to the upper-left corner (0, 1). Abbreviations: ROC, receiver operating characteristic; AUC, area under the curve; BMI, body mass index; PI–LL, pelvic incidence minus lumbar lordosis; KOA, knee osteoarthritis.
Jcm 14 07343 g004
Figure 5. Scatter plot of BMI versus PI–LL mismatch overlaid with predicted probabilities. Note: Background heatmap represents model’s estimated probability of belonging to I group based on logistic regression including BMI, PI–LL, and their interaction term (**). Dashed line marks the probability cutoff minimizing Euclidean distance from ROC curve to point (0,1), representing optimal balance between sensitivity and specificity. Participants are colored red if either knee belonged to the I group. NI group = blue squares and circles; I group = red crosses and asterisks; squares and crosses indicate unilateral lesions; circles and asterisks indicate bilateral lesions. Red plus signs indicate overlapping I and NI observations sharing identical BMI and PI–LL coordinates in which overlapping points are plotted as unilateral I. ** (logit [P] = β0 + β1·BMI + β2·PI–LL + β3·BMI·PI–LL) Abbreviations: BMI, body mass index; PI–LL, pelvic incidence minus lumbar lordosis; NI, non-incident knee osteoarthritis group (KOA); I, incident KOA group; ROC, receiver operating characteristic.
Jcm 14 07343 g005
Table 1. Baseline characteristics of the study population stratified by incident knee osteoarthritis (KOA) status (knee-level).
VariableOverallNon-Incident KOAIncident KOAp-Value
Age69.3 ± 6.169.1 ± 6.069.5 ± 6.30.691
Height150.1 ± 5.8150.2 ± 5.9149.6 ± 5.60.521
Body weight49.4 ± 7.447.6 ± 5.953.4 ± 8.8<0.001
BMI21.9 ± 3.021.1 ± 2.523.8 ± 3.1<0.001
One-leg standing time46.0 ± 19.947.2 ± 19.343.3 ± 20.80.226
FRT36.5 ± 6.536.4 ± 6.736.8 ± 5.90.694
GLFS-257.6 ± 9.66.2 ± 6.910.7 ± 13.60.022
EQ-5D0.9 ± 0.10.9 ± 0.10.8 ± 0.20.02
SVA31.6 ± 39.629.4 ± 37.936.7 ± 42.60.267
TK34.8 ± 14.136.0 ± 13.931.9 ± 14.20.073
LL42.5 ± 15.844.0 ± 14.539.0 ± 17.90.064
SS30.6 ± 9.231.1 ± 8.229.3 ± 11.00.254
PT18.8 ± 8.217.9 ± 8.120.8 ± 8.00.022
PI49.7 ± 9.949.3 ± 10.050.5 ± 9.60.462
PI–LL7.2 ± 16.05.3 ± 14.511.5 ± 18.30.026
FI3.3 ± 4.42.9 ± 4.24.1 ± 4.60.08
LDFA89.1 ± 2.689.3 ± 2.788.7 ± 2.30.131
MPTA85.6 ± 2.185.8 ± 2.185.1 ± 2.10.032
aHKA−3.5 ± 2.6−3.5 ± 2.5−3.6 ± 3.00.763
JLO174.8 ± 3.9175.1 ± 4.1173.8 ± 3.30.022
HKA2.6 ± 2.62.3 ± 2.23.1 ± 3.20.097
JLCA−1.0 ± 1.8−1.2 ± 1.8−0.7 ± 1.80.083
FCI−2.1 ± 2.8−2.2 ± 3.0−1.8 ± 2.50.311
TPI1.1 ± 2.61.1 ± 2.71.1 ± 2.30.887
Note: Values are presented as mean ± standard deviation. p-values were calculated using Student’s t-test for continuous variables. Abbreviations: BMI, body mass index; FRT, functional reach test; GLFS-25, 25-question Geriatric Locomotive Function Scale; EQ-5D, EuroQol 5-dimension; SVA, sagittal vertical axis; TK, thoracic kyphosis; LL, lumbar lordosis; SS, sacral slope; PT, pelvic tilt; PI, pelvic incidence; PI–LL, pelvic incidence minus lumbar lordosis; FI, femoral inclination; LDFA, lateral distal femoral angle; MPTA, medial proximal tibial angle; aHKA, arithmetic hip–knee–ankle angle; JLO, joint line obliquity; HKA, hip–knee–ankle angle; JLCA, joint line convergence angle, FCI, femoral condyle inclination; TPI, tibial plateau inclination.
Table 2. Multivariable logistic regression analysis incorporating a BMI × PI–LL interaction.
Variableβ95% CI (β) Lower95% CI (β)
Upper
OR95% CI (OR) Lower95% CI (OR) Upperp-Value
(Intercept)−11.445−15.293−7.5970.000012.2830.0005<0.001
BMI0.4550.2910.6191.5771.3381.858<0.001
PI–LL0.2860.0870.4861.3321.0911.6250.005
BMI × PI–LL−0.011−0.019−0.0030.9890.9810.9970.010
Note: The logistic value was calculated using the equation: 11.445 + 0.45543 × B M I + 0.28648 × P I L L 0.011004 × B M I × P I L L . Abbreviation: BMI, body mass index; PI–LL, pelvic incidence minus lumbar lordosis; β, regression coefficient; CI, confidence interval; OR, odds ratio.
Table 3. Performance of uni- and multivariable logistic-regression models predicting incident KOA using BMI, PI–LL mismatch, and their interaction.
Logistic Model (Variables)AUCCut-Off ProbabilityCut-Point ValueTPRFPR
β0 + β1·BMI0.75290.279122.06670.70690.3233
β0 + β1·PI–LL0.59560.312610.00000.53450.3383
β0 + β1·BMI + β2·PI–LL + β3·BMI·PI–LL0.80270.3997N/A0.67240.1504
Note: This table reports the area under the receiver operating characteristic [ROC] curve (AUC), the probability threshold (cut-off) that minimizes the Euclidean distance from the ROC curve to the point (0,1), the corresponding cut-off value on the predictor scale, and the true positive rate (TPR: sensitivity) and false positive rate (FPR: 1—specificity) at that threshold. Here, each β coefficient represents the change in the log-odds of the outcome associated with a one-unit increase in the corresponding predictor, with β0 denoting the model intercept. In-text values are rounded to two decimals; tabled values to four decimals; all computations used full precision. Abbreviations: β, regression coefficient; BMI, body mass index; PI–LL, pelvic incidence minus lumbar lordosis; AUC, area under the curve; ROC, receiver operating characteristic.
Disclaimer/Publisher’s Note: The statements, opinions and data contained in all publications are solely those of the individual author(s) and contributor(s) and not of MDPI and/or the editor(s). MDPI and/or the editor(s) disclaim responsibility for any injury to people or property resulting from any ideas, methods, instructions or products referred to in the content.