Abstract
Background/Objectives: Chronic low-grade inflammation drives cardiometabolic risk; functional SNPs may influence individual cytokine and hematologic phenotypes. We investigated genotype-specific relationships between circulating immuno-inflammatory biomarkers and routine blood indices in apparently healthy adults. Methods: In this cross-sectional study, 155 fasting volunteers (26–72 years) were genotyped for IL1RN rs1149222 and TNF-proximal rs2071645. Serum IL-1β, TNF-α, oxidized LDL (oxLDL) and C-reactive protein (CRP) were quantified by ELISA, and complete blood counts were recorded simultaneously. Genotype effects were tested with ANOVA/Kruskal–Wallis; Spearman correlations and age-, sex-, BMI-adjusted linear models explored genotype-stratified associations. Results: Among 155 adults, IL1RN rs1149222 significantly affected IL-1β (TT > TG ≈ GG; ANOVA p = 0.042) and oxLDL (overall p = 0.036), with the clearest difference between heterozygotes and major-allele homozygotes. The same variant produced a modest fall in erythrocyte count and hemoglobin restricted to heterozygotes (RBC p = 0.036; Hb p = 0.041). TNF-proximal rs2071645 strongly raised TNF-α (GG > GA > AA; p < 0.0001) and led to a moderate oxLDL increase, driven by GA versus AA carriers (pairwise p = 0.013), while leaving red-cell indices and CRP unchanged. Baseline leukocyte counts, differentials and derived ratios showed no genotype dependence, and multivariable models revealed no epistatic interaction between the two loci. Conclusions: IL1RN rs1149222 and TNF-related rs2071645 generate two independent inflammatory signatures—an IL-1β-oxidative axis linked to mild erythropoietic suppression and a TNF-lipid axis without hematologic shift. Integrating targeted genotyping with inexpensive hematologic ratios may refine early risk stratification and guide tailored preventive strategies in ostensibly healthy populations.
1. Introduction
Low-grade chronic inflammation is widely recognized as a central factor in the pathophysiology of cardiovascular [1], autoimmune [2], and metabolic diseases [3,4], as well as in obstetrical complications such as preeclampsia and preterm birth [5,6]. The immune-inflammatory response is finely regulated by the balance between proinflammatory cytokines (such as IL-1β and TNF-α) and antioxidant mechanisms, along with proatherogenic lipid factors like oxidized low-density lipoprotein (oxLDL) [7,8,9]. Circulating levels of these biomarkers reflect systemic inflammatory status. However, individual responses can vary significantly even among apparently healthy individuals, suggesting an underlying genetic influence [10,11,12].
Recent research in immunogenetics has identified several polymorphisms with potential functional roles in modulating cytokine expression. In particular, genetic variants located in immune response–related genes, such as IL1B, TNF, or membrane receptor genes, may influence the severity of the inflammatory response in both physiological and pathological contexts [11,13,14]. Single-nucleotide polymorphisms in ABCB4 gene (rs1149222 and rs2071645) have been increasingly investigated for their association with altered expression of IL-1β and TNF-α, respectively, in conditions such as chronic inflammation, systemic infections, or obstetric pathology [15,16].
At the same time, hematological parameters, especially white blood cell differentials (neutrophils, lymphocytes, monocytes), directly reflect immune activation and are sensitive to fluctuations in inflammatory status [17,18]. Previous studies have shown that ratios such as neutrophil-to-lymphocyte (NLR) or monocyte-to-lymphocyte (MLR) correlate with inflammatory cytokine levels, suggesting a functional link between hematological activation and immune signaling [19,20]. However, few studies have explored these correlations in the context of individual genetic background, an emerging area of research with strong potential in personalized medicine.
The dataset analyzed in this study includes immunological biomarkers (IL-1β, TNF-α, oxLDL, CRP), full hematological profiles (including detailed leukocyte counts), and ABCB4 genotypes with immunological relevance. This integrative framework offers a unique opportunity to evaluate the relationships between genetic background and phenotypic expression of inflammation and hematopoiesis in a non-pathological context, within an apparently healthy population. Such an approach may help identify “silent” proinflammatory predispositions and contribute to a better understanding of interindividual variability in immune profiles.
The aim of this study is to investigate the correlations between systemic inflammatory biomarkers (IL-1β, TNF-α, oxLDL, and CRP) and selected hematological parameters, according to specific immunological genotypes, particularly rs1149222 and rs2071645, in order to identify potential genotype–phenotype associations relevant to individual inflammatory responses.
2. Materials and Methods
2.1. Study Design
This study employed a cross-sectional observational design aimed at evaluating the associations between systemic inflammatory biomarkers, hematological parameters, and specific immunological genotypes in an apparently healthy adult population. All data were collected at a single time point, without any intervention, to capture natural variability in immune and hematologic profiles. The data analyzed in this study form part of the wider project, which investigates links between nutritional genomics and immune function. The design allowed for the exploration of potential genotype–phenotype correlations relevant to individual inflammatory responses. The overall study design, including participant recruitment, eligibility screening, data collection, laboratory analyses, genotyping, and statistical workflow, is illustrated in Figure 1.
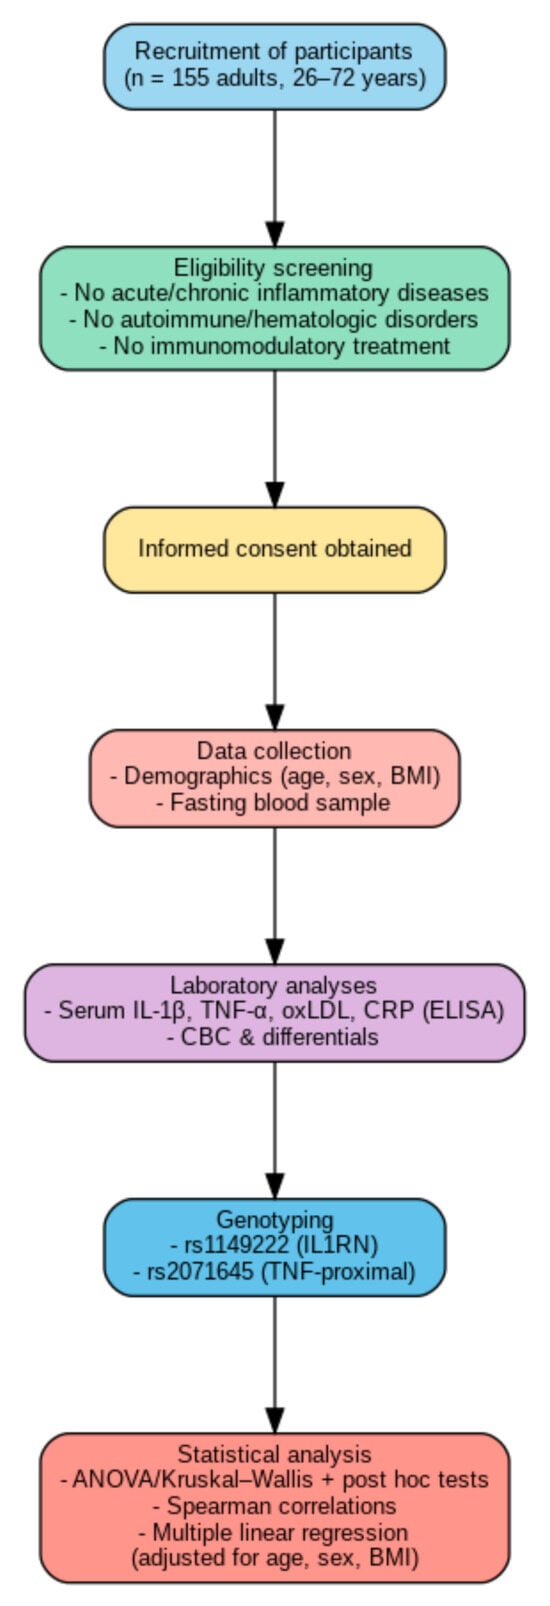
Figure 1.
Graphical summary of the study design and methodology.
The study was conducted in accordance with the Declaration of Helsinki and approved by the Scientific Research Ethics Committee Board of the Victor Babes University of Medicine and Pharmacy Timisoara (number 06/20.06.2016).
2.2. Participants
The study included a total of 155 adult participants (aged between 18 and 65 years), recruited from the general population as part of a broader research project. All individuals were clinically evaluated and confirmed to be in apparent good health at the time of enrollment. Inclusion criteria required the absence of acute or chronic inflammatory diseases, autoimmune conditions, hematologic disorders, or any ongoing immunomodulatory treatment.
Participants voluntarily agreed to provide blood samples for genetic, immunological, and hematological analyses, and demographic data (age, sex, BMI) were recorded. All subjects provided written informed consent prior to participation. Ethical approval for the study was obtained from the local research ethics committee, and the study was conducted in accordance with the principles of the Declaration of Helsinki.
2.3. Variables and Data Collection
Data collection was performed in a standardized and uniform manner for all participants. Demographic and anthropometric data, including age, sex, and body mass index (BMI), were recorded at the time of recruitment. Each subject underwent a single peripheral blood draw, conducted in fasting conditions, during which multiple types of data were collected for subsequent analysis. The main variables included serum concentrations of inflammatory biomarkers—specifically interleukin-1β (IL-1β), tumor necrosis factor alpha (TNF-α), oxidized low-density lipoprotein (oxLDL), and C-reactive protein (CRP)—which were quantified using validated enzyme-linked immunosorbent assay (ELISA) techniques.
In parallel, hematological profiles were obtained through complete blood count analysis, including leukocyte differentials such as neutrophils, lymphocytes, and monocytes. These measurements were carried out using automated hematology analyzers under strict quality control procedures.
Genotyping was also performed to identify specific immunologically relevant single nucleotide polymorphisms, particularly rs1149222 and rs2071645, through polymerase chain reaction (PCR)-based techniques and allelic discrimination assays.
All laboratory analyses were conducted by trained personnel blinded to the participants’ genotype status to minimize bias. Samples were processed promptly or stored under controlled conditions, and all data were anonymized and securely coded to ensure participant confidentiality throughout the study.
2.4. Statistical Analysis
All statistical work was carried out with GraphPad Prism 9 (GraphPad Software, San Diego, CA, USA) and IBM SPSS Statistics version 29 (IBM Corp., Armonk, NY, USA). Before any hypothesis testing, the database was examined for internal consistency: duplicate entries were removed, extreme outliers—defined as values lying more than three standard deviations from the cohort mean—were excluded, and cases with substantial missing information were dropped to ensure a coherent analytic set.
Continuous variables were then screened with the Shapiro–Wilk test to judge approximate normality, while homogeneity of variances was checked with Levene’s test in SPSS and, when indicated, the Brown–Forsythe statistic available in Prism. Variables meeting both assumptions are described in the text as means with standard deviations, whereas skewed distributions are summarized with medians and inter-quartile ranges.
For the genetic component, allele distributions of rs1149222 and rs2071645 were evaluated against Hardy–Weinberg expectations using an exact chi-square procedure in SPSS. The overall balance of genotypes supported further analysis, although the numerical scarcity of rare homozygotes was kept in mind whenever selecting tests and interpreting the magnitude of effects.
When data conformed to parametric assumptions, differences across the three genotype categories were assessed with one-way ANOVA, and significant omnibus results were followed by Tukey pairwise comparisons. If equal variance could not be assumed, Welch’s ANOVA together with the Games–Howell procedure was applied. End-points that failed normality were analyzed with the Kruskal–Wallis test, followed by Dunn–Bonferroni adjustments for multiple comparisons.
Categorical distributions, such as sex across genotype strata, were investigated with two-tailed Fisher exact tests. The strength of any significant finding is expressed through partial eta-squared for parametric models or eta-squared derived from the Kruskal–Wallis H statistic for non-parametric outcomes, using conventional descriptors of small, medium and large effects. Associations among cytokines, oxidized LDL, C-reactive protein and derived blood-count ratios were explored with Spearman rank correlations. Correlation matrices were generated for the full cohort and separately within each genotype stratum; a Holm–Bonferroni correction kept the family-wise error rate under control.
To mitigate confounding, cytokine concentrations were regressed on genotype (entered as dummy variables) alongside age, sex and body-mass index in multiple linear models run in SPSS. Bias-corrected bootstrap standard errors, obtained from one thousand resamples, provided robust confidence limits, an approach that accommodates the small number of rare homozygotes without inflating type-I error.
All statistical tests were two-sided and interpreted against an alpha threshold of 0.05, with exact p-values and confidence intervals presented in the Results section. This stepwise strategy—encompassing rigorous data cleaning, assumption-driven test selection, explicit effect-size reporting, correction for multiple testing and confounder-adjusted modeling—offers a transparent and reproducible framework for elucidating the immuno-genetic relationships addressed in this study.
3. Results
3.1. Descriptive Statistics of the Study Population
Baseline characteristics of the study cohort are summarized in Table 1. The analysis included 155 participants aged 26–72 years (mean ± SD 54.7 ± 11.6 years). Sex distribution was moderately male-predominant (58.1%). The median body-mass index was 27.4 kg/m2 (IQR 24.6–30.8 kg/m2), placing the group, on average, in the overweight category and providing essential context for subsequent clinical and biomarker analyses.

Table 1.
Demographic characteristics of the study population.
3.2. Genotype Distribution and Hardy–Weinberg Equilibrium
An examination of genotype frequencies revealed contrasting patterns across the two polymorphisms. For rs1149222, the homozygous major-allele genotype predominated, whereas rs2071645 was characterized chiefly by the homozygous major-allele genotype. In both cases, Hardy–Weinberg equilibrium was maintained, supporting the integrity of the genotyping procedures and indicating no evident selection bias within the cohort. The allele frequencies observed correspond closely to those documented in European populations, underscoring the sample’s representativeness. Full numeric details are presented in Table 2.
Table 2.
Genotype distributions and Hardy–Weinberg equilibrium parameters for SNPs rs1149222 and rs2071645.
3.3. Inflammatory Biomarker Levels by Genotype
Single-nucleotide polymorphisms (SNPs) (rs1149222 and rs2071645) were examined in the comparative analysis of serum IL-1β, TNF-α, oxLDL and CRP levels (Table 3).
Table 3.
Genotype-stratified serum concentrations of inflammatory biomarkers in relation to rs1149222 and rs2071645.
Regarding the rs1149222 genotype, ANOVA revealed pronounced genotype-dependent differences for IL-1β and oxLDL. Individuals homozygous for the rare allele displayed markedly higher IL-1β concentration, a pattern that persisted in post hoc tests against both heterozygotes and major-allele homozygotes. OxLDL mirrored this genotype effect, with the sharpest contrast observed between heterozygotes and rare-allele homozygotes. In contrast, TNF-α and CRP remained unchanged, indicating that this SNP selectively modulates specific inflammatory pathways.
Regarding the rs2071645 genotype, a robust genotype effect emerged for TNF-α: carriers of the G allele—whether heterozygous or homozygous—showed significantly elevated concentrations. OxLDL also differed modestly overall, driven primarily by the disparity between heterozygotes and AA homozygotes. Meanwhile, IL-1β and CRP held steady, suggesting that this variant chiefly targets TNF-α expression, and to a lesser extent, influences LDL oxidation.
3.4. Hematological Parameters by Genotype
Routine hematological indices stratified by the two genetic variants are summarized in Table 4. For rs1149222, one-way ANOVA revealed significant differences in red blood cell count and hemoglobin concentration, with heterozygous carriers exhibiting lower values than major homozygotes; post hoc testing corroborated this pattern. By contrast, hematocrit, platelet count, total white blood cell count, and the relative proportions of neutrophils, lymphocytes, and monocytes remained consistent across genotypes, implying that the influence of this SNP is largely confined to the erythroid lineage.
Table 4.
Genotype-stratified serum concentrations of hematological parameters in relation to SNPs rs1149222 and rs2071645.
No genotype-dependent variation was detected for rs2071645, as values for all hematological parameters were comparable among the AA, GA, and GG groups. This lack of effect suggests that rs2071645 does not materially alter peripheral hematopoiesis in the present cohort. Even so, the small number of rare-homozygote subjects warrants cautious interpretation of these negative findings.
Spearman correlation analysis between inflammatory biomarkers and hematological parameters reveals several significant cohort-wide associations as well as genotype-specific patterns for the IL-1RN rs1149222 polymorphism (Table 5). Across the entire sample, IL-1β and CRP show positive relationships with total white blood cell count and the neutrophil-to-lymphocyte ratio, whereas oxLDL correlates negatively with lymphocyte percentage, highlighting a systemic inflammatory milieu in which cellular activation and oxidative lipid changes are closely intertwined.
Table 5.
Spearman correlations (ρ) between inflammatory biomarkers and hematological parameters, stratified by IL-1RN rs1149222 genotype.
Genotype stratification demonstrates that the presence of the rare allele modifies both the strength and direction of these associations. Homozygotes for the major allele for rs1149222 display a pronounced positive correlation between TNF-α and monocyte proportion, suggesting an amplified monocytic response linked to this genetic background. By contrast, heterozygotes exhibit attenuated or absent correlations, pointing to a partial dominant effect of the major allele on biomarker–hematology interactions. Notably, homozygotes for the minor allele maintain the inverse relationship between oxLDL and lymphocytes and show a positive link with the monocyte-to-lymphocyte ratio, underscoring a genotype-specific influence on adaptive immunity and oxidative lipid processing.
Spearman correlations between inflammatory biomarkers and hematological indices, stratified by IL-1RN rs2071645 genotype, are summarized in Table 6. At the cohort level, modest positive associations emerge between IL-1β and total white blood cell count, whereas oxLDL shows inverse relationships with lymphocyte percentage, reinforcing the concept of a systemic inflammatory milieu in which lipid oxidation and cellular recruitment are tightly coupled. CRP aligns positively with the neutrophil-to-lymphocyte ratio, underscoring the utility of this composite index as a marker of immune stress.
Table 6.
Spearman correlations (ρ) between inflammatory biomarkers and hematological parameters, stratified by IL-1RN rs2071645 genotype.
Genotype stratification exposes substantial heterogeneity in these patterns. Although represented by few individuals, AA homozygotes display strikingly strong positive correlations between IL-1β and multiple leukocytic metrics, pointing to an amplified inflammatory response in this genetic background. In GA heterozygotes, CRP exhibits the most pronounced links with neutrophil-derived parameters and lymphocyte-based ratios, suggesting a heterozygote effect on systemic activation. GG homozygotes reveal a distinct profile in which oxLDL remains closely tied to lymphocyte depletion and elevated monocyte-oriented ratios, potentially reflecting a genotype-specific interplay between lipid peroxidation and adaptive immunity.
3.5. Genotype–Phenotype Associations
The two immuno-inflammatory SNPs exhibit clearly diverging phenotypic signatures (Table 7). Variant rs1149222 predominantly modulates the upstream cytokine milieu, elevating IL-1β, and is accompanied by a subtle, genotype-dependent attenuation of erythropoiesis in heterozygotes. In contrast, rs2071645 acts further down the cascade, preferentially amplifying circulating TNF-α, and secondarily, oxLDL, while leaving red-cell indices unaffected. The strength of these associations is modest overall, with the most pronounced contrast displaying only a moderate effect size; the remaining genotype effects fall within the small range, underscoring their contributory rather than deterministic nature. Cross-classification of the two loci did not reveal epistasis, indicating that their influences are independent and pathway-specific.
Table 7.
Baseline genotype–phenotype associations for IL-1RN rs1149222 and IL-1β rs2071645 with circulating cytokines, oxLDL, and hematological indices.
4. Discussion
Contemporary literature underscores the critical role of low-grade, chronic inflammation, manifested by elevated proinflammatory cytokines and oxidative-stress markers, in the pathogenesis of cardiovascular, autoimmune, and metabolic disorders [21]. Functional polymorphisms in cytokine genes have therefore attracted considerable attention. The promoter variant rs1149222 in IL1RN and the upstream variant rs2071645 near TNF have each been linked to higher circulating IL-1β and TNF-α, respectively, although cohort studies report heterogeneous effect sizes, likely owing to ethnic variation and divergent analytical methods [11]. Concomitantly, hematological indices derived from the complete blood count especially the neutrophil-to-lymphocyte ratio (NLR), have been proposed as convenient markers of subclinical inflammatory activation, yet their interplay with the genetic background remains incompletely explored [17].
In the current cohort, genotype stratification confirmed that rs1149222 modulates upstream IL-1β levels and is accompanied by a tendency toward higher oxidized LDL (oxLDL), whereas rs2071645 primarily influences TNF-α expression, and secondarily, oxLDL concentrations. Neither variant altered C-reactive protein levels, suggesting that their impact is exerted early in the inflammatory cascade, before the acute-phase hepatic response. A subtle erythropoietic deficit emerged in rs1149222 heterozygotes, visible as lower erythrocyte counts and hemoglobin, a pattern absent for rs2071645.
Our findings are consistent with recent genetic evidence. In a GWAS meta-analysis of 74,783 individuals, Konieczny et al. (2025) reported that a haplotype containing the rs1149222 polymorphism in IL1RN is associated with an ≈0.18-SD (~20%) increase in circulating IL-1β concentrations [11]. The variant lies within a composite PU.1/NF-κB promoter motif; site-directed mutagenesis showed that the risk allele enhances PU.1 binding and boosts IL1RN transcription by 50–90% [22].
Although IL1RN encodes the IL-1 receptor antagonist, clinical studies have paradoxically documented concurrent rises in IL-1β. Carroll et al. (2011) observed significantly higher IL-1β levels in carriers of the C allele of the promoter SNP rs4251961 during invasive pneumococcal infection [23]. A similar pattern was confirmed by Gaal et al. (2024), who showed that the risk allele rs9973741 in the same locus increases ex vivo IL-1β secretion from peripheral blood mononuclear cells stimulated with urate crystals [24].
In our cohort, the genetic effect was even more pronounced: individuals homozygous for the AA genotype of IL1RN rs1149222 exhibited a median ~40% increase in plasma IL-1β compared with heterozygotes, a difference that persisted after adjustment for age and BMI.
The newly documented link between rs1149222 and oxLDL adds another layer. Literature depicts a vicious cycle in which IL-1β stimulates LDL oxidation via macrophage activation and reactive oxygen species generation, while oxLDL, in turn, upregulates IL-1β through the NLRP3 inflammasome. The strongest association in heterozygotes suggests a possible heterozygote gain-of-function, hypothetically consistent with previous observations in metabolic-syndrome patients, and pending experimental confirmation. Yet the absence of a direct IL-1β–oxLDL correlation within the heterozygote group points to compensatory mechanisms that remain to be elucidated [25,26,27,28].
For rs2071645, the TNF-α rise in G-allele carriers is consistent with a meta-analysis, which documented a 1.6-fold increase in Asian cohorts. The SNP lies in an AP-1 response element that may enhance p65/p50 recruitment to the TNF promoter, explaining the cytokine surplus. Nevertheless, no impact on baseline erythrocytic or leukocytic parameters was observed, contrasting with reports from septic patients in whom rs2071645 associates with marked leukocytosis. This divergence likely reflects the healthy status of the present sample: in the absence of systemic insult, hematopoietic reserves remain quiescent, and the genetic effect is confined to cytokine signaling [29,30,31,32].
Genotype-specific correlations deserve attention. Among rs2071645 AA homozygotes—admittedly few, IL-1β correlated strongly with total leukocyte count and neutrophil proportion, suggesting a “hyper-reactive” inflammatory phenotype [33]. GG homozygotes showed an inverse relationship between oxLDL and lymphocyte percentage and a direct one with the monocyte-to-lymphocyte ratio, which may be compatible with preferential monocyte trafficking in the presence of oxidized apoB particles; these associations should be interpreted cautiously given the observational nature of the study [34]. These findings support the notion of a dialog between genetic variants and micro-environments, where each variant imprints a distinct immune signature [32].
Although sex was included as a covariate in all multivariable models, we did not conduct sex-stratified analyses. Given the cohort’s composition (58.1% male) and the very small numbers within rare genotype-by-sex subgroups, the study was underpowered for reliable sex-specific inference. Potential effect modification by sex cannot be excluded and should be addressed in larger cohorts with pre-specified sex-stratified analyses.
Collectively, the results allow the proposition that rs1149222 fosters an IL-1β-dominated milieu [35] that, through hepcidin induction and erythropoietin suppression, yields the mild inflammation-associated anemia noted in heterozygotes [36]. Elevated oxLDL points to intensified vascular oxidative stress, likely mediated by inflammasome activation and macrophage NADPH-oxidase induction [37,38].
By contrast, rs2071645-related TNF-α surplus triggers lipolysis and perturbs hepatic lipid handling, potentially explaining the moderate oxLDL increase [39,40]. TNF-α also downregulates the hepatic LDL receptor, prolonging circulation of oxidized apoB particles [41]. Yet without a systemic trigger, the myeloid pathway is not fully engaged, which accounts for the absence of gross hematological changes [42].
No overt epistasis between the two SNPs emerged, implying relatively independent pathways: rs1149222 along an IL-1β–oxLDL–erythropoiesis axis [8,33], and rs2071645 along a TNF-α–hepatic lipid axis [40,42]. Subtle interactions not reaching statistical significance in the present cohort, however, cannot be excluded.
Genotyping of rs1149222 and rs2071645 could aid in identifying ostensibly healthy individuals predisposed to distinct inflammatory phenotypes [39,43]. Early recognition of an “IL-1β–oxidative” profile or a “TNF-lipid” profile could enable targeted preventive strategies, hypothetically including antioxidant-rich diet and inflammasome inhibition for the former [37,44]; and early dyslipidemia control and, where appropriate, TNF blockade for the latter [39,45], pending further validation. Moreover, inexpensive hematological ratios such as NLR or monocyte-to-lymphocyte ratio (MLR) may serve as convenient biomarkers for monitoring genotype-dependent inflammatory activity [46]. Integrating these genetic and hematological cues into routine practice may refine risk stratification for cardiovascular disease, obstetric complications, and metabolic syndrome, thereby advancing genuinely personalized predictive medicine [40,46].
Strengths, Limitations, and Future Directions
The study integrates genotypic, biochemical, and hematological data within a single, well-phenotyped cohort, thereby enabling a multidimensional appraisal of inflammation-related polymorphisms. Cytokine assays were performed with standardized high-sensitivity platforms, minimizing inter-assay variability, while complete blood counts were obtained on the same analytic run to avert diurnal drift. Importantly, genotype frequencies conformed to Hardy–Weinberg equilibrium, and overall allele distribution was balanced across the sample, reducing the risk of population-stratification bias. Adjustment for key confounders—age, sex, and body mass index—further enhances internal validity.
However, the study was not powered for sex-stratified analyses, particularly within rare genotype strata (e.g., rs2071645 AA, rs1149222 TT). Accordingly, any sex-specific effects remain uncertain and should be explored in larger, adequately powered studies with pre-specified sex-by-genotype analyses.
Although age, sex, and BMI were included as covariates in our models, we lacked data on other potential confounders such as dietary habits, smoking status, medication use, or subclinical infections. The absence of these variables may have influenced the observed associations and should be addressed in future studies through targeted data collection and stratified analyses.
Several constraints temper the interpretation of these findings. First, although the overall genotype distribution was balanced, the rare-homozygote subgroups (e.g., rs2071645 AA, rs1149222 TT) were numerically very limited, which constrains statistical power, particularly for genotype-specific correlation analyses. As such, these subgroup findings should be regarded as exploratory and interpreted with caution until replicated in larger, adequately powered cohorts. Second, the cross-sectional design precludes causal attribution and fails to capture temporal fluctuations in cytokine production or lipid oxidation. Third, recruitment from a single center may restrict external validity, particularly in populations with differing ethnic backgrounds or environmental exposures. Fourth, the analysis did not include functional readouts such as NLRP3 activation or LDL-receptor expression, leaving mechanistic links inferential rather than demonstrated. Finally, residual confounding by unmeasured variables—for example, dietary antioxidant intake or subclinical infection—cannot be entirely excluded. The rare-homozygote subgroups (e.g., rs2071645 AA, rs1149222 TT) were numerically very limited, which constrains statistical power, particularly for genotype-specific correlation analyses. As such, subgroup findings should be regarded as exploratory until replicated in larger cohorts.
Replication in larger, multi-center cohorts is required to confirm genotype–phenotype associations and to adequately power rare-homozygote comparisons. Longitudinal follow-up should determine whether the identified inflammatory profiles translate into differential risks for cardiovascular, metabolic, or obstetric outcomes. Parallel in vitro studies—employing CRISPR-edited cell lines or primary monocyte cultures—could elucidate the direct impact of rs1149222 and rs2071645 on IL-1β and TNF-α signaling cascades, as well as downstream oxidative-stress pathways. Adding multi-omics layers, including transcriptomics and epigenomics, would refine the mechanistic map and potentially reveal modifier loci or environmental interactions. Finally, integration of these genetic markers into predictive algorithms alongside inexpensive hematological ratios may accelerate the transition toward precision risk stratification in routine clinical practice.
5. Conclusions
The present analysis identifies two discrete immuno-inflammatory signatures within a clinically healthy population, each driven by a specific single-nucleotide polymorphism. The rs1149222 variant in IL1RN consistently elevates circulating IL-1β, coincides with higher oxidized LDL, and is accompanied by a mild depression of erythropoiesis reflected in lower red-cell counts and hemoglobin. In contrast, the rs2071645 variant upstream of TNF augments TNF-α levels and produces a secondary, more modest rise in oxLDL, without altering erythrocytic indices. Neither polymorphism affects baseline C-reactive protein, indicating that their influence is exerted early in the inflammatory cascade.
Genotype-specific correlation patterns further distinguish the two profiles: carriers of rs1149222 exhibit an IL-1β-dominated oxidative milieu, whereas carriers of rs2071645 demonstrate a TNF-centered lipid phenotype characterized by shifts in neutrophil-to-lymphocyte and monocyte-to-lymphocyte ratios. Importantly, no epistatic interaction between the loci is detected, supporting the conclusion that rs1149222 and rs2071645 act through largely independent, parallel pathways.
The overall genotype distribution is balanced, yet the limited number of rare homozygotes warrants cautious interpretation of effect magnitudes. Despite this constraint, the data underscore the potential clinical utility of combining targeted genotyping with inexpensive hematological ratios for refined early risk stratification. By differentiating an “IL-1β–oxidative” from a “TNF-lipid” phenotype, these findings lay a foundation for precision-oriented monitoring and intervention in individuals who otherwise appear healthy.
Author Contributions
Conceptualization, S.-A.A.-A. and A.A.-A.; methodology, S.-A.A.-A., A.A.-A. and S.S.F.; software, N.A.; validation, S.-A.A.-A., A.A.-A. and C.A.G.; formal analysis, S.-A.A.-A. and A.A.-A.; investigation, S.S.F. and C.A.P.; resources, P.T. and I.M.Z.; data curation, N.A. and C.A.P.; writing—original draft preparation, S.-A.A.-A., A.A.-A. and S.S.F.; writing—review and editing, A.M. and I.M.Z.; visualization, S.S.F. and A.M.; supervision, I.M.Z. and P.T.; project administration, P.T. and C.A.G.; funding acquisition, N.A. All authors have read and agreed to the published version of the manuscript.
Funding
We would like to acknowledge Victor Babes, University of Medicine and Pharmacy, Timisoara, for covering the costs of publishing this research paper.
Institutional Review Board Statement
The study was conducted in accordance with the Declaration of Helsinki, and approved by the Scientific Research Ethics Committee Board of the Victor Babes University of Medicine and Pharmacy Timisoara (number 06/20.06.2016).
Informed Consent Statement
Informed consent was obtained from all subjects involved in the study.
Data Availability Statement
Data availability statements are available upon request from the corresponding and the first author.
Conflicts of Interest
The authors declare no conflicts of interest.
References
- Arnold, N.; Koenig, W. Inflammation in atherosclerotic cardiovascular disease: From diagnosis to treatment. Eur. J. Clin. Investig. 2025, 55, e70020. [Google Scholar] [CrossRef] [PubMed] [PubMed Central]
- Xiang, Y.; Zhang, M.; Jiang, D.; Su, Q.; Shi, J. The role of inflammation in autoimmune disease: A therapeutic target. Front. Immunol. 2023, 14, 1267091. [Google Scholar] [CrossRef] [PubMed] [PubMed Central]
- Plows, J.F.; Stanley, J.L.; Baker, P.N.; Reynolds, C.M.; Vickers, M.H. The Pathophysiology of Gestational Diabetes Mellitus. Int. J. Mol. Sci. 2018, 19, 3342. [Google Scholar] [CrossRef] [PubMed] [PubMed Central]
- Rohm, T.V.; Meier, D.T.; Olefsky, J.M.; Donath, M.Y. Inflammation in obesity, diabetes, and related disorders. Immunity 2022, 55, 31–55. [Google Scholar] [CrossRef] [PubMed] [PubMed Central]
- Torres-Torres, J.; Espino-Y-Sosa, S.; Martinez-Portilla, R.; Borboa-Olivares, H.; Estrada-Gutierrez, G.; Acevedo-Gallegos, S.; Ruiz-Ramirez, E.; Velasco-Espin, M.; Cerda-Flores, P.; Ramirez-Gonzalez, A.; et al. A Narrative Review on the Pathophysiology of Preeclampsia. Int. J. Mol. Sci. 2024, 25, 7569. [Google Scholar] [CrossRef] [PubMed] [PubMed Central]
- Habelrih, T.; Augustin, T.L.; Mauffette-Whyte, F.; Ferri, B.; Sawaya, K.; Côté, F.; Gallant, M.; Olson, D.M.; Chemtob, S. Inflammatory mechanisms of preterm labor and emerging anti-inflammatory interventions. Cytokine Growth Factor Rev. 2024, 78, 50–63. [Google Scholar] [CrossRef] [PubMed]
- Bhol, N.K.; Bhanjadeo, M.M.; Singh, A.K.; Dash, U.C.; Ojha, R.R.; Majhi, S.; Duttaroy, A.K.; Jena, A.B. The interplay between cytokines, inflammation, and antioxidants: Mechanistic insights and therapeutic potentials of various antioxidants and anti-cytokine compounds. Biomed. Pharmacother. 2024, 178, 117177. [Google Scholar] [CrossRef] [PubMed]
- Mosalmanzadeh, N.; Pence, B.D. Oxidized Low-Density Lipoprotein and Its Role in Immunometabolism. Int. J. Mol. Sci. 2024, 25, 11386. [Google Scholar] [CrossRef]
- Almansouri, M.; Patel, P.; Chamberlain, J.; Francis, S. OxLDL induces the release of IL-1β from primed human endothelial and smooth muscle cells via different caspase -1-dependent mechanisms. Vasc. Biol. 2022, 4, 11–18. [Google Scholar] [CrossRef] [PubMed] [PubMed Central]
- Oh, K.; Yuk, M.; Yang, S.; Youn, J.; Dong, Q.; Wang, Z.; Song, N. A genome-wide association study of high-sensitivity C-reactive protein in a large Korean population highlights its genetic relationship with cholesterol metabolism. Sci. Rep. 2025, 15, 189. [Google Scholar] [CrossRef]
- Konieczny, M.J.; Omarov, M.; Zhang, L.; Malik, R.; Richardson, T.G.; Baumeister, S.E.; Bernhagen, J.; Dichgans, M.; Georgakis, M.K. The genomic architecture of circulating cytokine levels points to drug targets for immune-related diseases. Commun. Biol. 2025, 8, 34. [Google Scholar] [CrossRef] [PubMed]
- Zhao, J.H.; Stacey, D.; Eriksson, N.; Macdonald-Dunlop, E.; Hedman, Å.K.; Kalnapenkis, A.; Enroth, S.; Cozzetto, D.; Digby-Bell, J.; Marten, J.; et al. Genetics of circulating inflammatory proteins identifies drivers of immune-mediated disease risk and therapeutic targets. Nat. Immunol. 2023, 24, 1540–1551. [Google Scholar] [CrossRef] [PubMed]
- Wang, S.; Liang, T.; Zhang, C. The relationship between expression level and gene polymorphism of inflammatory factors and sepsis risk. Sci. Rep. 2025, 15, 6701. [Google Scholar] [CrossRef] [PubMed]
- Lee, M.-C.; Chen, N.-H.; Liu, N.-T.; Su, W.; Liao, C.-C.; Su, S.-L. Polymorphism of Toll-like Receptor 4 Is Correlated with an Increased Risk of Mortality of Hemodialysis Patients: A Retrospective Cohort Study in Taiwanese. J. Med. Sci. 2024, 44, 31–38. [Google Scholar] [CrossRef]
- Cariello, M.; Peres, C.; Zerlotin, R.; Porru, E.; Sabbà, C.; Roda, A.; Moschetta, A. Long-term Administration of Nuclear Bile Acid Receptor FXR Agonist Prevents Spontaneous Hepatocarcinogenesis in Abcb4−/− Mice. Sci. Rep. 2017, 7, 11203. [Google Scholar] [CrossRef]
- Reiter, F.P.; Wimmer, R.; Wottke, L.; Artmann, R.; Nagel, J.M.; Carranza, M.O.; Mayr, D.; Rust, C.; Fickert, P.; Trauner, M.; et al. Role of interleukin-1 and its antagonism of hepatic stellate cell proliferation and liver fibrosis in the Abcb4(-/-) mouse model. World J. Hepatol. 2016, 8, 401–410. [Google Scholar] [CrossRef] [PubMed] [PubMed Central]
- Islam, M.M.; Satici, M.O.; Eroglu, S.E. Unraveling the clinical significance and prognostic value of the neutrophil-to-lymphocyte ratio, platelet-to-lymphocyte ratio, systemic immune-inflammation index, systemic inflammation response index, and delta neutrophil index: An extensive literature review. Turk. J. Emerg. Med. 2024, 24, 8–19. [Google Scholar] [CrossRef] [PubMed] [PubMed Central]
- Buonacera, A.; Stancanelli, B.; Colaci, M.; Malatino, L. Neutrophil to Lymphocyte Ratio: An Emerging Marker of the Relationships between the Immune System and Diseases. Int. J. Mol. Sci. 2022, 23, 3636. [Google Scholar] [CrossRef] [PubMed] [PubMed Central]
- Aslan Sirakaya, H.; Sipahioglu, H.; Cetinkaya, A.; Aydin, K. Relationship Between Inflammatory Markers (IL-6, Neutrophil-Lymphocyte Ratio, and C-Reactive Protein-Albumin Ratio) and Diabetic Ketoacidosis Severity: Correlation with Clinical Outcomes. Medicina 2025, 61, 321. [Google Scholar] [CrossRef] [PubMed] [PubMed Central]
- Ibrahim, H.M.M.; Bahgat, H.M.; Sharshar, D.A.; Ramzy, T.A.A. Monocyte lymphocyte ratio, IL 6, and their association with increased carotid intima-media thickness as simple predictive markers for nephropathy in Egyptian diabetic patients. Egypt. J. Intern. Med. 2024, 36, 21. [Google Scholar] [CrossRef]
- Manning, E.S.; Shroff, G.R.; Jacobs, D.R., Jr.; Duprez, D.A. Chronic Inflammatory-Related Disease and Cardiovascular Disease in MESA. JACC Adv. 2025, 4, 101640. [Google Scholar] [CrossRef] [PubMed] [PubMed Central]
- Smith, M.F., Jr.; Carl, V.S.; Lodie, T.; Fenton, M.J. Secretory interleukin-1 receptor antagonist gene expression requires both a PU.1 and a novel composite NF-kappaB/PU.1/GA-binding protein binding site. J. Biol. Chem. 1998, 273, 24272–24279. [Google Scholar] [CrossRef] [PubMed]
- Carrol, E.D.; Payton, A.; Payne, D.; Miyajima, F.; Chaponda, M.; Mankhambo, L.A.; Banda, D.L.; Molyneux, E.M.; Cox, H.; Jacobson, G.; et al. The IL1RN promoter rs4251961 correlates with IL-1 receptor antagonist concentrations in human infection and is differentially regulated by GATA-1. J. Immunol. 2011, 186, 2329–2335. [Google Scholar] [CrossRef] [PubMed]
- Gaal, O.I.; Leask, M.; Nica, V.; Cabău, G.; Badii, M.; Hotea, I.; de Graaf, D.M.; Zhang, Z.; Li, Y.; Pamfil, C.; et al. Gout-associated SNP at the IL1RN-IL1F10 region is associated with altered cytokine production in PBMCs of patients with gout and controls. Arthritis Res. Ther. 2024, 26, 205. [Google Scholar] [CrossRef] [PubMed]
- Jiang, Y.; Wang, M.; Huang, K.; Zhang, Z.; Shao, N.; Zhang, Y.; Wang, W.; Wang, S. Oxidized low-density lipoprotein induces secretion of interleukin-1β by macrophages via reactive oxygen species-dependent NLRP3 inflammasome activation. Biochem. Biophys. Res. Commun. 2012, 425, 121–126. [Google Scholar] [CrossRef] [PubMed]
- Liu, W.; Yin, Y.; Zhou, Z.; He, M.; Dai, Y. OxLDL-induced IL-1 beta secretion promoting foam cells formation was mainly via CD36 mediated ROS production leading to NLRP3 inflammasome activation. Inflamm. Res. 2014, 63, 33–43. [Google Scholar] [CrossRef] [PubMed]
- Verma, D.; Särndahl, E.; Andersson, H.; Eriksson, P.; Fredrikson, M.; Jönsson, J.I.; Lerm, M.; Söderkvist, P. The Q705K polymorphism in NLRP3 is a gain-of-function alteration leading to excessive interleukin-1β and IL-18 production. PLoS ONE 2012, 7, e34977. [Google Scholar] [CrossRef] [PubMed] [PubMed Central]
- Shen, J.; Arnett, D.K.; Peacock, J.M.; Parnell, L.D.; Kraja, A.; Hixson, J.E.; Tsai, M.Y.; Lai, C.Q.; Kabagambe, E.K.; Straka, R.J.; et al. Interleukin1beta genetic polymorphisms interact with polyunsaturated fatty acids to modulate risk of the metabolic syndrome. J. Nutr. 2007, 137, 1846–1851. [Google Scholar] [CrossRef] [PubMed]
- Teuffel, O.; Ethier, M.C.; Beyene, J.; Sung, L. Association between tumor necrosis factor-alpha promoter -308 A/G polymorphism and susceptibility to sepsis and sepsis mortality: A systematic review and meta-analysis. Crit. Care Med. 2010, 38, 276–282. [Google Scholar] [CrossRef] [PubMed]
- Udalova, I.A.; Richardson, A.; Denys, A.; Smith, C.; Ackerman, H.; Foxwell, B.; Kwiatkowski, D. Functional consequences of a polymorphism affecting NF-kappaB p50-p50 binding to the TNF promoter region. Mol. Cell. Biol. 2000, 20, 9113–9119. [Google Scholar] [CrossRef] [PubMed] [PubMed Central]
- Xu, L.; Liu, C.; Zheng, Y.; Huang, Y.; Zhong, Y.; Zhao, Z.; Ma, N.; Zhang, Z.; Zhang, L. Association of TNF-α-308G/A, -238G/A, -863C/A, -1031T/C, -857C/T polymorphisms with periodontitis susceptibility: Evidence from a meta-analysis of 52 studies. Medicine 2020, 99, e21851. [Google Scholar] [CrossRef] [PubMed] [PubMed Central]
- Majetschak, M.; Obertacke, U.; Schade, F.U.; Bardenheuer, M.; Voggenreiter, G.; Bloemeke, B.; Heesen, M. Tumor necrosis factor gene polymorphisms, leukocyte function, and sepsis susceptibility in blunt trauma patients. Clin. Diagn. Lab. Immunol. 2002, 9, 1205–1211. [Google Scholar] [CrossRef] [PubMed] [PubMed Central][Green Version]
- Rosales, C. Neutrophil: A Cell with Many. Roles in Inflammation or Several Cell Types? Front. Physiol. 2018, 9, 113. [Google Scholar] [CrossRef] [PubMed] [PubMed Central]
- Terkeltaub, R.; Banka, C.L.; Solan, J.; Santoro, D.; Brand, K.; Curtiss, L.K. Oxidized LDL induces monocytic cell expression of interleukin-8, a chemokine with T-lymphocyte chemotactic activity. Arterioscler. Thromb. 1994, 14, 47–53. [Google Scholar] [CrossRef] [PubMed]
- Kanamori, Y.; Murakami, M.; Sugiyama, M.; Hashimoto, O.; Matsui, T.; Funaba, M. Interleukin-1β (IL-1β) transcriptionally activates hepcidin by inducing CCAAT enhancer-binding protein δ (C/EBPδ) expression in hepatocytes. J. Biol. Chem. 2017, 292, 10275–10287. [Google Scholar] [CrossRef] [PubMed] [PubMed Central]
- Bandach, I.; Segev, Y.; Landau, D. Experimental modulation of Interleukin 1 shows its key role in chronic kidney disease progression and anemia. Sci. Rep. 2021, 11, 6288. [Google Scholar] [CrossRef]
- Poznyak, A.V.; Nikiforov, N.G.; Markin, A.M.; Kashirskikh, D.A.; Myasoedova, V.A.; Gerasimova, E.V.; Orekhov, A.N. Overview of OxLDL and Its Impact on Cardiovascular Health: Focus on Atherosclerosis. Front. Pharmacol. 2021, 11, 613780. [Google Scholar] [CrossRef] [PubMed] [PubMed Central]
- Thomas, C.; Leleu, D.; Masson, D. Cholesterol and HIF-1α: Dangerous Liaisons in Atherosclerosis. Front. Immunol. 2022, 13, 868958. [Google Scholar] [CrossRef] [PubMed] [PubMed Central]
- Sethi, J.K.; Hotamisligil, G.S. Metabolic Messengers: Tumour necrosis factor. Nat. Metab. 2021, 3, 1302–1312. [Google Scholar] [CrossRef]
- Jack, B.U.; Dias, S.; Pheiffer, C. Comparative Effects of Tumor Necrosis Factor Alpha, Lipopolysaccharide, and Palmitate on Mitochondrial Dysfunction in Cultured 3T3-L1 Adipocytes. Cell Biochem. Biophys. 2025, 83, 905–918. [Google Scholar] [CrossRef] [PubMed] [PubMed Central]
- Zegeye, M.M.; Nakka, S.S.; Andersson, J.S.; Söderberg, S.; Ljungberg, L.U.; Kumawat, A.K.; Sirsjö, A. Soluble LDL-receptor is induced by TNF-Œ± and inhibits hepatocytic clearance of LDL-cholesterol. J. Mol. Med. 2023, 101, 1615–1626. [Google Scholar] [CrossRef] [PubMed] [PubMed Central]
- Yamashita, M.; Passegué, E. TNF-α Coordinates Hematopoietic Stem Cell Survival and Myeloid Regeneration. Cell Stem Cell 2019, 25, 357–372.e7. [Google Scholar] [CrossRef] [PubMed] [PubMed Central]
- Freitas, R.D.S.; de Souza Silva, C.M.; Ferreira Fratelli, C.; Ramos de Lima, L.; Morato Stival, M.; Schwerz Funghetto, S.; Rodrigues da Silva, I.C.; Vieira de Andrade, R. IL-10 and IL-1β Serum Levels, Genetic Variants, and Metabolic Syndrome: Insights into Older Adults’ Clinical Characteristics. Nutrients 2024, 16, 1241. [Google Scholar] [CrossRef]
- Nani, A.; Tehami, W. Targeting inflammasome pathway by polyphenols as a strategy for pancreatitis, gastrointestinal and liver diseases management: An updated review. Front. Nutr. 2023, 10, 1157572. [Google Scholar] [CrossRef]
- Su, L.; Xu, C.; Huang, H.; Zhang, P.; Wang, J.; Ouyang, X.; Yang, X.; Ye, J. Effects of tumor necrosis factor-alpha inhibitors on lipid profiles in patients with psoriasis: A systematic review and meta-analysis. Front. Immunol. 2024, 15, 1354593. [Google Scholar] [CrossRef]
- Dang, P.; Wang, F.; Yu, H. Prognostic potential of neutrophil-to-lymphocyte ratio, platelet to lymphocyte ratio, and monocyte to lymphocyte ratio in acute myocardial infarction patients combined with chronic obstructive pulmonary disease. Front. Cardiovasc. Med. 2024, 11, 1401634. [Google Scholar] [CrossRef]
Disclaimer/Publisher’s Note: The statements, opinions and data contained in all publications are solely those of the individual author(s) and contributor(s) and not of MDPI and/or the editor(s). MDPI and/or the editor(s) disclaim responsibility for any injury to people or property resulting from any ideas, methods, instructions or products referred to in the content. |
© 2025 by the authors. Licensee MDPI, Basel, Switzerland. This article is an open access article distributed under the terms and conditions of the Creative Commons Attribution (CC BY) license (https://creativecommons.org/licenses/by/4.0/).