
AI-Based Classification of Mild Cognitive Impairment and Cognitively Normal Patients

 ,
,  , , ,
, , ,
Abstract
1. Introduction
2. Materials and Methods
2.1. Participants and Data Source
2.2. Feature Selection and Preprocessing
2.3. Model Development
3. Results
3.1. Cross-Validation Performance
3.2. Evaluation on Hold Out Test Set
3.3. Comparison with Additional Classifiers
4. Discussion
4.1. Comparison with Existing Approaches
4.2. Clinical Implications
4.3. Limitations and Future Work
5. Conclusions
Author Contributions
Funding
Institutional Review Board Statement
Informed Consent Statement
Data Availability Statement
Acknowledgments
Conflicts of Interest
Abbreviations
| AD | Alzheimer’s Disease |
| ADNI | Alzheimer’s Disease Neuroimaging Initiative |
| AI | Artificial Intelligence |
| AUC | Area Under the Curve |
| CN | Cognitively Normal |
| CSF | Cerebrospinal Fluid |
| DL | Deep Learning |
| HER | Electronic Health Record |
| EMCI | Early Mild Cognitive Impairment |
| FTP | Flortaucipir |
| GB | Gradient Boosting |
| IA-Elc | Immunoassay-Electrochemiluminescence |
| IP-MS-WashU | Immunoprecipitation–Mass Spectrometry at Washington University |
| LMCI | Late Mild Cognitive Impairment |
| LLM | Large Language Model |
| MCI | Mild Cognitive Impairment |
| ML | Machine Learning |
| MRI | Magnetic Resonance Imaging |
| PET | Positron Emission Tomography |
| ROI | Region of Interest |
| SPM | Statistical Parametric Mapping |
| SVM | Support Vector Machine |
| SUVR | Standardized Uptake Value Ratio |
References
- Anderson, N.D. State of the science on mild cognitive impairment (MCI). CNS Spectr. 2019, 24, 78–87. [Google Scholar] [CrossRef] [PubMed]
- World Health Organization (WHO). Dementia. 2025. Available online: https://www.who.int/news-room/fact-sheets/detail/dementia (accessed on 30 April 2025).
- Bai, W.; Chen, P.; Cai, H.; Zhang, Q.; Su, Z.; Cheung, T.; Jackson, T.; Sha, S.; Xiang, Y.-T. Worldwide prevalence of mild cognitive impairment among community dwellers aged 50 years and older: A meta-analysis and systematic review of epidemiology studies. Age Ageing 2022, 51, afac173. [Google Scholar] [CrossRef] [PubMed]
- Petersen, R.C.; Smith, G.E.; Waring, S.C.; Ivnik, R.J.; Tangalos, E.G.; Kokmen, E. Mild cognitive impairment: Clinical characterization and outcome. Arch. Neurol. 1999, 56, 303–308. [Google Scholar] [CrossRef] [PubMed]
- Hugo, J.; Ganguli, M. Dementia and cognitive impairment: Epidemiology, diagnosis, and treatment. Clin. Geriatr. Med. 2014, 30, 421–442. [Google Scholar] [CrossRef] [PubMed]
- Lehmann, M.; Koedam, E.L.; Barnes, J.; Bartlett, J.W.; Barkhof, F.; Wattjes, M.P.; Schott, J.M.; Scheltens, P.; Fox, N.C. Visual ratings of atrophy in MCI: Prediction of conversion and relationship with CSF biomarkers. Neurobiol. Aging 2013, 34, 73–82. [Google Scholar] [CrossRef] [PubMed]
- Wang, X.; Huang, W.; Su, L.; Xing, Y.; Jessen, F.; Sun, Y.; Shu, N.; Han, Y. Neuroimaging advances regarding subjective cognitive decline in preclinical Alzheimer’s disease. Mol. Neurodegener. 2020, 15, 55. [Google Scholar] [CrossRef] [PubMed]
- Borchert, R.J.; Azevedo, T.; Badhwar, A.; Bernal, J.; Betts, M.; Bruffaerts, R.; Burkhart, M.C.; Dewachter, I.; Gellersen, H.M.; Low, A.; et al. Artificial intelligence for diagnostic and prognostic neuroimaging in dementia: A systematic review. Alzheimer’s Dement. J. Alzheimer’s Assoc. 2023, 19, 5885–5904. [Google Scholar] [CrossRef] [PubMed]
- Jiang, T.; Gradus, J.L.; Rosellini, A.J. Supervised Machine Learning: A Brief Primer. Behav. Ther. 2020, 51, 675–687. [Google Scholar] [CrossRef] [PubMed]
- Lama, R.K.; Kwon, G.R. Diagnosis of Alzheimer’s Disease Using Brain Network. Front. Neurosci. 2021, 15, 605115. [Google Scholar] [CrossRef] [PubMed]
- Battineni, G.; Hossain, M.A.; Chintalapudi, N.; Traini, E.; Dhulipalla, V.R.; Ramasamy, M.; Amenta, F. Improved Alzheimer’s Disease Detection by MRI Using Multimodal Machine Learning Algorithms. Diagnostics 2021, 11, 2103. [Google Scholar] [CrossRef] [PubMed]
- Bao, Y.W.; Wang, Z.J.; Shea, Y.F.; Chiu, P.K.-C.; Kwan, J.S.; Chan, F.H.-W.; Mak, H.K.-F. Combined Quantitative amyloid-β PET and Structural MRI Features Improve Alzheimer’s Disease Classification in Random Forest Model—A Multicenter Study. Acad. Radiol. 2024, 31, 5154–5163. [Google Scholar] [CrossRef] [PubMed]
- El-Latif, A.A.A.; Chelloug, S.A.; Alabdulhafith, M.; Hammad, M. Accurate Detection of Alzheimer’s Disease Using Lightweight Deep Learning Model on MRI Data. Diagnostics 2023, 13, 1216. [Google Scholar] [CrossRef] [PubMed]
- Faisal, F.U.R.; Kwon, G.R. Automated Detection of Alzheimer’s Disease and Mild Cognitive Impairment Using Whole Brain MRI. IEEE Access 2022, 10, 65055–65066. [Google Scholar] [CrossRef]
- Basher, A.; Kim, B.C.; Lee, K.H.; Jung, H.Y. Volumetric Feature-Based Alzheimer’s Disease Diagnosis from sMRI Data Using a Convolutional Neural Network and a Deep Neural Network. IEEE Access 2021, 9, 29870–29882. [Google Scholar] [CrossRef]
- Chen, X.; Wang, X.; Zhang, K.; Fung, K.-M.; Thai, T.C.; Moore, K.; Mannel, R.S.; Liu, H.; Zheng, B.; Qiu, Y. Recent advances and clinical applications of deep learning in medical image analysis. Med. Image Anal. 2022, 79, 102444. [Google Scholar] [CrossRef] [PubMed]
- Guan, T.; Shang, L.; Yang, P.; Tan, Z.; Liu, Y.; Dong, C.; Li, X.; Hu, Z.; Su, H.; Zhang, Y. Joint ensemble learning-based risk prediction of Alzheimer’s disease among mild cognitive impairment patients. J. Prev. Alzheimer’s Dis. 2025, 12, 100083. [Google Scholar] [CrossRef] [PubMed]
- Mujahid, M.; Rehman, A.; Alam, T.; Alamri, F.S.; Fati, S.M.; Saba, T. An Efficient Ensemble Approach for Alzheimer’s Disease Detection Using an Adaptive Synthetic Technique and Deep Learning. Diagnostics 2023, 13, 2489. [Google Scholar] [CrossRef] [PubMed]
- Zhang, P.; Lin, S.; Qiao, J.; Tu, Y. Diagnosis of Alzheimer’s Disease with Ensemble Learning Classifier and 3D Convolutional Neural Network. Sensors 2021, 21, 7634. [Google Scholar] [CrossRef] [PubMed]
- Khan, Y.F.; Kaushik, B.; Chowdhary, C.L.; Srivastava, G. Ensemble Model for Diagnostic Classification of Alzheimer’s Disease Based on Brain Anatomical Magnetic Resonance Imaging. Diagnostics 2022, 12, 3193. [Google Scholar] [CrossRef] [PubMed]
- Corder, E.H.; Saunders, A.M.; Strittmatter, W.J.; Schmechel, D.E.; Gaskell, P.C.; Small, G.W.; Roses, A.D.; Haines, J.L.; Pericak-Vance, M.A. Gene dose of apolipoprotein E type 4 allele and the risk of Alzheimer’s disease in late onset families. Science 1993, 261, 921–923. [Google Scholar] [CrossRef] [PubMed]
- Caselli, R.J.; Beach, T.G.; Knopman, D.S.; Graff-Radford, N.R. Alzheimer Disease: Scientific Breakthroughs and Translational Challenges. Mayo Clin. Proc. 2017, 92, 978–994. [Google Scholar] [CrossRef] [PubMed]
- Azad, N.A.; Al Bugami, M.; Loy-English, I. Gender differences in dementia risk factors. Gend. Med. 2007, 4, 120–129. [Google Scholar] [CrossRef] [PubMed]
- Terry, R.D.; Katzman, R. Senile dementia of the Alzheimer type. Ann. Neurol. 1983, 14, 497–506. [Google Scholar] [CrossRef] [PubMed]
- Kokkinou, M.; Beishon, L.C.; Smailagic, N.; Noel-Storr, A.H.; Hyde, C.; Ukoumunne, O.; Worrall, R.E.; Hayen, A.; Desai, M.; Ashok, A.H.; et al. Plasma and cerebrospinal fluid ABeta42 for the differential diagnosis of Alzheimer’s disease dementia in participants diagnosed with any dementia subtype in a specialist care setting. Cochrane Database Syst. Rev. 2021, 2, CD010945. [Google Scholar] [CrossRef] [PubMed]
- Tapiola, T.; Alafuzoff, I.; Herukka, S.K.; Parkkinen, L.; Hartikainen, P.; Soininen, H.; Pirttilä, T. Cerebrospinal fluid {beta}-amyloid 42 and tau proteins as biomarkers of Alzheimer-type pathologic changes in the brain. Arch. Neurol. 2009, 66, 382–389. [Google Scholar] [CrossRef] [PubMed]
- Ruiz, A.; Pesini, P.; Espinosa, A.; Pérez-Grijalba, V.; Valero, S.; Sotolongo-Grau, O.; Alegret, M.; Monleón, I.; Lafuente, A.; Buendía, M.; et al. Blood amyloid beta levels in healthy, mild cognitive impairment and Alzheimer’s disease individuals: Replication of diastolic blood pressure correlations and analysis of critical covariates. PLoS ONE 2013, 8, e81334. [Google Scholar] [CrossRef] [PubMed]
- Jimenez-Mesa, C.; Illan, I.A.; Martin-Martin, A.; Castillo-Barnes, D.; Martinez-Murcia, F.J.; Ramirez, J.; Gorriz, J.M. Optimized one vs one approach in multiclass classification for early alzheimer’s disease and mild cognitive impairment diagnosis. IEEE Access 2020, 8, 96981–96993. [Google Scholar] [CrossRef]
- Gamal, A.; Elattar, M.; Selim, S. Automatic Early Diagnosis of Alzheimer’s Disease Using 3D Deep Ensemble Approach. IEEE Access 2022, 10, 115974–115987. [Google Scholar] [CrossRef]
- Battineni, G.; Chintalapudi, N.; Amenta, F. Machine learning driven by magnetic resonance imaging for the classification of Alzheimer disease progression: Systematic review and meta-analysis. JMIR Aging 2024, 7, e59370. [Google Scholar] [CrossRef] [PubMed]
- Zia-Ur-Rehman, Z.; Awang, M.K.; Ali, G.; Faheem, M. Recent advancements in neuroimaging-based Alzheimer’s disease prediction using deep learning approaches in e-health: A systematic review. Health Sci. Rep. 2025, 8, e70802. [Google Scholar] [CrossRef] [PubMed]
- Weiner, M.W.; Veitch, D.P.; Aisen, P.S.; Beckett, L.A.; Cairns, N.J.; Cedarbaum, J.; Donohue, M.C.; Green, R.C.; Harvey, D.; Jack, C.R.; et al. Impact of the Alzheimer’s Disease Neuroimaging Initiative, 2004 to 2014. Alzheimer’s Dement. J. Alzheimer’s Assoc. 2015, 11, 865–884. [Google Scholar] [CrossRef] [PubMed]
- Gupta, Y.; Kim, J.I.; Kim, B.C.; Kwon, G.R. Classification and Graphical Analysis of Alzheimer’s Disease and Its Prodromal Stage Using Multimodal Features From Structural, Diffusion, and Functional Neuroimaging Data and the APOE Genotype. Front. Aging Neurosci. 2020, 12, 238. [Google Scholar] [CrossRef] [PubMed]
- Wu, J.; Dong, Q.; Zhang, J.; Su, Y.; Wu, T.; Caselli, R.J.; Reiman, E.M.; Ye, J.; Lepore, N.; Chen, K.; et al. Federated Morphometry Feature Selection for Hippocampal Morphometry Associated Beta-Amyloid and Tau Pathology. Front. Neurosci. 2021, 15, 762458. [Google Scholar] [CrossRef] [PubMed]

| Raw Data | Grouped—Unbalanced | Grouped—Balanced | |||
|---|---|---|---|---|---|
| Research Group | Count | Research Group | Count | Research Group | Count |
| CN | 1125 | MCI | 1313 | MCI | 986 |
| MCI | 750 | CN | 986 | CN | 986 |
| EMCI | 475 | ||||
| AD | 397 | ||||
| LMCI | 282 |
| Feature | Variance |
|---|---|
| PTGENDER | 0.2497 |
| AGE | 0.0357 |
| VSBPDIA | 0.0202 |
| ABETA42 | 0.0191 |
| PTAU | 0.0176 |
| TAU | 0.0175 |
| VSBPSYS | 0.0163 |
| VSRESP | 0.0099 |
| VSPULSE | 0.0047 |
| CTRED | 0.0067 |
| CTWHITE | 0.0035 |
| PROTEIN | 0.0030 |
| GLUCOSE | 0.0014 |
| Model | Best Accuracy | Mean Accuracy | Standard Deviation |
|---|---|---|---|
| Extra Trees | 0.7319 | 0.7215 | 0.0058 |
| Random Forest | 0.7232 | 0.7109 | 0.0063 |
| LightGBM | 0.7159 | 0.7004 | 0.0085 |
| CatBoost | 0.7145 | 0.7020 | 0.0073 |
| Histogram GB | 0.7145 | 0.6922 | 0.0087 |
| XGBoost | 0.7123 | 0.6964 | 0.0084 |
| SVM | 0.6986 | 0.6442 | 0.0436 |
| Multi-layer Perceptron | 0.6935 | 0.6704 | 0.0134 |
| Logistic Regression | 0.6688 | 0.6673 | 0.0006 |
| K-Nearest Neighbors | 0.6688 | 0.6581 | 0.0061 |
| Naive Bayes | 0.6645 | 0.6645 | 0.0000 |
| Metric | Extra Trees | LightGBM | Random Forest |
|---|---|---|---|
| True Positive | 224 | 213 | 217 |
| True Negative | 207 | 213 | 209 |
| False Positive | 72 | 83 | 79 |
| False Negative | 89 | 83 | 87 |
| Accuracy | 0.728 | 0.720 | 0.720 |
| Precision | 0.757 | 0.720 | 0.733 |
| Recall | 0.716 | 0.720 | 0.714 |
| F1 Score | 0.736 | 0.720 | 0.723 |
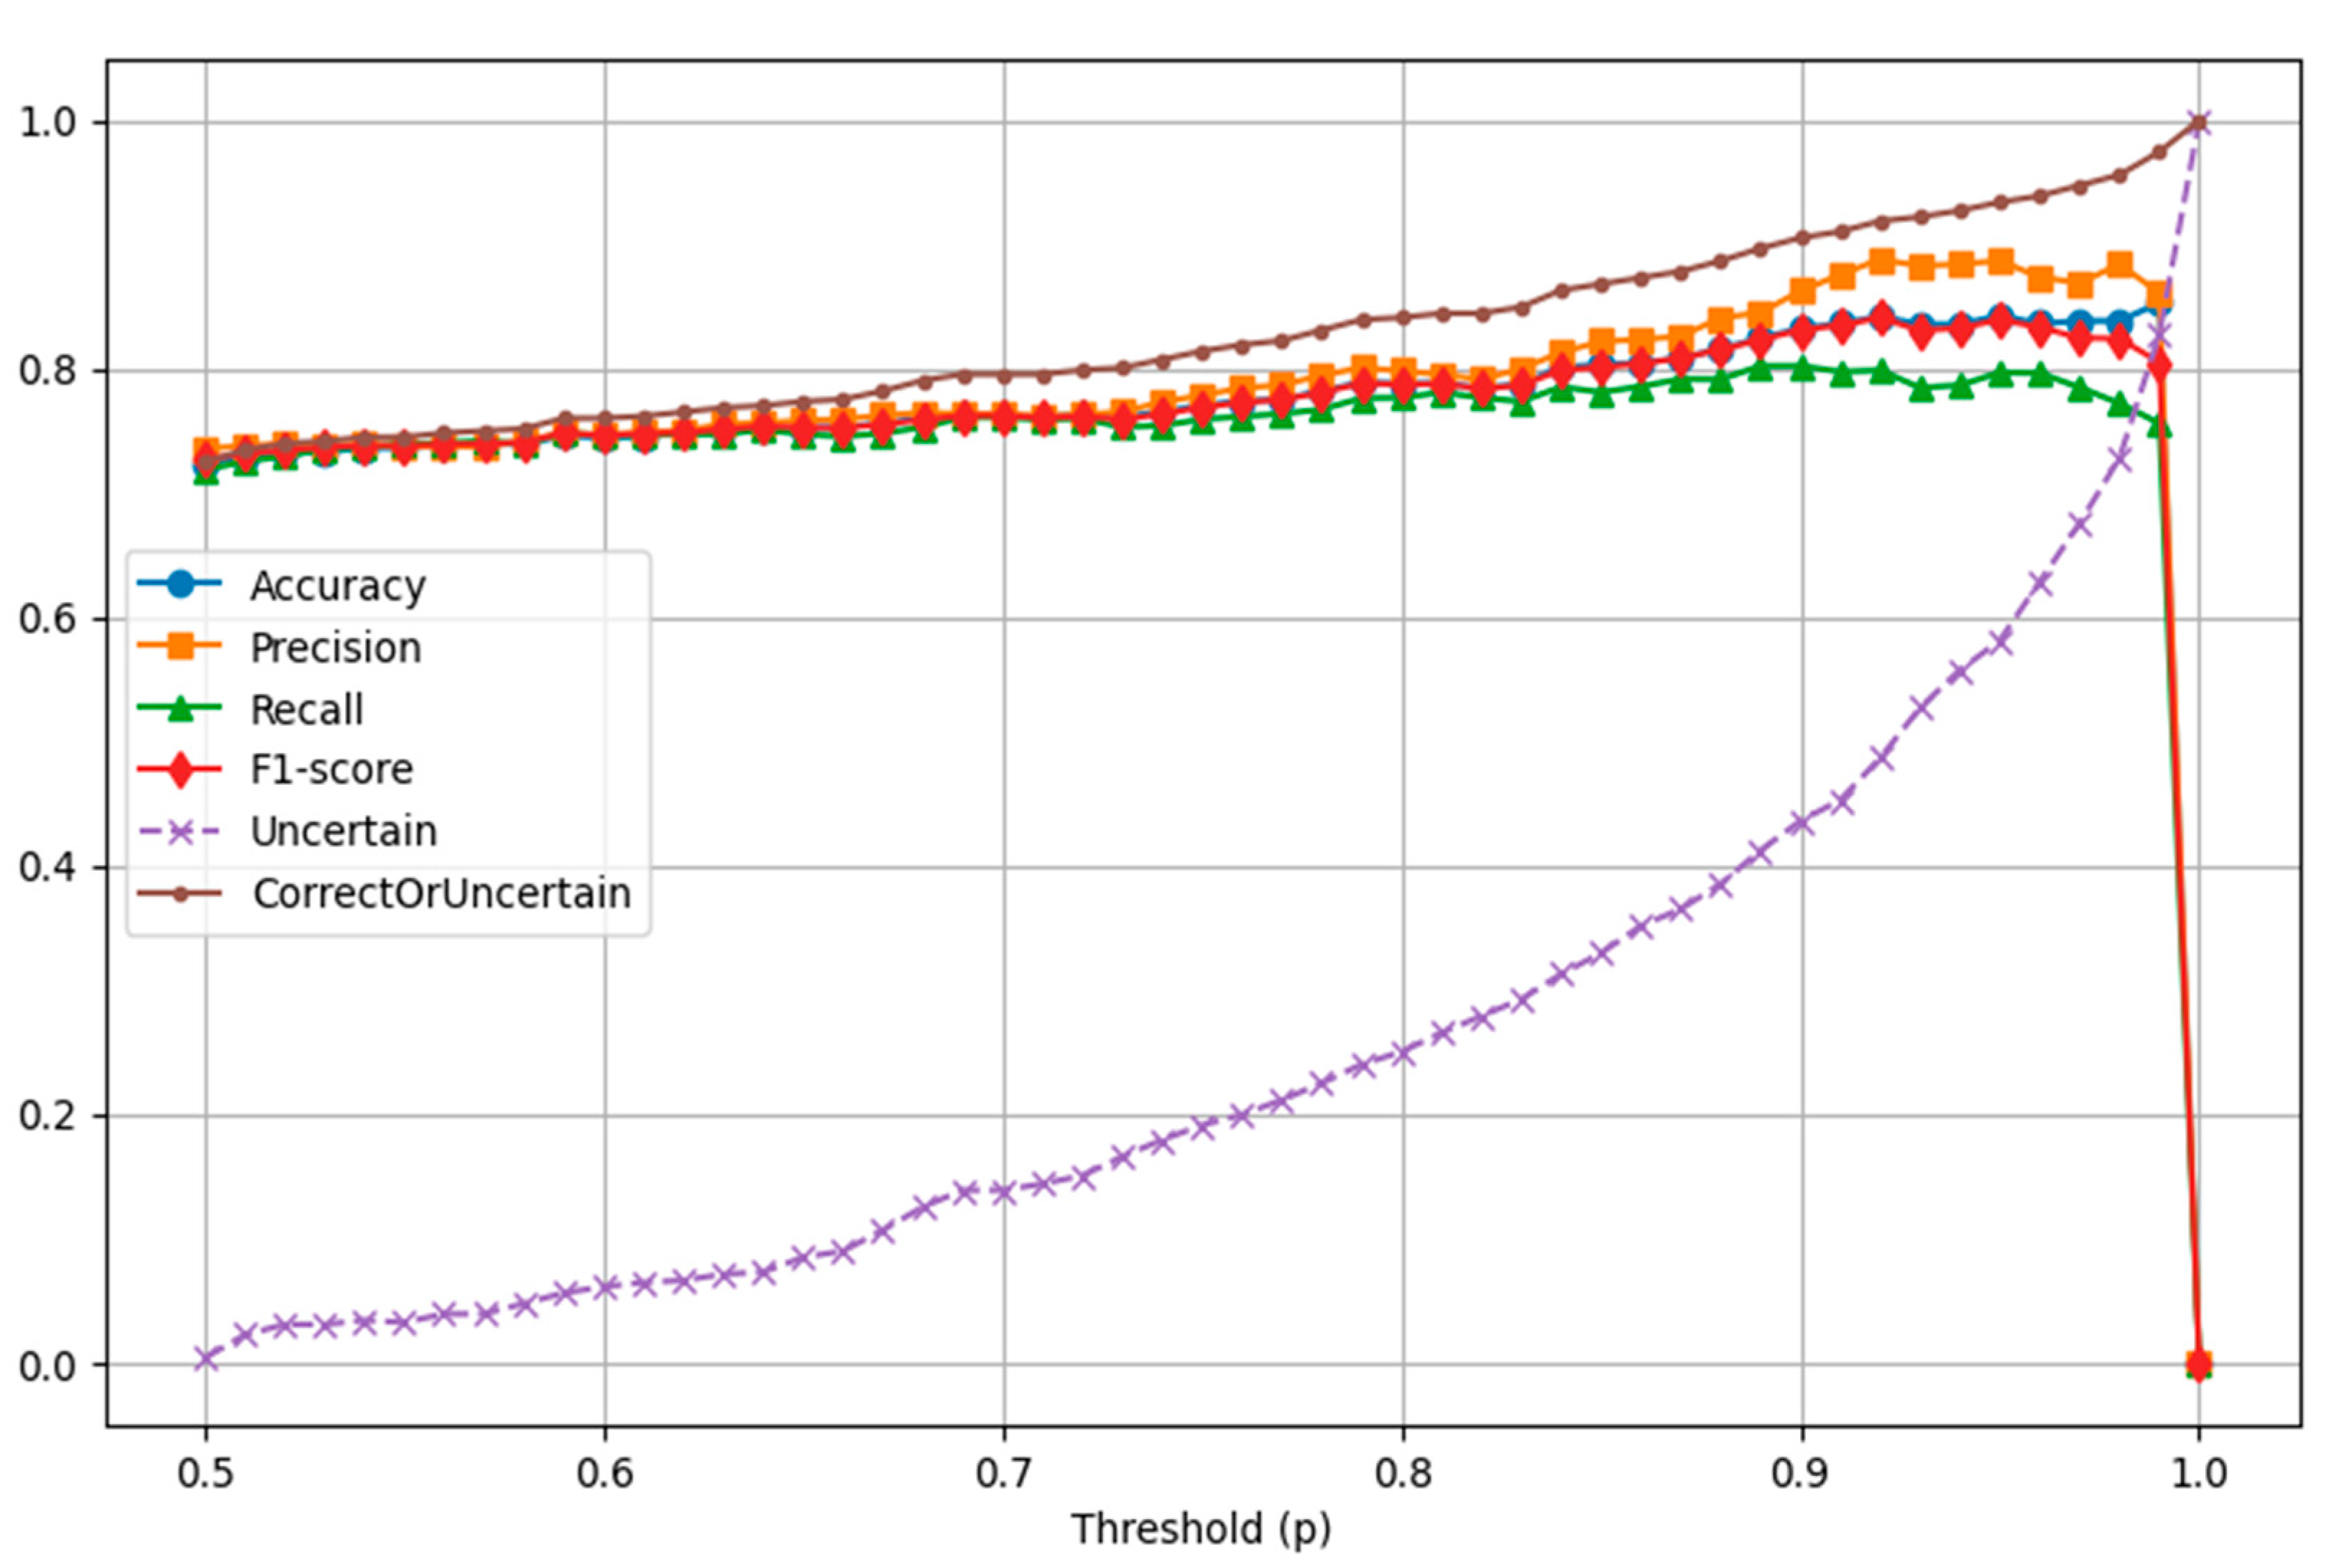
| Metric | p = 0.65 | p = 0.80 | p = 0.85 | p = 0.90 | p = 0.95 |
|---|---|---|---|---|---|
| Uncertain | 50 | 148 | 195 | 258 | 344 |
| True Positive | 204 | 174 | 157 | 138 | 102 |
| True Negative | 204 | 176 | 162 | 140 | 107 |
| False Positive | 65 | 44 | 34 | 22 | 13 |
| False Negative | 69 | 50 | 44 | 34 | 26 |
| Accuracy | 0.753 | 0.788 | 0.804 | 0.832 | 0.843 |
| Precision | 0.758 | 0.798 | 0.822 | 0.863 | 0.887 |
| Recall | 0.747 | 0.777 | 0.781 | 0.802 | 0.797 |
| F1 Score | 0.753 | 0.787 | 0.801 | 0.831 | 0.840 |
| Correct or Uncertain | 77.3% | 84.1% | 86.8% | 90.5% | 93.4% |
Disclaimer/Publisher’s Note: The statements, opinions and data contained in all publications are solely those of the individual author(s) and contributor(s) and not of MDPI and/or the editor(s). MDPI and/or the editor(s) disclaim responsibility for any injury to people or property resulting from any ideas, methods, instructions or products referred to in the content. |
© 2025 by the authors. Licensee MDPI, Basel, Switzerland. This article is an open access article distributed under the terms and conditions of the Creative Commons Attribution (CC BY) license (https://creativecommons.org/licenses/by/4.0/).
Share and Cite
Christodoulou, R.; Christofi, G.; Pitsillos, R.; Ibrahim, R.; Papageorgiou, P.; Papageorgiou, S.G.; Vassiliou, E.; Georgiou, M.F. AI-Based Classification of Mild Cognitive Impairment and Cognitively Normal Patients. J. Clin. Med. 2025, 14, 5261. https://doi.org/10.3390/jcm14155261
Christodoulou R, Christofi G, Pitsillos R, Ibrahim R, Papageorgiou P, Papageorgiou SG, Vassiliou E, Georgiou MF. AI-Based Classification of Mild Cognitive Impairment and Cognitively Normal Patients. Journal of Clinical Medicine. 2025; 14(15):5261. https://doi.org/10.3390/jcm14155261
Chicago/Turabian StyleChristodoulou, Rafail, Giorgos Christofi, Rafael Pitsillos, Reina Ibrahim, Platon Papageorgiou, Sokratis G. Papageorgiou, Evros Vassiliou, and Michalis F. Georgiou. 2025. "AI-Based Classification of Mild Cognitive Impairment and Cognitively Normal Patients" Journal of Clinical Medicine 14, no. 15: 5261. https://doi.org/10.3390/jcm14155261
APA StyleChristodoulou, R., Christofi, G., Pitsillos, R., Ibrahim, R., Papageorgiou, P., Papageorgiou, S. G., Vassiliou, E., & Georgiou, M. F. (2025). AI-Based Classification of Mild Cognitive Impairment and Cognitively Normal Patients. Journal of Clinical Medicine, 14(15), 5261. https://doi.org/10.3390/jcm14155261