
Applications of Functional Near-Infrared Spectroscopy (fNIRS) in Monitoring Treatment Response in Psychiatry: A Scoping Review

 , , , and
Abstract
1. Introduction
2. Materials and Methods
2.1. Transparency and Openness
2.2. Scoping Review Research Questions
- (a)
- What methodological protocols and study designs have been used in fNIRS studies monitoring treatment response in individuals with psychiatric disorders?
- (b)
- Which specific neurofunctional biomarkers derived from fNIRS (hemodynamic response, cortical activation, connectivity pattern) have been identified as relevant or predictive indicators of treatment efficacy in psychiatric disorders?
- (c)
- What types of treatment (pharmacological, psychotherapeutic, neuromodulatory) were monitored?
2.3. Search Strategy
2.4. Study Selection Procedure
2.5. Data Extraction
2.6. Data Analysis + Charting
2.7. Development of Concept
2.8. Quality Appraisal
3. Results
3.1. Descriptive Mapping of Studies
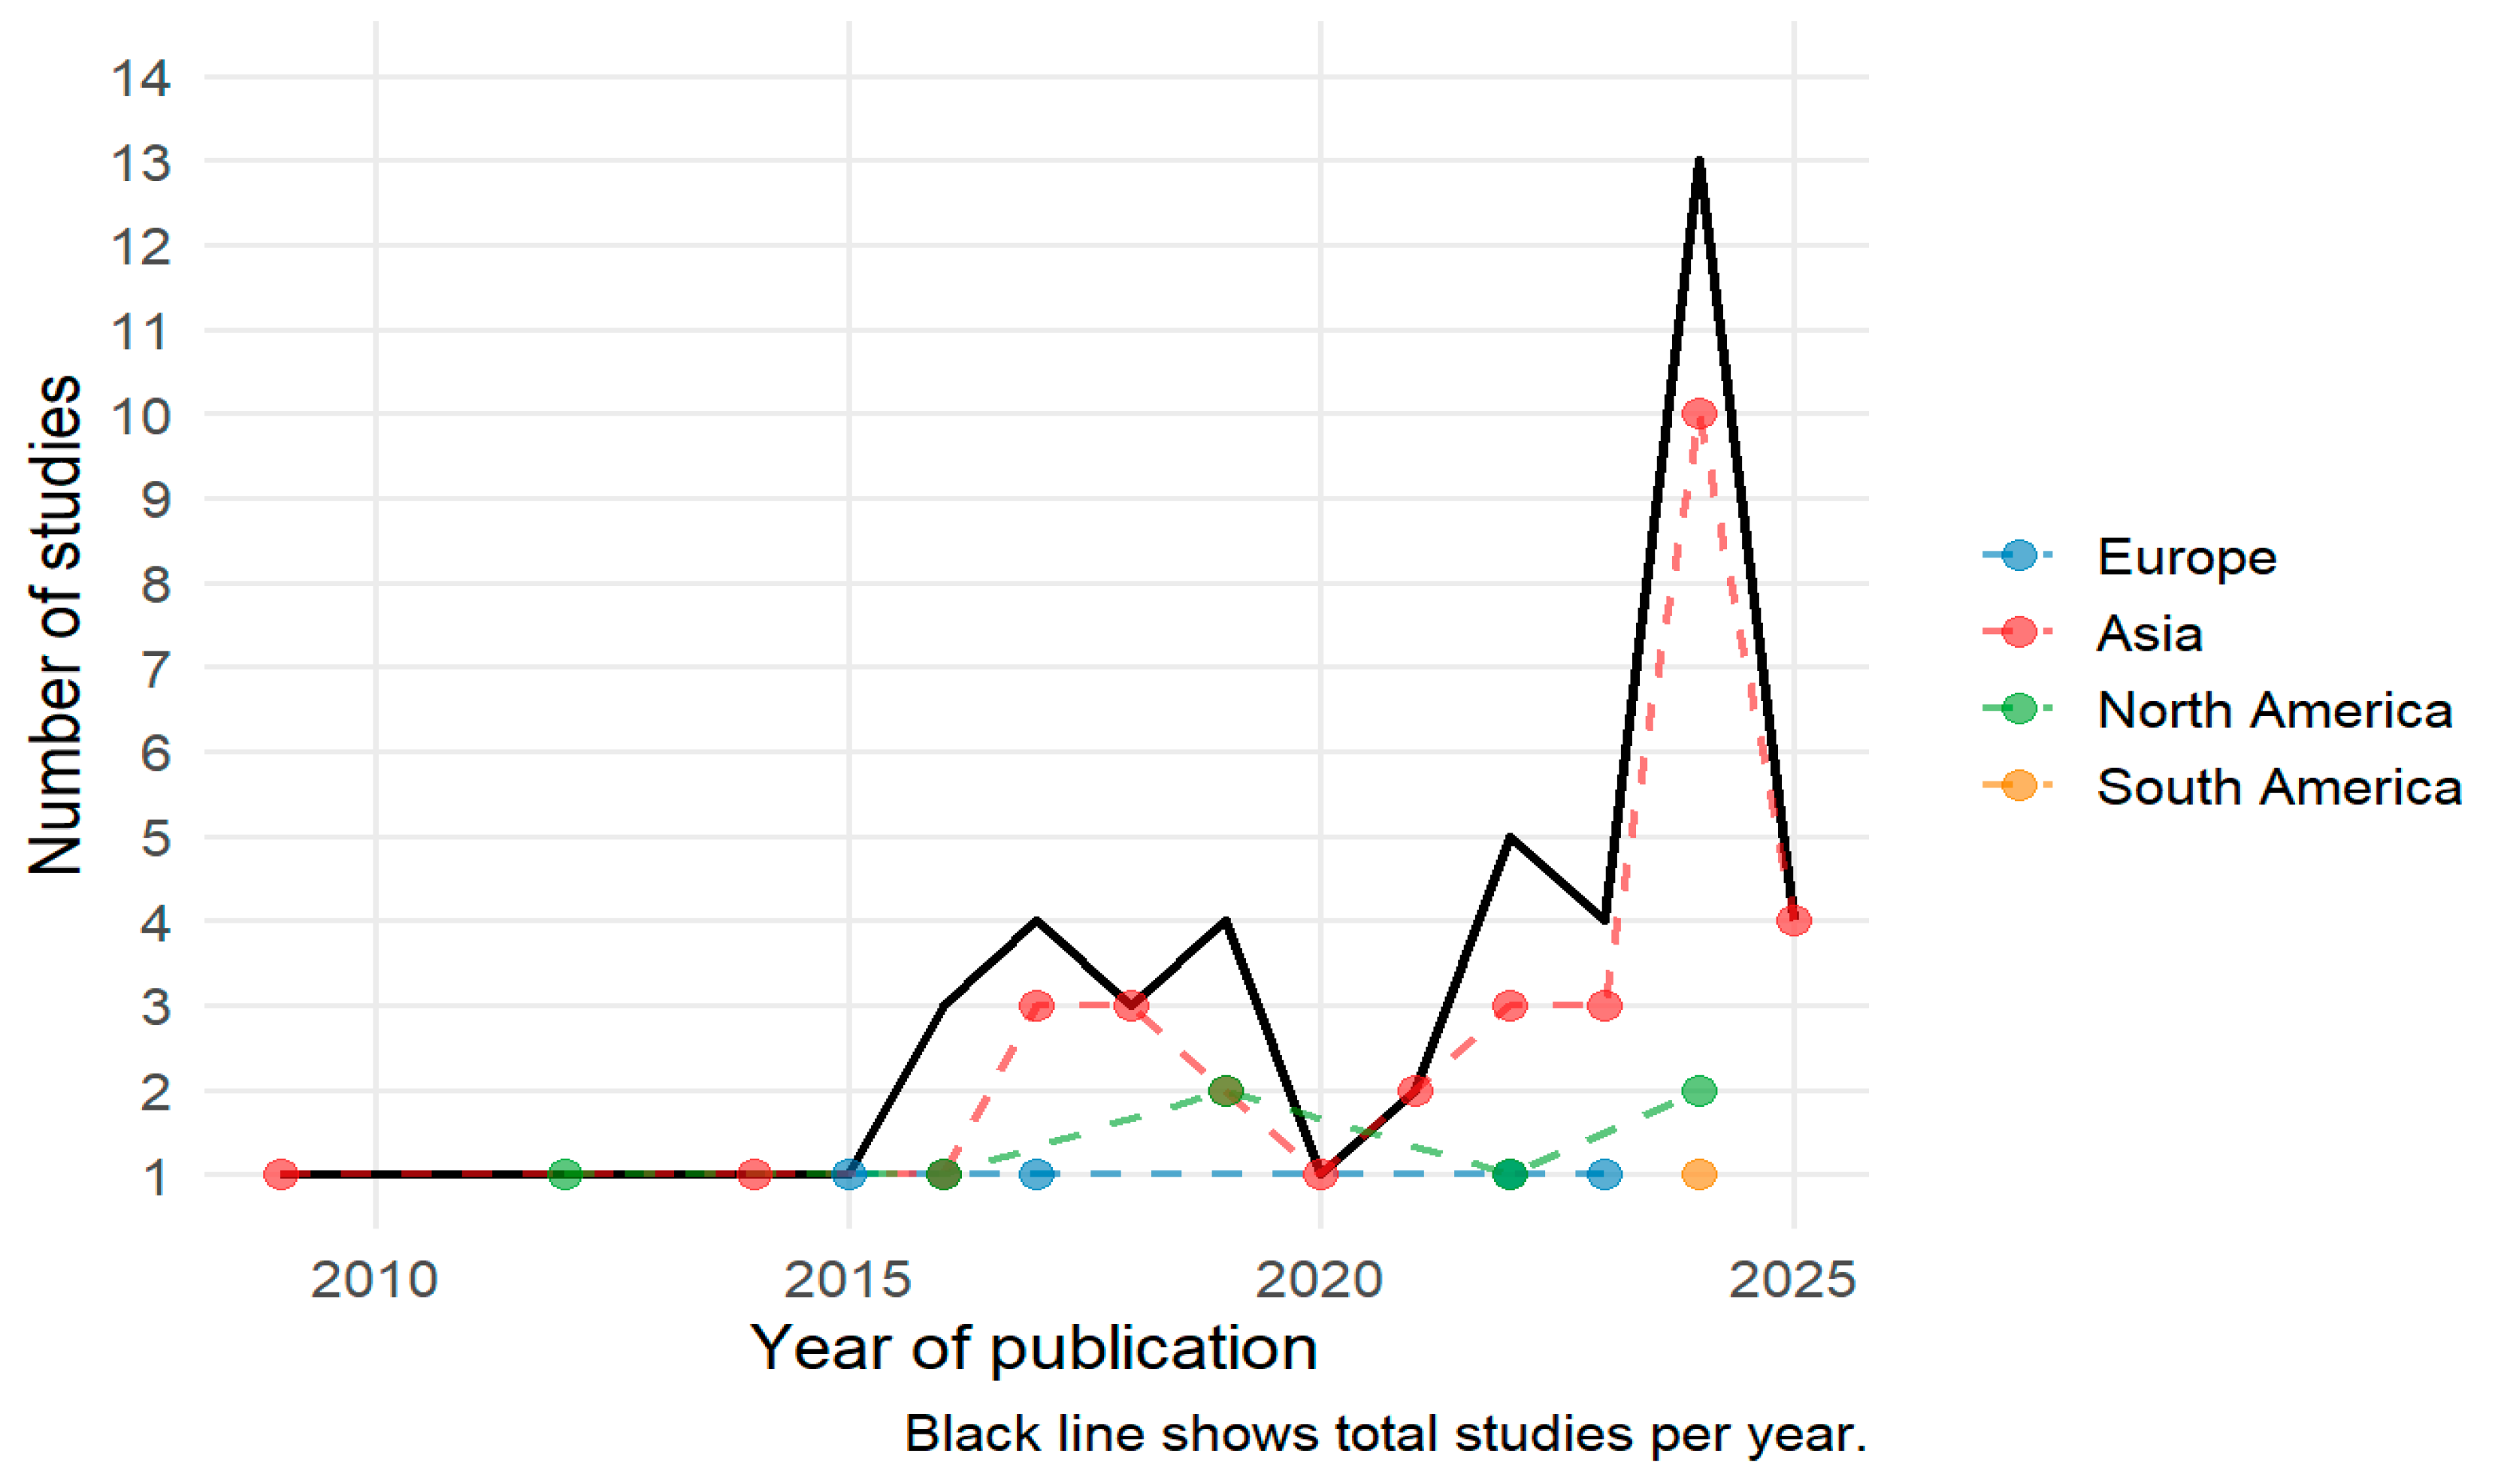
3.1.1. fNIRS Study Publication Trends by Year and Origin
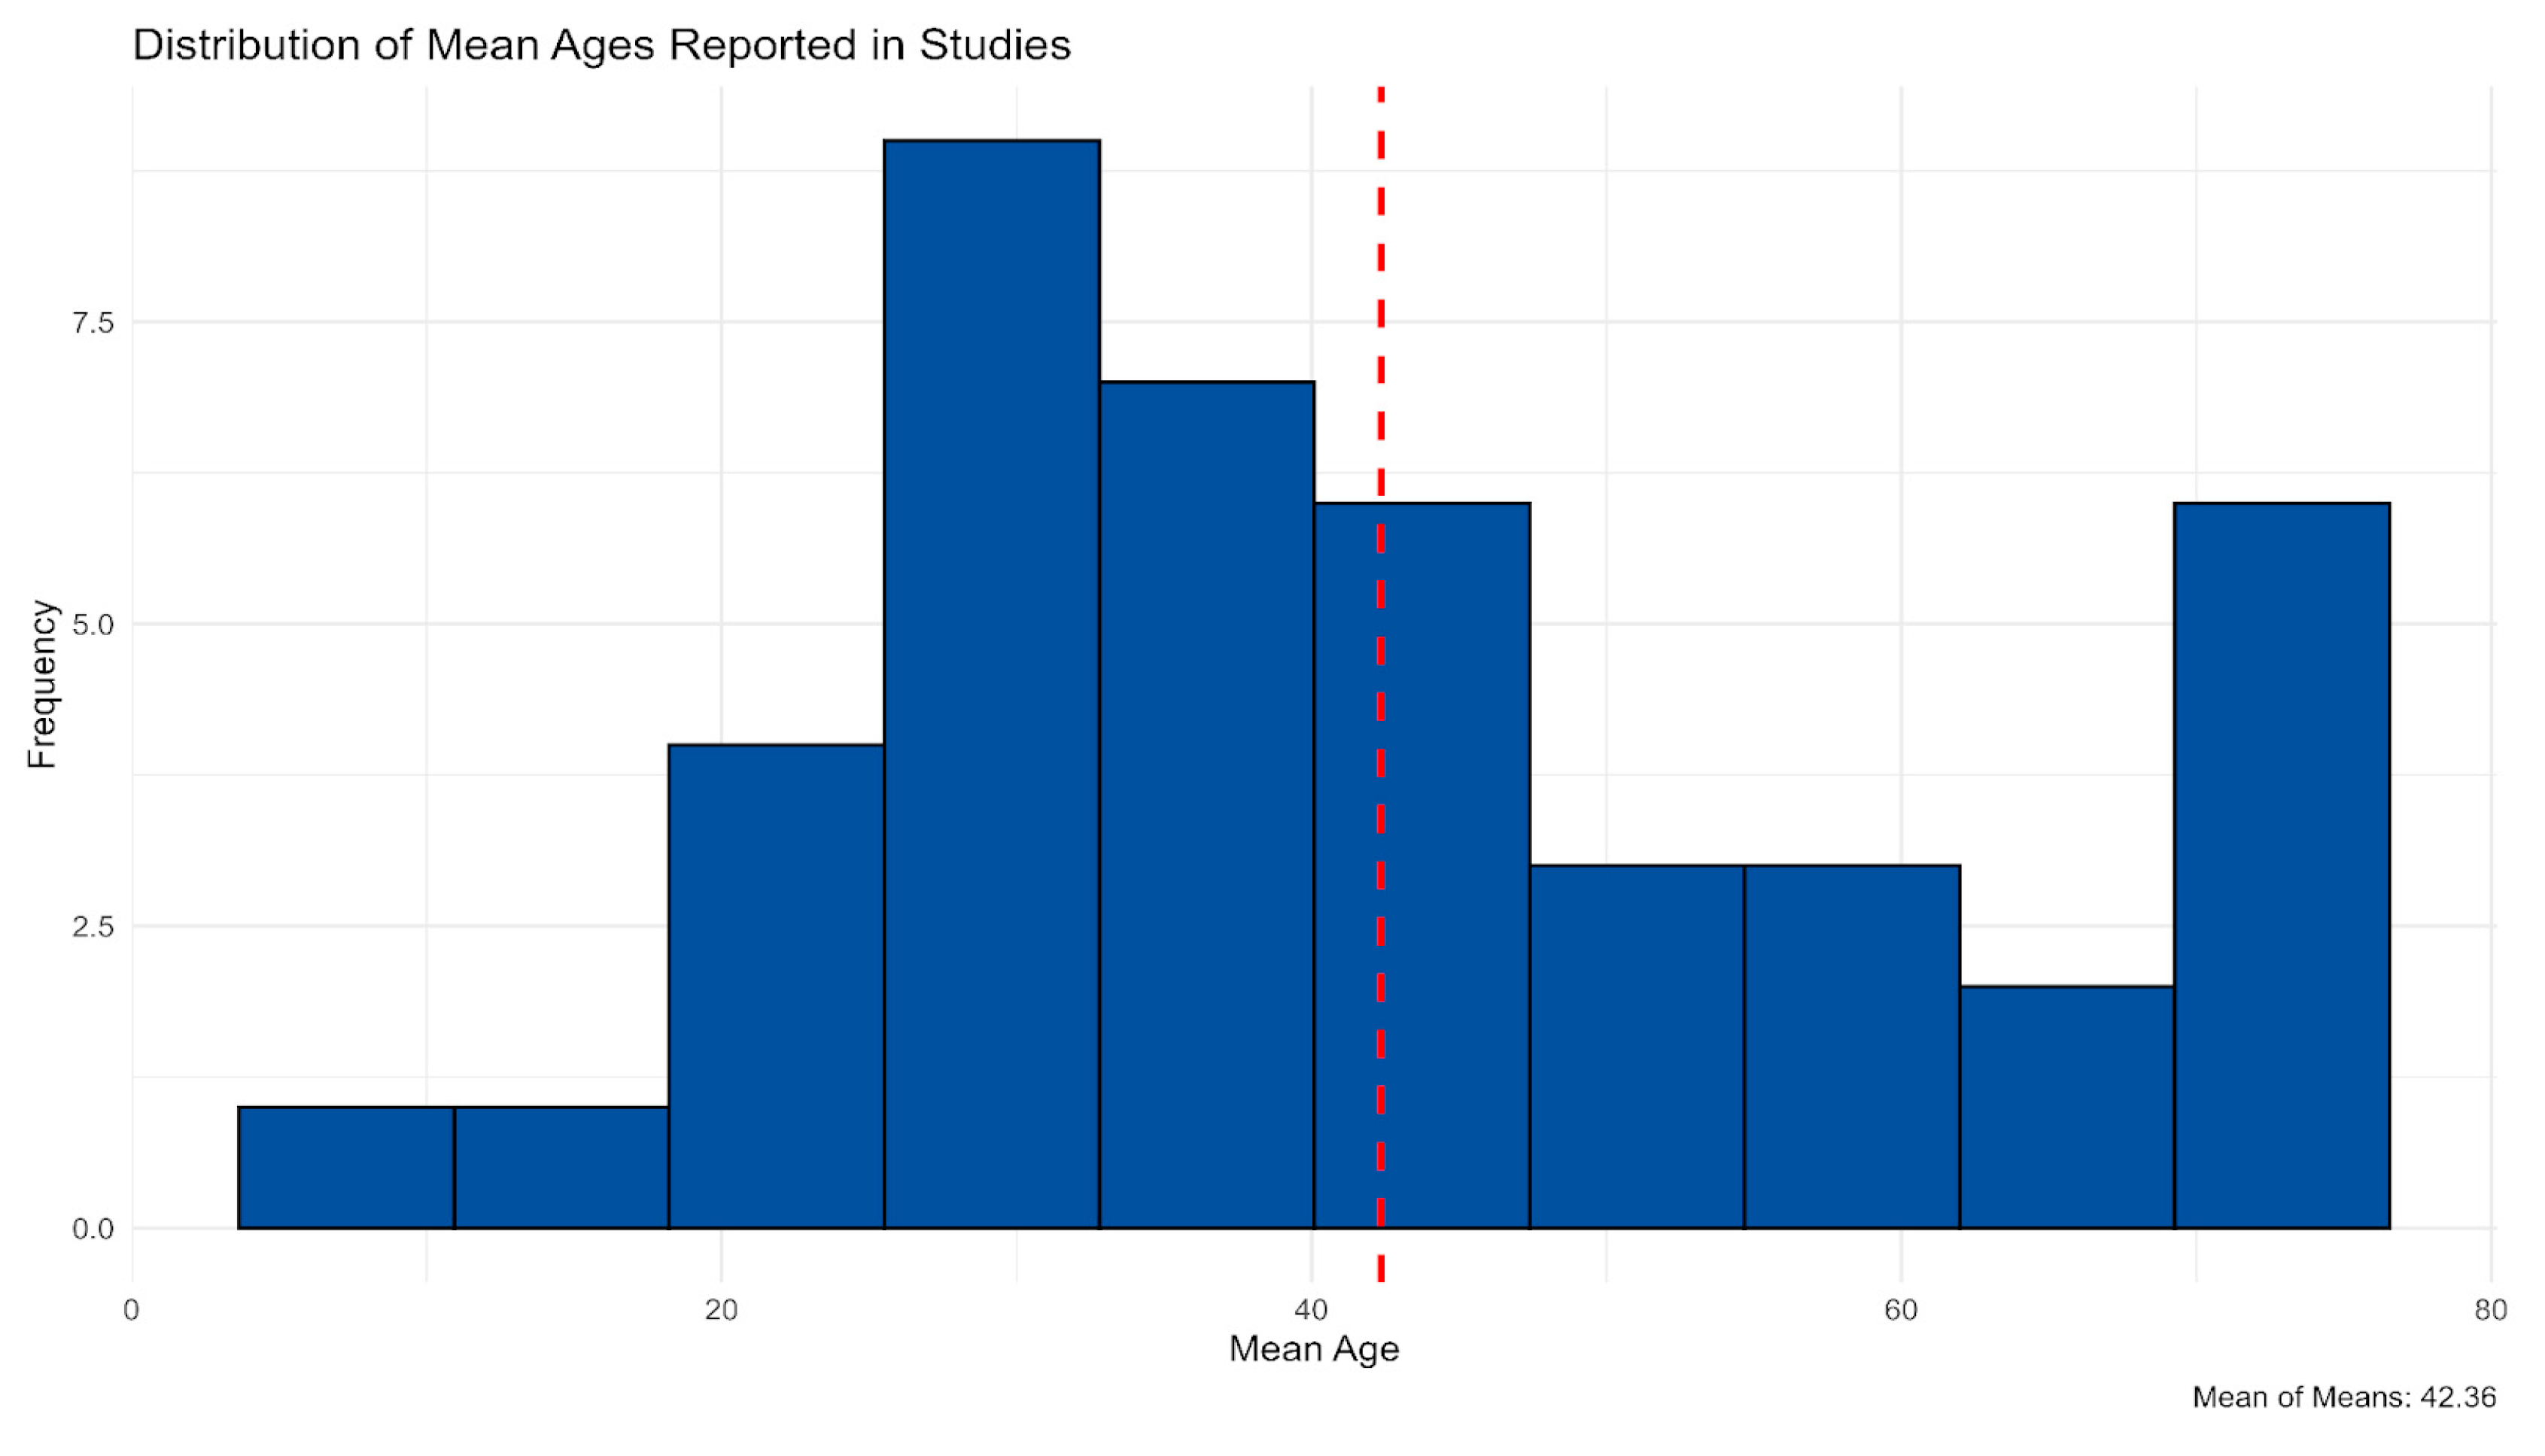
3.1.2. Research Designs and Sample Composition Across Included Studies
3.1.3. Study Characteristics: fNIRS Paradigms, Signal Acquisition, and Analytical Approaches
3.2. fNIRS Applications by Psychiatric Disorder and Intervention Type
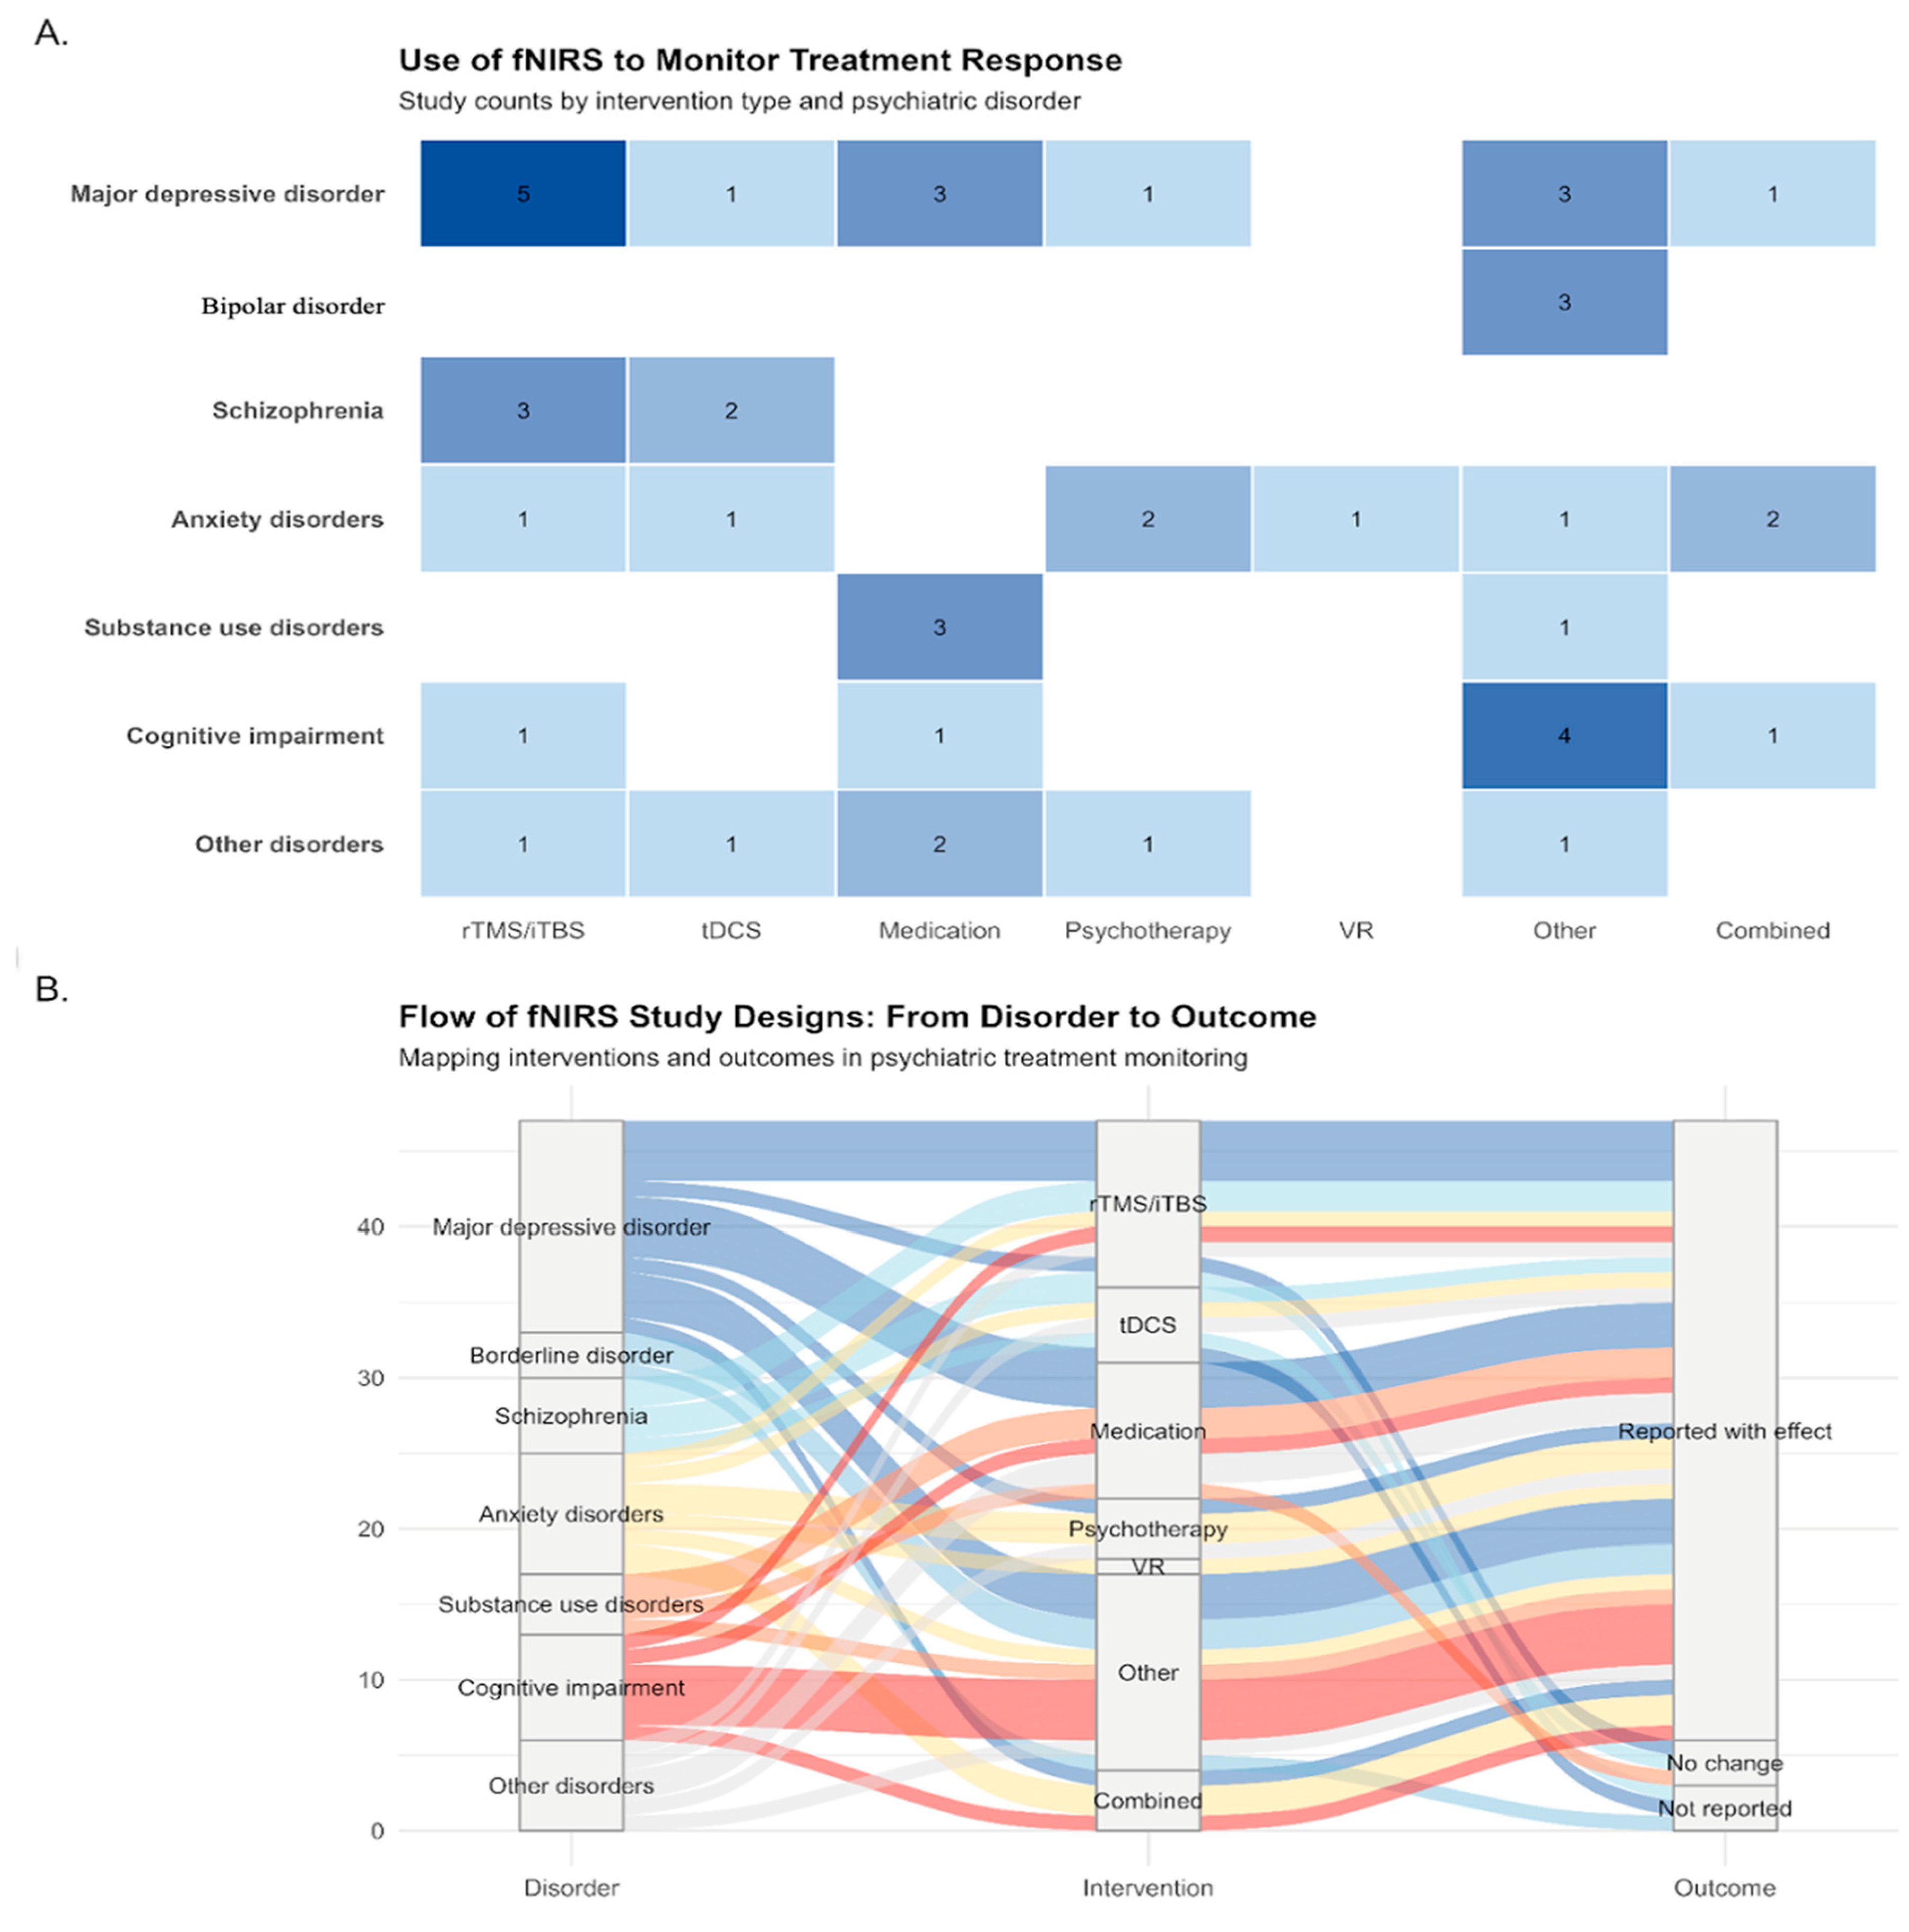
3.2.1. Distribution of Studies Across Disorders and Interventions
3.2.2. Mapping Disorder—Intervention—Outcome Relationships
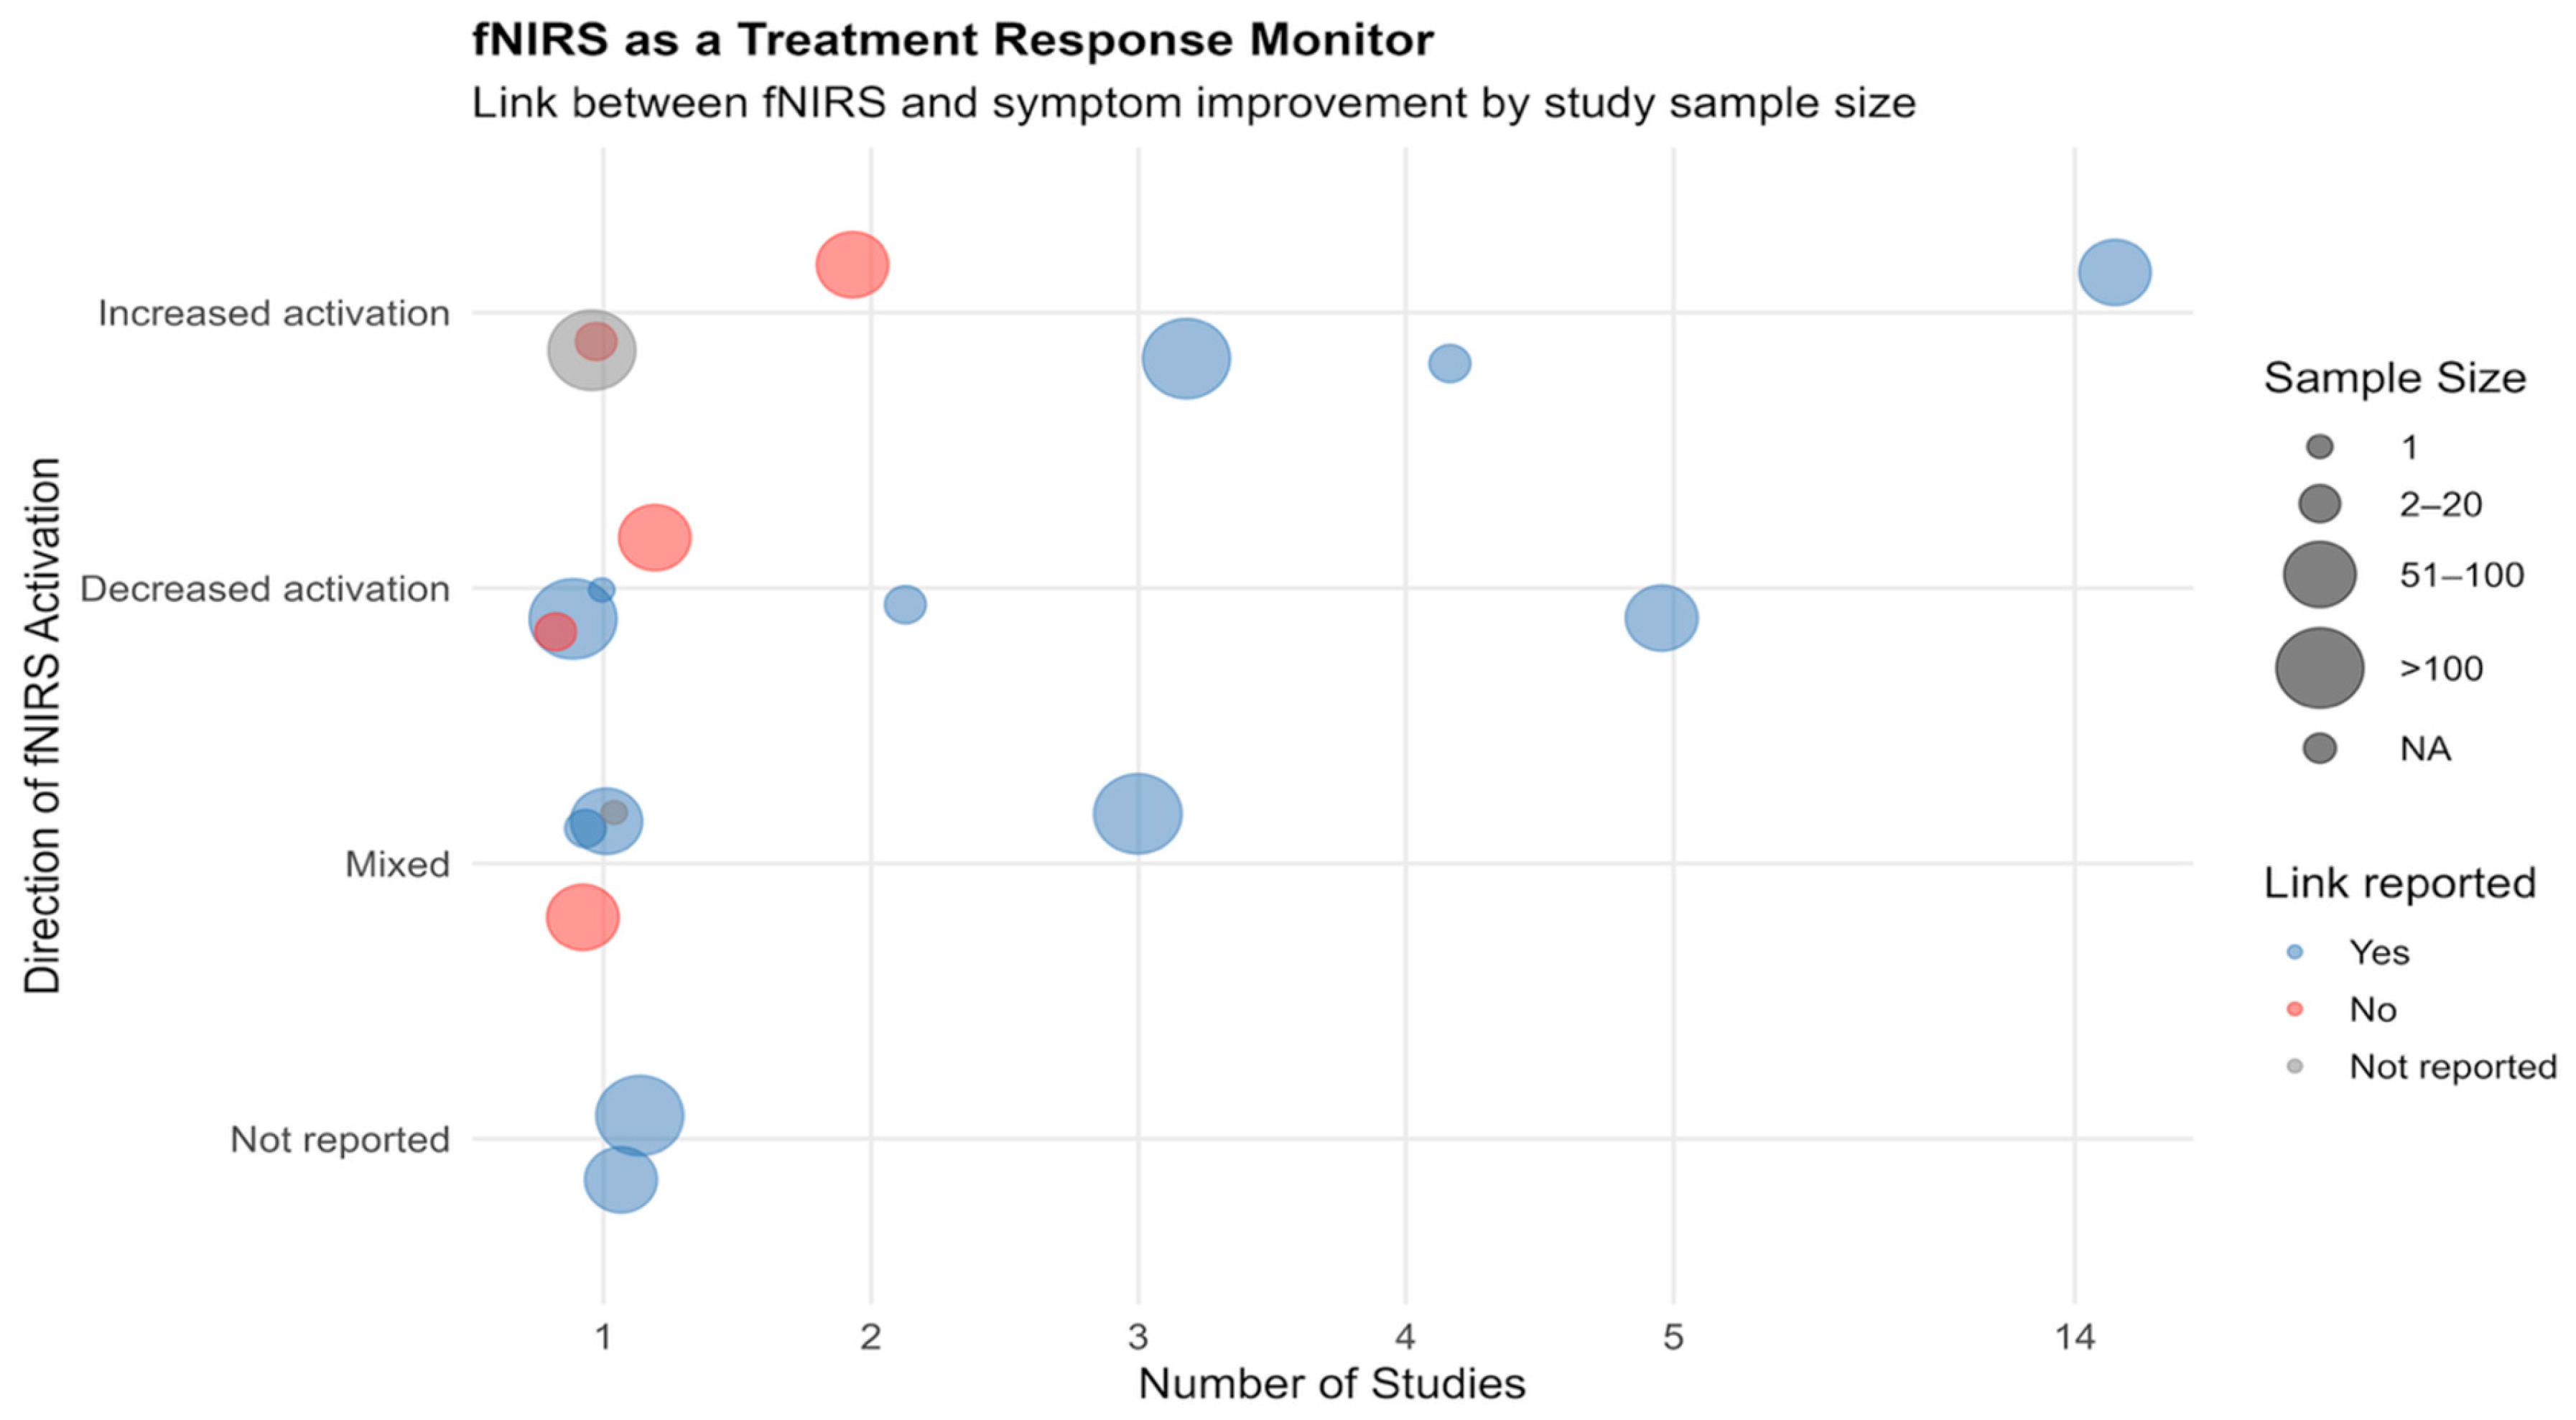
3.2.3. fNIRS-Clinical Outcome Associations Across Studies
3.3. Preprocessing Approaches in fNIRS Signal Analysis
3.3.1. Motion Artifact Correction
3.3.2. Signal Filtering
3.3.3. Signal Transformation
3.4. Reported Limitations and Conflict of Interest
4. Discussion
4.1. Study Designs, Samples and Clinical Focus
4.2. Experimental Paradigms and Neural Targets
4.3. Clinical Outcome Integration and fNIRS Treatment Monitoring Potential
5. Conclusions Future Directions
Author Contributions
Funding
Data Availability Statement
Conflicts of Interest
Abbreviations
| BD | Bipolar Disorder |
| CCO | Cytochrome-c-oxidase |
| CSF | Cerebrospinal Fluid |
| DLPFC | Dorsolateral Prefrontal Cortex |
| EEG | Electroencephalography |
| HbO | Oxyhemoglobin |
| HbD | Hemoglobin Difference |
| HbR | Deoxyhemoglobin |
| HbT | Total Hemoglobin |
| MDD | Major Depressive Disorder |
| MeSH | Medical Subject Headings |
| OFC | Orbitofrontal Cortex |
| PCA | Principal Component Analysis |
| PET | Positron Emission Tomography |
| PFC | Prefrontal Cortex |
| RCT | Randomized Controlled Trial |
| STG | Superior Temporal Gyrus |
| SUD | Substance Use Disorder |
| VR | Virtual Reality |
| WHO | World Health Organization |
| fMRI | Functional Magnetic Resonance Imaging |
| fNIRS | Functional Near-Infrared Spectroscopy |
| iTBS | Intermittent Theta Burst Stimulation |
| non-RCT | Non-Randomized Controlled Trial |
| qEEG | Quantitative Electroencephalography |
| rCBV | Regional Cerebral Blood Volume |
| rTMS | Repetitive Transcranial Magnetic Stimulation |
Appendix A

| Database | Keywords |
|---|---|
| Pubmed | (“Spectroscopy, Near-Infrared” [MeSH] OR “Spectroscopy, Near-Infrared” [tiab] OR “functional near infrared spectroscopy” [tiab] OR “fNIRS” [tiab] OR “near-infrared spectroscopy” [tiab]) AND (“Mental Disorders” [MeSH] OR “Persons with Psychiatric Disorders” [MeSH] OR “Mental Disorder” [tiab] OR “Persons with Psychiatric Disorder *” [tiab] OR depression [tiab] OR schizophrenia [tiab] OR anxiety [tiab] OR bipolar [tiab] OR “mood disorder *” [tiab]) AND (“Treatment Outcome” [MeSH] OR “Therapy Monitoring” [MeSH] OR “Treatment Outcome” [tiab] OR “treatment response” [tiab] OR “treatment monitoring” [tiab] OR intervention * [tiab] OR therapy [tiab] OR pharmacotherapy [tiab] OR psychotherapy [tiab] OR neurostimulation [tiab] OR TMS [tiab] OR CBT [tiab] OR TDCS [tiab] OR neurofeedback [tiab]) |
| Web of Science (Abstract) | (“Near-Infrared Spectroscopy” OR “functional near infrared spectroscopy” OR “fNIRS” OR “near-infrared spectroscopy”) AND (“Mental Disorder *”OR “Persons with Psychiatric Disorder *” OR depression OR schizophrenia OR anxiety OR bipolar OR “mood disorder *”) AND (“treatment response” OR “treatment monitoring” OR “intervention *” OR “therapy” OR “pharmacotherapy” OR “psychotherapy” OR “neurostimulation” OR “TMS” OR “CBT” [tiab] OR “TDCS” OR “neurofeedback”) |
| SCOPUS (Title and Abstract) | TITLE-ABS (“Near-Infrared Spectroscopy” OR “functional near infrared spectroscopy” OR “fNIRS” OR “near-infrared spectroscopy”) AND TITLE-ABS (“Mental Disorder *” OR “Persons with Psychiatric Disorder *” OR depression OR schizophrenia OR anxiety OR bipolar OR “mood disorder *”) AND TITLE-ABS (“Treatment Outcome” OR “treatment response” OR “treatment monitoring” OR intervention * OR therapy OR pharmacotherapy OR psychotherapy OR neurostimulation OR TMS OR CBT OR TDCS OR neurofeedback) |
| Embase | (mh AND (‘spectroscopy, near-infrared’/exp OR ‘spectroscopy, near-infrared’) OR ‘functional near infrared spectroscopy’/exp OR ‘functional near infrared spectroscopy’ OR ‘fnirs’/exp OR fnirs OR ‘near-infrared spectroscopy’/exp OR ‘near-infrared spectroscopy’) AND ((mh AND (‘mental disorders’/exp OR ‘mental disorders’) OR mh) AND (‘persons with psychiatric disorders’/exp OR ‘persons with psychiatric disorders’) OR ‘mental disorder *’ OR ‘depression’/exp OR depression OR ‘schizophrenia’/exp OR schizophrenia OR ‘anxiety’/exp OR anxiety OR bipolar OR ‘mood disorder *’) AND ((mh AND (‘treatment outcome’/exp OR ‘treatment outcome’) OR mh) AND (‘therapy monitoring’/exp OR ‘therapy monitoring’) OR ‘treatment response’/exp OR ‘treatment response’ OR ‘treatment monitoring’/exp OR ‘treatment monitoring’ OR intervention * OR ‘therapy’/exp OR therapy OR ‘pharmacot herapy’/exp OR pharmacotherapy OR ‘psychotherapy’/exp OR psychotherapy OR ‘neurostimulation’/exp OR neurostimulation OR ‘tms’/exp OR tms OR cbt OR tdcs OR ‘neurofeedback’/exp OR neurofeedback) |
| Author (Year) | Sample | Diagnostic | Treatment Type | Task | Regions of Interest | Equipment | Measurement | Key Findings | Motion Correction |
|---|---|---|---|---|---|---|---|---|---|
| Wong et al. (2021) [42] | 70 | MDD | Combined | rest | DLPFC | NIRSport (NIRx Medical Technologies LLC) | 18 | Increased connectivity (resting-state FC) in DLPFC after acupuncture + antidepressant vs. antidepressant alone | Yes |
| Ho et al. (2025) [43] | 64 | MDD | Medication | Combined | PSFC, DLPFC, STG, VLPFC, MPFC | ETG-4000 (Hitachi) | 52 | Increased activation (task-related hemoglobin response in dlPFC) associated with treatment responders. | No |
| Chou (2023) [37] | 26 | MDD | rTMS/iBTS | VFT | FT | ETG-4000 | 52 | Increased frontal activation in responders after rTMS, correlated with symptom improvement. | Yes |
| Yamagata et al. (2019) [44] | 11 | MDD | Medication | VFT | fronto-temporal cortex | Hitachi ETG-4000 | 52 | Some increased activation post-treatment, but baseline low activation persisted—partial normalization seen (but not total). | No |
| Blake et al. (2023) [18] | 27 | Schizophrenia | rTMS/iBTS | rest | DLPFC, IPL | NIRScout system | 26 | In schizophrenia: initial increase then decrease in IPL activation; healthy controls had immediate decrease. Connectivity abnormality detected (DLPFC → IPL), showing 0mixed pattern. | No |
| Huang et al. (2025) [34] | 272 | SUD | Medication | VFT | PFC, right and left temporal lobe, parietal lobe | Hitachi ETG-4000 | 52 | Alcohol-dependent patients showed significantly lower activation in frontal and bilateral temporal lobes compared to healthy controls (pre-treatment baseline data). | Yes |
| Barrett et al. (2025) [78] | 29 | BD | Other | Combined | PFC | NIRSIT (OBELAB Inc., Soterix Medical) | 48 | Decreased prefrontal connectivity (reduction in network correlations) observed post-TILS, despite cognitive improvements. | No |
| Zhao et al. (2024) [52] | 38 | Cognitive Impairment | rTMS/iBTS | VFT | DLPFC | NirScan (Danyang Huichuang Medical Equipment Co.) | 48 | Decreased prefrontal activation (specifically right DLPFC) during verbal fluency task after rTMS. | Yes |
| Masuda et al. (2017) [36] | 147 | MDD | Medication | VFT | DLPFC, TC, OFC | ETG-7100 | 47 | Before treatment: hypoactivation in frontotemporal cortex; responders showed slightly greater activation improvement compared to non-responders. | No |
| Campos et al. (2024) [35] | 32 | MDD | tDCS | rest | DLPFC | Humon Hex | 1 | Depression group: increased minimal oxygen saturation (SatO2) and HbO after tDCS; no effect in control group. | No |
| Wu et al. (2024) [53] | 39 | BD | Other | rest | PFC (especially DLPFC) | Artinis | 24 | Increased functional connectivity and left prefrontal activation after γ-tACS. | No |
| Metzger et al. (2015) [75] | 24 | Cognitive Impairment | Medication | VFT | PFC, temporal cortex (left and right), Broca’s area, Wernicke’s area, DLPFC, OFC | Hitachi ETG-4000 | 44 | Increase in oxygenated hemoglobin in speech areas; general decrease in prefrontal activation 1elsewhere. | No |
| Shimizu et al. (2018) [54] | 45 | Cognitive Impairment | Other | Motor | PFC, DLPFC, mPFC | LABNIRS | 45 | Increased cerebral blood flow (activation) in PFC during movement music therapy. | No |
| Feng et al. (2019) [55] | 30 | MDD | Other | VFT | DLPFC, OFC, VMPFC | FOIRE-3000 (Shimadzu, Kyoto, Japan) | 45 | Increased HbO in DLPFC, OFC, and VMPFC post-therapy. | Yes |
| Wu et al. (2022) [56] | 1 | Anxiety Disorders | tDCS | rest | PFC | NirSmart | 45 | Decrease in prefrontal connectivity after tDCS. | No |
| Talamonti et al. (2022) [79] | 32 | Cognitive Impairment | Other | Cognitive task | PFcd, PFrd, PFrm, PM, M (Brodmann areas 8, 9, 10, 46) | In-house 16 source × 16 detector portable system | 256 | Significant decrease in cortical activity during cognitive dual-tasks over time. | Yes |
| Hirano et al. (2017) [32] | 138 | MDD | Other | VFT | FT | ETG-4000 Optical Topography System | 52 | Increase in HbO in bilateral frontal cortex during verbal fluency task post-ECT. | No |
| Deppermann et al. (2016) [17] | 83 | Anxiety Disorders | Combined | VR | IFG, DLPFC | ETG-4000 Optical Topography System | 52 | Reduced left IFG activation + increased co-activation between left IFG and contralateral PFC. | No |
| Ohta et al. (2009) [16] | 13 | Other Disorders | Other | Emotional/recall | PFC | ETG-100 | 24 | Significant decrease in lateral PFC HbO during trauma recall with eye movements. | No |
| Shinba et al. (2018) [57] | 15 | MDD | rTMS/iBTS | rest | PFC | NIRO-300 | 1 | Increase in frontal hemoglobin concentration (fHbC) during TMS linked to symptom improvement. | No |
| Huhn et al. (2019) [80] | 28 | SUD | Medication | Cognitive task | DLPFC, PFC | fNIR Devices, LLC (Model 1200) | 16 | Higher right DLPFC activation during decision-making in cocaine users. | Yes |
| Huang et al. (2022) [58] | 80 | MDD | rTMS/iBTS | VFT | DLPFC, VLPFC, FPPFC | BS-3000 | 37 | Increased HbO in bilateral prefrontal regions (FPPC, VLPFC, left DLPFC) post-rTMS. | Yes |
| Sened et al. (2025) [59] | 8 | Anxiety Disorders | Psychotherapy | Emotional/recall | IFG | BRITE 24 (Artinis Medical Systems) | 24 | Inter-brain synchrony increased during therapy (measured by fNIRS hyperscanning). | Yes |
| Li et al. (2025) [60] | 39 | Schizophrenia | rTMS/iBTS | Combined | LmPFC, RmPFC, LFEF, RFEF, LDLPFC, RDLPFC, LBroca, RBroca, LFPA, RFPA, LPre & SMA, RPre & SMA | BS-3000 | 53 | Increased activation in PFC; improved small-world network properties (connectivity). | Yes |
| Yamazaki et al. (2022) [61] | 19 | MDD | rTMS/iBTS | VFT | PFC | Spectratech OEG-16 | 16 | Post-treatment: increased leftward shift (increased left PFC activation). | No |
| He et al. (2024) [62] | 40 | SUD | Other | Emotional/recall | dlPFC, vlPFC, OFC, FPA | NIRScout | 20 | Increased activation in right dlPFC and vlPFC after HIIT. | No |
| Lee et al. (2024) [45] | 81 | Cognitive Impairment | Other | Combined | Prefrontal cortex-right vlPFC, DLPFC | NIRSIT-LITE (OBELAB, Seoul, Republic of Korea) | 15 | Only predictive features (HbO metrics) reported; no direct pre-post comparison of activation. | Yes |
| Struckmann et al. (2022) [76] | 34 | MDD | rTMS/iBTS | rest | dlPFC | NIRO 200X (Hamamatsu, Japan) | 2 | Connectivity changes: Decreased left dlPFC–insula connectivity after iTBS. | No |
| Mizumoto et al. (2024) [63] | 60 | Mixed | Other | Other | orbital PFC | PocketNIRS DUO (Dynasense, Hamamatsu) | 2 | In depression group: Increased orbital PFC activation; In anxiety group: Decrease linked to better mood. | No |
| Usami et al. (2014) [64] | 10 | MDD | Psychotherapy | VFT | frontopolar cortex | 2-channel NIRS (Spectratech Inc., Japan) | 2 | Increased HbO concentration in the frontopolar cortex after 6 weeks of treatment. | No |
| Taylor et al. (2017) [84] | 1 | Schizophrenia | tDCS | Cognitive task | Left DLPFC and TPJ | NIRScout (NIRx Medical Technologies, USA) | 12 | Initial increase in oxygenation during task, followed by decrease post-tDCS. | No |
| Deppermann et al. (2017) [77] | 44 | Anxiety Disorders | Combined | Emotional/recall | PFC | ETG-4000 Optical Topography System | 52 | Increased bilateral PFC activation after verum iTBS. | No |
| Wigal et al. (2012) [81] | 26 | Other Disorders | Medication | rest | frontal cortex | Frequency domain NIRS (ISS, Inc., Champaign, IL, USA) | 8 | Medication induced reorganization of phase synchronization between left and right frontal lobes. | No |
| Wu et al. (2024) [65] | 27 | MDD | Other | VFT | PreM, SMA, FEF, Broca | BS-3000 | 53 | Increased hemodynamic response (HbO) and improved functional connectivity after ECT. | Yes |
| Ruocco et al. (2016) [82] | 29 | Other Disorders | Psychotherapy | Cognitive task | DLPFC | fNIR Imager 1000r | 16 | Patients who reduced self-harm showed increased activation in the right DLPFC after DBT. | No |
| Gong et al. (2022) [66] | 45 | Other Disorders | Medication | Combined | DLPFC, frontal poles, frontopolar cortex | NirScan6000B (Danyang Huichuang Medical Equipment Co., Ltd.) | 48 | Increased activation and enhanced connectivity in PFC after drug treatment. | Yes |
| Huhn et al. (2019) [85] | 29 | SUD | Medication | Emotional/recall | PFC | fNIR Devices, LLC, Model 1200 | 16 | Increased left lateral PFC activation to drug cues associated with abstinence success. | Yes |
| O’Donnell et al. (2023) [83] | 15 | BD | Other | rest | Bilateral anterior PFC (BA 10) | Custom bbNIRS (Ocean Optics QE-Pro) | 4 | Increased oxidized CCO and HbD (oxygenation) in PFC after TILS. | No |
| Sutoh et al. (2016) [67] | 8 | Other Disorders | rTMS/iBTS | Cognitive task | Left and right prefrontal cortex, specifically left DLPFC (Brodmann area 9) | 2-channel NIRS (unspecified vendor; forehead mount) | 2 | Decreased oxygenation in the left DLPFC after rTMS. | No |
| Tomita et al. (2024) [68] | 23 | Anxiety Disorders | Other | Combined | rFPA | NIRSport2 (NIRx) | 32 | Decreased activation in right frontopolar area (rFPA) after tSMS. | Yes |
| Liu Chen et al. (2024) [69] | 28 | Other Disorders | tDCS | Cognitive task | dlPFC, FPA, pars triangularis Broca’s area | Preprocessing + GLM (beta values), motion control not specified | 19 | Increased PFC activation (dlPFC, FPA) after tDCS. | No |
| Narita et al. (2018) [70] | 26 | Schizophrenia | tDCS | VFT | Left temporoparietal regions | ETG-4000 (Hitachi Medical Co., Tokyo, Japan) | 52 | Improvement in psychotic symptoms correlated with baseline HbO but no direct post-treatment brain activation change reported. | Yes |
| Kim et al. (2024) [71] | 45 | Anxiety Disorders | Psychotherapy | rest | DLPFC, VLPFC, FPC, OFC | NIRSIT (OBELAB Inc, South Korea) | 48 | Decreased HbO in right VLPFC and OFC after app treatment. | No |
| Lee et al. (2021) [46] | 74 | Anxiety Disorders | VR | VR | FPPFC, OFC, DLPFC, VLPFC | NIRSIT (OBELAB Inc., Seoul, Republic of Korea) | 48 | Decreased activation in FPPFC and OFC after VR treatment. | No |
| Gao et al. (2025) [72] | 104 | Schizophrenia | rTMS/iBTS | rest | DLPFC, bilateral frontal pole, right superior temporal gyrus | NirScan-6000C (Danyang Huichuang Medical Equipment Company) | 48 | Increased activation in bilateral frontal poles and decreased activation in STG. | Yes |
| Zhang et al. (2023) [73] | 37 | Mixed | rTMS/iBTS | VFT | DLPFC, Broca’s areas, Frontal Lobe, FP, SMC, FE, FL | Not specified (likely commercial 53-channel system) | 53 | Increased functional connectivity between brain regions post-iTBS. | Yes |
| Liao et al. (2020) [74] | 34 | Cognitive Impairment | Combined | Combined | PFC | OEG-16 (Spectratech Inc., Japan) | 16 | Decreased PFC activation after VR training, indicating improved neural efficiency. | No |
| Key Criteria | Checklist Items | Score One Point for Each Item |
|---|---|---|
| 1. Study aim, purpose, and research question | 1. The rationale/purpose for the scoping review was stated. | 1 |
| 2. Appropriate scoping review methodology was used. | 1 | |
| 3. At least two reviewers conducted the review. | 1 | |
| 4. The research question(s) was/were used to guide the scope of inquiry (participants, concept, and context included). | 1 | |
| 2. Relevant studies | 5. An in-depth literature search was conducted to identify all relevant literature. | 1 |
| 6. A comprehensive list of relevant studies that balances breadth with feasibility was identified. | 1 | |
| 3. Study selection | 7. The inclusion and exclusion criteria were clearly described and were used to determine eligibility of studies. | 1 |
| 8. The study selection involved an iterative process, including searching the literature, refining the search strategy, and reviewing articles for inclusion. | 1 | |
| 9. At least two reviewers independently reviewed the title and abstracts and reached consensus on studies for inclusion. | 1 | |
| 10. The study selection process was summarized in a flow chart. | 1 | |
| 4. Charting the data | 11. The research team collectively developed a data charting format and determined which variables to extract to answer the research question. | 1 |
| 12. The data were charted through sifting and sorting; tables include study details based on full texts. | 1 | |
| 13. A numerical analysis of the extent and nature of included studies was reported. | 1 | |
| 14. The quality of papers was assessed. | 1 | |
| 5. Collating, summarizing, and reporting the results | 15. Results were presented in a logical descriptive or diagrammatic or tabular format. | 1 |
| 16. A narrative account of results was presented. | 1 | |
| 17. The results were aligned with the review aim, purpose/research question(s). | 1 | |
| 18. Issues associated with bias were discussed. | N/A | |
| 19. Implications for future research, education, practice, and/or policy were discussed. | 1 | |
| 20. The conclusion described the current state of the overall literature in relation to the topic. | 1 | |
| Total | 19 points |
| Issues | |||
|---|---|---|---|
| Studies | No | Yes | Number |
| Wong et al. (2021) [42] | X | 3 | |
| Ho et al. (2025) [43] | X | 1 | |
| Chou (2023) [37] | X | 3 | |
| Yamagata et al. (2019) [44] | X | 2 | |
| Blake et al. (2023) [18] | X | 5 | |
| Huang et al. (2025) [34] | X | 1 | |
| Barrett et al. (2025) [78] | X | ||
| Zhao et al. (2024) [52] | X | 2 | |
| Masuda et al. (2017) [36] | X | 4 | |
| Campos et al. (2024) [35] | X | 2 | |
| Wu et al. (2024) [53] | X | ||
| Metzger et al. (2015) [75] | X | 1 | |
| Shimizu et al. (2018) [54] | X | 3 | |
| Feng et al. (2019) [55] | X | 4 | |
| Wu et al. (2022) [56] | X | ||
| Talamonti et al. (2022) [79] | X | 1 | |
| Hirano et al. (2017) [32] | X | 2 | |
| Deppermann et al. (2016) [17] | X | ||
| Ohta et al. (2009) [16] | X | 2 | |
| Shinba et al. (2018) [57] | X | 3 | |
| Huhn et al. (2019) [80] | X | ||
| Huang et al. (2022) [58] | X | ||
| Sened et al. (2025) [59] | X | 3 | |
| Li et al. (2025) [60] | X | ||
| Yamazaki et al. (2022) [61] | X | 2 | |
| He et al. (2024) [62] | X | ||
| Lee et al. (2024) [45] | X | 3 | |
| Struckmann et al. (2022) [76] | X | ||
| Mizumoto et al. (2024) [63] | X | ||
| Usami et al. (2014) [64] | X | 3 | |
| Taylor et al. (2017) [84] | X | 2 | |
| Deppermann et al. (2017) [77] | X | 2 | |
| Wigal et al. (2012) [81] | X | 1 | |
| Wu et al. (2024) [65] | X | ||
| Ruocco et al. (2016) [82] | X | 1 | |
| Gong et al. (2022) [66] | X | 2 | |
| Huhn et al. (2019) [85] | X | ||
| O’Donnell et al. (2023) [83] | X | 1 | |
| Sutoh et al. (2016) [67] | X | 2 | |
| Tomita et al. (2024) [68] | X | 1 | |
| Liu Chen et al. (2024) [69] | X | 1 | |
| Narita et al. (2018) [70] | X | 2 | |
| Kim et al. (2024) [71] | X | 1 | |
| Lee et al. (2021) [46] | X | ||
| Gao et al. (2025) [72] | X | 1 | |
| Zhang et al. (2023) [73] | X | 3 | |
| Liao et al. (2020) [74] | X |
References
- Newnham, E.A.; Hooke, G.R.; Page, A.C. Monitoring treatment response and outcomes using the World Health Organization’s Wellbeing Index in psychiatric care. J. Affect. Disord. 2010, 122, 133–138. [Google Scholar] [CrossRef]
- Tenny, S.; Varacallo, M.A. Evidence-Based Medicine. In StatPearls; StatPearls Publishing: Treasure Island, FL, USA, 2025. [Google Scholar]
- Spaulding, W.; Deogun, J. A pathway to personalization of integrated treatment: Informatics and decision science in psychiatric rehabilitation. Schizophr. Bull. 2011, 37 (Suppl. 2), S129–S137. [Google Scholar] [CrossRef]
- McAleavey, A.A.; de Jong, K.; Nissen-Lie, H.A.; Boswell, J.F.; Moltu, C.; Lutz, W. Routine outcome monitoring and clinical feedback in psychotherapy: Recent advances and future directions. Adm. Policy Ment. Health 2024, 51, 291–305. [Google Scholar] [CrossRef]
- Niculescu, A.B. Special report: Precise, personalized, and preventive psychiatry. Psychiatr. News 2024, 59, 12. [Google Scholar] [CrossRef]
- Wei, Y.; Chen, Q.; Curtin, A.; Tu, L.; Tang, X.; Tang, Y.; Xu, L.; Qian, Z.; Zhou, J.; Zhu, C.; et al. Functional near-infrared spectroscopy (fNIRS) as a tool to assist the diagnosis of major psychiatric disorders in a Chinese population. Eur. Arch. Psychiatry Clin. Neurosci. 2021, 271, 745–757. [Google Scholar] [CrossRef]
- Anderson, A.N.; King, J.B.; Anderson, J.S. Neuroimaging in Psychiatry and Neurodevelopment: Why the emperor has no clothes. Br. J. Radiol. 2019, 92, 20180910. [Google Scholar] [CrossRef] [PubMed]
- Phillips, V.Z.; Canoy, R.J.; Paik, S.-H.; Lee, S.H.; Kim, B.-M. Functional Near-Infrared Spectroscopy as a Personalized Digital Healthcare Tool for Brain Monitoring. J. Clin. Neurol. 2023, 19, 115–124. [Google Scholar] [CrossRef] [PubMed]
- Klein, F.; Kohl, S.H.; Lührs, M.; Mehler, D.M.A.; Sorger, B. From lab to life: Challenges and perspectives of fNIRS for haemodynamic-based neurofeedback in real-world environments. Philos. Trans. R. Soc. B Biol. Sci. 2024, 379, 20230087. [Google Scholar] [CrossRef] [PubMed]
- Mental Disorders. Available online: https://www.who.int/news-room/fact-sheets/detail/mental-disorders (accessed on 25 May 2025).
- Irani, F.; Platek, S.M.; Bunce, S.; Ruocco, A.C.; Chute, D. Functional near infrared spectroscopy (fNIRS): An emerging neuroimaging technology with important applications for the study of brain disorders. Clin. Neuropsychol. 2007, 21, 9–37. [Google Scholar] [CrossRef]
- Lu, H.; Zhang, Y.; Qiu, H.; Zhang, Z.; Tan, X.; Huang, P.; Zhang, M.; Miao, D.; Zhu, X. A new perspective for evaluating the efficacy of tACS and tDCS in improving executive functions: A combined tES and fNIRS study. Hum. Brain Mapp. 2024, 45, e26559. [Google Scholar] [CrossRef]
- Wang, N.; He, Y.; Zhu, S.; Liu, D.; Chai, X.; He, Q.; Cao, T.; He, J.; Li, J.; Si, J.; et al. Functional near-infrared spectroscopy for the assessment and treatment of patients with disorders of consciousness. Front. Neurol. 2025, 16, 1524806. [Google Scholar] [CrossRef]
- Highton, D.; Boas, D.; Minagawa, Y.; Mesquita, R.C.; Gervain, J. Special Section Guest Editorial: Thirty Years of Functional Near-Infrared Spectroscopy. Neurophotonics 2023, 10, 023501. [Google Scholar] [CrossRef] [PubMed]
- Rahman, M.A.; Siddik, A.B.; Ghosh, T.K.; Khanam, F.; Ahmad, M. A Narrative Review on Clinical Applications of fNIRS. J. Digit. Imaging 2020, 33, 1167–1184. [Google Scholar] [CrossRef] [PubMed]
- Ohtani, T.; Matsuo, K.; Kasai, K.; Kato, T.; Kato, N. Hemodynamic responses of eye movement desensitization and reprocessing in posttraumatic stress disorder. Neurosci. Res. 2009, 65, 375–383. [Google Scholar] [CrossRef] [PubMed]
- Deppermann, S.; Notzon, S.; Kroczek, A.; Rosenbaum, D.; Haeussinger, F.B.; Diemer, J.; Domschke, K.; Fallgatter, A.J.; Ehlis, A.C.; Zwanzger, P. Functional co-activation within the prefrontal cortex supports the maintenance of behavioural performance in fear-relevant situations before an iTBS modulated virtual reality challenge in participants with spider phobia. Behav. Brain Res. 2016, 307, 208–217. [Google Scholar] [CrossRef]
- Ćurčić-Blake, B.; Kos, C.; Aleman, A. Causal connectivity from right DLPFC to IPL in schizophrenia patients: A pilot study. Schizophrenia 2022, 8, 16. [Google Scholar] [CrossRef]
- Quaresima, V.; Ferrari, M. Functional Near-Infrared Spectroscopy (fNIRS) for Assessing Cerebral Cortex Function During Human Behavior in Natural/Social Situations: A Concise Review. Organ. Res. Methods 2016, 22, 46–68. [Google Scholar] [CrossRef]
- Yang, D.; Shin, Y.-I.; Hong, K.-S. Systemic review on transcranial electrical stimulation parameters and eeg/fnirs features for brain diseases. Front. Neurosci. 2021, 15, 629323. [Google Scholar] [CrossRef]
- Li, Y.; Li, X.; Zhaung, W.; Yu, C.; Wei, S.; Li, Y.; Liu, J.; Li, J.; Luorui, C.; Zheng, C.; et al. Relationship between cognitive function and brain activation in major depressive disorder patients with and without insomnia: A functional near-infrared spectroscopy (fNIRS) study. J. Psychiatr. Res. 2024, 169, 134–141. [Google Scholar] [CrossRef]
- Scholkmann, F.; Kleiser, S.; Metz, A.J.; Zimmermann, R.; Mata Pavia, J.; Wolf, U.; Wolf, M. A review on continuous wave functional near-infrared spectroscopy and imaging instrumentation and methodology. Neuroimage 2014, 85 Pt 1, 6–27. [Google Scholar] [CrossRef]
- Xie, L.; Liu, Y.; Gao, Y.; Zhou, J. Functional Near-Infrared Spectroscopy in neurodegenerative disease: A review. Front. Neurosci. 2024, 18, 1469903. [Google Scholar] [CrossRef]
- Chen, W.-L.; Wagner, J.; Heugel, N.; Sugar, J.; Lee, Y.-W.; Conant, L.; Malloy, M.; Heffernan, J.; Quirk, B.; Zinos, A.; et al. Functional Near-Infrared Spectroscopy and Its Clinical Application in the Field of Neuroscience: Advances and Future Directions. Front. Neurosci. 2020, 14, 724. [Google Scholar] [CrossRef] [PubMed]
- Pinti, P.; Aichelburg, C.; Gilbert, S.; Hamilton, A.; Hirsch, J.; Burgess, P.; Tachtsidis, I. A Review on the Use of Wearable Functional Near-Infrared Spectroscopy in Naturalistic Environments. Jpn. Psychol. Res. 2018, 60, 347–373. [Google Scholar] [CrossRef] [PubMed]
- Singh, A.K.; Dan, I. Exploring the false discovery rate in multichannel NIRS. Neuroimage 2006, 33, 542–549. [Google Scholar] [CrossRef] [PubMed]
- Zhang, Y.; Zhang, Y.; Jiang, Z.; Xu, M.; Qing, K. The effect of EEG and fNIRS in the digital assessment and digital therapy of Alzheimer’s disease: A systematic review. Front. Neurosci. 2023, 17, 1269359. [Google Scholar] [CrossRef] [PubMed]
- Pinti, P.; Tachtsidis, I.; Hamilton, A.; Hirsch, J.; Aichelburg, C.; Gilbert, S.; Burgess, P.W. The present and future use of functional near-infrared spectroscopy (fNIRS) for cognitive neuroscience. Ann. N. Y. Acad. Sci. 2020, 1464, 5–29. [Google Scholar] [CrossRef]
- Li, R.; Yang, D.; Fang, F.; Hong, K.-S.; Reiss, A.L.; Zhang, Y. Concurrent fNIRS and EEG for Brain Function Investigation: A Systematic, Methodology-Focused Review. Sensors 2022, 22, 5865. [Google Scholar] [CrossRef]
- Fu, S.; Liu, F.; Zhi, X.; Wang, Y.; Liu, Y.; Chen, H.; Wang, Y.; Luo, M. Applications of functional near-infrared spectroscopy in non-drug therapy of traditional Chinese medicine: A review. Front. Neurosci. 2023, 17, 1329738. [Google Scholar] [CrossRef]
- Stilling, J.M.; Duszynski, C.C.; Oni, I.; Paxman, E.; Dunn, J.F.; Debert, C.T. Using Functional Near-Infrared Spectroscopy to Study the Effect of Repetitive Transcranial Magnetic Stimulation in Concussion: A Two-Patient Case Study. Front. Neurol. 2019, 10, 476. [Google Scholar] [CrossRef]
- Hirano, J.; Takamiya, A.; Yamagata, B.; Hotta, S.; Miyasaka, Y.; Pu, S.; Iwanami, A.; Uchida, H.; Mimura, M. Frontal and temporal cortical functional recovery after electroconvulsive therapy for depression: A longitudinal functional near-infrared spectroscopy study. J. Psychiatr. Res. 2017, 91, 26–35. [Google Scholar] [CrossRef]
- Noah, J.A.; Ono, Y.; Nomoto, Y.; Shimada, S.; Tachibana, A.; Zhang, X.; Bronner, S.; Hirsch, J. fMRI Validation of fNIRS Measurements During a Naturalistic Task. J. Vis. Exp. 2015, e52116. [Google Scholar] [CrossRef]
- Huang, A.; Wang, R.; Wen, A.; Xu, L.; Li, N.; Gao, Y.; Lu, W.; Guo, S.; Wang, J.; Wang, L. Clinical value of predicting relapse within 3 months in alcohol-dependent patients using fNIRS in verbal fluency task. Sci. Rep. 2025, 15, 5283. [Google Scholar] [CrossRef] [PubMed]
- Campos, L.O.; de Cassia Gomes Souza Macedo, M.; Monerat, V.K.V.; do Rosário Ferreira, K.R.; dos Santos, M.E.C.; Esquirio, A.F.; Alves, A.L.G.; Gama, G.L.; Barbosa, M.A.; Barbosa, A.C. Does the Transcranial Direct Current Stimulation Selectively Modulate Prefrontal Cortex Hemodynamics? An Immediate Effect-Controlled Trial on People with and without Depression. Appl. Sci. 2024, 14, 7901. [Google Scholar] [CrossRef]
- Masuda, K.; Nakanishi, M.; Okamoto, K.; Kawashima, C.; Oshita, H.; Inoue, A.; Takita, F.; Izumi, T.; Ishitobi, Y.; Higuma, H.; et al. Different functioning of prefrontal cortex predicts treatment response after a selective serotonin reuptake inhibitor treatment in patients with major depression. J. Affect. Disord. 2017, 214, 44–52. [Google Scholar] [CrossRef] [PubMed]
- Chou, P.-H.; Liu, W.-C.; Wang, S.-C.; Lin, W.-H.; Chung, Y.-L.; Chang, C.-H.; Su, K.-P. Associations between frontal lobe activity and depressive symptoms in patients with major depressive disorder receiving rTMS treatment: A near-infrared spectroscopy study. Front. Psychiatry 2023, 14, 1235713. [Google Scholar] [CrossRef]
- Xu, H.; Wang, Y.; Wang, Y.M.; Cao, Y.; Li, P.; Hu, Y.; Xia, G. Insomniacs show greater prefrontal activation during verbal fluency task compared to non-insomniacs: A functional near-infrared spectroscopy investigation of depression in patients. BMC Psychiatry 2023, 23, 217. [Google Scholar] [CrossRef]
- Zhang, X.; Noah, J.A.; Hirsch, J. Separation of the global and local components in functional near-infrared spectroscopy signals using principal component spatial filtering. Neurophotonics 2016, 3, 015004. [Google Scholar] [CrossRef]
- Jöbsis, F.F. Noninvasive, infrared monitoring of cerebral and myocardial oxygen sufficiency and circulatory parameters. Science 1977, 198, 1264–1267. [Google Scholar] [CrossRef]
- Balters, S.; Baker, J.M.; Geeseman, J.W.; Reiss, A.L. A Methodological Review of fNIRS in Driving Research: Relevance to the Future of Autonomous Vehicles. Front. Hum. Neurosci. 2021, 15, 637589. [Google Scholar] [CrossRef]
- Wong, Y.K.; Wu, J.M.; Zhou, G.; Zhu, F.; Zhang, Q.; Yang, X.J.; Qin, Z.; Zhao, N.; Chen, H.; Zhang, Z.-J. Antidepressant Monotherapy and Combination Therapy with Acupuncture in Depressed Patients: A Resting-State Functional Near-Infrared Spectroscopy (fNIRS) Study. Neurotherapeutics 2021, 18, 2651–2663. [Google Scholar] [CrossRef]
- Ho, C.S.H.; Wang, J.; Tay, G.W.N.; Ho, R.; Lin, H.; Li, Z.; Chen, N. Application of functional near-infrared spectroscopy and machine learning to predict treatment response after six months in major depressive disorder. Transl. Psychiatry 2025, 15, 7. [Google Scholar] [CrossRef]
- Yamagata, B.; Yamanaka, K.; Takei, Y.; Hotta, S.; Hirano, J.; Tabuchi, H.; Mimura, M. Brain functional alterations observed 4-weekly in major depressive disorder following antidepressant treatment. J. Affect. Disord. 2019, 252, 25–31. [Google Scholar] [CrossRef]
- Lee, K.; Chun, M.; Jung, B.; Kim, Y.; Yang, C.; Choi, J.; Cha, J.; Lee, S.-H.; Im, C.-H. Machine-Learning-Based Prediction of Photobiomodulation Effects on Older Adults With Cognitive Decline Using Functional Near-Infrared Spectroscopy. IEEE Trans. Neural Syst. Rehabil. Eng. 2024, 32, 3710–3718. [Google Scholar] [CrossRef]
- Lee, H.; Choi, J.; Jung, D.; Hur, J.-W.; Cho, C.-H. The effects of virtual reality treatment on prefrontal cortex activity in patients with social anxiety disorder: Participatory and interactive virtual reality treatment study. J. Med. Internet Res. 2021, 23, e31844. [Google Scholar] [CrossRef] [PubMed]
- Tricco, A.C.; Lillie, E.; Zarin, W.; O’Brien, K.K.; Colquhoun, H.; Levac, D.; Moher, D.; Peters, M.D.J.; Horsley, T.; Weeks, L.; et al. PRISMA Extension for Scoping Reviews (PRISMA-ScR): Checklist and explanation. Ann. Intern. Med. 2018, 169, 467–473. [Google Scholar] [CrossRef] [PubMed]
- Pollock, D.; Evans, C.; Menghao Jia, R.; Alexander, L.; Pieper, D.; Brandão de Moraes, É.; Peters, M.D.J.; Tricco, A.C.; Khalil, H.; Godfrey, C.M.; et al. “How-to”: Scoping review? J. Clin. Epidemiol. 2024, 176, 111572. [Google Scholar] [CrossRef] [PubMed]
- Khalil, H.; Campbell, F.; Danial, K.; Pollock, D.; Munn, Z.; Welsh, V.; Saran, A.; Hoppe, D.; Tricco, A.C. Advancing the methodology of mapping reviews: A scoping review. Res. Synth. Methods 2024, 15, 384–397. [Google Scholar] [CrossRef]
- R Core Team. R: A Language and Environment for Statistical Computing; R Foundation for Statistical Computing: Vienna, Austria, 2024; Available online: https://www.r-project.org (accessed on 8 May 2025).
- Cooper, S.; Cant, R.; Kelly, M.; Levett-Jones, T.; McKenna, L.; Seaton, P.; Bogossian, F. An Evidence-Based Checklist for Improving Scoping Review Quality. Clin. Nurs. Res. 2021, 30, 230–240. [Google Scholar] [CrossRef]
- Zhao, Y.; Qiu, C.; Lin, P.; Yang, M.; Huang, L.; Zhao, Z.; Wu, X.; Zhou, D. Decreased prefrontal activation during verbal fluency task after repetitive transcranial magnetic stimulation treatment for depression in Alzheimer’s disease: A functional near-infrared spectroscopy study. Front. Aging Neurosci. 2024, 16, 1460853. [Google Scholar] [CrossRef]
- Wu, H.; Zhang, Q.; Wan, L.; Chen, Y.; Zhang, Y.; Wang, L.; Jin, S. Effect of γ-tACS on prefrontal hemodynamics in bipolar disorder: A functional near-infrared study. J. Psychiatr. Res. 2024, 175, 227–234. [Google Scholar] [CrossRef]
- Shimizu, N.; Umemura, T.; Matsunaga, M.; Hirai, T. Effects of movement music therapy with a percussion instrument on physical and frontal lobe function in older adults with mild cognitive impairment: A randomized controlled trial. Aging Ment. Health 2018, 22, 1614–1626. [Google Scholar] [CrossRef]
- Feng, K.; Shen, C.-Y.; Ma, X.-Y.; Chen, G.-F.; Zhang, M.-L.; Xu, B.; Liu, X.-M.; Sun, J.-J.; Zhang, X.-Q.; Liu, P.-Z.; et al. Effects of music therapy on major depressive disorder: A study of prefrontal hemodynamic functions using fNIRS. Psychiatry Res. 2019, 275, 86–93. [Google Scholar] [CrossRef]
- Wu, Y.; Tang, L.; Shi, X.; Zhou, Z.; Li, Y.; Shan, C. Effects of tDCS on Depression and Comorbid Generalized Anxiety Disorder: A Brain Function Imaging Case Report. Front. Neurol. 2022, 13, 879339. [Google Scholar] [CrossRef] [PubMed]
- Shinba, T.; Kariya, N.; Matsuda, S.; Matsuda, H.; Obara, Y. Increase of frontal cerebral blood volume during transcranial magnetic stimulation in depression is related to treatment effectiveness: A pilot study with near-infrared spectroscopy. Psychiatry Clin. Neurosci. 2018, 72, 602–610. [Google Scholar] [CrossRef] [PubMed]
- Huang, J.; Zhang, J.; Zhang, T.; Wang, P.; Zheng, Z. Increased Prefrontal Activation During Verbal Fluency Task After Repetitive Transcranial Magnetic Stimulation Treatment in Depression: A Functional Near-Infrared Spectroscopy Study. Front. Psychiatry 2022, 13, 876136. [Google Scholar] [CrossRef] [PubMed]
- Sened, H.; Gorst Kaduri, K.; Nathan Gamliel, H.; Rafaeli, E.; Zilcha-Mano, S.; Shamay-Tsoory, S. Inter-brain plasticity as a mechanism of change in psychotherapy: A proof of concept focusing on test anxiety. Psychother. Res. 2025, 1–15. [Google Scholar] [CrossRef]
- Li, J.; Jiang, D.; Huang, X.; Wang, X.; Xia, T.; Zhang, W. Intermittent theta burst stimulation for negative symptoms in schizophrenia patients with moderate to severe cognitive impairment: A randomized controlled trial. Psychiatry Clin. Neurosci. 2025, 79, 147–157. [Google Scholar] [CrossRef]
- Yamazaki, R.; Inoue, Y.; Matsuda, Y.; Kodaka, F.; Kitamura, Y.; Kita, Y.; Shigeta, M.; Kito, S. Laterality of prefrontal hemodynamic response measured by functional near-infrared spectroscopy before and after repetitive transcranial magnetic stimulation: A potential biomarker of clinical outcome. Psychiatry Res. 2022, 310, 114444. [Google Scholar] [CrossRef]
- He, M.; Wang, L.; Xu, D.; Liu, Y.; Zhu, X.; Zhu, D.; Yang, S. Long-Term High-Intensity Interval Training Intervention Improves Emotional Conflict Control in Association With Right Ventrolateral Prefrontal Activation in Males With Methamphetamine Use Disorder: A Randomized Controlled Trial. Scand. J. Med. Sci. Sports 2024, 34, e70006. [Google Scholar] [CrossRef]
- Mizumoto, T.; Ikei, H.; Hagiwara, K.; Matsubara, T.; Higuchi, F.; Kobayashi, M.; Yamashina, T.; Sasaki, J.; Yamada, N.; Higuchi, N.; et al. Mood and physiological effects of visual stimulation with images of the natural environment in individuals with depressive and anxiety disorders. J. Affect. Disord. 2024, 356, 257–266. [Google Scholar] [CrossRef]
- Usami, M.; Iwadare, Y.; Kodaira, M.; Watanabe, K.; Saito, K. Near infrared spectroscopy study of the frontopolar hemodynamic response and depressive mood in children with major depressive disorder: A pilot study. PLoS ONE 2014, 9, e86290. [Google Scholar] [CrossRef] [PubMed]
- Wu, Q.; Sun, W.; Liu, J.; Zhang, P. Pilot study of cerebral hemodynamics in depressive patient under electroconvulsive therapy. Neuropsychiatr. Dis. Treat. 2024, 20, 2553–2567. [Google Scholar] [CrossRef] [PubMed]
- Gong, H.; Sun, H.; Ma, Y.; Tan, Y.; Cui, M.; Luo, M.; Chen, Y. Prefrontal brain function in patients with chronic insomnia disorder: A pilot functional near-infrared spectroscopy study. Front. Neurol. 2022, 13, 985988. [Google Scholar] [CrossRef] [PubMed]
- Sutoh, C.; Koga, Y.; Kimura, H.; Kanahara, N.; Numata, N.; Hirano, Y.; Matsuzawa, D.; Iyo, M.; Nakazato, M.; Shimizu, E. Repetitive Transcranial Magnetic Stimulation Changes Cerebral Oxygenation on the Left Dorsolateral Prefrontal Cortex in Bulimia Nervosa: A Near-Infrared Spectroscopy Pilot Study. Eur. Eat. Disord. Rev. 2016, 24, 83–88. [Google Scholar] [CrossRef]
- Tomita, N.; Katayama, H.; Kurihara, Y.; Takahashi, T.; Shibata, S.; Mima, T.; Osu, R.; Kumano, H. Tackling social anxiety with targeted brain stimulation: Investigating the effects of transcranial static magnetic field stimulation on self-focused attention. Front. Behav. Neurosci. 2024, 18, 1373564. [Google Scholar] [CrossRef]
- Chen, L.; Du, B.; Li, K.; Li, K.; Hou, T.; Jia, F.; Li, L. The effect of tDCS on inhibitory control and its transfer effect on sustained attention in children with autism spectrum disorder: An fNIRS study. Brain Stimulat. 2024, 17, 594–606. [Google Scholar] [CrossRef]
- Narita, Z.; Noda, T.; Setoyama, S.; Sueyoshi, K.; Inagawa, T.; Sumiyoshi, T. The effect of transcranial direct current stimulation on psychotic symptoms of schizophrenia is associated with oxy-hemoglobin concentrations in the brain as measured by near-infrared spectroscopy: A pilot study. J. Psychiatr. Res. 2018, 103, 5–9. [Google Scholar] [CrossRef]
- Kim, K.; Hwang, H.; Bae, S.; Kim, S.M.; Han, D.H. The effectiveness of a digital app for reduction of clinical symptoms in individuals with panic disorder: Randomized controlled trial. J. Med. Internet Res. 2024, 26, e51428. [Google Scholar] [CrossRef]
- Gao, C.; Li, G.; Wang, Z.; Jiang, Q.; He, R.; Sun, J.; You, Y.; Zhu, Y.; Zhao, J.; Zhang, X.; et al. The therapeutic effects of theta burst stimulation on negative symptoms in chronic schizophrenia using functional near-infrared spectroscopy. J. Psychiatr. Res. 2025, 181, 484–491. [Google Scholar] [CrossRef]
- Zhang, Y.; Li, L.; Bian, Y.; Li, X.; Xiao, Q.; Qiu, M.; Xiang, N.; Xu, F.; Wang, P. Theta-burst stimulation of TMS treatment for anxiety and depression: A FNIRS study. J. Affect. Disord. 2023, 325, 713–720. [Google Scholar] [CrossRef]
- Liao, Y.-Y.; Tseng, H.-Y.; Lin, Y.-J.; Wang, C.-J.; Hsu, W.-C. Using virtual reality-based training to improve cognitive function, instrumental activities of daily living and neural efficiency in older adults with mild cognitive impairment. Eur. J. Phys. Rehabil. Med. 2020, 56, 47–57. [Google Scholar] [CrossRef] [PubMed]
- Metzger, F.G.; Ehlis, A.-C.; Haeussinger, F.B.; Fallgatter, A.J.; Hagen, K. Effects of cholinesterase inhibitor on brain activation in Alzheimer’s patients measured with functional near-infrared spectroscopy. Psychopharmacology 2015, 232, 4383–4391. [Google Scholar] [CrossRef] [PubMed]
- Struckmann, W.; Bodén, R.; Gingnell, M.; Fällmar, D.; Persson, J. Modulation of dorsolateral prefrontal cortex functional connectivity after intermittent theta-burst stimulation in depression: Combining findings from fNIRS and fMRI. Neuroimage Clin. 2022, 34, 103028. [Google Scholar] [CrossRef] [PubMed]
- Deppermann, S.; Vennewald, N.; Diemer, J.; Sickinger, S.; Haeussinger, F.B.; Dresler, T.; Notzon, S.; Laeger, I.; Arolt, V.; Ehlis, A.-C.; et al. Neurobiological and clinical effects of fNIRS-controlled rTMS in patients with panic disorder/agoraphobia during cognitive-behavioural therapy. Neuroimage Clin. 2017, 16, 668–677. [Google Scholar] [CrossRef]
- Barrett, D.W.; Davis, R.E.; Siegel-Ramsay, J.E.; Bichlmeier, A.; Almeida, J.R.C.; Gonzalez-Lima, F. Cognitive improvement and prefrontal network interactions in individuals with remitted bipolar disorder after transcranial infrared laser stimulation. Front. Psychiatry 2025, 16, 1547230. [Google Scholar] [CrossRef]
- Talamonti, D.; Gagnon, C.; Vincent, T.; Nigam, A.; Lesage, F.; Bherer, L.; Fraser, S. Exploring cognitive and brain oxygenation changes over a 1-year period in physically active individuals with mild cognitive impairment: A longitudinal fNIRS pilot study. BMC Geriatr. 2022, 22, 648. [Google Scholar] [CrossRef]
- Huhn, A.S.; Brooner, R.K.; Sweeney, M.M.; Yip, S.W.; Ayaz, H.; Dunn, K.E. Increased neural activity in the right dorsolateral prefrontal cortex during a risky decision-making task is associated with cocaine use in methadone-maintained patients. Drug Alcohol Depend. 2019, 205, 107650. [Google Scholar] [CrossRef]
- Wigal, S.B.; Polzonetti, C.M.; Stehli, A.; Gratton, E. Phase synchronization of oxygenation waves in the frontal areas of children with attention-deficit hyperactivity disorder detected by optical diffusion spectroscopy correlates with medication. J. Biomed. Opt. 2012, 17, 127002. [Google Scholar] [CrossRef]
- Ruocco, A.C.; Rodrigo, A.H.; McMain, S.F.; Page-Gould, E.; Ayaz, H.; Links, P.S. Predicting Treatment Outcomes from Prefrontal Cortex Activation for Self-Harming Patients with Borderline Personality Disorder: A Preliminary Study. Front. Hum. Neurosci. 2016, 10, 220. [Google Scholar] [CrossRef]
- O’Donnell, C.M.; Barrett, D.W.; O’Connor, P.; Gonzalez-Lima, F. Prefrontal photobiomodulation produces beneficial mitochondrial and oxygenation effects in older adults with bipolar disorder. Front. Neurosci. 2023, 17, 1268955. [Google Scholar] [CrossRef]
- Taylor, S.T.; Chhabra, H.; Sreeraj, V.S.; Shivakumar, V.; Kalmady, S.V.; Venkatasubramanian, G. Neural Effects of Transcranial Direct Current Stimulation in Schizophrenia: A Case Study using Functional Near-infrared Spectroscopy. Indian J. Psychol. Med. 2017, 39, 691–694. [Google Scholar] [CrossRef]
- Huhn, A.S.; Sweeney, M.M.; Brooner, R.K.; Kidorf, M.S.; Tompkins, D.A.; Ayaz, H.; Dunn, K.E. Prefrontal cortex response to drug cues, craving, and current depressive symptoms are associated with treatment outcomes in methadone-maintained patients. Neuropsychopharmacology 2019, 44, 826–833. [Google Scholar] [CrossRef]
- Klein, F. Optimizing spatial specificity and signal quality in fNIRS: An overview of potential challenges and possible options for improving the reliability of real-time applications. Front. Neuroergon. 2024, 5, 1286586. [Google Scholar] [CrossRef]

| Variable | Stats/Values | Frequencies (% of Valid) | Graph |
|---|---|---|---|
| Study Design | 1. Descriptive/Exploratory 2. Observational 3. Experimental-RCT 4. Non-RCT 5. Pilot | 3 (6.4%) 10 (21.3%) 15 (31.9%) 11 (23.4%) 8 (17.0%) |  |
| Sample Size | 1. 1 2. 2–20 3. 21–50 4. 51–100 5. >100 | 2 (4.2%) 9 (19.1%) 25 (53.2%) 7 (14.9%) 4 (8.5%) |  |
| Population Characteristics (adults/children) | 1. Adults 2. Children | 44 (93.6%) 3 (6.4%) |  |
| Gender | 1. Mixed 2. Female only 3. Male only | 40 (85.1%) 2 (4.3%) 5 (10.6%) |  |
| Age Category | 1. Children (≤12) 2. Adolescents (13–17) 3. Adults (18–64) 4. Older Adults (≥65) 5. Mixed 6. Not reported | 2 (4.3%) 2 (4.3%) 21 (44.7%) 8 (17.0%) 12 (25.5%) 2 (4.3%) | 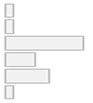 |
| Psychiatric Disorder | 1. Major depressive disorder (MDD) 2. Bipolar disorder (BP) 3. Schizophrenia 4. Anxiety disorders 5. Substance use disorders (SUD) 6. Cognitive impairment 7. Other disorders | 14 (29.8%) 3 (6.4%) 5 (10.6%) 8 (17.0%) 4 (8.5%) 7 (14.9%) 6 (12.8%) |  |
| Methodology | 1. Quantitative 2. Qualitative 3. Mixed methods | 23 (48.9%) 1 (2.1%) 23 (48.9%) |  |
| Intervention/ Treatment Type | 1. rTMS/iTBS 2. tDCS 3. Medication 4. Psychotherapy 5. VR 6. Other 7. Combined | 11 (23.4%) 5 (10.6%) 9 (19.1%) 4 (8.5%) 1 (2.1%) 13 (27.7%) 4 (8.5%) |  |
| Treatment Duration | 1. 1 session 2. >1 session 3. Not reported | 7 (14.9%) 38 (80.9%) 2 (4.3%) |  |
| fNIRS protocol | 1. Task-based 2. Resting-state 3. Mixed | 30 (63.8%) 14 (29.8%) 3 (6.4%) |  |
| Number of fNIRS Channels | 1. ≤8 2. 9–16 3. 17–32 4. >32 | 8 (17%) 7 (14.9%) 8 (17%) 24 (51.1%) |  |
| Workload/task | 1. VFT 2. Cognitive 3. Emotional/recall 4. VR task 5. Rest 6. Motor 7. Other 8. Combined | 14 (29.8%) 6 (12.8%) 5 (10.6%) 2 (4.3%) 11 (23.4%) 1 (2.1%) 1 (2.1%) 7 (14.9%) |  |
| Measurement of Brain Areas/Regions of interest | 1. PFC 2. DLPFC 3. OFC 4. Temporal + STG 5. Parietal 6. Multiple 7. Not specified | 11 (23.4%) 26 (55.3%) 0 (0.0%) 5 (10.6%) 0 (0.0%) 1 (2.1%) 4 (8.5%) | 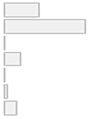 |
| Timepoints Measured | 1. Pre/post 2. Longitudinal/multiple 3. Baseline only 4. Single session 5. Other | 21 (44.7%) 18 (38.3%) 0 (0.0%) 1 (2.1%) 7 (14.9%) |  |
| Key fNIRS Findings | 1. Increased activation 2. Decreased activation 3. No significant change 4. Mixed 5. Not reported | 25 (53.2%) 12 (25.5%) 0 (0.0%) 8 (17.0%) 2 (4.3%) |  |
| Clinical Outcomes | 1. Reported with effect 2. No change 3. Not reported | 41 (87.2%) 3 (6.4%) 3 (6.4%) |  |
| fNIRS—Clinical Link | 1. Yes 2. No 3. Not reported | 39 (83.0%) 6 (12.8%) 2 (4.3%) |  |
| Presentation Software | 1. Standard 2. Custom/programmed 3. None 4. Not reported | 1 (2.1%) 12 (25.5%) 7 (14.9%) 27 (57.4%) |  |
| fNIRS Data Analysis Software | 1. Toolboxes (e.g., HOMER2) 2. General (MATLAB) 3. Manufacturer software 4. Not specified/Other | 13 (27.7%) 8 (17.0%) 19 (40.4%) 7 (14.9%) |  |
| Artefact Removal Procedure | 1. Yes (described) 2. No 3. Not reported | 35 (74.5%) 3 (6.4%) 9 (19.1%) |  |
| fNIRS Equipment | 1. Commercial systems 2. Portable/Wearable 3. Custom-Built 4. Not specified | 39 (83.0%) 4 (8.5%) 2 (4.3%) 2 (4.3%) |  |
| Additional Equipment | 1. Neuroimaging (EEG 2. Other types 3. None 4. Multiple 5. Not reported | 1 (2.1%) 33 (70.2%) 8 (17.0%) 5 (10.6%) 0 (0.0%) | 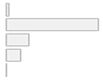 |
| Limitation | Count | Percent |
|---|---|---|
| Small Sample | 32 | 45.07 |
| No Control | 12 | 16.90 |
| Follow Up | 10 | 14.08 |
| Technical | 10 | 14.08 |
| Generalizability | 6 | 8.45 |
| Blinding | 1 | 1.41 |
Disclaimer/Publisher’s Note: The statements, opinions and data contained in all publications are solely those of the individual author(s) and contributor(s) and not of MDPI and/or the editor(s). MDPI and/or the editor(s) disclaim responsibility for any injury to people or property resulting from any ideas, methods, instructions or products referred to in the content. |
© 2025 by the authors. Licensee MDPI, Basel, Switzerland. This article is an open access article distributed under the terms and conditions of the Creative Commons Attribution (CC BY) license (https://creativecommons.org/licenses/by/4.0/).
Share and Cite
Bǎcilǎ, C.-I.; Marcu, G.M.; Vintilă, B.I.; Anghel, C.E.; Lomnasan, A.; Cornea, M.; Grama, A.M. Applications of Functional Near-Infrared Spectroscopy (fNIRS) in Monitoring Treatment Response in Psychiatry: A Scoping Review. J. Clin. Med. 2025, 14, 5197. https://doi.org/10.3390/jcm14155197
Bǎcilǎ C-I, Marcu GM, Vintilă BI, Anghel CE, Lomnasan A, Cornea M, Grama AM. Applications of Functional Near-Infrared Spectroscopy (fNIRS) in Monitoring Treatment Response in Psychiatry: A Scoping Review. Journal of Clinical Medicine. 2025; 14(15):5197. https://doi.org/10.3390/jcm14155197
Chicago/Turabian StyleBǎcilǎ, Ciprian-Ionuț, Gabriela Mariana Marcu, Bogdan Ioan Vintilă, Claudia Elena Anghel, Andrei Lomnasan, Monica Cornea, and Andreea Maria Grama. 2025. "Applications of Functional Near-Infrared Spectroscopy (fNIRS) in Monitoring Treatment Response in Psychiatry: A Scoping Review" Journal of Clinical Medicine 14, no. 15: 5197. https://doi.org/10.3390/jcm14155197
APA StyleBǎcilǎ, C.-I., Marcu, G. M., Vintilă, B. I., Anghel, C. E., Lomnasan, A., Cornea, M., & Grama, A. M. (2025). Applications of Functional Near-Infrared Spectroscopy (fNIRS) in Monitoring Treatment Response in Psychiatry: A Scoping Review. Journal of Clinical Medicine, 14(15), 5197. https://doi.org/10.3390/jcm14155197