
Associations Between Shift Work and Insulin Resistance Markers in 53,053 Spanish Workers: A Sex-Stratified Cross-Sectional Analysis Using TyG, TyG-BMI, METS-IR, and SPISE-IR Indices

 , ,
, ,  , and
, and
Abstract
1. Introduction
2. Materials and Methods
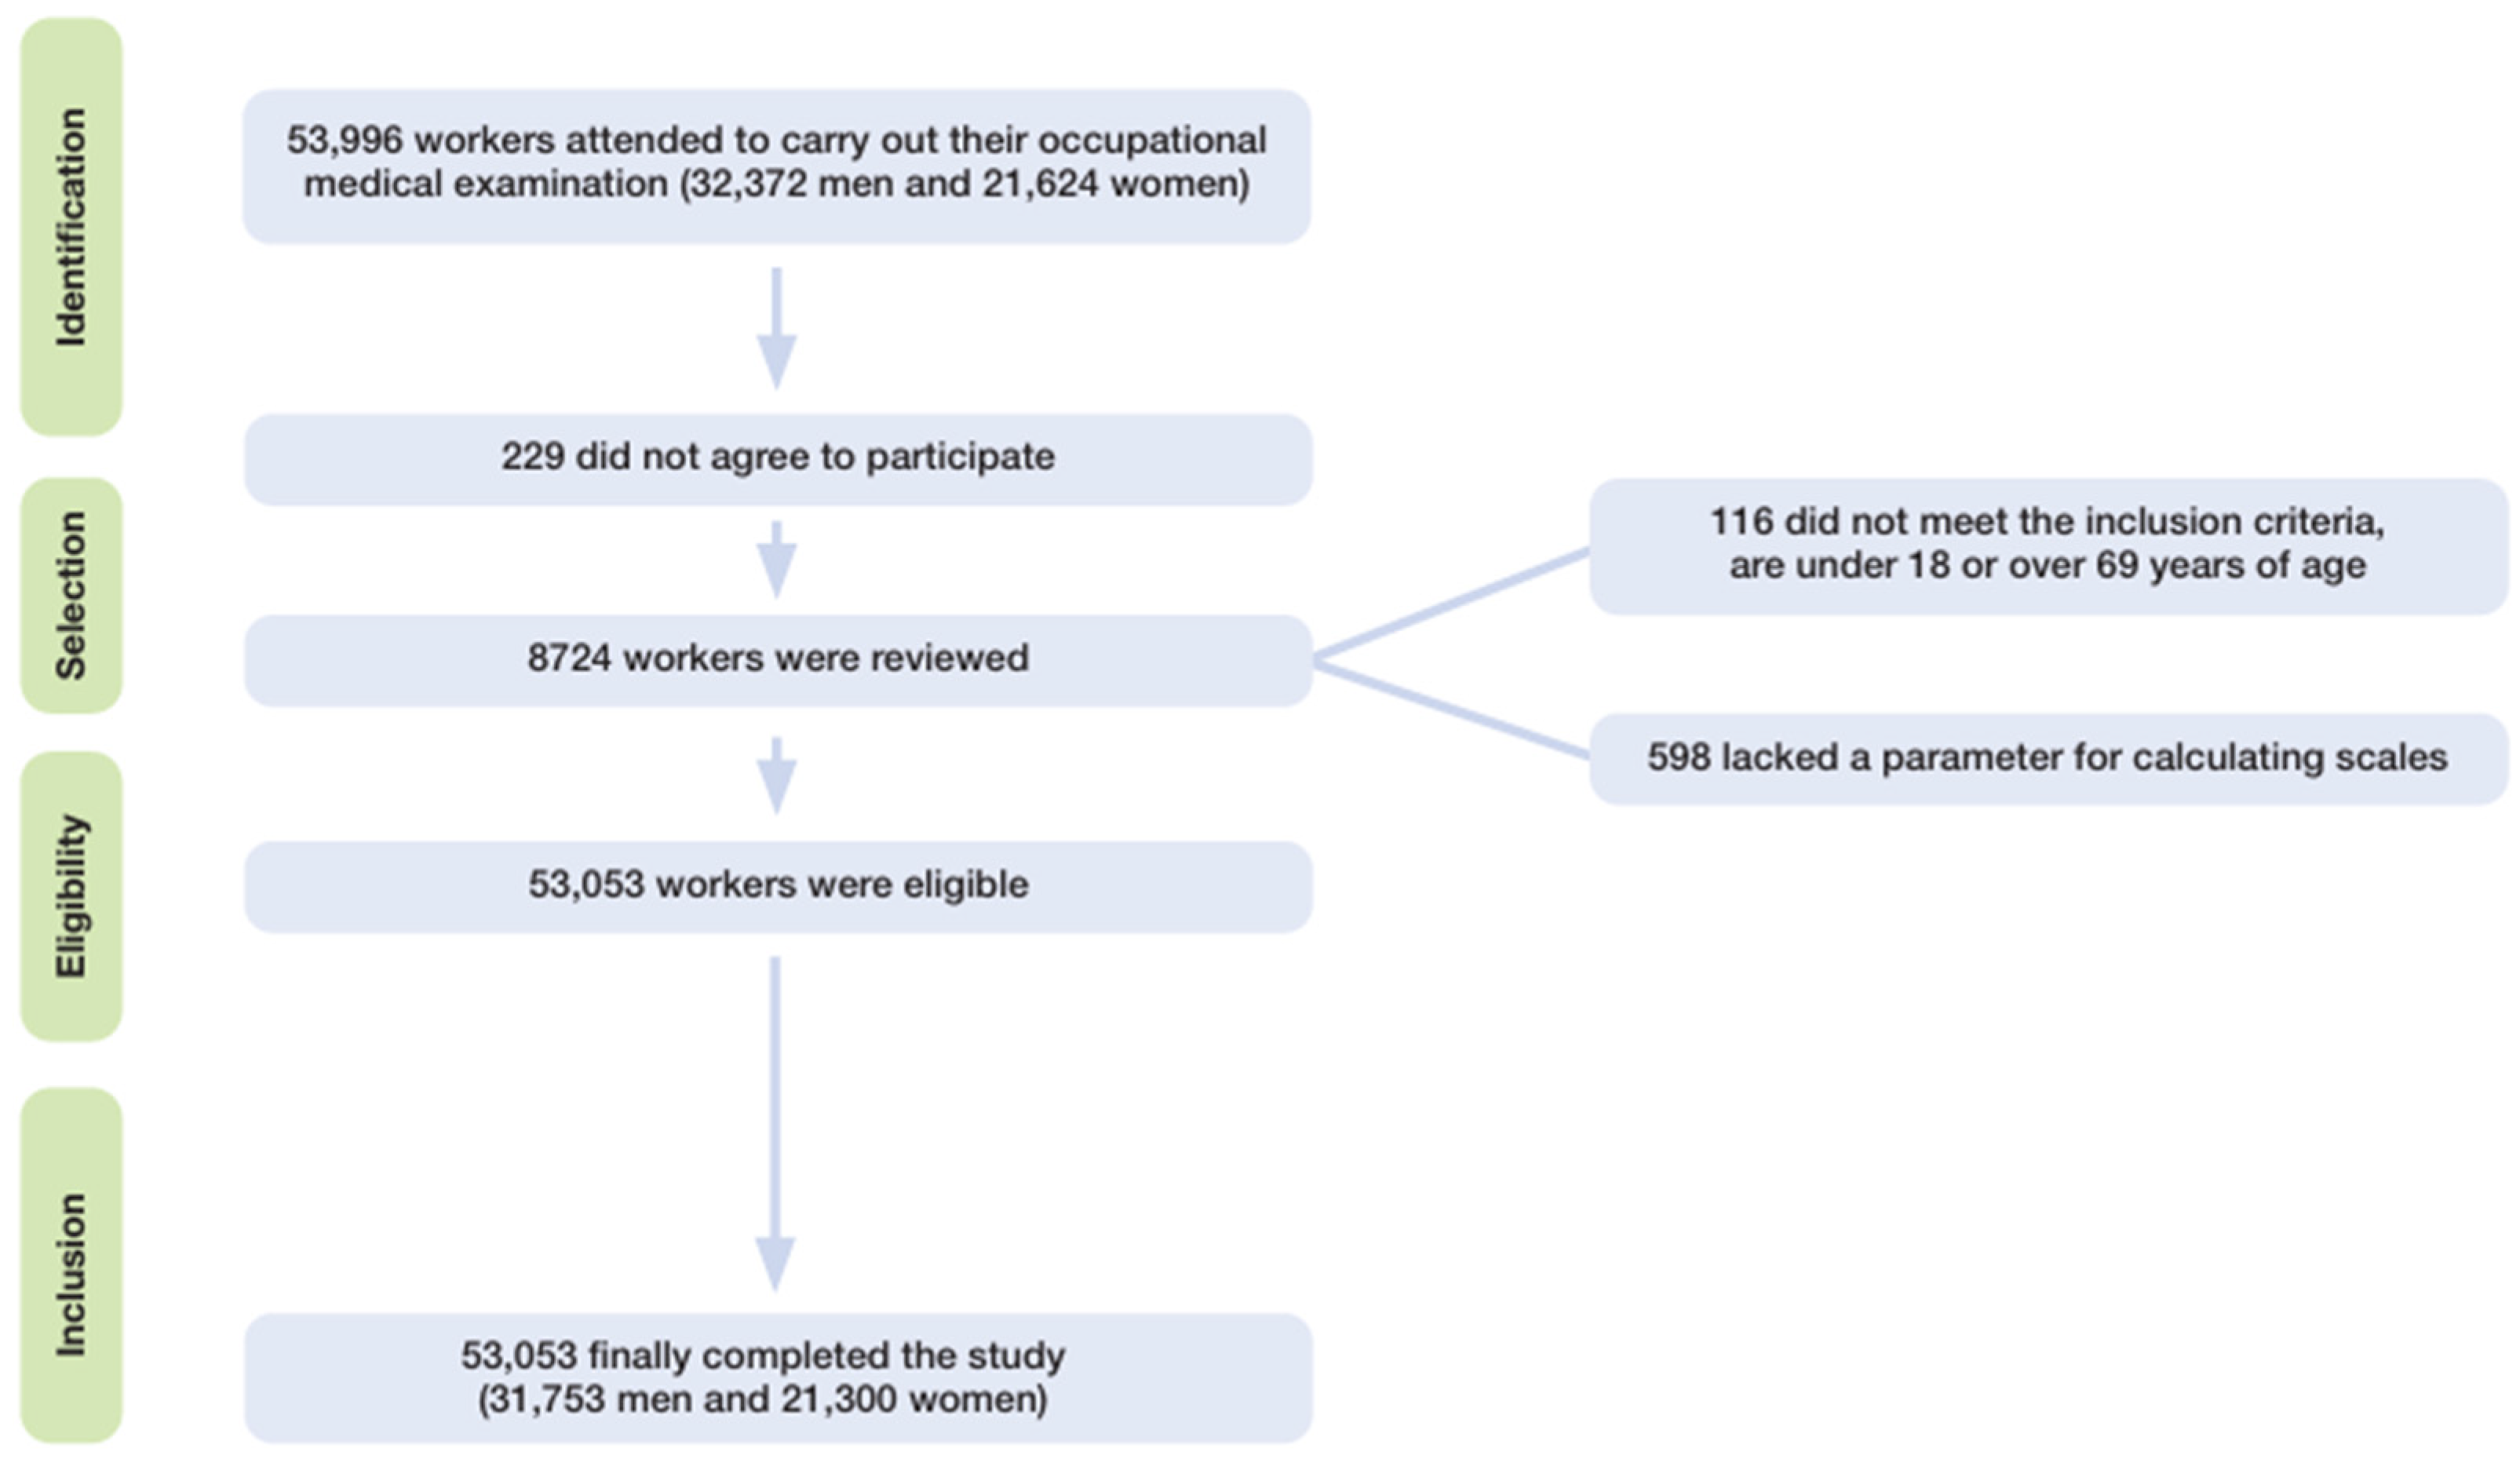
2.1. Study Design and Population
- (1)
- age between 18 and 69 years;
- (2)
- active employment under a formal labor contract with a participating company;
- (3)
- signed informed consent to participate; and
- (4)
- explicit authorization for use of anonymized data for epidemiological purposes.
2.2. Data Collection Procedures
2.3. Anthropometric and Clinical Assessments
2.4. Biochemical Analyses
2.5. Insulin Resistance Risk Scales
- -
- TyG index [31]. TyG = LN (triglycerides × glycaemia/2) is considered high risk at 8.5.
- -
- TyG-BMI [32] TyG-BMI = TyG × BMI is considered high risk at 185.
- -
- Metabolic score for insulin resistance (METS-IR) [33]. METS-IR = Ln(2 × glucose) + triglycerides × BMI)/(Ln(HDL-c). High values are defined as 50 and above.
- -
- Single-Point insulin Sensitivity estimator (SPISE-IR). SPISE = (=600 × HDL0.185/triglycerides 0.2 × BMI1.338). SPISE-IR [34] = 10/SPISE is considered high risk at 1.51.
2.6. Operational Definitions and Variable Classification
- Sex was recorded as male or female.
- Age was calculated from birthdate and date of examination.
- Educational level was categorized as primary (elementary), secondary (high school), or university education.
- Social class classification was based on the Spanish Society of Epidemiology guidelines, using the 2011 National Classification of Occupations (CNO-11) [35], grouping individuals into the following:
- ○
- Class I includes individuals engaged in highly skilled occupations that require a university degree or equivalent, often involving managerial responsibilities or specialized intellectual functions. These roles are characterized by a high level of job autonomy, strategic decision-making, and oversight of human or material resources. This category also encompasses creative professions that demand specific skills not necessarily obtained through formal academic education, such as professional athletes and recognized artists. This group includes professionals, executives, athletes, and artists with higher education.
- ○
- Class II comprises individuals performing occupations that require intermediate technical or professional qualifications, typically obtained through vocational training at the intermediate or advanced level, and in some cases, through short-cycle higher education. This class also includes skilled self-employed workers, such as small business owners or freelancers who do not employ others but carry out complex or specialized tasks. It encompasses technicians, intermediate professions, and qualified self-employed workers.
- ○
- Class III includes both skilled and unskilled manual workers, whose occupations generally do not require higher academic education. These jobs are characterized by physical or repetitive tasks, often performed under direct supervision, with low autonomy, and in settings involving exposure to physical or ergonomic hazards. This group typically faces less job stability and poorer working and health conditions. It includes manual laborers and occupations requiring lower qualifications.
- Smoking status was defined as current smoking or cessation within the past 12 months [36].
- Adherence to the Mediterranean diet was evaluated using a validated 14-item questionnaire. A score ≥ 9 indicated high adherence [37].
- Physical activity levels were self-reported via the short-form International Physical Activity Questionnaire (IPAQ), assessing activity during the previous seven days [38].
- Alcohol intake was quantified in standard drink units (SDUs), where 1 SDU corresponds to 10 g of ethanol. Thresholds for high-risk consumption were >35 SDUs/week in men and >20 SDUs/week in women, consistent with national guidelines [39].
- Shift work was defined as any regular work schedule that deviated from the standard daytime hours (typically 9 am to 5 pm), including rotating shifts, evening shifts, night work, and split shifts [40].
2.7. Statistical Analyses
3. Results
4. Discussion
4.1. Strengths
- Large and diverse sample size: With over 53,000 participants of both sexes across a wide age range and multiple occupational settings, this study has strong statistical power and external validity.
- Comprehensive assessment of IR: We evaluated four validated insulin resistance indices (TyG, TyG-BMI, METS-IR, and SPISE), offering a nuanced and multidimensional view of metabolic health.
- Detailed stratification: Stratified analyses by sex, age, social class, education, and lifestyle allow for exploration of effect modification and high-risk subgroups.
- Real-world data: This study reflects real occupational exposures and behaviors in a Mediterranean country, enhancing relevance for public health policy.
4.2. Limitations
- Cross-sectional design: Causality cannot be established, and reverse causation (e.g., workers with poorer health self-selecting into shift work) cannot be ruled out.
- Another important limitation arises from the use of self-administered questionnaires, as this type of tool is prone to biases such as recall bias and social desirability bias. To enhance the validity of the findings, future research should consider incorporating objective validation methods to complement the self-reported data.
- Unmeasured confounders: Despite extensive adjustment, residual confounding by variables such as sleep quality, chronotype, or work stress may persist.
- Another limitation of this study is that, since it was conducted in a Spanish working population, its applicability to populations with different genetic backgrounds, dietary patterns, or work cultures may be limited.
- No direct insulin measurements: The use of surrogate IR indices, although validated, does not replace direct measurement of insulin sensitivity.
- The inherent heterogeneity of shift work—characterized by varying scheduling patterns—and the absence of stratification in our study represent an additional limitation, as different shift schedules may elicit diverse physiological responses.
- Finally, data on potential confounders—including comorbidities and medication use—were not available and thus could not be included in the analysis.
5. Conclusions
Author Contributions
Funding
Institutional Review Board Statement
Informed Consent Statement
Data Availability Statement
Conflicts of Interest
References
- Wang, X.S.; Armstrong, M.E.; Cairns, B.J.; Key, T.J.; Travis, R.C. Shift work and chronic disease: The epidemiological evidence. Occup. Med. 2011, 61, 78–89. [Google Scholar] [CrossRef] [PubMed] [PubMed Central]
- Kervezee, L.; Kosmadopoulos, A.; Boivin, D.B. Metabolic and cardiovascular consequences of shift work: The role of circadian disruption and sleep disturbances. Eur. J. Neurosci. 2020, 51, 396–412. [Google Scholar] [CrossRef] [PubMed]
- Li, W.; Chen, Z.; Ruan, W.; Yi, G.; Wang, D.; Lu, Z. A meta-analysis of cohort studies including dose-response relationship between shift work and the risk of diabetes mellitus. Eur. J. Epidemiol. 2019, 34, 1013–1024. [Google Scholar] [CrossRef] [PubMed]
- Shan, Z.; Li, Y.; Zong, G.; Guo, Y.; Li, J.; Manson, J.E.; Hu, F.B.; Willett, W.C.; Schernhammer, E.S.; Bhupathiraju, S.N. Rotating night shift work and adherence to unhealthy lifestyle in predicting risk of type 2 diabetes: Results from two large US cohorts of female nurses. BMJ 2018, 363, k4641. [Google Scholar] [CrossRef] [PubMed] [PubMed Central]
- Vetter, C.; Devore, E.E.; Wegrzyn, L.R.; Massa, J.; Speizer, F.E.; Kawachi, I.; Rosner, B.; Stampfer, M.J.; Schernhammer, E.S. Association Between Rotating Night Shift Work and Risk of Coronary Heart Disease Among Women. JAMA 2016, 315, 1726–1734. [Google Scholar] [CrossRef] [PubMed] [PubMed Central]
- Li, M.; Chi, X.; Wang, Y.; Setrerrahmane, S.; Xie, W.; Xu, H. Trends in insulin resistance: Insights into mechanisms and therapeutic strategy. Signal Transduct. Target. Ther. 2022, 7, 216. [Google Scholar] [CrossRef] [PubMed] [PubMed Central]
- Janssen, J.A.M.J.L. Hyperinsulinemia and Its Pivotal Role in Aging, Obesity, Type 2 Diabetes, Cardiovascular Disease and Cancer. Int. J. Mol. Sci. 2021, 22, 7797. [Google Scholar] [CrossRef] [PubMed] [PubMed Central]
- Zhang, A.M.Y.; Wellberg, E.A.; Kopp, J.L.; Johnson, J.D. Hyperinsulinemia in Obesity, Inflammation, and Cancer. Diabetes Metab. J. 2021, 45, 285–311, Erratum in: Diabetes Metab. J. 2021, 45, 622.. [Google Scholar] [CrossRef] [PubMed] [PubMed Central]
- Colagiuri, S. Definition and Classification of Diabetes and Prediabetes and Emerging Data on Phenotypes. Endocrinol. Metab. Clin. N. Am. 2021, 50, 319–336. [Google Scholar] [CrossRef] [PubMed]
- Armandi, A.; Rosso, C.; Caviglia, G.P.; Bugianesi, E. Insulin Resistance across the Spectrum of Nonalcoholic Fatty Liver Disease. Metabolites 2021, 11, 155. [Google Scholar] [CrossRef] [PubMed] [PubMed Central]
- Santoro, A.; McGraw, T.E.; Kahn, B.B. Insulin action in adipocytes, adipose remodeling, and systemic effects. Cell Metab. 2021, 33, 748–757. [Google Scholar] [CrossRef] [PubMed] [PubMed Central]
- Park, S.S.; Seo, Y.K. Excess Accumulation of Lipid Impairs Insulin Sensitivity in Skeletal Muscle. Int. J. Mol. Sci. 2020, 21, 1949. [Google Scholar] [CrossRef] [PubMed] [PubMed Central]
- Dubey, P.; Reddy, S.; Sharma, K.; Johnson, S.; Hardy, G.; Dwivedi, A.K. Polycystic Ovary Syndrome, Insulin Resistance, and Cardiovascular Disease. Curr. Cardiol. Rep. 2024, 26, 483–495. [Google Scholar] [CrossRef] [PubMed]
- Zhao, H.; Zhang, J.; Cheng, X.; Nie, X.; He, B. Insulin resistance in polycystic ovary syndrome across various tissues: An updated review of pathogenesis, evaluation, and treatment. J. Ovarian Res. 2023, 16, 9. [Google Scholar] [CrossRef] [PubMed] [PubMed Central]
- Zhang, P.; Mo, D.; Zeng, W.; Dai, H. Association between triglyceride-glucose related indices and all-cause and cardiovascular mortality among the population with cardiovascular-kidney-metabolic syndrome stage 0–3: A cohort study. Cardiovasc. Diabetol. 2025, 24, 92. [Google Scholar] [CrossRef] [PubMed] [PubMed Central]
- Banks, W.A.; Rhea, E.M. The Blood-Brain Barrier, Oxidative Stress, and Insulin Resistance. Antioxidants 2021, 10, 1695. [Google Scholar] [CrossRef] [PubMed] [PubMed Central]
- Al-Daghri, N.M.; Wani, K.; Khattak, M.N.K.; Alnaami, A.M.; Al-Saleh, Y.; Sabico, S. The single point insulin sensitivity estimator (SPISE) is associated with bone health in Arab adults. Aging Clin. Exp. Res. 2024, 36, 136. [Google Scholar] [CrossRef] [PubMed] [PubMed Central]
- Lin, E.; Yan, Y.T.; Chen, M.H.; Yang, A.C.; Kuo, P.H.; Tsai, S.J. Gene clusters linked to insulin resistance identified in a genome-wide study of the Taiwan Biobank population. Nat. Commun. 2025, 16, 3525. [Google Scholar] [CrossRef] [PubMed] [PubMed Central]
- Bello-Chavolla, O.Y.; Almeda-Valdes, P.; Gomez-Velasco, D.; Viveros-Ruiz, T.; Cruz-Bautista, I.; Romo-Romo, A.; Sánchez-Lázaro, D.; Meza-Oviedo, D.; Vargas-Vázquez, A.; Campos, O.A.; et al. METS-IR, a novel score to evaluate insulin sensitivity, is predictive of visceral adiposity and incident type 2 diabetes. Eur. J. Endocrinol. 2018, 178, 533–544. [Google Scholar] [CrossRef] [PubMed]
- Tantari, G.; Bassi, M.; Pistorio, A.; Minuto, N.; Napoli, F.; Piccolo, G.; La Valle, A.; Spacco, G.; Cervello, C.; D’Annunzio, G.; et al. SPISE INDEX (Single point insulin sensitivity estimator): Indicator of insulin resistance in children and adolescents with overweight and obesity. Front. Endocrinol. 2024, 15, 1439901. [Google Scholar] [CrossRef] [PubMed] [PubMed Central]
- Lee, S.H.; Han, K.; Yang, H.K.; Kim, M.K.; Yoon, K.H.; Kwon, H.S.; Park, Y.M. Identifying subgroups of obesity using the product of triglycerides and glucose: The Korea National Health and Nutrition Examination Survey, 2008–2010. Clin. Endocrinol. (Oxf). 2015, 82, 213–220. [Google Scholar] [CrossRef] [PubMed]
- Cardenas-Juarez, A.; Portales-Pérez, D.P.; Rivas-Santiago, B.; García-Hernández, M.H. Clinical Significance of the Lipid Profile Ratios and Triglyceride Glucose Index in the Diagnosis of Metabolic Syndrome. Metab. Syndr. Relat. Disord. 2024, 22, 510–515. [Google Scholar] [CrossRef] [PubMed]
- Simental-Mendía, L.E.; Rodríguez-Morán, M.; Guerrero-Romero, F. The product of fasting glucose and triglycerides as surrogate for identifying insulin resistance in apparently healthy subjects. Metab. Syndr. Relat. Disord. 2008, 6, 299–304. [Google Scholar] [CrossRef] [PubMed]
- Kautzky-Willer, A.; Harreiter, J.; Pacini, G. Sex and Gender Differences in Risk, Pathophysiology and Complications of Type 2 Diabetes Mellitus. Endocr. Rev. 2016, 37, 278–316. [Google Scholar] [CrossRef] [PubMed] [PubMed Central]
- Mauvais-Jarvis, F. Gender differences in glucose homeostasis and diabetes. Physiol. Behav. 2018, 187, 20–23. [Google Scholar] [CrossRef] [PubMed] [PubMed Central]
- Zhang, W.; Chen, C.; Li, M.; Yan, G.; Tang, C. Sex Differences in the Associations among Insulin Resistance Indexes with Metabolic Syndrome: A Large Cross-Sectional Study. Int. J. Endocrinol. 2024, 2024, 3352531. [Google Scholar] [CrossRef] [PubMed] [PubMed Central]
- Rosa, D.; Terzoni, S.; Dellafiore, F.; Destrebecq, A. Systematic review of shift work and nurses’ health. Occup. Med. 2019, 69, 237–243. [Google Scholar] [CrossRef] [PubMed]
- Choi, S.; Kim, K.; Lee, J.K.; Choi, J.Y.; Shin, A.; Park, S.K.; Kang, D.; Park, S.M. Association between Change in Alcohol Consumption and Metabolic Syndrome: Analysis from the Health Examinees Study. Diabetes Metab. J. 2019, 43, 615–626. [Google Scholar] [CrossRef] [PubMed] [PubMed Central]
- Manzanero, R.Z.; López-González, A.A.; Tomás-Gil, P.; Paublini, H.; Martínez-Jover, A.; Ramírez-Manent, J.I. Determination of cardiometabolic risk scales in 7.962 hotel receptionists. Acad. J. Health Sci. 2024, 39, 113–122. [Google Scholar] [CrossRef]
- Ramírez-Manent, J.I.; Tomás-Gil, P.; Coll-Villalonga, J.L.; Marti-Lliteras, P.; López-González, A.A.; Paublini, H. Influence of sociodemographic variables and tobacco consumption on the prevalence of atherogenic dyslipidemia and lipid triad in 418.343 Spanish workers. Acad. J. Health Sci. 2023, 38, 84–89. [Google Scholar] [CrossRef]
- Ramdas Nayak, V.K.; Satheesh, P.; Shenoy, M.T.; Kalra, S. Triglyceride Glucose (TyG) Index: A surrogate biomarker of insulin resistance. J. Pak. Med. Assoc. 2022, 72, 986–988. [Google Scholar] [CrossRef] [PubMed]
- Vicente-Herrero, M.T.; Egea-Sancho, M.; Ramírez Iñiguez de la Torre, M.V.; López-González, A.A. Visceral Adiposity Index (VAI) and Dysfunctional Adiposity Index (DAI). Relationship with insulin resistance and prediabetes risk. Acad. J. Health Sci. 2024, 39, 25–31. [Google Scholar] [CrossRef]
- Sastre-Alzamora, T.; Tomás-Gil, P.; Paublini, H.; Pallarés, L.; Ramírez-Manent, J.I.; López-González, A.A. Relationship between heart age and insulin resistance risk scales in 139634 Spanish workers. Acad. J. Health Sci. 2024, 39, 16–22. [Google Scholar] [CrossRef]
- Ramírez Gallegos, I.; Marina Arroyo, M.; López-González, Á.A.; Vicente-Herrero, M.T.; Vallejos, D.; Sastre-Alzamora, T.; Ramírez-Manent, J.I. The Effect of a Program to Improve Adherence to the Mediterranean Diet on Cardiometabolic Parameters in 7034 Spanish Workers. Nutrients 2024, 16, 1082. [Google Scholar] [CrossRef] [PubMed] [PubMed Central]
- Domingo-Salvany, A.; Bacigalupe, A.; Carrasco, J.M.; Espelt, A.; Ferrando, J.; Borrell, C.; del Grupo de Determinantes Sociales de la Sociedad Española de Epidemiología. Propuestas de clase social neoweberiana y neomarxista a partir de la Clasificación Nacional de Ocupaciones 2011. Gac. Sanit. 2013, 27, 263–272. [Google Scholar] [CrossRef]
- Aguiló Juanola, M.C.; López-González, A.A.; Tomás-Gil, P.; Paublini, H.; Tárraga-López, P.J.; Ramírez-Manent, J.I. Influence of tobacco consumption and other variables on the values of different cardiovascular risk factors in 418,343 spanish workers. Acad. J. Health Sci. 2024, 39, 89–95. [Google Scholar] [CrossRef]
- Mestre-Font, M.; Busquets-Cortés, C.; Ramírez-Manent, J.I.; Tomás-Gil, P.; Paublini, H.; López-González, A.A. Influence of sociodemographic variables and healthy habits on the values of overweight and obesity scales in 386,924 Spanish workers. Acad. J. Health Sci. 2024, 39, 27–35. [Google Scholar] [CrossRef]
- Sember, V.; Meh, K.; Sorić, M.; Starc, G.; Rocha, P.; Jurak, G. Validity and Reliability of International Physical Activity Questionnaires for Adults across EU Countries: Systematic Review and Meta Analysis. Int. J. Environ. Res. Public Health 2020, 17, 7161. [Google Scholar] [CrossRef] [PubMed] [PubMed Central]
- Obrador de Hevia, J.; López-González, Á.A.; Ramírez-Manent, J.I.; Paublini Oliveira, H.; Tárraga López, P.J.; Riutord-Sbert, P. Relationship between alcohol consumption and other variables with the values of different cardiovascular risk factors in 139634 Spanish workers. Acad. J. Health Sci. 2024, 39, 132–141. [Google Scholar] [CrossRef]
- Tosoratto, J.; Tárraga López, P.J.; López-González, Á.A.; Vallejos, D.; Martínez-Almoyna Rifá, E.; Ramirez-Manent, J.I. Association of Shift Work, Sociodemographic Variables and Healthy Habits with Obesity Scales. Life 2024, 14, 1503. [Google Scholar] [CrossRef] [PubMed] [PubMed Central]
- Puttonen, S.; Härmä, M.; Hublin, C. Shift work and cardiovascular disease—Pathways from circadian stress to morbidity. Scand. J. Work Environ. Health 2010, 36, 96–108. [Google Scholar] [CrossRef] [PubMed]
- Romo-Nava, F.; Guerdjikova, A.I.; Mori, N.N.; Scheer, F.A.J.L.; Burgess, H.J.; McNamara, R.K.; Welge, J.A.; Grilo, C.M.; McElroy, S.L. A matter of time: A systematic scoping review on a potential role of the circadian system in binge eating behavior. Front. Nutr. 2022, 9, 978412. [Google Scholar] [CrossRef] [PubMed] [PubMed Central]
- Bakaloudi, D.R.; Chrysoula, L.; Kotzakioulafi, E.; Theodoridis, X.; Chourdakis, M. Impact of the Level of Adherence to Mediterranean Diet on the Parameters of Metabolic Syndrome: A Systematic Review and Meta-Analysis of Observational Studies. Nutrients 2021, 13, 1514. [Google Scholar] [CrossRef] [PubMed] [PubMed Central]
- Moreno, C.R.C.; Marqueze, E.C.; Sargent, C.; Wright, K.P., Jr.; Ferguson, S.A.; Tucker, P. Working Time Society consensus statements: Evidence-based effects of shift work on physical and mental health. Ind. Health 2019, 57, 139–157. [Google Scholar] [CrossRef] [PubMed] [PubMed Central]
- Siegrist, J.; Li, J. Work Stress and Altered Biomarkers: A Synthesis of Findings Based on the Effort-Reward Imbalance Model. Int. J. Environ. Res. Public Health 2017, 14, 1373. [Google Scholar] [CrossRef] [PubMed] [PubMed Central]
- Abdelmaksoud, A.A.; Salah, N.Y.; Ali, Z.M.; Rashed, H.R.; Abido, A.Y. Disturbed sleep quality and architecture in adolescents with type 1 diabetes mellitus: Relation to glycemic control, vascular complications and insulin sensitivity. Diabetes Res. Clin. Pract. 2021, 174, 108774. [Google Scholar] [CrossRef] [PubMed]
- Speksnijder, E.M.; Bisschop, P.H.; Siegelaar, S.E.; Stenvers, D.J.; Kalsbeek, A. Circadian desynchrony and glucose metabolism. J. Pineal Res. 2024, 76, e12956. [Google Scholar] [CrossRef] [PubMed]
- Oosterman, J.E.; Wopereis, S.; Kalsbeek, A. The Circadian Clock, Shift Work, and Tissue-Specific Insulin Resistance. Endocrinology 2020, 161, bqaa180. [Google Scholar] [CrossRef] [PubMed]
- Tramunt, B.; Smati, S.; Grandgeorge, N.; Lenfant, F.; Arnal, J.F.; Montagner, A.; Gourdy, P. Sex differences in metabolic regulation and diabetes susceptibility. Diabetologia 2020, 63, 453–461. [Google Scholar] [CrossRef] [PubMed] [PubMed Central]
- Mauvais-Jarvis, F.; Bairey Merz, N.; Barnes, P.J.; Brinton, R.D.; Carrero, J.J.; DeMeo, D.L.; De Vries, G.J.; Epperson, C.N.; Govindan, R.; Klein, S.L.; et al. Sex and gender: Modifiers of health, disease, and medicine. Lancet 2020, 396, 565–582, Erratum in: Lancet 2020, 396, 668.. [Google Scholar] [CrossRef] [PubMed] [PubMed Central]
- Merz, K.E.; Thurmond, D.C. Role of Skeletal Muscle in Insulin Resistance and Glucose Uptake. Compr. Physiol. 2020, 10, 785–809. [Google Scholar] [CrossRef] [PubMed] [PubMed Central]
- Papadaki, A.; Nolen-Doerr, E.; Mantzoros, C.S. The Effect of the Mediterranean Diet on Metabolic Health: A Systematic Review and Meta-Analysis of Controlled Trials in Adults. Nutrients 2020, 12, 3342. [Google Scholar] [CrossRef] [PubMed] [PubMed Central]
- Martínez-González, M.Á.; Hershey, M.S.; Zazpe, I.; Trichopoulou, A. Transferability of the Mediterranean Diet to Non-Mediterranean Countries. What Is and What Is Not the Mediterranean Diet. Nutrients 2017, 9, 1226, Erratum in: Nutrients 2018, 10, E823.. [Google Scholar] [CrossRef] [PubMed] [PubMed Central]
- Timsans, J.; Kauppi, J.; Rantalaiho, V.; Kerola, A.; Hakkarainen, K.; Lehto, T.; Kautiainen, H.; Kauppi, M. Serum Uric Acid Is Associated with Insulin Resistance in Non-Diabetic Subjects. J. Clin. Med. 2025, 14, 2621. [Google Scholar] [CrossRef] [PubMed] [PubMed Central]
- Han, T.; Lan, L.; Qu, R.; Xu, Q.; Jiang, R.; Na, L.; Sun, C. Temporal Relationship Between Hyperuricemia and Insulin Resistance and Its Impact on Future Risk of Hypertension. Hypertension 2017, 70, 703–711. [Google Scholar] [CrossRef] [PubMed]
- Hu, X.; Rong, S.; Wang, Q.; Sun, T.; Bao, W.; Chen, L.; Liu, L. Association between plasma uric acid and insulin resistance in type 2 diabetes: A Mendelian randomization analysis. Diabetes Res. Clin. Pract. 2021, 171, 108542. [Google Scholar] [CrossRef] [PubMed]
- Zhu, J.; Sun, L.; Yang, J.; Fan, J.; Tse, L.A.; Li, Y. Genetic Predisposition to Type 2 Diabetes and Insulin Levels Is Positively Associated with Serum Urate Levels. J. Clin. Endocrinol. Metab. 2021, 106, e2547–e2556. [Google Scholar] [CrossRef] [PubMed]
- Oh, S.S.; Kim, W.; Han, K.T.; Park, E.C.; Jang, S.I. Alcohol consumption frequency or alcohol intake per drinking session: Which has a larger impact on the metabolic syndrome and its components? Alcohol 2018, 71, 15–23. [Google Scholar] [CrossRef] [PubMed]
- Stringhini, S.; Carmeli, C.; Jokela, M.; Avendaño, M.; Muennig, P.; Guida, F.; Ricceri, F.; d’Errico, A.; Barros, H.; Bochud, M.; et al. Socioeconomic status and the 25 × 25 risk factors as determinants of premature mortality: A multicohort study and meta-analysis of 1·7 million men and women. Lancet 2017, 389, 1229–1237, Erratum in: Lancet 2017, 389, 1194.. [Google Scholar] [CrossRef] [PubMed] [PubMed Central]
- Powell-Wiley, T.M.; Baumer, Y.; Baah, F.O.; Baez, A.S.; Farmer, N.; Mahlobo, C.T.; Pita, M.A.; Potharaju, K.A.; Tamura, K.; Wallen, G.R. Social Determinants of Cardiovascular Disease. Circ. Res. 2022, 130, 782–799. [Google Scholar] [CrossRef] [PubMed] [PubMed Central]
- Proper, K.I.; van de Langenberg, D.; Rodenburg, W.; Vermeulen, R.C.H.; van der Beek, A.J.; van Steeg, H.; Van Kerkhof, L.W. The Relationship Between Shift Work and Metabolic Risk Factors: A Systematic Review of Longitudinal Studies. Am. J. Prev. Med. 2016, 50, e147–e157. [Google Scholar] [CrossRef] [PubMed]
- Sharma, A.; Laurenti, M.C.; Dalla Man, C.; Varghese, R.T.; Cobelli, C.; Rizza, R.A.; Matveyenko, A.; Vella, A. Glucose metabolism during rotational shift-work in healthcare workers. Diabetologia 2017, 60, 1483–1490. [Google Scholar] [CrossRef] [PubMed] [PubMed Central]
- Schettini, M.A.S.; Passos, R.F.D.N.; Koike, B.D.V. Shift Work and Metabolic Syndrome Updates: A Systematic Review. Sleep Sci. 2023, 16, 237–247. [Google Scholar] [CrossRef] [PubMed] [PubMed Central]
- Tawfik, M.Y.; Amer, S.A.A.M.; Fouad, A.M. Shiftwork and insulin resistance in professional drivers: Exploring the association using non-insulin-based surrogate measures. BMC Public Health 2025, 25, 191. [Google Scholar] [CrossRef] [PubMed] [PubMed Central]
- Working Time Directive. European Commission. Available online: https://employment-social-affairs.ec.europa.eu/policies-and-activities/rights-work/labour-law/working-conditions/working-time-directive_en (accessed on 22 June 2025).
- Demou, E.; MacLean, A.; Cheripelli, L.J.; Hunt, K.; Gray, C.M. Group-based healthy lifestyle workplace interventions for shift workers: A systematic review. Scand. J. Work Environ. Health 2018, 44, 568–584. [Google Scholar] [CrossRef] [PubMed] [PubMed Central]

| Non Shift Work | Shift Work | Non Shift Work | Shift Work | |||
|---|---|---|---|---|---|---|
| Men n = 14,226 | Men n = 17,527 | Women n = 10,019 | Women n = 11,281 | |||
| Mean (SD) | Mean (SD) | p-Value | Mean (SD) | Mean (SD) | p-Value | |
| Age (years) | 41.2 (10.9) | 41.3 (10.5) | 0.089 | 40.0 (10.5) | 40.2 (10.3) | 0.199 |
| Height (cm) | 173.8 (7.1) | 173.7 (7.1) | 0.219 | 161.0 (6.6) | 161.2 (6.6) | 0.015 |
| Weight (kg) | 81.5 (14.6) | 84.5 (14.4) | <0.001 | 63.6 (12.8) | 68.6 (12.8) | <0.001 |
| Waist (cm) | 89.5 (10.5) | 90.8 (10.2) | <0.001 | 74.7 (9.7) | 77.6 (10.9) | <0.001 |
| Systolic BP (mmHg) | 125.3 (15.7) | 126.9 (16.0) | <0.001 | 114.8 (15.5) | 116.1 (15.6) | <0.001 |
| Diastolic BP (mmHg) | 75.9 (10.7) | 77.2 (11.0) | <0.001 | 70.3 (10.6) | 71.6 (10.8) | <0.001 |
| Total cholesterol (mg(dL) | 197.3 (38.4) | 201.2 (38.6) | <0.001 | 192.3 (36.6) | 196.9 (37.3) | <0.001 |
| HDL-cholesterol (mg/dL) | 50.4 (7.8) | 49.7 (7.7) | <0.001 | 55.0 (9.1) | 54.5 (9.2) | <0.001 |
| LDL-cholesterol (mg/dL) | 120.9 (37.3) | 123.8 (37.6) | <0.001 | 119.6 (36.9) | 123.5 (37.5) | <0.001 |
| Triglycerides (mmHg) | 129.3 (93.7) | 136.8 (95.5) | <0.001 | 87.5 (46.8) | 93.6 (51.7) | <0.001 |
| Glucose (mg/dL) | 91.9 (26.4) | 93.3 (26.4) | <0.001 | 86.6 (19.0) | 87.8 (17.6) | <0.001 |
| % | % | p-Value | % | % | p-Value | |
| 18–29 years | 16.4 | 13.8 | <0.001 | 18.6 | 17.5 | 0.135 |
| 30–39 years | 29.3 | 29.8 | 31.0 | 31.3 | ||
| 40–49 years | 29.0 | 31.3 | 29.6 | 30.6 | ||
| 50–59 years | 20.9 | 20.9 | 17.9 | 17.5 | ||
| 60–69 years | 4.4 | 4.2 | 2.9 | 3.1 | ||
| Social class I | 6.8 | 8.2 | <0.001 | 11.6 | 14.6 | <0.001 |
| Social class II | 20.7 | 26.6 | 27.6 | 37.0 | ||
| Social class III | 72.5 | 65.2 | 60.8 | 48.4 | ||
| Elementary school | 69.5 | 63.8 | <0.001 | 53.7 | 43.2 | <0.001 |
| High school | 24.4 | 28.9 | 36.2 | 44.2 | ||
| University | 6.1 | 7.3 | 10.1 | 12.6 | ||
| Non-smokers | 67.9 | 66.0 | <0.001 | 66.3 | 69.1 | <0.001 |
| Smokers | 32.1 | 34.0 | 33.7 | 30.9 | ||
| Non physical activity | 55.2 | 67.9 | <0.001 | 40.8 | 60.7 | <0.001 |
| Yes physical activity | 44.8 | 32.1 | 59.2 | 39.3 | ||
| Non Mediterranean diet | 58.2 | 71.5 | 42.0 | 63.1 | ||
| Yes Mediterranean diet | 41.8 | 28.5 | 58.0 | 36.9 | ||
| Non alcohol consumption | 70.4 | 63.2 | <0.001 | 85.3 | 83.5 | <0.001 |
| Yes alcohol consumption | 29.6 | 36.8 | 14.7 | 16.5 |
| Non Shift Work | Shift Work | |||||||||
|---|---|---|---|---|---|---|---|---|---|---|
| TyG | TyG-BMI | METS-IR | SPISE-IR | TyG | TyG-BMI | METS-IR | SPISE-IR | |||
| Men | n | Mean (SD) | Mean (SD) | Mean (SD) | Mean (SD) | n | Mean (SD) | Mean (SD) | Mean (SD) | Mean (SD) |
| 18–29 years | 2329 | 8.1 (0.5) | 199.7 (37.7) | 36.0 (6.8) | 1.4 (0.4) | 2425 | 8.2 (0.5) | 213.3 (43.8) | 38.5 (8.1) | 1.6 (0.5) |
| 30–39 years | 4174 | 8.4 (0.6) | 218.6 (43.1) | 39.5 (8.0) | 1.6 (0.5) | 5228 | 8.5 (0.6) | 233.8 (46.0) | 42.4 (8.7) | 1.8 (0.5) |
| 40–49 years | 4130 | 8.6 (0.6) | 240.0 (49.1) | 43.7 (9.2) | 1.8 (0.6) | 5477 | 8.7 (0.6) | 247.0 (45.4) | 45.0 (8.6) | 1.9 (0.5) |
| 50–59 years | 2972 | 8.8 (0.6) | 252.5 (47.8) | 46.4 (9.0) | 2.0 (0.5) | 3666 | 8.8 (0.6) | 255.7 (44.4) | 47.0 (8.4) | 2.0 (0.5) |
| 60–69 years | 621 | 8.9 (0.5) | 256.6 (43.2) | 47.3 (8.2) | 2.0 (0.5) | 731 | 8.9 (0.5) | 261.7 (41.5) | 48.2 (8.0) | 2.1 (0.5) |
| Social class I | 972 | 8.4 (0.6) | 225.2 (44.7) | 41.1 (8.6) | 1.7 (0.5) | 1438 | 8.5 (0.6) | 231.1 (41.1) | 42.3 (8.0) | 1.8 (0.5) |
| Social class II | 2942 | 8.5 (0.6) | 230.1 (49.2) | 41.9 (9.2) | 1.8 (0.5) | 4669 | 8.6 (0.6) | 238.9 (43.5) | 43.4 (8.3) | 1.9 (0.5) |
| Social class III | 10,312 | 8.5 (0.7) | 233.5 (48.8) | 42.4 (9.2) | 1.7 (0.5) | 11,420 | 8.6 (0.6) | 242.9 (49.0) | 44.3 (9.3) | 1.9 (0.5) |
| Elementary school | 9874 | 8.6 (0.6) | 238.3 (52.6) | 43.3 (9.8) | 1.8 (0.6) | 11,169 | 8.7 (0.7) | 242.8 (47.1) | 44.1 (8.9) | 1.9 (0.5) |
| High school | 3478 | 8.6 (0.7) | 229.5 (47.6) | 42.0 (9.0) | 1.7 (0.5) | 5070 | 8.7 (0.6) | 240.9 (47.7) | 43.9 (9.1) | 1.9 (0.5) |
| University | 874 | 8.5 (0.6) | 227.5 (44.6) | 41.4 (9.0) | 1.7 (0.5) | 1288 | 8.6 (0.7) | 232.5 (41.0) | 42.6 (8.0) | 1.8 (0.5) |
| Non-smokers | 9656 | 8.4 (0.6) | 219.4 (48.1) | 40.0 (9.2) | 1.6 (0.5) | 11,567 | 8.5 (0.6) | 238.0 (48.6) | 43.6 (9.5) | 1.8 (0.6) |
| Smokers | 4570 | 8.5 (0.7) | 235.7 (48.4) | 42.8 (9.0) | 1.8 (0.5) | 5960 | 8.6 (0.6) | 242.3 (46.2) | 44.0 (8.6) | 1.9 (0.5) |
| Non physical activity | 7851 | 8.8 (0.6) | 259.9 (44.7) | 47.5 (8.4) | 2.0 (0.5) | 11,899 | 8.9 (0.6) | 261.5 (41.6) | 48.8 (7.9) | 2.3 (0.5) |
| Yes physical activity | 6375 | 8.1 (0.4) | 194.1 (21.9) | 35.0 (4.0) | 1.3 (0.2) | 5628 | 8.2 (0.4) | 197.2 (21.3) | 35.6 (3.8) | 1.4 (0.2) |
| Non Mediterranean diet | 8275 | 8.7 (0.6) | 250.5 (46.2) | 46.1 (8.8) | 2.0 (0.5) | 12,536 | 8.8 (0.6) | 258.3 (43.0) | 47.2 (8.3) | 2.2 (0.5) |
| Yes Mediterranean diet | 5951 | 8.0 (0.4) | 194.2 (22.1) | 35.2 (4.1) | 1.3 (0.2) | 4991 | 8.1 (0.4) | 196.9 (21.4) | 35.7 (3.9) | 1.4 (0.2) |
| Non alcohol consumption | 8996 | 8.3 (0.5) | 204.6 (28.9) | 37.1 (5.4) | 1.5 (0.3) | 12,332 | 8.4 (0.5) | 209.5 (40.3) | 39.1 (7.7) | 1.6 (0.4) |
| Yes alcohol consumption | 5230 | 8.9 (0.7) | 275.0 (43.9) | 49.3 (8.4) | 2.0 (0.5) | 5195 | 9.1 (0.7) | 286.5 (44.3) | 53.3 (8.4) | 2.3 (0.5) |
| Non Shift Work | Shift Work | |||||||||
|---|---|---|---|---|---|---|---|---|---|---|
| TyG | TyG-BMI | METS-IR | SPISE-IR | TyG | TyG-BMI | METS-IR | SPISE-IR | |||
| Women | n | Mean (SD) | Mean (SD) | Mean (SD) | Mean (SD) | n | Mean (SD) | Mean (SD) | Mean (SD) | Mean (SD) |
| 18–29 years | 1869 | 7.9 (0.4) | 179.4 (32.8) | 32.0 (5.9) | 1.2 (0.3) | 1975 | 8.0 (0.5) | 200.6 (48.0) | 35.8 (8.7) | 1.4 (0.5) |
| 30–39 years | 3103 | 8.0 (0.5) | 187.9 (39.9) | 33.8 (7.3) | 1.3 (0.4) | 3530 | 8.1 (0.5) | 208.6 (50.3) | 37.5 (9.2) | 1.5 (0.5) |
| 40–49 years | 2965 | 8.1 (0.5) | 206.1 (48.0) | 37.1 (8.7) | 1.5 (0.5) | 3450 | 8.2 (0.8) | 221.3 (49.5) | 39.8 (9.0) | 1.6 (0.5) |
| 50–59 years | 1791 | 8.4 (0.5) | 228.4 (54.1) | 41.3 (9.9) | 1.7 (0.6) | 1974 | 8.5 (0.5) | 237.2 (50.0) | 42.7 (9.2) | 1.8 (0.5) |
| 60–69 years | 291 | 8.5 (0.5) | 241.0 (47.3) | 43.4 (8.5) | 1.8 (0.5) | 352 | 8.6 (0.5) | 246.5 (49.1) | 44.5 (8.9) | 1.9 (0.5) |
| Social class I | 1164 | 8.0 (0.4) | 181.3 (32.4) | 32.2 (6.1) | 1.2 (0.3) | 1644 | 8.1 (0.5) | 198.1 (43.4) | 35.3 (8.0) | 1.4 (0.4) |
| Social class II | 2763 | 8.1 (0.5) | 190.1 (41.1) | 34.1 (7.4) | 1.3 (0.4) | 4175 | 8.1 (0.5) | 209.2 (47.0) | 37.6 (8.6) | 1.5 (0.5) |
| Social class III | 6092 | 8.2 (0.5) | 208.8 (51.1) | 37.6 (9.3) | 1.5 (0.5) | 5462 | 8.3 (0.5) | 229.2 (53.6) | 41.3 (9.7) | 1.7 (0.6) |
| Elementary school | 5377 | 8.1 (0.5) | 208.5 (50.7) | 37.7 (9.2) | 1.5 (0.5) | 4871 | 8.2 (0.5) | 228.6 (52.3) | 41.3 (9.5) | 1.7 (0.5) |
| High school | 3628 | 8.1 (0.5) | 194.1 (45.0) | 34.8 (8.1) | 1.3 (0.4) | 4984 | 8.2 (0.5) | 212.2 (50.1) | 38.1 (9.1) | 1.5 (0.5) |
| University | 1014 | 8.0 (0.4) | 180.4 (30.1) | 31.9 (5.5) | 1.2 (0.3) | 1426 | 8.1 (0.4) | 196.3 (41.6) | 34.9 (7.7) | 1.4 (0.4) |
| Non-smokers | 6638 | 8.1 (0.5) | 195.2 (44.2) | 35.2 (8.0) | 1.3 (0.4) | 7794 | 8.2 (0.5) | 213.6 (49.2) | 38.5 (9.0) | 1.5 (0.5) |
| Smokers | 3381 | 8.1 (0.5) | 203.2 (49.4) | 36.5 (9.0) | 1.4 (0.5) | 3487 | 8.2 (0.5) | 218.9 (52.1) | 39.3 (9.5) | 1.6 (0.5) |
| Non physical activity | 4090 | 8.4 (0.5) | 237.1 (52.4) | 42.9 (9.4) | 1.7 (0.5) | 6842 | 8.5 (0.5) | 253.5 (48.0) | 44.9 (8.7) | 1.9 (0.5) |
| Yes physical activity | 5929 | 7.9 (0.4) | 175.2 (20.2) | 31.3 (3.7) | 1.2 (0.2) | 4439 | 8.1 (0.4) | 176.8 (20.8) | 31.6 (3.8) | 1.2 (0.2) |
| Non Mediterranean diet | 4206 | 8.3 (0.5) | 233.2 (54.6) | 42.0 (9.9) | 1.7 (0.6) | 7115 | 8.5 (0.5) | 240.1 (49.8) | 44.2 (9.1) | 1.9 (0.5) |
| Yes Mediterranean diet | 5813 | 7.9 (0.4) | 176.8 (21.3) | 31.7 (3.9) | 1.2 (0.2) | 4166 | 7.9 (0.4) | 178.3 (21.9) | 31.9 (4.0) | 1.2 (0.2) |
| Non alcohol consumption | 8361 | 8.0 (0.4) | 186.3 (31.5) | 33.5 (5.8) | 1.3 (0.3) | 9619 | 8.1 (0.5) | 189.3 (32.0) | 34.3 (8.2) | 1.5 (0.5) |
| Yes alcohol consumption | 1658 | 8.6 (0.6) | 272.1 (52.0) | 48.9 (9.6) | 2.1 (0.6) | 1662 | 8.9 (0.6) | 295.7 (53.8) | 51.3 (9.9) | 2.6 (0.6) |
| Non Shift Work | Shift Work | |||||||||
|---|---|---|---|---|---|---|---|---|---|---|
| TyG High | TyG-BMI High | METS-IR High | SPISE-IR High | TyG High | TyG-BMI High | METS-IR High | SPISE-IR High | |||
| Men | n | % | % | % | % | n | % | % | % | % |
| 18–29 years | 2329 | 9.0 | 8.1 | 4.6 | 20.4 | 2425 | 12.7 | 16.1 | 9.3 | 34.4 |
| 30–39 years | 4174 | 18.7 | 15.7 | 9.9 | 37.3 | 5228 | 24.7 | 27.0 | 16.7 | 54.9 |
| 40–49 years | 4130 | 35.2 | 32.6 | 21.3 | 59.4 | 5477 | 36.5 | 38.3 | 24.1 | 69.4 |
| 50–59 years | 2972 | 46.5 | 45.0 | 31.3 | 72.4 | 3666 | 49.3 | 47.4 | 32.8 | 77.4 |
| 60–69 years | 621 | 54.8 | 45.9 | 33.5 | 77.8 | 731 | 58.5 | 53.4 | 37.9 | 83.4 |
| Social class I | 972 | 21.6 | 23.1 | 15.7 | 44.5 | 1438 | 25.5 | 24.3 | 16.3 | 55.8 |
| Social class II | 2942 | 29.8 | 26.3 | 17.5 | 50.4 | 4669 | 31.7 | 31.4 | 18.8 | 62.8 |
| Social class III | 10,312 | 31.2 | 29.9 | 19.7 | 51.9 | 11,420 | 33.5 | 36.8 | 24.4 | 63.2 |
| Elementary school | 9874 | 35.9 | 33.4 | 22.6 | 52.8 | 11,169 | 35.9 | 35.2 | 23.0 | 63.7 |
| High school | 3478 | 27.6 | 25.6 | 16.9 | 49.4 | 5070 | 31.5 | 34.5 | 21.9 | 62.5 |
| University | 874 | 23.5 | 24.6 | 16.2 | 47.0 | 1288 | 25.6 | 25.2 | 16.9 | 57.5 |
| Non-smokers | 9656 | 28.3 | 18.2 | 13.5 | 39.2 | 11,567 | 30.6 | 22.8 | 22.0 | 45.8 |
| Smokers | 4570 | 29.7 | 30.9 | 19.9 | 55.2 | 5960 | 35.7 | 35.1 | 22.5 | 63.8 |
| Non physical activity | 7851 | 50.1 | 48.5 | 32.1 | 83.2 | 11,899 | 45.8 | 50.6 | 38.9 | 86.7 |
| Yes physical activity | 6375 | 3.6 | 6.5 | 4.6 | 9.3 | 5628 | 3.9 | 6.9 | 4.9 | 11.1 |
| Non Mediterranean diet | 8275 | 47.4 | 46.0 | 30.6 | 78.8 | 12,536 | 43.4 | 48.0 | 35.6 | 82.7 |
| Yes Mediterranean diet | 5951 | 4.0 | 6.9 | 5.3 | 10.1 | 4991 | 4.5 | 7.3 | 5.7 | 11.7 |
| Non alcohol consumption | 8996 | 13.8 | 13.5 | 15.1 | 12.9 | 12,332 | 14.3 | 15.2 | 16.2 | 14.0 |
| Yes alcohol consumption | 5230 | 45.9 | 49.8 | 54.6 | 65.2 | 5195 | 52.3 | 61.3 | 66.2 | 72.8 |
| Non Shift Work | Shift Work | |||||||||
|---|---|---|---|---|---|---|---|---|---|---|
| TyG High | TyG-BMI High | METS-IR High | SPISE-IR High | TyG High | TyG-BMI High | METS-IR High | SPISE-IR High | |||
| Women | n | % | % | % | % | n | % | % | % | % |
| 18–29 years | 1869 | 4.7 | 2.9 | 1.9 | 7.2 | 1975 | 7.1 | 13.8 | 7.6 | 25.7 |
| 30–39 years | 3103 | 6.9 | 6.5 | 4.5 | 11.7 | 3530 | 9.8 | 17.1 | 10.3 | 30.8 |
| 40–49 years | 2965 | 12.5 | 13.8 | 8.9 | 26.0 | 3450 | 15.2 | 20.3 | 13.0 | 41.5 |
| 50–59 years | 1791 | 24.5 | 25.8 | 17.4 | 45.0 | 1974 | 27.0 | 28.9 | 18.4 | 55.6 |
| 60–69 years | 291 | 40.5 | 33.3 | 23.7 | 61.5 | 352 | 42.9 | 37.5 | 26.7 | 64.8 |
| Social class I | 1164 | 5.6 | 3.5 | 2.3 | 6.2 | 1644 | 9.2 | 10.0 | 5.2 | 23.7 |
| Social class II | 2763 | 10.0 | 7.6 | 5.4 | 12.2 | 4175 | 13.2 | 15.0 | 8.9 | 32.1 |
| Social class III | 6092 | 14.6 | 16.0 | 10.6 | 30.3 | 5462 | 17.9 | 27.2 | 17.6 | 48.0 |
| Elementary school | 5377 | 14.2 | 16.0 | 10.4 | 30.5 | 4871 | 17.6 | 26.4 | 16.7 | 47.9 |
| High school | 3628 | 11.4 | 9.1 | 6.5 | 15.4 | 4984 | 13.9 | 17.4 | 10.8 | 34.3 |
| University | 1014 | 5.4 | 3.1 | 2.2 | 5.5 | 1426 | 9.2 | 8.8 | 4.8 | 22.0 |
| Non-smokers | 6638 | 12.0 | 8.9 | 6.1 | 18.4 | 7794 | 14.8 | 17.0 | 10.6 | 36.3 |
| Smokers | 3381 | 12.4 | 13.9 | 9.2 | 24.6 | 3487 | 15.1 | 21.6 | 13.5 | 39.6 |
| Non physical activity | 4090 | 23.9 | 25.3 | 20.0 | 54.5 | 6842 | 28.6 | 33.3 | 22.9 | 63.3 |
| Yes physical activity | 5929 | 3.6 | 2.8 | 2.6 | 3.8 | 4439 | 4.0 | 3.4 | 2.7 | 4.1 |
| Non Mediterranean diet | 4206 | 22.6 | 29.1 | 19.5 | 51.8 | 7115 | 26.5 | 32.1 | 21.8 | 60.2 |
| Yes Mediterranean diet | 5813 | 4.1 | 3.5 | 3.3 | 4.2 | 4166 | 4.9 | 4.0 | 3.4 | 4.4 |
| Non alcohol consumption | 8361 | 5.8 | 3.2 | 1.7 | 11.0 | 9619 | 9.8 | 13.7 | 7.6 | 31.3 |
| Yes alcohol consumption | 1658 | 34.9 | 38.8 | 28.9 | 44.3 | 1662 | 44.2 | 57.9 | 41.6 | 80.7 |
| TyG High | TyG-BMI High | METS-IR High | SPISE-IR High | |
|---|---|---|---|---|
| OR (95% CI) | OR (95% CI) | OR (95% CI) | OR (95% CI) | |
| Women | 1 | 1 | 1 | 1 |
| Men | 2.34 (2.22–2.47) | 1.48 (1.40–1.56) | 1.31 (1.23–1.39) | 3.54 (3.35–3.74) |
| 18–29 years | 1 | 1 | 1 | 1 |
| 30–39 years | 1.47 (1.32–1.63) | 1.10 (1.06–1.15) | 1.08 (1.05–1.11) | 1.36 (1.27–1.45) |
| 40–49 years | 1.84 (1.65–2.04) | 1.21 (1.16–1.26) | 1.15 (1.10–1.21) | 1.43 (1.33–1.53) |
| 50–59 years | 2.43 (2.17–2.69) | 1.33 (1.26–1.30) | 1.20 (1.16–1.25) | 1.80 (1.65–1.95) |
| 60–69 years | 3.46 (3.03–3.80) | 1.44 (1.37–1.51) | 1.44 (1.36–1.43) | 2.47 (2.11–2.83) |
| Social class I | 1 | 1 | 1 | 1 |
| Social class II | 1.51 (1.41–1.62) | 1.55 (1.46–1.65) | 1.62 (1.49–1.75) | 1.51 (1.39–1.63) |
| Social class III | 1.73 (1.60–1.86) | 1.65 (1.53–1.78) | 1.78 (1.65–1.91) | 1.66 (1.53–1.79) |
| University | 1 | 1 | 1 | 1 |
| High school | 1.80 (1.68–1.92) | 1.43 (1.35–1.52) | 1.55 (1.48–1.62) | 1.38 (1.30–1.47) |
| Elementary school | 1.53 (1.44–1.62) | 1.67 (1.58–1.76) | 1.74 (1.63–1.85) | 1.60 (1.48–1.72) |
| Non-smokers | 1 | 1 | 1 | 1 |
| Smokers | 1.16 (1.12–1.20) | 1.19 (1.15–1.24) | 1.29 (1.22–1.37) | 1.08 (1.05–1.11) |
| Yes physical activity | 1 | 1 | 1 | 1 |
| Non physical activity | 10.51 (9.16–11.90) | 13.93 (12.13–15.73) | 12.81 (11.61–14.03) | 16.30 (14.79–17.82) |
| Yes Mediterranean diet | 1 | 1 | 1 | 1 |
| Non Mediterranean diet | 1.69 (1.53–1.86) | 6.41 (5.50–7.33) | 7.86 (6.90–8.84) | 2.87 (2.61–3.14) |
| Non alcohol consumption | 1 | 1 | 1 | 1 |
| Yes alcohol consumption | 2.45 (2.32–2.58) | 5.81 (5.49–6.14) | 5.56 (5.22–5.90) | 4.62 (4.30–4.95) |
| Non shift work | 1 | 1 | 1 | 1 |
| Yes shift work | 1.89 (1.70–2.09) | 1.71 (1.62–1.80) | 1.49 (1.41–1.58) | 1.83 (1.73–1.94) |
Disclaimer/Publisher’s Note: The statements, opinions and data contained in all publications are solely those of the individual author(s) and contributor(s) and not of MDPI and/or the editor(s). MDPI and/or the editor(s) disclaim responsibility for any injury to people or property resulting from any ideas, methods, instructions or products referred to in the content. |
© 2025 by the authors. Licensee MDPI, Basel, Switzerland. This article is an open access article distributed under the terms and conditions of the Creative Commons Attribution (CC BY) license (https://creativecommons.org/licenses/by/4.0/).
Share and Cite
Tosoratto, J.; Tárraga López, P.J.; López-González, Á.A.; Busquets-Cortes, C.; Obrador de Hevia, J.; Ramirez-Manent, J.I. Associations Between Shift Work and Insulin Resistance Markers in 53,053 Spanish Workers: A Sex-Stratified Cross-Sectional Analysis Using TyG, TyG-BMI, METS-IR, and SPISE-IR Indices. J. Clin. Med. 2025, 14, 4604. https://doi.org/10.3390/jcm14134604
Tosoratto J, Tárraga López PJ, López-González ÁA, Busquets-Cortes C, Obrador de Hevia J, Ramirez-Manent JI. Associations Between Shift Work and Insulin Resistance Markers in 53,053 Spanish Workers: A Sex-Stratified Cross-Sectional Analysis Using TyG, TyG-BMI, METS-IR, and SPISE-IR Indices. Journal of Clinical Medicine. 2025; 14(13):4604. https://doi.org/10.3390/jcm14134604
Chicago/Turabian StyleTosoratto, Javier, Pedro Juan Tárraga López, Ángel Arturo López-González, Carla Busquets-Cortes, Joan Obrador de Hevia, and José Ignacio Ramirez-Manent. 2025. "Associations Between Shift Work and Insulin Resistance Markers in 53,053 Spanish Workers: A Sex-Stratified Cross-Sectional Analysis Using TyG, TyG-BMI, METS-IR, and SPISE-IR Indices" Journal of Clinical Medicine 14, no. 13: 4604. https://doi.org/10.3390/jcm14134604
APA StyleTosoratto, J., Tárraga López, P. J., López-González, Á. A., Busquets-Cortes, C., Obrador de Hevia, J., & Ramirez-Manent, J. I. (2025). Associations Between Shift Work and Insulin Resistance Markers in 53,053 Spanish Workers: A Sex-Stratified Cross-Sectional Analysis Using TyG, TyG-BMI, METS-IR, and SPISE-IR Indices. Journal of Clinical Medicine, 14(13), 4604. https://doi.org/10.3390/jcm14134604