
Nonlinear Associations of Uric Acid and Mitochondrial DNA with Mortality in Critically Ill Patients

 ,
,  ,
,  , , and
Abstract

1. Introduction
2. Materials and Methods
2.1. Design and Study Population
2.2. Data Acquisition and Blood Sampling
2.3. Measurement of mtDNA
2.4. Statistical Analysis
3. Results
4. Discussion
5. Conclusions
Supplementary Materials
Author Contributions
Funding
Institutional Review Board Statement
Informed Consent Statement
Data Availability Statement
Conflicts of Interest
References
- Bone, R.C. Toward an epidemiology and natural history of SIRS (systemic inflammatory response syndrome). JAMA 1992, 268, 3452–3455. [Google Scholar] [CrossRef] [PubMed]
- Seong, S.Y.; Matzinger, P. Hydrophobicity: An ancient damage-associated molecular pattern that initiates innate immune responses. Nat. Rev. Immunol. 2004, 4, 469–478. [Google Scholar] [CrossRef]
- Castellheim, A.; Brekke, O.L.; Espevik, T.; Harboe, M.; Mollnes, T.E. Innate immune responses to danger signals in systemic inflammatory response syndrome and sepsis. Scand. J. Immunol. 2009, 69, 479–491. [Google Scholar] [CrossRef] [PubMed]
- Krychtiuk, K.A.; Ruhittel, S.; Hohensinner, P.J.; Koller, L.; Kaun, C.; Lenz, M.; Bauer, B.; Wutzlhofer, L.; Draxler, D.F.; Maurer, G.; et al. Mitochondrial DNA and Toll-Like Receptor-9 Are Associated With Mortality in Critically Ill Patients. Crit. Care Med. 2015, 43, 2633–2641. [Google Scholar] [CrossRef]
- Nakahira, K.; Kyung, S.Y.; Rogers, A.J.; Gazourian, L.; Youn, S.; Massaro, A.F.; Quintana, C.; Osorio, J.C.; Wang, Z.; Zhao, Y.; et al. Circulating mitochondrial DNA in patients in the ICU as a marker of mortality: Derivation and validation. PLoS Med. 2013, 10, e1001577. [Google Scholar] [CrossRef] [PubMed]
- Gray, M.W.; Burger, G.; Lang, B.F. Mitochondrial evolution. Science 1999, 283, 1476–1481. [Google Scholar] [CrossRef]
- Harrington, J.S.; Huh, J.W.; Schenck, E.J.; Nakahira, K.; Siempos, I.I.; Choi, A.M.K. Circulating Mitochondrial DNA as Predictor of Mortality in Critically Ill Patients: A Systematic Review of Clinical Studies. Chest 2019, 156, 1120–1136. [Google Scholar] [CrossRef]
- Liu, S.; Zhong, Z.; Liu, F. Prognostic value of hyperuricemia for patients with sepsis in the intensive care unit. Sci. Rep. 2022, 12, 1070. [Google Scholar] [CrossRef]
- Hu, Z.; Song, C.; Zhang, J. Serum uric acid level as a prognostic biomarker in critically ill patients with sepsis-associated acute kidney injury: A retrospective single-center study. PLoS ONE 2025, 20, e0321576. [Google Scholar] [CrossRef]
- Alshehri, A.M.; Alrashed, M.; Shawaqfeh, M.; Almutairi, F.; Alanazi, A.; Alfaifi, M.; Albekairy, N.A.; Alshaya, A.; Al Yami, M.S.; Almohammed, O.A.; et al. Impact of Hyperuricemia on Clinical Outcomes in Sepsis Patients: A Retrospective Cohort Study. J. Clin. Med. 2024, 13, 6548. [Google Scholar] [CrossRef]
- Joung, K.W.; Jo, J.Y.; Kim, W.J.; Choi, D.K.; Chin, J.H.; Lee, E.H.; Choi, I.-C. Association of preoperative uric acid and acute kidney injury following cardiovascular surgery. J. Cardiothorac. Vasc. Anesth. 2014, 28, 1440–1447. [Google Scholar] [CrossRef] [PubMed]
- Moguel-González, B.; Wasung-de-Lay, M.; Tella-Vega, P.; Riquelme-Mc-Loughlin, C.; Villa, A.R.; Madero, M.; Gamba, G. Acute kidney injury in cardiac surgery. Rev. Investig. Clin. 2013, 65, 467–475. [Google Scholar]
- Shibata, Y.; Shirakabe, A.; Okazaki, H.; Matsushita, M.; Sawatani, T.; Uchiyama, S.; Tani, K.; Kobayashi, N.; Otsuka, T.; Hata, N.; et al. The prognostic impact of the uric acid level in patients who require cardiovascular intensive care—Is serum uric acid a surrogate biomarker for critical patients in the non-surgical intensive care unit? Eur. Heart J. Acute Cardiovasc. Care 2020, 9, 636–648. [Google Scholar] [CrossRef]
- Lenz, M.; Krychtiuk, K.A.; Goliasch, G.; Distelmaier, K.; Wojta, J.; Heinz, G.; Speidl, W.S. N-terminal pro-brain natriuretic peptide and high-sensitivity troponin T exhibit additive prognostic value for the outcome of critically ill patients. Eur. Heart J. Acute Cardiovasc. Care 2020, 9, 496–503. [Google Scholar] [CrossRef]
- Krychtiuk, K.A.; Lenz, M.; Koller, L.; Honeder, M.C.; Wutzlhofer, L.; Zhang, C.; Chi, L.; Maurer, G.; Niessner, A.; Huber, K.; et al. Monocyte subset distribution is associated with mortality in critically ill patients. Thromb. Haemost. 2016, 116, 949–957. [Google Scholar] [CrossRef]
- Mukaka, M.M. Statistics corner: A guide to appropriate use of correlation coefficient in medical research. Malawi Med. J. 2012, 24, 69–71. [Google Scholar] [PubMed]
- Jiang, Y.X.; Gong, C.L.; Tang, Y.; Yi, Y.; Liu, F.G.; Zhou, J.W.; Shi, Y.-L.; Zhou, H.-W.; Xie, K.-Q. Association between hyperuricemia and acute kidney injury in critically ill patients with sepsis. BMC Nephrol. 2023, 24, 128. [Google Scholar] [CrossRef]
- Lee, H.W.; Choi, S.M.; Lee, J.; Park, Y.S.; Lee, C.H.; Yim, J.J.; Yoo, C.-G.; Kim, Y.W.; Han, S.K.; Lee, S.-M. Serum Uric Acid Level as a Prognostic Marker in Patients With Acute Respiratory Distress Syndrome. J. Intensive Care Med. 2019, 34, 404–410. [Google Scholar] [CrossRef]
- Pehlivanlar-Kucuk, M.; Kucuk, A.O.; Ozturk, C.E.; Er, M.C.; Ulger, F. The Association Between Serum Uric Acid Level and Prognosis in Critically Ill Patients, Uric Acid as a Prognosis Predictor. Clin. Lab. 2018, 64, 1491–1500. [Google Scholar] [CrossRef]
- Cho, S.K.; Chang, Y.; Kim, I.; Ryu, S. U-Shaped Association Between Serum Uric Acid Level and Risk of Mortality: A Cohort Study. Arthritis Rheumatol. 2018, 70, 1122–1132. [Google Scholar] [CrossRef]
- Tseng, W.C.; Chen, Y.T.; Ou, S.M.; Shih, C.J.; Tarng, D.C. U-Shaped Association Between Serum Uric Acid Levels with Cardiovascular and All-Cause Mortality in the Elderly: The Role of Malnourishment. J. Am. Heart Assoc. 2018, 7, e007523. [Google Scholar] [CrossRef] [PubMed]
- Du, L.; Zong, Y.; Li, H.; Wang, Q.; Xie, L.; Yang, B.; Pang, Y.; Zhang, C.; Zhong, Z.; Gao, J. Hyperuricemia and its related diseases: Mechanisms and advances in therapy. Signal Transduct. Target Ther. 2024, 9, 212. [Google Scholar] [CrossRef]
- Braga, T.T.; Forni, M.F.; Correa-Costa, M.; Ramos, R.N.; Barbuto, J.A.; Branco, P.; Castoldi, A.; Hiyane, M.I.; Davanso, M.R.; Latz, E.; et al. Soluble Uric Acid Activates the NLRP3 Inflammasome. Sci. Rep. 2017, 7, 39884. [Google Scholar] [CrossRef]
- Kaczmarek, A.; Vandenabeele, P.; Krysko, D.V. Necroptosis: The release of damage-associated molecular patterns and its physiological relevance. Immunity 2013, 38, 209–223. [Google Scholar] [CrossRef] [PubMed]
- Zhang, M.; Liu, Q.; Meng, H.; Duan, H.; Liu, X.; Wu, J.; Gao, F.; Wang, S.; Tan, R.; Yuan, J. Ischemia-reperfusion injury: Molecular mechanisms and therapeutic targets. Signal Transduct. Target Ther. 2024, 9, 12. [Google Scholar] [CrossRef] [PubMed]
- Murao, A.; Aziz, M.; Wang, H.; Brenner, M.; Wang, P. Release mechanisms of major DAMPs. Apoptosis 2021, 26, 152–162. [Google Scholar] [CrossRef]
- Granger, D.N.; Kvietys, P.R. Reperfusion injury and reactive oxygen species: The evolution of a concept. Redox Biol. 2015, 6, 524–551. [Google Scholar] [CrossRef]
- Rosca, M.G.; Hoppel, C.L. Mitochondrial dysfunction in heart failure. Heart Fail Rev. 2013, 18, 607–622. [Google Scholar] [CrossRef]
- Oka, T.; Hikoso, S.; Yamaguchi, O.; Taneike, M.; Takeda, T.; Tamai, T.; Oyabu, J.; Murakawa, T.; Nakayama, H.; Nishida, K.; et al. Mitochondrial DNA that escapes from autophagy causes inflammation and heart failure. Nature 2012, 485, 251–255. [Google Scholar] [CrossRef]
- Krychtiuk, K.A.; Wurm, R.; Ruhittel, S.; Lenz, M.; Huber, K.; Wojta, J.; Heinz, G.; Hülsmann, M.; Speidl, W.S. Release of mitochondrial DNA is associated with mortality in severe acute heart failure. Eur. Heart J. Acute Cardiovasc. Care 2020, 9, 419–428. [Google Scholar] [CrossRef]
- Lenz, M. 2025. Available online: https://BioRender.com/p2gf84m (accessed on 17 June 2025).


| Total n = 226 (100%) | 30-Day Survivors n = 168 (74.3%) | 30-Day Non-Survivors n = 58 (25.7%) | p-Value | ||
|---|---|---|---|---|---|
| Patient characteristics: | |||||
| Age [years] | 66.30 (55.00–76.30) | 64.88 (53.16–75.79) | 69.52 (59.20–77.52) | 0.257 | |
| Female sex, n (%) | 87 (38.5%) | 66 (39.29%) | 21 (36.21%) | 0.755 | |
| Mechanical ventilation, n (%) | 133 (58.85%) | 89 (52.98%) | 44 (75.86%) | 0.003 | |
| Vasopressors, n (%) | 131 (58.00%) | 85 (50.60%) | 46 (79.31%) | <0.001 | |
| C-reactive protein [mg/dL] Creatinine [mg/dL] | 4.00 (1.19–10.71) 1.19 (0.88–2.06) | 3.50 (0.93–10.67) 1.07 (0.86–1.80) | 4.77 (1.58–13.34) 1.66 (1.16–2.81) | 0.442 <0.001 | |
| Bilirubin [mg/dL] | 0.90 (0.52–1.50) | 0.80 (0.50–1.38) | 1.10 (0.60–1.80) | 0.073 | |
| Arterial pH | 7.36 (7.28–7.47) | 7.38 (7.30–7.47) | 7.28 (7.22–7.44) | 0.002 | |
| Lactate [mmol/L] | 1.90 (1.30–3.30) | 1.8 (1.23–2.78) | 3.0 (1.30–7.60) | 0.001 | |
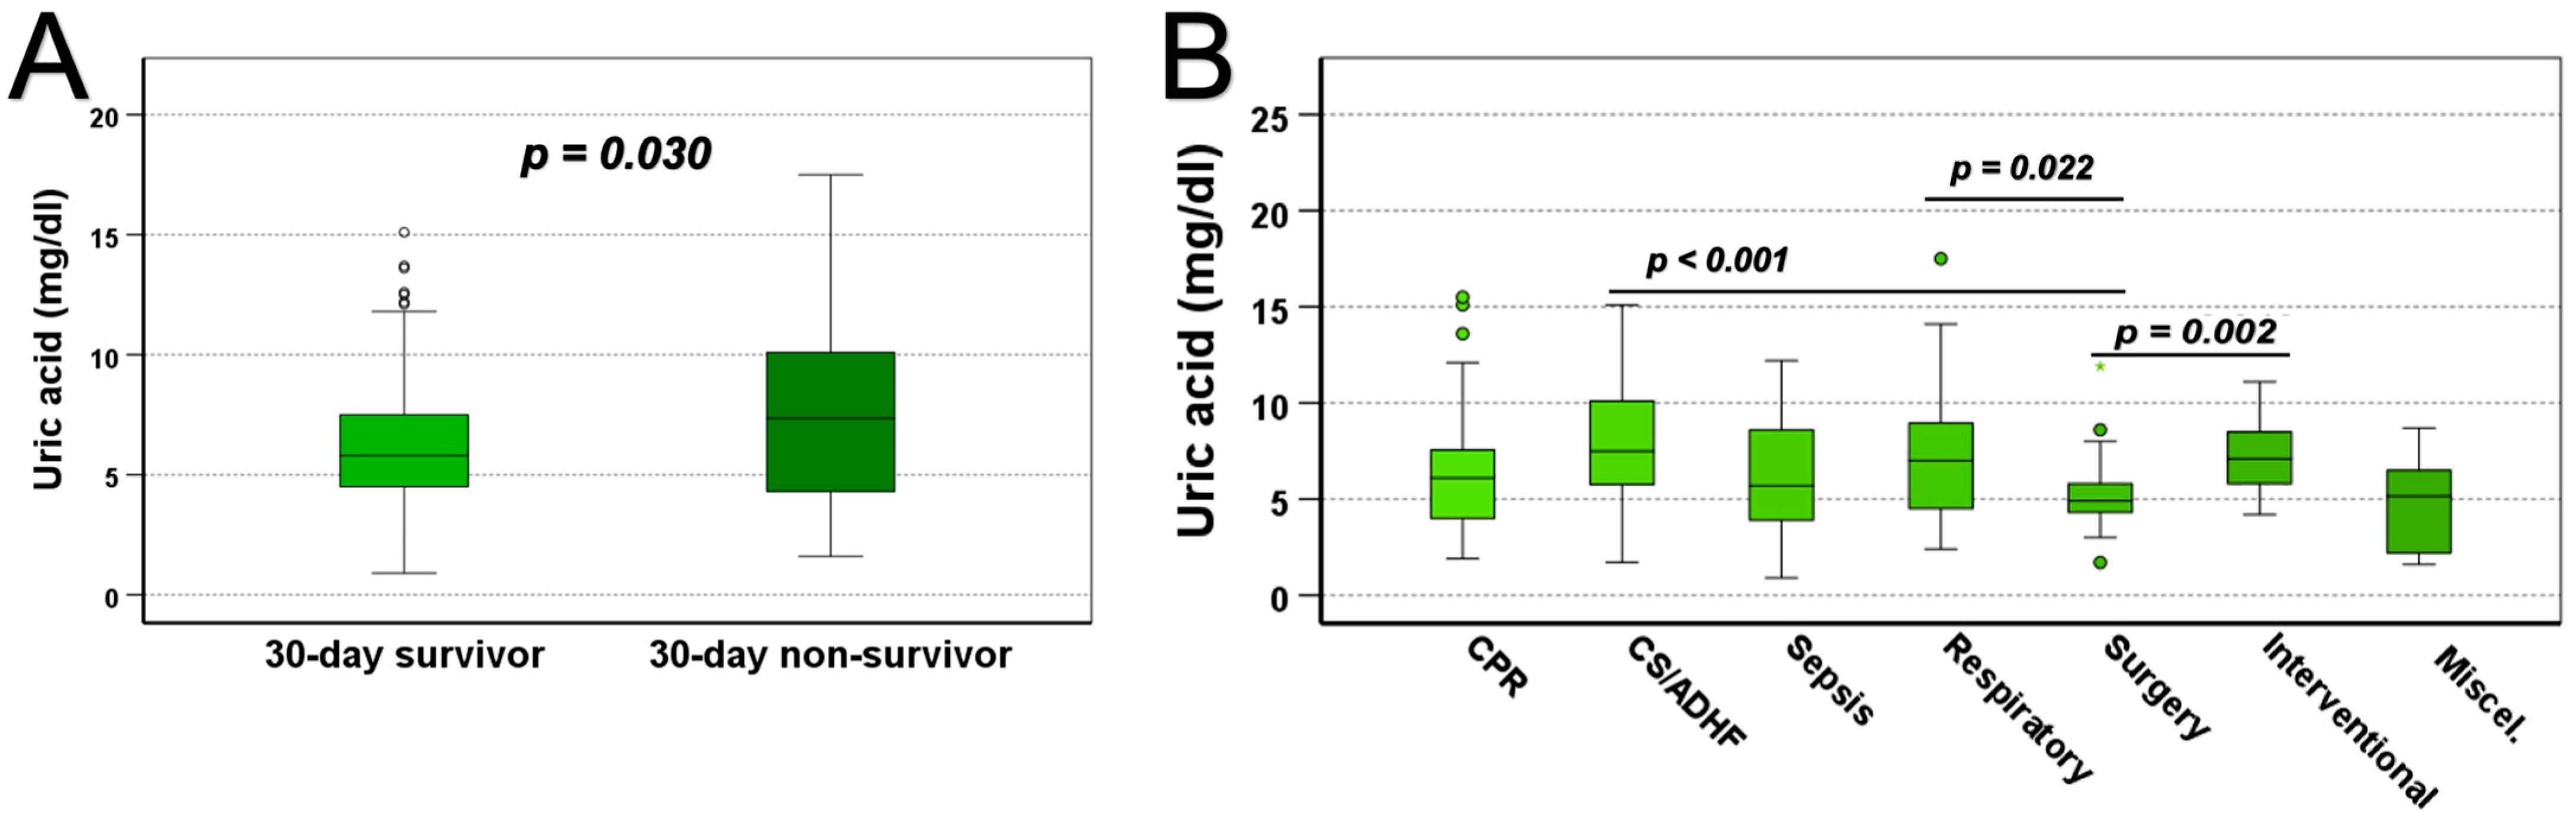
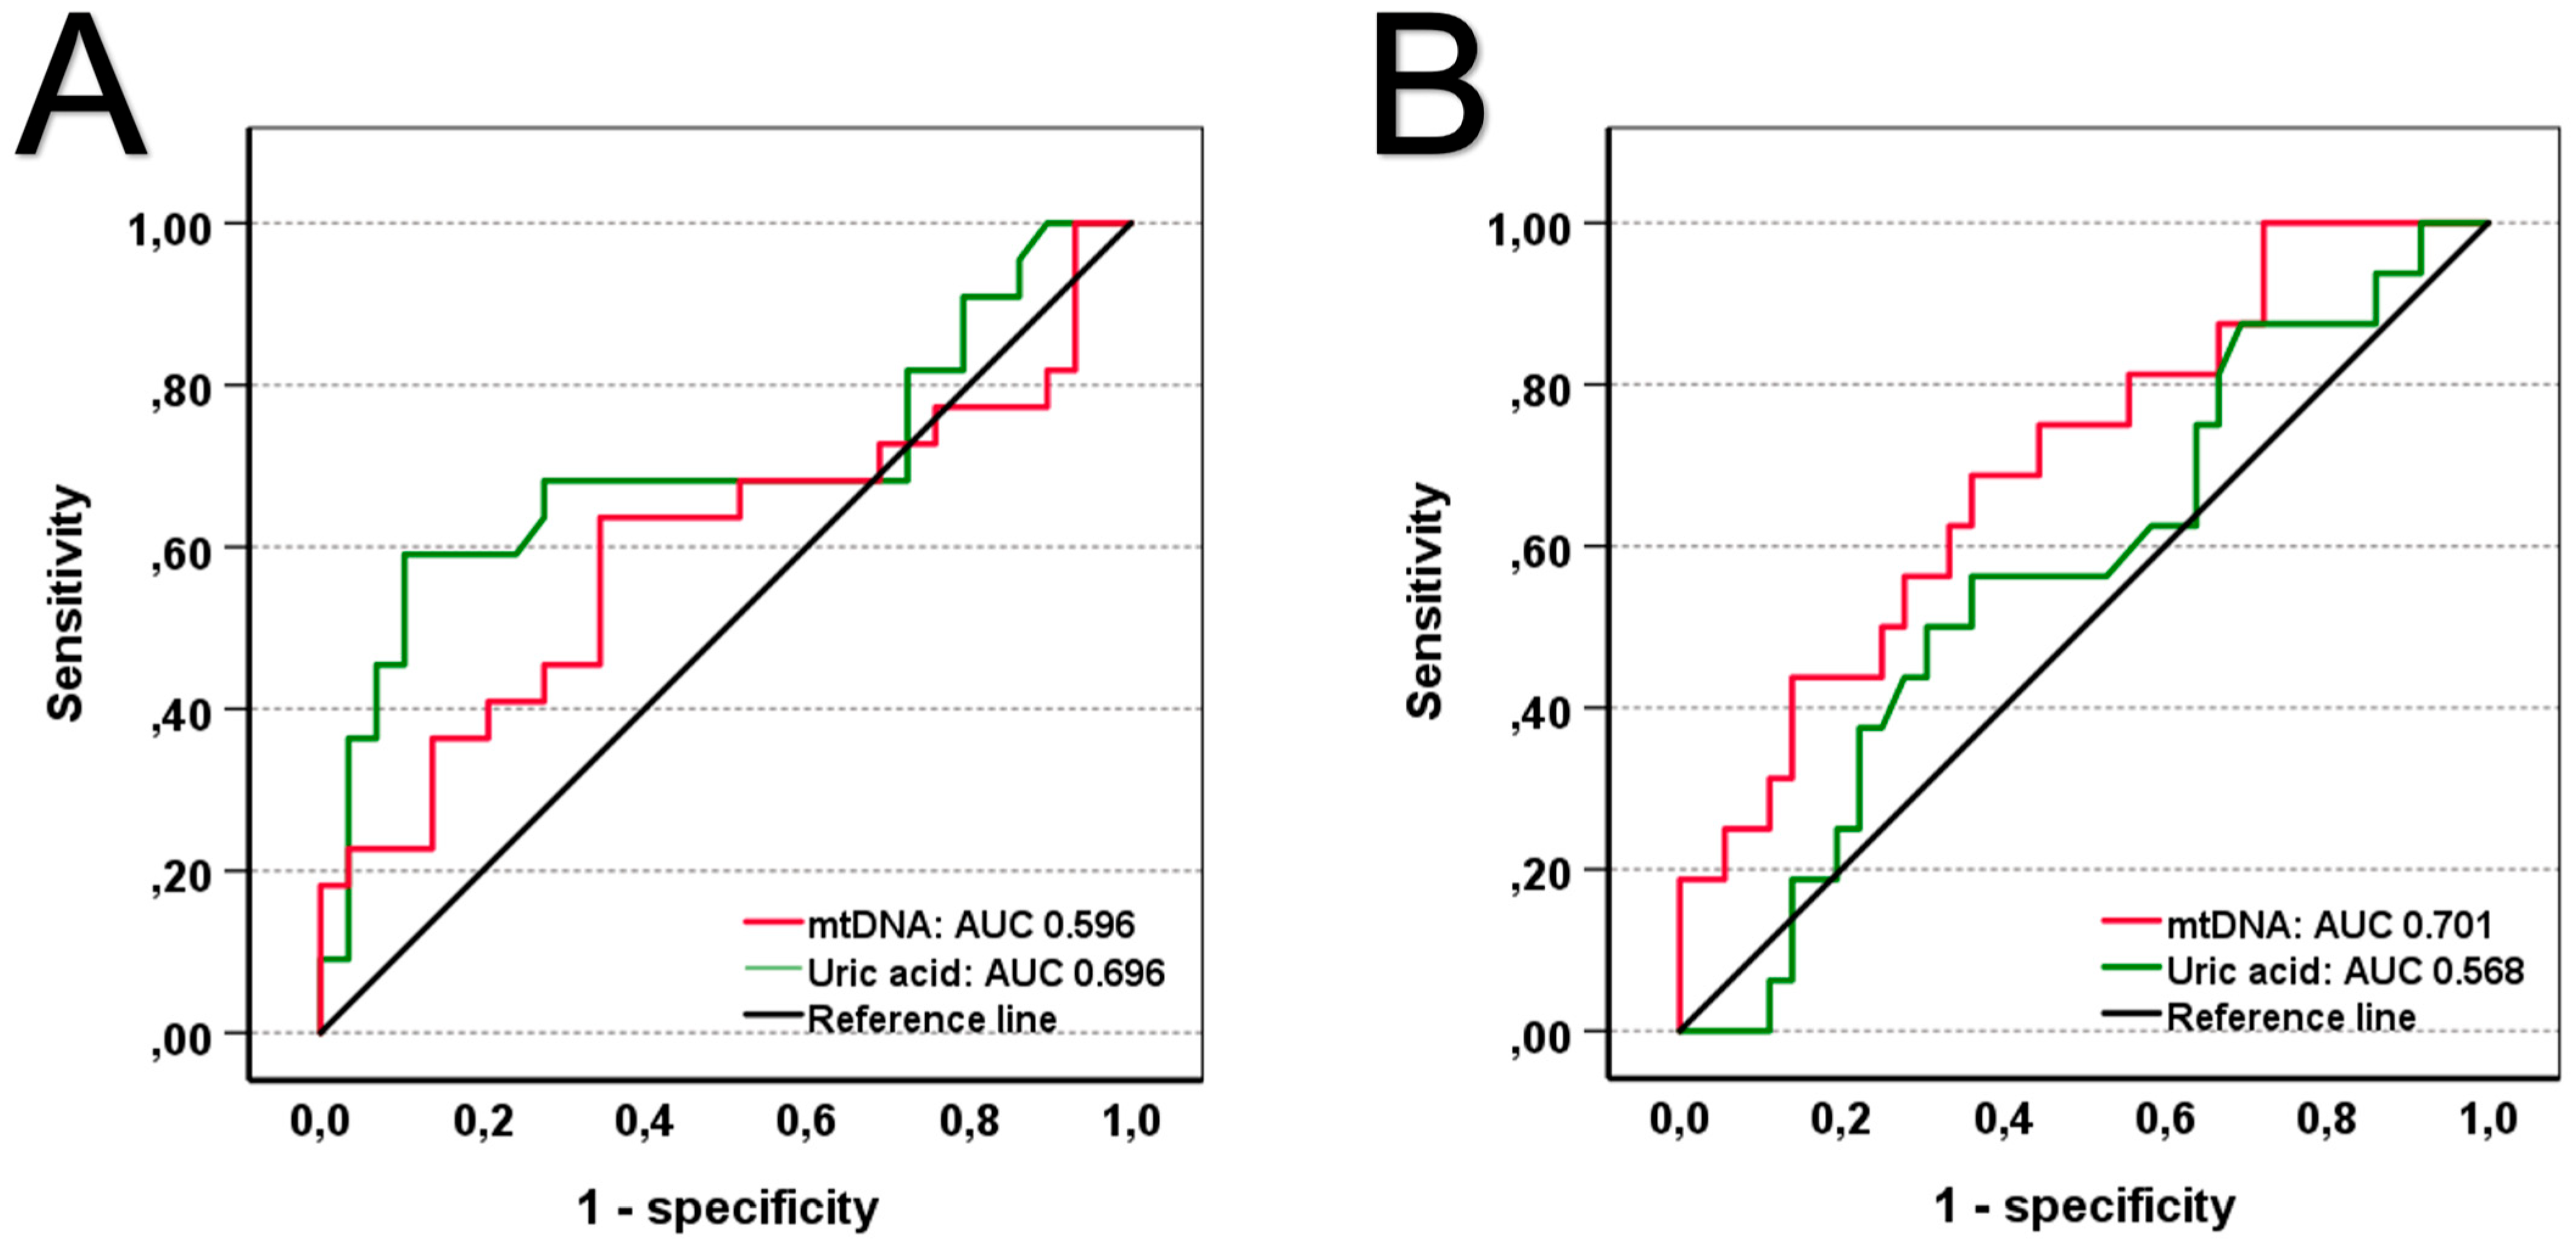
| Uric acid [mg/dL] | 6.10 (4.50–8.25) | 5.80 (4.50–7.50) | 7.20 (4.30–9.95) | 0.030 | |
| mtDNA [ng/mL] | 21.12 (9.63–38.31) | 19.79 (9.49–34.98) | 26.85 (11.17–60.60) | 0.011 | |
| APACHE II score | 20.00 (12.75–25.00) | 16.50 (11.00–23.00) | 27.00 (23.00–31.00) | <0.001 | |
| SAPS II score | 45.00 (31.00–59.00) | 39.00 (29.00–50.75) | 61.00 (47.00–70.00) | <0.001 | |
| SOFA score | 8.00 (5.00–11.00) | 7.00 (5.00–10.00) | 12.00 (9.00–14.00) | <0.001 | |
| Cause of admission: | |||||
| ADHF and cardiog. shock, n (%) | 52 (23.0%) | 36 (21.4%) | 16 (27.6%) | 0.367 | |
| Cardiac arrest, n (%) | 51 (22.6%) | 29 (17.3%) | 22 (37.9%) | <0.001 | |
| Cardiac-surgery, n (%) | 47 (20.8%) | 43 (25.6%) | 4 (6.9%) | 0.002 | |
| Valve intervention, n (%) | 25 (11.0%) | 24 (14.3%) | 1 (1.7%) | 0.007 | |
| Respiratory failure, n (%) | 23 (10.2%) | 16 (9.5%) | 7 (12.1%) | 0.616 | |
| Sepsis/septic shock, n (%) | 22 (9.7%) | 15 (8.9%) | 7 (12.1%) | 0.454 | |
| Other reasons, n (%) | 6 (2.7%) | 5 (3.0%) | 1 (1.7%) | 1.000 | |
| Hazard Ratio | 95% CI | p-Value | ||
|---|---|---|---|---|
| Unadjusted | 0.001 | |||
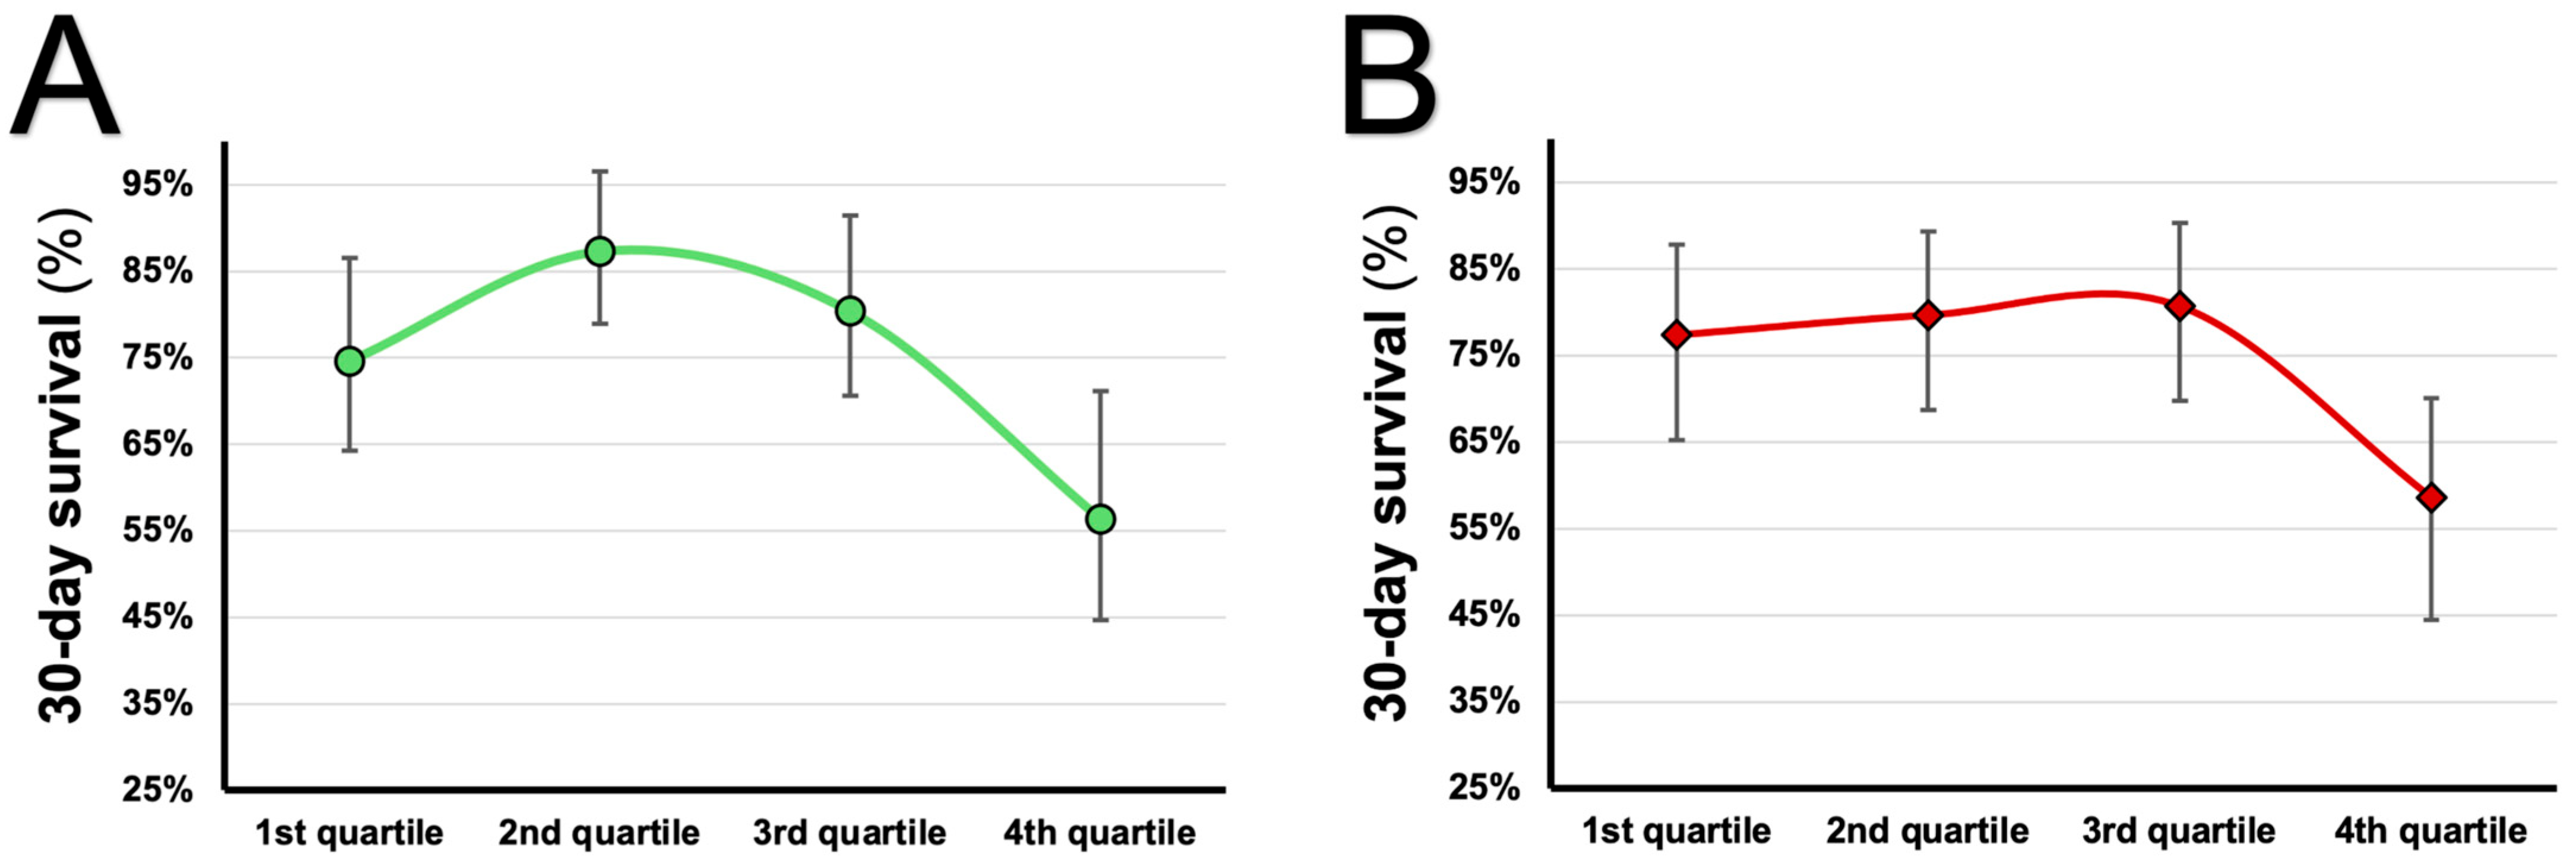
| 1st quartile of uric acid | 1 | - | - | |
| 2nd quartile of uric acid | 0.485 | 0.198–1.191 | 0.114 | |
| 3rd quartile of uric acid | 0.732 | 0.336–1.593 | 0.431 | |
| 4th quartile of uric acid | 2.067 | 1.084–3.944 | 0.027 | |
| Adjusted for sex | 0.001 | |||
| 1st quartile of uric acid | 1 | - | - | |
| 2nd quartile of uric acid | 0.485 | 0.198–1.190 | 0.114 | |
| 3rd quartile of uric acid | 0.727 | 0.331–1.599 | 0.428 | |
| 4th quartile of uric acid | 2.059 | 1.073–3.951 | 0.030 | |
| Sex | 1.013 | 0.771–1.331 | 0.927 | |
| Adjusted for sex and vasopressors | 0.002 | |||
| 1st quartile of uric acid | 1 | - | - | |
| 2nd quartile of uric acid | 0.592 | 0.240–1.464 | 0.257 | |
| 3rd quartile of uric acid | 0.924 | 0.415–2.061 | 0.848 | |
| 4th quartile of uric acid | 2.335 | 1.208–4.512 | 0.012 | |
| Sex | 0.951 | 0.721–1.256 | 0.725 | |
| vasopressors | 2.911 | 1.522–5.566 | 0.001 | |
| Adjusted for sex, vasopressors, and mechanical ventilation | 0.002 | |||
| 1st quartile of uric acid | 1 | - | - | |
| 2nd quartile of uric acid | 0.598 | 0.241–1.482 | 0.267 | |
| 3rd quartile of uric acid | 0.981 | 0.439–2.193 | 0.963 | |
| 4th quartile of uric acid | 2.406 | 1.247–4.641 | 0.009 | |
| Sex | 0.955 | 0.724–1.261 | 0.746 | |
| Vasopressors | 2.166 | 1.039–4.512 | 0.039 | |
| Mechanical ventilation | 1.796 | 0.888–3.635 | 0.103 | |
| Adjusted for sex, vasopressors, mechanical ventilation, and creatinine | 0.001 | |||
| 1st quartile of uric acid | 1 | - | - | |
| 2nd quartile of uric acid | 0.600 | 0.242–1.486 | 0.270 | |
| 3rd quartile of uric acid | 0.990 | 0.442–2.215 | 0.980 | |
| 4th quartile of uric acid | 2.549 | 1.310–4.958 | 0.006 | |
| Sex | 0.929 | 0.703–1.228 | 0.605 | |
| Vasopressors | 2.252 | 1.078–4.705 | 0.031 | |
| Mechanical ventilation | 1.758 | 0.867–3.567 | 0.118 | |
| Creatinine | 0.984 | 0.948–1.022 | 0.410 | |
Disclaimer/Publisher’s Note: The statements, opinions and data contained in all publications are solely those of the individual author(s) and contributor(s) and not of MDPI and/or the editor(s). MDPI and/or the editor(s) disclaim responsibility for any injury to people or property resulting from any ideas, methods, instructions or products referred to in the content. |
© 2025 by the authors. Licensee MDPI, Basel, Switzerland. This article is an open access article distributed under the terms and conditions of the Creative Commons Attribution (CC BY) license (https://creativecommons.org/licenses/by/4.0/).
Share and Cite
Lenz, M.; Zilberszac, R.; Hengstenberg, C.; Wojta, J.; Richter, B.; Heinz, G.; Krychtiuk, K.A.; Speidl, W.S. Nonlinear Associations of Uric Acid and Mitochondrial DNA with Mortality in Critically Ill Patients. J. Clin. Med. 2025, 14, 4455. https://doi.org/10.3390/jcm14134455
Lenz M, Zilberszac R, Hengstenberg C, Wojta J, Richter B, Heinz G, Krychtiuk KA, Speidl WS. Nonlinear Associations of Uric Acid and Mitochondrial DNA with Mortality in Critically Ill Patients. Journal of Clinical Medicine. 2025; 14(13):4455. https://doi.org/10.3390/jcm14134455
Chicago/Turabian StyleLenz, Max, Robert Zilberszac, Christian Hengstenberg, Johann Wojta, Bernhard Richter, Gottfried Heinz, Konstantin A. Krychtiuk, and Walter S. Speidl. 2025. "Nonlinear Associations of Uric Acid and Mitochondrial DNA with Mortality in Critically Ill Patients" Journal of Clinical Medicine 14, no. 13: 4455. https://doi.org/10.3390/jcm14134455
APA StyleLenz, M., Zilberszac, R., Hengstenberg, C., Wojta, J., Richter, B., Heinz, G., Krychtiuk, K. A., & Speidl, W. S. (2025). Nonlinear Associations of Uric Acid and Mitochondrial DNA with Mortality in Critically Ill Patients. Journal of Clinical Medicine, 14(13), 4455. https://doi.org/10.3390/jcm14134455