
Hemorheology in Inflammatory Bowel Disease: A Case–Control Study
 , , , and
Abstract
1. Introduction

| Parameter (Abbreviation) | Measurement (Abbreviation or Symbol, Unit) | Definition | Unfavorable Alteration a |
|---|---|---|---|
| Erythrocyte deformability (ED) | Elongation index (EI, no unit) | Change in the shape of red blood cells at high (from EI30Pa to EI3Pa in this study) and low shear stresses (from EI3Pa to EI0.3Pa in this study) (shown in Figure 1 inlet) | ↓ |
| Erythrocyte aggregation (EA) | Aggregation index (AI, %) | Integral in the change in light intensity 10 s after disaggregation | ↑ |
| Aggregation half-time (t1/2, s) | The time required for achieving half of the maximal aggregation after disaggregation | ↓ | |
| Threshold shear rate (γ, s−1) | Lowest shear that can maintain complete disaggregation | ↑ | |
| Viscosity | Whole blood viscosity (WBV, mPa·s) | An intrinsic property of fluid related to the internal friction of adjacent fluid layers sliding past one another (i.e., the measure of a fluid’s resistance | ↑ |
| Plasma viscosity (PV, mPa·s) | ↑ |

2. Results
3. Discussion
- PV: We found no significant difference between the groups, and the correlation with CDAI was also weak (and it did not explain much of the variance).
- WBV: We found no significant difference between the groups. To our best knowledge, WBV has not been examined in this context before.
- EA: We observed significant prothrombotic alterations of EA-related parameters in IBD and CD. Previous studies measured EA with the Myrenne aggregometer, with a slide test, and with microscopy, while we measured EA with the LORCA, allowing for a more detailed assessment. However, it is important to note that the magnitude of differences between the groups was not substantial, and their clinical implications require further investigations to draw more reliable conclusions regarding their role.
- ED: We found no significant difference between the groups after the Bonferroni adjustment for multiplicity. This finding contradicts an earlier one about activity-dependent prothrombotic changes. However, our study employed a LORCA-based method on varying levels of shear stress, whereas in the previous study, only one level of shear stress was used.
- The role of inflammatory markers: Previous reports have concluded that the inflammatory response and (directly or indirectly) the acute-phase reactants were responsible for the prothrombotic hemorheological changes. Our results support this hypothesis as fibrinogen proved to be the best predictor of the altered EA. Hypothetically, this suggests that the more active the disease, the more pronounced prothrombotic alterations are observed.
4. Materials and Methods
4.1. Design, Setting, and Eligibility
- Blood collection must be indicated with medical conditions.
- Signed informed consent.
- IBD patients: newly diagnosed or follow-up patients (with active or remitting disease) aged ≥18 years (not following a gluten-free diet); the establishment of a diagnosis should meet the current guidelines (European Crohn’s and Colitis Organisation (ECCO) (available online at https://www.ecco-ibd.eu/ accessed on 1 January 2017).
- Non-celiac, non-IBD control subjects: individuals aged ≥18 years (not following a gluten-free diet) in whom celiac disease and IBD can be excluded according to the recent guidelines.
- Chronic conditions:
- Estimated glomerular filtration rate calculated with the Chronic Kidney Disease Epidemiology Collaboration (CKD-EPI) formula is <60 mL/min/1.73 m2 (CKD3 or more severe kidney failure).
- Liver cirrhosis in Child–Pugh B–C.
- Heart failure (New York Heart Association (NYHA) III–IV).
- Active malignant diseases.
- Any acute diseases or invasive procedures within 2 weeks of recruitment (eg, systemic infection, surgery, or major trauma).
- Thrombotic events within 1 year of recruitment.
- Ongoing oral anticoagulant therapy (vitamin K antagonists) and/or antiplatelet drugs.
- Confirmed systemic lupus erythematosus.
- Pregnancy.
- Patients are unable to understand the essentials of informed consent.
4.2. Flow and Timing
4.3. Laboratory Measurements and Disease Activity
4.4. Study Outcomes
4.5. Sample Size, Data, and Analysis
5. Conclusions
Author Contributions
Funding
Institutional Review Board Statement
Informed Consent Statement
Data Availability Statement
Conflicts of Interest
Abbreviations
| CDAI | Crohn’s Disease Activity Index |
| CI | confidence interval |
| EA | erythrocyte aggregation |
| ECCO | European Crohn’s and Colitis Organisation |
| ED | erythrocyte deformability |
| EI | elongation index |
| IBD | inflammatory bowel disease |
| LORCA | Laser-assisted Optical Rotational Cell Analyzer |
| PV | plasma viscosity |
| RR | relative risk |
| UC | ulcerative colitis |
| VTE | venous thromboembolism |
| WBV | whole blood viscosity |
References
- Ramos, G.P.; Papadakis, K.A. Mechanisms of Disease: Inflammatory Bowel Diseases. Mayo Clin. Proc. 2019, 94, 155–165. [Google Scholar] [CrossRef]
- Menichelli, D.; Cormaci, V.M.; Marucci, S.; Franchino, G.; Del Sole, F.; Capozza, A.; Fallarino, A.; Valeriani, E.; Violi, F.; Pignatelli, P.; et al. Risk of venous thromboembolism in autoimmune diseases: A comprehensive review. Autoimmun. Rev. 2023, 22, 103447. [Google Scholar] [CrossRef] [PubMed]
- Fumery, M.; Xiaocang, C.; Dauchet, L.; Gower-Rousseau, C.; Peyrin-Biroulet, L.; Colombel, J.F. Thromboembolic events and cardiovascular mortality in inflammatory bowel diseases: A meta-analysis of observational studies. J. Crohn’s Colitis 2014, 8, 469–479. [Google Scholar] [CrossRef]
- Liu, B.; Qin, Z.; Cai, Z.; Liu, Z.; Chen, Y.L.; Yin, X.; Yin, Y.; Peng, X.; Zhang, B. Evaluating the Causal Association between Inflammatory Bowel Disease and Risk of Atherosclerotic Cardiovascular Disease: Univariable and Multivariable Mendelian Randomization Study. Biomedicines 2023, 11, 2543. [Google Scholar] [CrossRef]
- Bagot, C.N.; Arya, R. Virchow and his triad: A question of attribution. Br. J. Haematol. 2008, 143, 180–190. [Google Scholar] [CrossRef] [PubMed]
- Papa, A.; Santini, P.; De Lucia, S.S.; Maresca, R.; Porfidia, A.; Pignatelli, P.; Gasbarrini, A.; Violi, F.; Pola, R. Gut dysbiosis-related thrombosis in inflammatory bowel disease: Potential disease mechanisms and emerging therapeutic strategies. Thromb. Res. 2023, 232, 77–88. [Google Scholar] [CrossRef] [PubMed]
- Violi, F.; Cammisotto, V.; Bartimoccia, S.; Pignatelli, P.; Carnevale, R.; Nocella, C. Gut-derived low-grade endotoxaemia, atherothrombosis and cardiovascular disease. Nat. Rev. Cardiol. 2023, 20, 24–37. [Google Scholar] [CrossRef]
- Toth, K.; Kesmarky, G.; Alexy, T. Clinical significance of hemorheological alterations. In Handbook of Hemorheology and Hemodynamics; Baskurt, O.K., Hardeman, M.R., Rampling, M.W., Meiselman, H.J., Eds.; IOS Press: Amsterdam, The Netherlands, 2007; Volume 69, pp. 392–432. [Google Scholar]
- Szakács, Z.; Csiszár, B.; Nagy, M.; Farkas, N.; Kenyeres, P.; Erős, A.; Hussain, A.; Márta, K.; Szentesi, A.; Tőkés-Füzesi, M.; et al. Diet-Dependent and Diet-Independent Hemorheological Alterations in Celiac Disease: A Case-Control Study. Clin. Transl. Gastroenterol. 2020, 11, e00256. [Google Scholar] [CrossRef]
- Lobo, A.J.; Jones, S.C.; Juby, L.D.; Axon, A.T. Plasma viscosity in inflammatory bowel disease. J. Clin. Pathol. 1992, 45, 54–57. [Google Scholar] [CrossRef]
- Moran, A.; Jones, A.; Asquith, P. Laboratory markers of colonoscopic activity in ulcerative colitis and Crohn’s colitis. Scand. J. Gastroenterol. 1995, 30, 356–360. [Google Scholar] [CrossRef]
- Novacek, G.; Vogelsang, H.; Genser, D.; Moser, G.; Gangl, A.; Ehringer, H.; Koppensteiner, R. Changes in blood rheology caused by Crohn’s disease. Eur. J. Gastroenterol. Hepatol. 1996, 8, 1089–1093. [Google Scholar] [CrossRef]
- Zilberman, L.; Rogowski, O.; Rozenblat, M.; Shapira, I.; Serov, J.; Halpern, P.; Dotan, I.; Arber, N.; Berliner, S. Inflammation-related erythrocyte aggregation in patients with inflammatory bowel disease. Dig. Dis. Sci. 2005, 50, 677–683. [Google Scholar] [CrossRef]
- Maharshak, N.; Arbel, Y.; Shapira, I.; Berliner, S.; Ben-Ami, R.; Yedgar, S.; Barshtein, G.; Dotan, I. Increased strength of erythrocyte aggregates in blood of patients with inflammatory bowel disease. Inflamm. Bowel Dis. 2009, 15, 707–713. [Google Scholar] [CrossRef]
- Marton, Z.; Kesmarky, G.; Vekasi, J.; Cser, A.; Russai, R.; Horvath, B.; Toth, K. Red blood cell aggregation measurements in whole blood and in fibrinogen solutions by different methods. Clin. Hemorheol. Microcirc. 2001, 24, 75–83. [Google Scholar]
- Akman, T.; Akarsu, M.; Akpinar, H.; Resmi, H.; Taylan, E. Erythrocyte deformability and oxidative stress in inflammatory bowel disease. Dig. Dis. Sci. 2012, 57, 458–464. [Google Scholar] [CrossRef] [PubMed]
- Yakar, T.; Cosar, A.M.; Gokturk, H.S.; Kanat, U.G.; Parlakgumus, A.; Kozanoglu, I.; Serin, E. Plasma viscosity: A potential predictor of both medical treatment response and clinical stage of ulcerative colitis. Ann. Ital. Chir. 2016, 87, 531–543. [Google Scholar] [PubMed]
- Guilbert, C.; Chayer, B.; Allard, L.; Yu, F.T.H.; Cloutier, G. Influence of erythrocyte aggregation on radial migration of platelet-sized spherical particles in shear flow. J. Biomech. 2017, 61, 26–33. [Google Scholar] [CrossRef] [PubMed]
- Ye, T.; Zhang, X.; Li, G.; Wang, S. Biomechanics in thrombus formation from direct cellular simulations. Phys. Rev. E 2020, 102, 042410. [Google Scholar] [CrossRef]
- Stoltz, J.F.; Donner, M. New trends in clinical hemorheology: An introduction to the concept of the hemorheological profile. Schweiz. Med. Wochenschrift. Suppl. 1991, 43, 41–49. [Google Scholar]
- Yu, F.T.; Armstrong, J.K.; Tripette, J.; Meiselman, H.J.; Cloutier, G. A local increase in red blood cell aggregation can trigger deep vein thrombosis: Evidence based on quantitative cellular ultrasound imaging. J. Thromb. Haemost. JTH 2011, 9, 481–488. [Google Scholar] [CrossRef]
- Vayá, A.; Suescun, M. Hemorheological parameters as independent predictors of venous thromboembolism. Clin. Hemorheol. Microcirc. 2013, 53, 131–141. [Google Scholar] [CrossRef] [PubMed]
- Szakács, Z.; Csiszár, B.; Kenyeres, P.; Sarlós, P.; Erőss, B.; Hussain, A.; Nagy, Á.; Kőszegi, B.; Veczák, I.; Farkas, N.; et al. Haemorheological and haemostatic alterations in coeliac disease and inflammatory bowel disease in comparison with non-coeliac, non-IBD subjects (HERMES): A case-control study protocol. BMJ Open 2019, 9, e026315. [Google Scholar] [CrossRef] [PubMed]
- Baskurt, O.K.; Boynard, M.; Cokelet, G.C.; Connes, P.; Cooke, B.M.; Forconi, S.; Liao, F.; Hardeman, M.R.; Jung, F.; Meiselman, H.J.; et al. New guidelines for hemorheological laboratory techniques. Clin. Hemorheol. Microcirc. 2009, 42, 75–97. [Google Scholar] [CrossRef] [PubMed]
- Modigliani, R.; Mary, J.Y.; Simon, J.F.; Cortot, A.; Soule, J.C.; Gendre, J.P.; Rene, E. Clinical, biological, and endoscopic picture of attacks of Crohn’s disease. Evolution on prednisolone. Groupe d’Etude Thérapeutique des Affections Inflammatoires Digestives. Gastroenterology 1990, 98, 811–818. [Google Scholar] [CrossRef]
- Schroeder, K.W.; Tremaine, W.J.; Ilstrup, D.M. Coated oral 5-aminosalicylic acid therapy for mildly to moderately active ulcerative colitis. A randomized study. N. Engl. J. Med. 1987, 317, 1625–1629. [Google Scholar] [CrossRef]
| Variables | Inflammatory Bowel Disease (n = 53) | Crohn’s Disease (n = 38) | Control Group (n = 77) | Inflammatory Bowel Disease vs. Control (p-Value) | Crohn’s Disease vs. Control (p-Value) |
|---|---|---|---|---|---|
| Age at study entry (years) | 30 (18–79) | 30 (18–65) | 44 (19–75) | 0.027 | 0.016 |
| Sex, n (female%) | 26 (49.1) | 19 (50.0) | 56 (72.7) | 0.006 | 0.016 |
| Body mass index (kg/m2) | 24.2 (5.3) | 23.8 (5.4) | 24.4 (3.9) | 0.823 | 0.494 |
| Venous thrombosis in history | 1 (1.9) | 1 (2.6) | 1 (1.3) | N/I | N/I |
| Arterial thrombosis in history | 0 (0.0) | 0 (0.0) | 1 (1.3) | N/I | N/I |
| Family history positive for any thrombosis | 15 (28.3) | 13 (34.2) | 20 (26.0) | 0.769 | 0.358 |
| Ongoing hormone replacement therapy | 0 (0.0) | 0 (0.0) | 1 (1.3) | N/I | N/I |
| Ongoing oral contraceptive use, n (% of females) | 4 (15.4) | 3 (15.8) | 12 (21.4) | 0.765 | 0.747 |
| Current smoker | 12 (22.6) | 12 (31.6) | 9 (11.7) | 0.078 | 0.009 |
| Regular alcohol consumption | 2 (3.8) | 1 (2.6) | 3 (3.9) | N/I | N/I |
| Malignancy in history | 1 (1.9) | 1 (2.6) | 1 (1.3) | N/I | N/I |
| Major trauma, plaster cast in the past 3 months | 0 (0.0) | 0 (0.0) | 1 (1.3) | N/I | N/I |
| Immobilization (>3 days bedrest) | 0 (0.0) | 0 (0.0) | 1 (1.3) | N/I | N/I |
| Traveling a long distance (>6 h in sitting position) | 4 (7.6) | 2 (5.2) | 5 (6.5) | N/I | N/I |
| Any varicose veins | 11 (20.8) | 8 (21.1) | 16 (20.8) | 1.000 | 1.000 |
| Peripheral arterial disease in history | 1 (1.9) | 1 (2.6) | 2 (2.6) | N/I | N/I |
| Surgery in the past 2 weeks | 4 (7.6) | 3 (7.9) | 10 (13.0) | 0.398 | 0.540 |
| Stroke or acute myocardial infarction in history | 0 (0.0) | 0 (0.0) | 0 (0.0) | N/I | N/I |
| Hypertension in history | 6 (11.3) | 2 (5.2) | 18 (23.4) | 0.082 | 0.018 |
| Diabetes mellitus in history | 2 (3.8) | 0 (0.0) | 7 (9.1) | 0.309 | 0.094 |
| Lipid metabolism disorder in history | 6 (11.3) | 2 (5.2) | 21 (27.3) | 0.028 | 0.006 |
| Variables | Inflammatory Bowel Disease (n = 53) | Crohn’s Disease (n = 38) | Control Group (n = 77) | Inflammatory Bowel Disease vs. Control (p-Value) | Crohn’s Disease vs. Control (p-Value) |
|---|---|---|---|---|---|
| Blood urea nitrogen (mmol/L) | 4.2 (1.3) | 4.0 (1.1) | 4.6 (1.3) | 0.126 | 0.036 |
| Creatinine (μmol/L) | 79.0 (22.3) | 76.6 (16.2) | 73.9 (13.7) | 0.109 | 0.349 |
| Aspartate aminotransferase (U/L) | 23 (10) | 23 (10) | 24 (21) | 0.836 | 0.815 |
| Alanine aminotransferase (U/L) | 25 (22) | 24 (23) | 24 (27) | 0.885 | 0.936 |
| Alkaline phosphatase (U/L) | 86 (40) | 85 (38) | 68 (17) | <0.001 | <0.001 |
| γ-glutamyl carboxylase (U/L) | 36 (74) | 27 (28) | 25 (29) | 0.241 | 0.667 |
| Bilirubin (umol/L) | 9.1 (5.9) | 9.4 (6.5) | 10.4 (8.1) | 0.340 | 0.517 |
| High-density lipoprotein cholesterol (mmol/L) | 1.5 (0.5) | 1.5 (0.5) | 1.7 (0.5) | 0.019 | 0.038 |
| Non-high-density lipoprotein cholesterol (mmol/L) | 3.1 (1.1) | 2.8(0.8) | 3.5 (1.1) | 0.069 | 0.001 |
| Low-density lipoprotein cholesterol (mmol/L) | 3.0 (1.1) | 2.7 (0.9) | 3.5 (1.1) | 0.019 | <0.001 |
| Triglyceride (mmol/L) | 1.5 (1.3) | 1.5 (0.8) | 1.7 (1.2) | 0.455 | 0.349 |
| Total protein (g/L) | 75.5 (5.3) | 74.7 (5.2) | 75.1 (4.3) | 0.692 | 0.667 |
| Albumin (g/L) | 47.8 (3.4) | 47.5 (3.8) | 49.3 (3.4) | 0.017 | 0.019 |
| Ultrasensitive C-reactive protein (mg/L) | 8.1 (15.5) | 9.3 (17.9) | 2.2 (2.4) | 0.001 | <0.001 |
| Prothrombin time (s) | 11.6 (1.2) | 11.4 (1.0) | 11.2 (0.7) | 0.032 | 0.118 |
| Thrombin time (s) | 14.0 (1.0) | 13.9 (1.1) | 14.2 (1.0) | 0.152 | 0.088 |
| Activated partial thromboplastin time (s) | 30.9 (4.6) | 31.0 (5.0) | 29.5 (6.4) | 0.174 | 0.193 |
| Fibrinogen (g/L) | 3.6 (1.1) | 3.6 (1.2) | 3.1 (0.6) | 0.002 | 0.004 |
| White blood cell (G/L) | 8.2 (5.4) | 8.6 (6.1) | 6.8 (1.9) | 0.038 | 0.019 |
| Neutrophil granulocyte (G/L) | 5.7 (5.2) | 6.2 (6.0) | 4.0 (1.5) | 0.009 | 0.003 |
| Hemoglobin (g/L) | 136 (17) | 138 (18) | 143 (13) | 0.008 | 0.081 |
| Hematocrit (%) | 39.8 (4.3) | 40.2 (4.7) | 41.5 (3.5) | 0.014 | 0.097 |
| Mean corpuscular volume (fL) | 86 (8) | 88 (8) | 85 (4) | 0.364 | 0.064 |
| Platelet (G/L) | 321 (115) | 308 (123) | 276 (66) | 0.006 | 0.069 |
| Erythrocyte sedimentation rate (mm/h) | 13 (11) | 13 (12) | 6 (5) | <0.001 | <0.001 |
| Variables | IBD Patients (n = 53) | Crohn’s Disease (n = 38) | Control Subjects (n = 77) | IBD vs. Control (p-Value) | Crohn’s Disease vs. Control (p-Value) |
|---|---|---|---|---|---|
| Plasma viscosity (mPa·s) | 1.31 (0.18) | 1.31 (0.20) | 1.27 (0.13) | 0.141 | 0.180 |
| Whole blood viscosity (mPa·s) | 4.11 (0.53) | 4.14 (0.59) | 4.11 (0.45) | 0.958 | 0.779 |
| Hematocrit (%) | 42.6 (4.5) | 43.0 (5.0) | 44.2 (3.4) | 0.023 | 0.112 |
| Aggregation index (%) | 68.8 (35.3–83.5) | 66.9 (35.2–83.5) | 66.1 (47.1–75.8) | 0.003 | 0.048 |
| Aggregation half-time (s) | 1.6 (0.6–7.1) | 1.8 (0.6–7.1) | 1.8 (1.1–4.5) | 0.004 | 0.059 |
| Threshold shear rate (s−1) | 120 (55–325) | 110 (55–325) | 100 (50–192.5) | <0.001 | 0.007 |
| Aggregation Index | Aggregation Half-Time | Threshold Shear Rate | ||||
|---|---|---|---|---|---|---|
| Coeff | p-Value | Coeff | p-Value | Coeff | p-Value | |
| Model A | ||||||
| IBD vs. control | 4.0 | 0.004 | −0.3 | 0.068 | 37.1 | <0.001 |
| Age | 0.1 | 0.119 | −0.01 | 0.210 | 0.4 | 0.098 |
| Sex | 0.7 | 0.635 | −0.03 | 0.846 | 19.7 | 0.012 |
| Model B | ||||||
| IBD vs. control | 1.8 | 0.101 | −0.2 | 0.264 | 0.2 | 0.963 |
| Age | 0.1 | 0.082 | −0.01 | 0.179 | 0.1 | 0.414 |
| Sex | 0.7 | 0.643 | −0.1 | 0.473 | −8.5 | 0.229 |
| Creatinine | −0.02 | 0.515 | 0.00 | 0.487 | −0.01 | 0.912 |
| Bilirubin | −0.1 | 0.029 | 0.02 | 0.003 | −0.21 | 0.441 |
| Non-high-density lipoprotein cholesterol | 0.4 | 0.374 | −0.05 | 0.324 | 1.1 | 0.571 |
| Total protein | 0.3 | 0.002 | −0.04 | 0.004 | 1.0 | 0.044 |
| C-reactive protein | −0.2 | 0.016 | 0.02 | 0.009 | 1.6 | <0.001 |
| Fibrinogen | 4.0 | <0.001 | −0.5 | <0.001 | 18.7 | <0.001 |
| White blood cell count | −0.04 | 0.735 | 0.01 | 0.666 | −1.2 | 0.047 |
| Hematocrit | 0.6 | <0.001 | −0.09 | <0.001 | −2.5 | 0.002 |
| Platelet count | 0.01 | 0.072 | −0.00 | 0.169 | −0.02 | 0.556 |
| Erythrocyte sedimentation rate | 0.3 | 0.004 | −0.03 | 0.021 | 1.2 | 0.016 |
| Model C | ||||||
| CD vs. control | −3.5 | 0.022 | 0.2 | 0.183 | −39.4 | <0.001 |
| Age | 0.07 | 0.100 | −0.01 | 0.235 | 0.6 | 0.026 |
| Sex | 0.1 | 0.935 | 0.04 | 0.829 | 18.2 | 0.031 |
| Model D | ||||||
| CD vs. control | −1.1 | 0.345 | 0.1 | 0.524 | −2.8 | 0.632 |
| Age | 0.04 | 0.286 | −0.00 | 0.543 | 0.3 | 0.077 |
| Sex | 0.2 | 0.897 | −0.1 | 0.565 | −12.5 | 0.113 |
| Creatinine | 0.03 | 0.525 | 0.00 | 0.619 | −0.1 | 0.674 |
| Bilirubin | −0.1 | 0.044 | 0.02 | 0.007 | −0.35 | 0.222 |
| Non-high-density lipoprotein cholesterol | 0.05 | 0.920 | −0.02 | 0.693 | 1.9 | 0.373 |
| Total protein | 0.3 | 0.034 | −0.03 | 0.066 | 0.9 | 0.125 |
| C-reactive protein | −0.2 | 0.012 | 0.02 | 0.017 | 1.8 | <0.001 |
| Fibrinogen | 4.1 | <0.001 | −0.47 | <0.001 | 16.7 | 0.001 |
| White blood cell count | 0.09 | 0.496 | 0.01 | 0.452 | −1.2 | 0.061 |
| Hematocrit | 0.6 | <0.001 | −0.1 | <0.001 | −2.7 | 0.002 |
| Platelet count | 0.01 | 0.150 | −0.00 | 0.255 | −0.02 | 0.630 |
| Erythrocyte sedimentation rate | 0.4 | 0.002 | −0.03 | 0.017 | 1.0 | 0.074 |
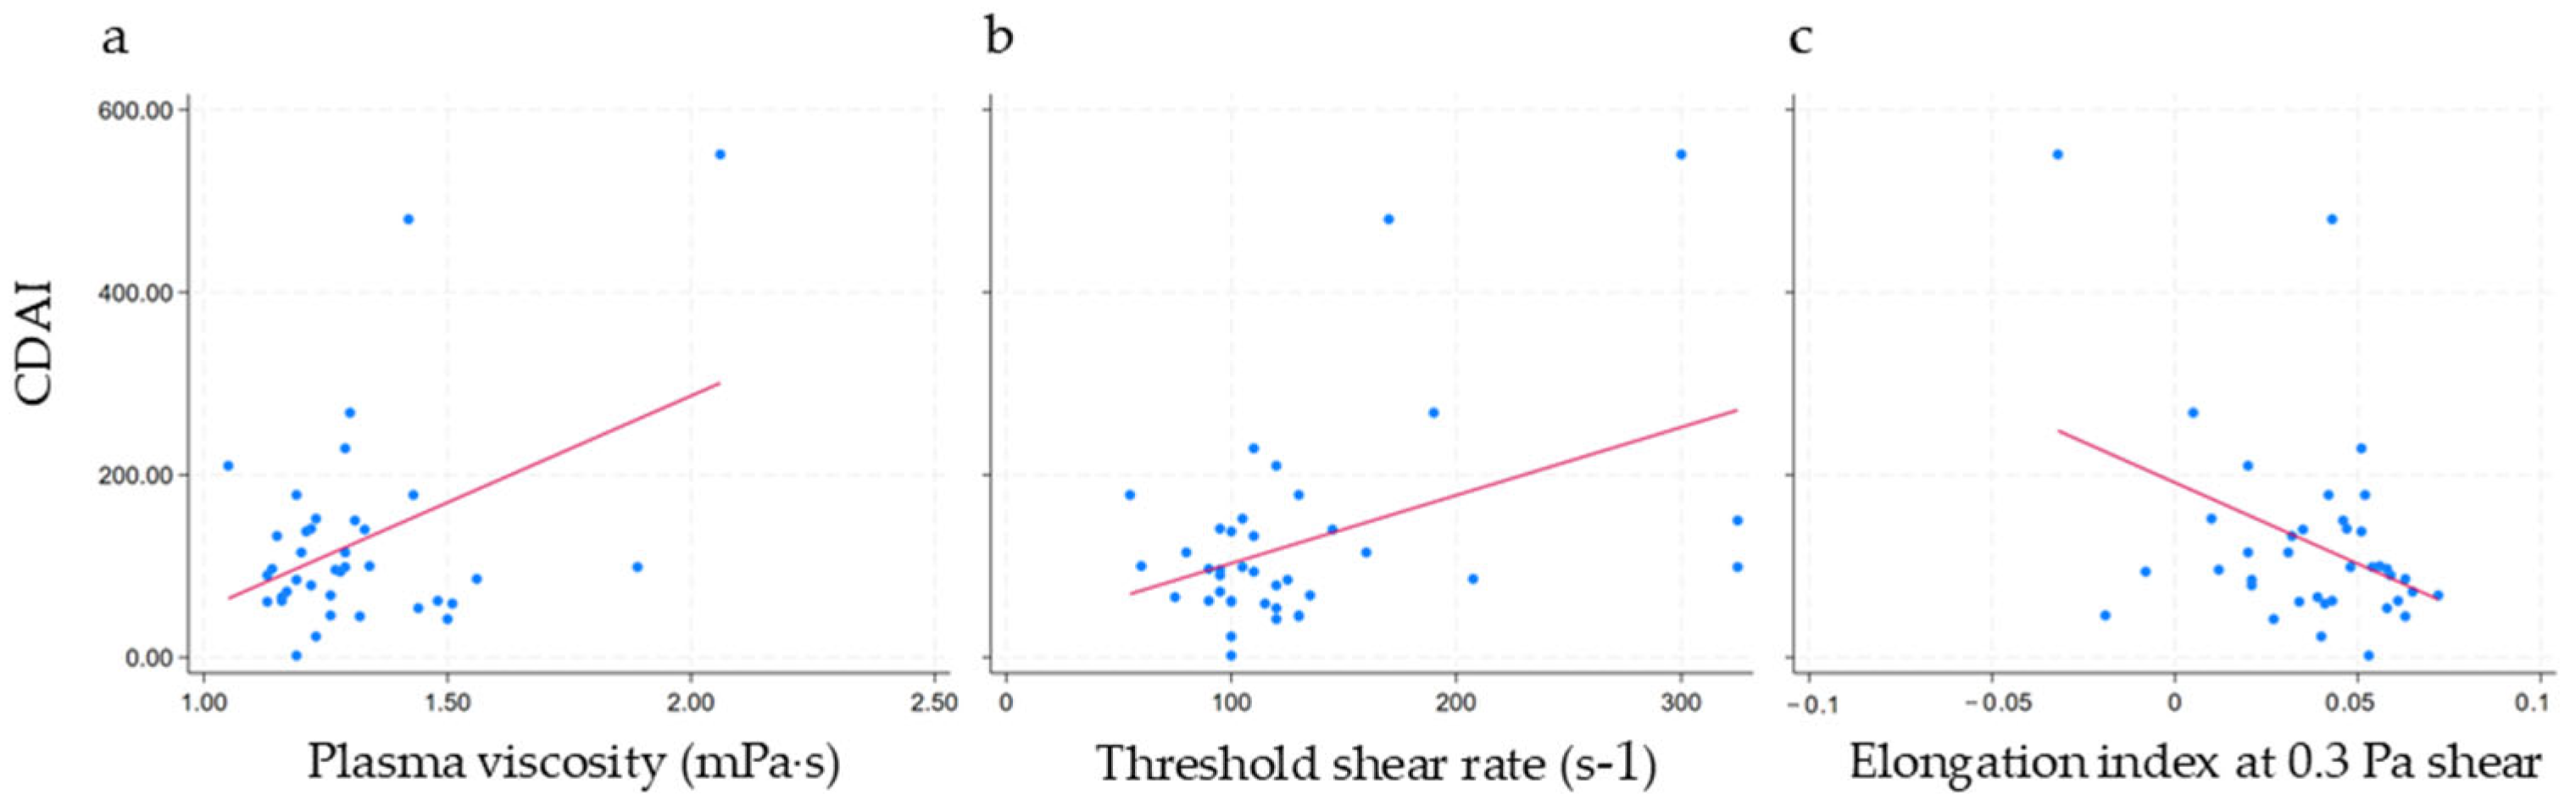
| Variables | Regression Coeff | R2 | p-Value |
|---|---|---|---|
| Plasma viscosity | 0.001 | 0.18 | 0.008 |
| Whole blood viscosity | −0.001 | 0.06 | 0.137 |
| Aggregation index | 0.004 | <0.01 | 0.750 |
| Aggregation half-time | −0.001 (<) | <0.01 | 0.967 |
| Threshold shear rate | 0.251 | 0.19 | 0.007 |
| Elongation index at 30 Pa | −0.001 (<) | <0.01 | 0.688 |
| Elongation index at 16.87 Pa | −0.001 (<) | <0.01 | 0.739 |
| Elongation index at 9.49 Pa | −0.001 (<) | <0.01 | 0.680 |
| Elongation index at 5.33 Pa | −0.001 (<) | 0.02 | 0.451 |
| Elongation index at 3 Pa | −0.001 (<) | 0.04 | 0.244 |
| Elongation index at 1.69 Pa | −0.001 (<) | 0.07 | 0.120 |
| Elongation index at 0.95 Pa | −0.001 (<) | 0.09 | 0.063 |
| Elongation index at 0.53 Pa | −0.001 (<) | 0.12 | 0.032 |
| Elongation index at 0.3 Pa | −0.001 (<) | 0.15 | 0.017 |
Disclaimer/Publisher’s Note: The statements, opinions and data contained in all publications are solely those of the individual author(s) and contributor(s) and not of MDPI and/or the editor(s). MDPI and/or the editor(s) disclaim responsibility for any injury to people or property resulting from any ideas, methods, instructions or products referred to in the content. |
© 2025 by the authors. Licensee MDPI, Basel, Switzerland. This article is an open access article distributed under the terms and conditions of the Creative Commons Attribution (CC BY) license (https://creativecommons.org/licenses/by/4.0/).
Share and Cite
Szakács, Z.; Csiszár, B.; Nagy, M.; Tőkés-Füzesi, M.; Sarlós, P.; Tóth, K.; Hegyi, P.; Alizadeh, H.; Bajor, J. Hemorheology in Inflammatory Bowel Disease: A Case–Control Study. J. Clin. Med. 2025, 14, 4436. https://doi.org/10.3390/jcm14134436
Szakács Z, Csiszár B, Nagy M, Tőkés-Füzesi M, Sarlós P, Tóth K, Hegyi P, Alizadeh H, Bajor J. Hemorheology in Inflammatory Bowel Disease: A Case–Control Study. Journal of Clinical Medicine. 2025; 14(13):4436. https://doi.org/10.3390/jcm14134436
Chicago/Turabian StyleSzakács, Zsolt, Beáta Csiszár, Mátyás Nagy, Margit Tőkés-Füzesi, Patrícia Sarlós, Kálmán Tóth, Péter Hegyi, Hussain Alizadeh, and Judit Bajor. 2025. "Hemorheology in Inflammatory Bowel Disease: A Case–Control Study" Journal of Clinical Medicine 14, no. 13: 4436. https://doi.org/10.3390/jcm14134436
APA StyleSzakács, Z., Csiszár, B., Nagy, M., Tőkés-Füzesi, M., Sarlós, P., Tóth, K., Hegyi, P., Alizadeh, H., & Bajor, J. (2025). Hemorheology in Inflammatory Bowel Disease: A Case–Control Study. Journal of Clinical Medicine, 14(13), 4436. https://doi.org/10.3390/jcm14134436