Safe, Smart, and Scalable: A Prospective Multicenter Study on Low-Dose CT and CTSS for Emergency Risk Stratification in COVID-19
Abstract
1. Introduction
2. Materials and Methods
2.1. Study Objective
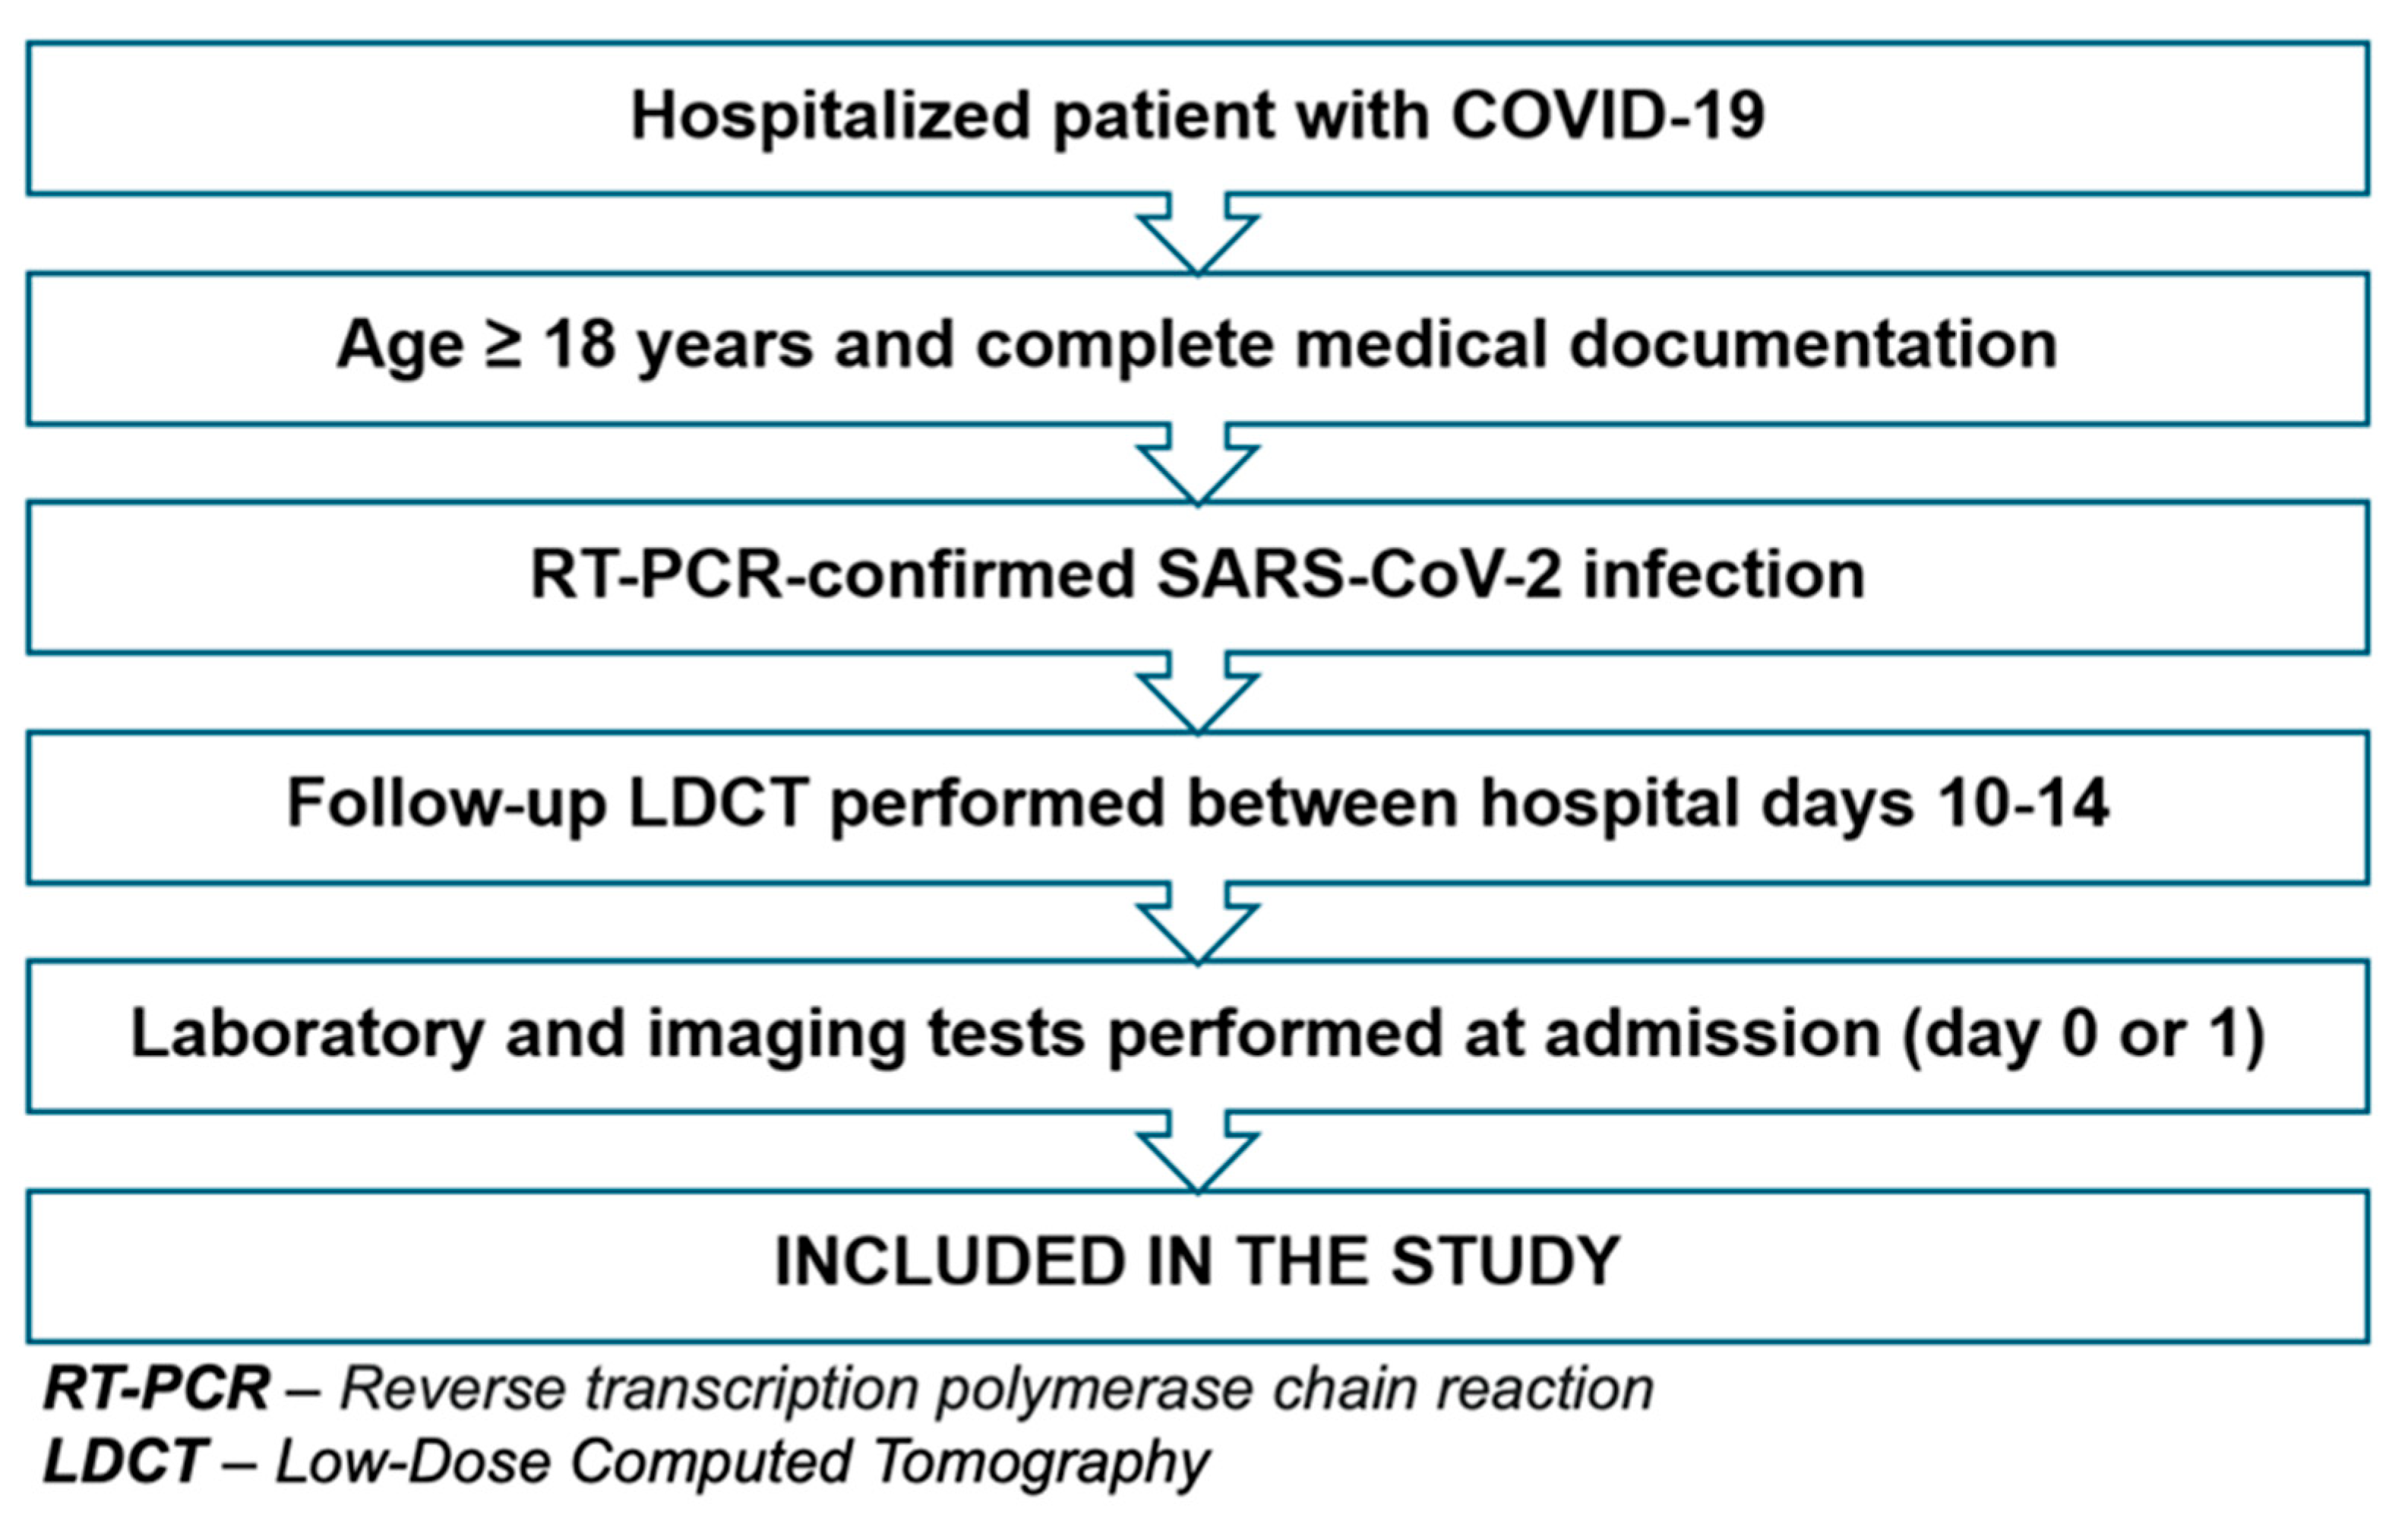
2.2. Study Design and Ethical Approvals
2.3. Participant Characteristics
2.4. Imaging Protocol—LDCT
2.5. Image Analysis and CTSS Determination
2.6. Statistical Methods
3. Results
3.1. Demographic Characteristics of the Study Population
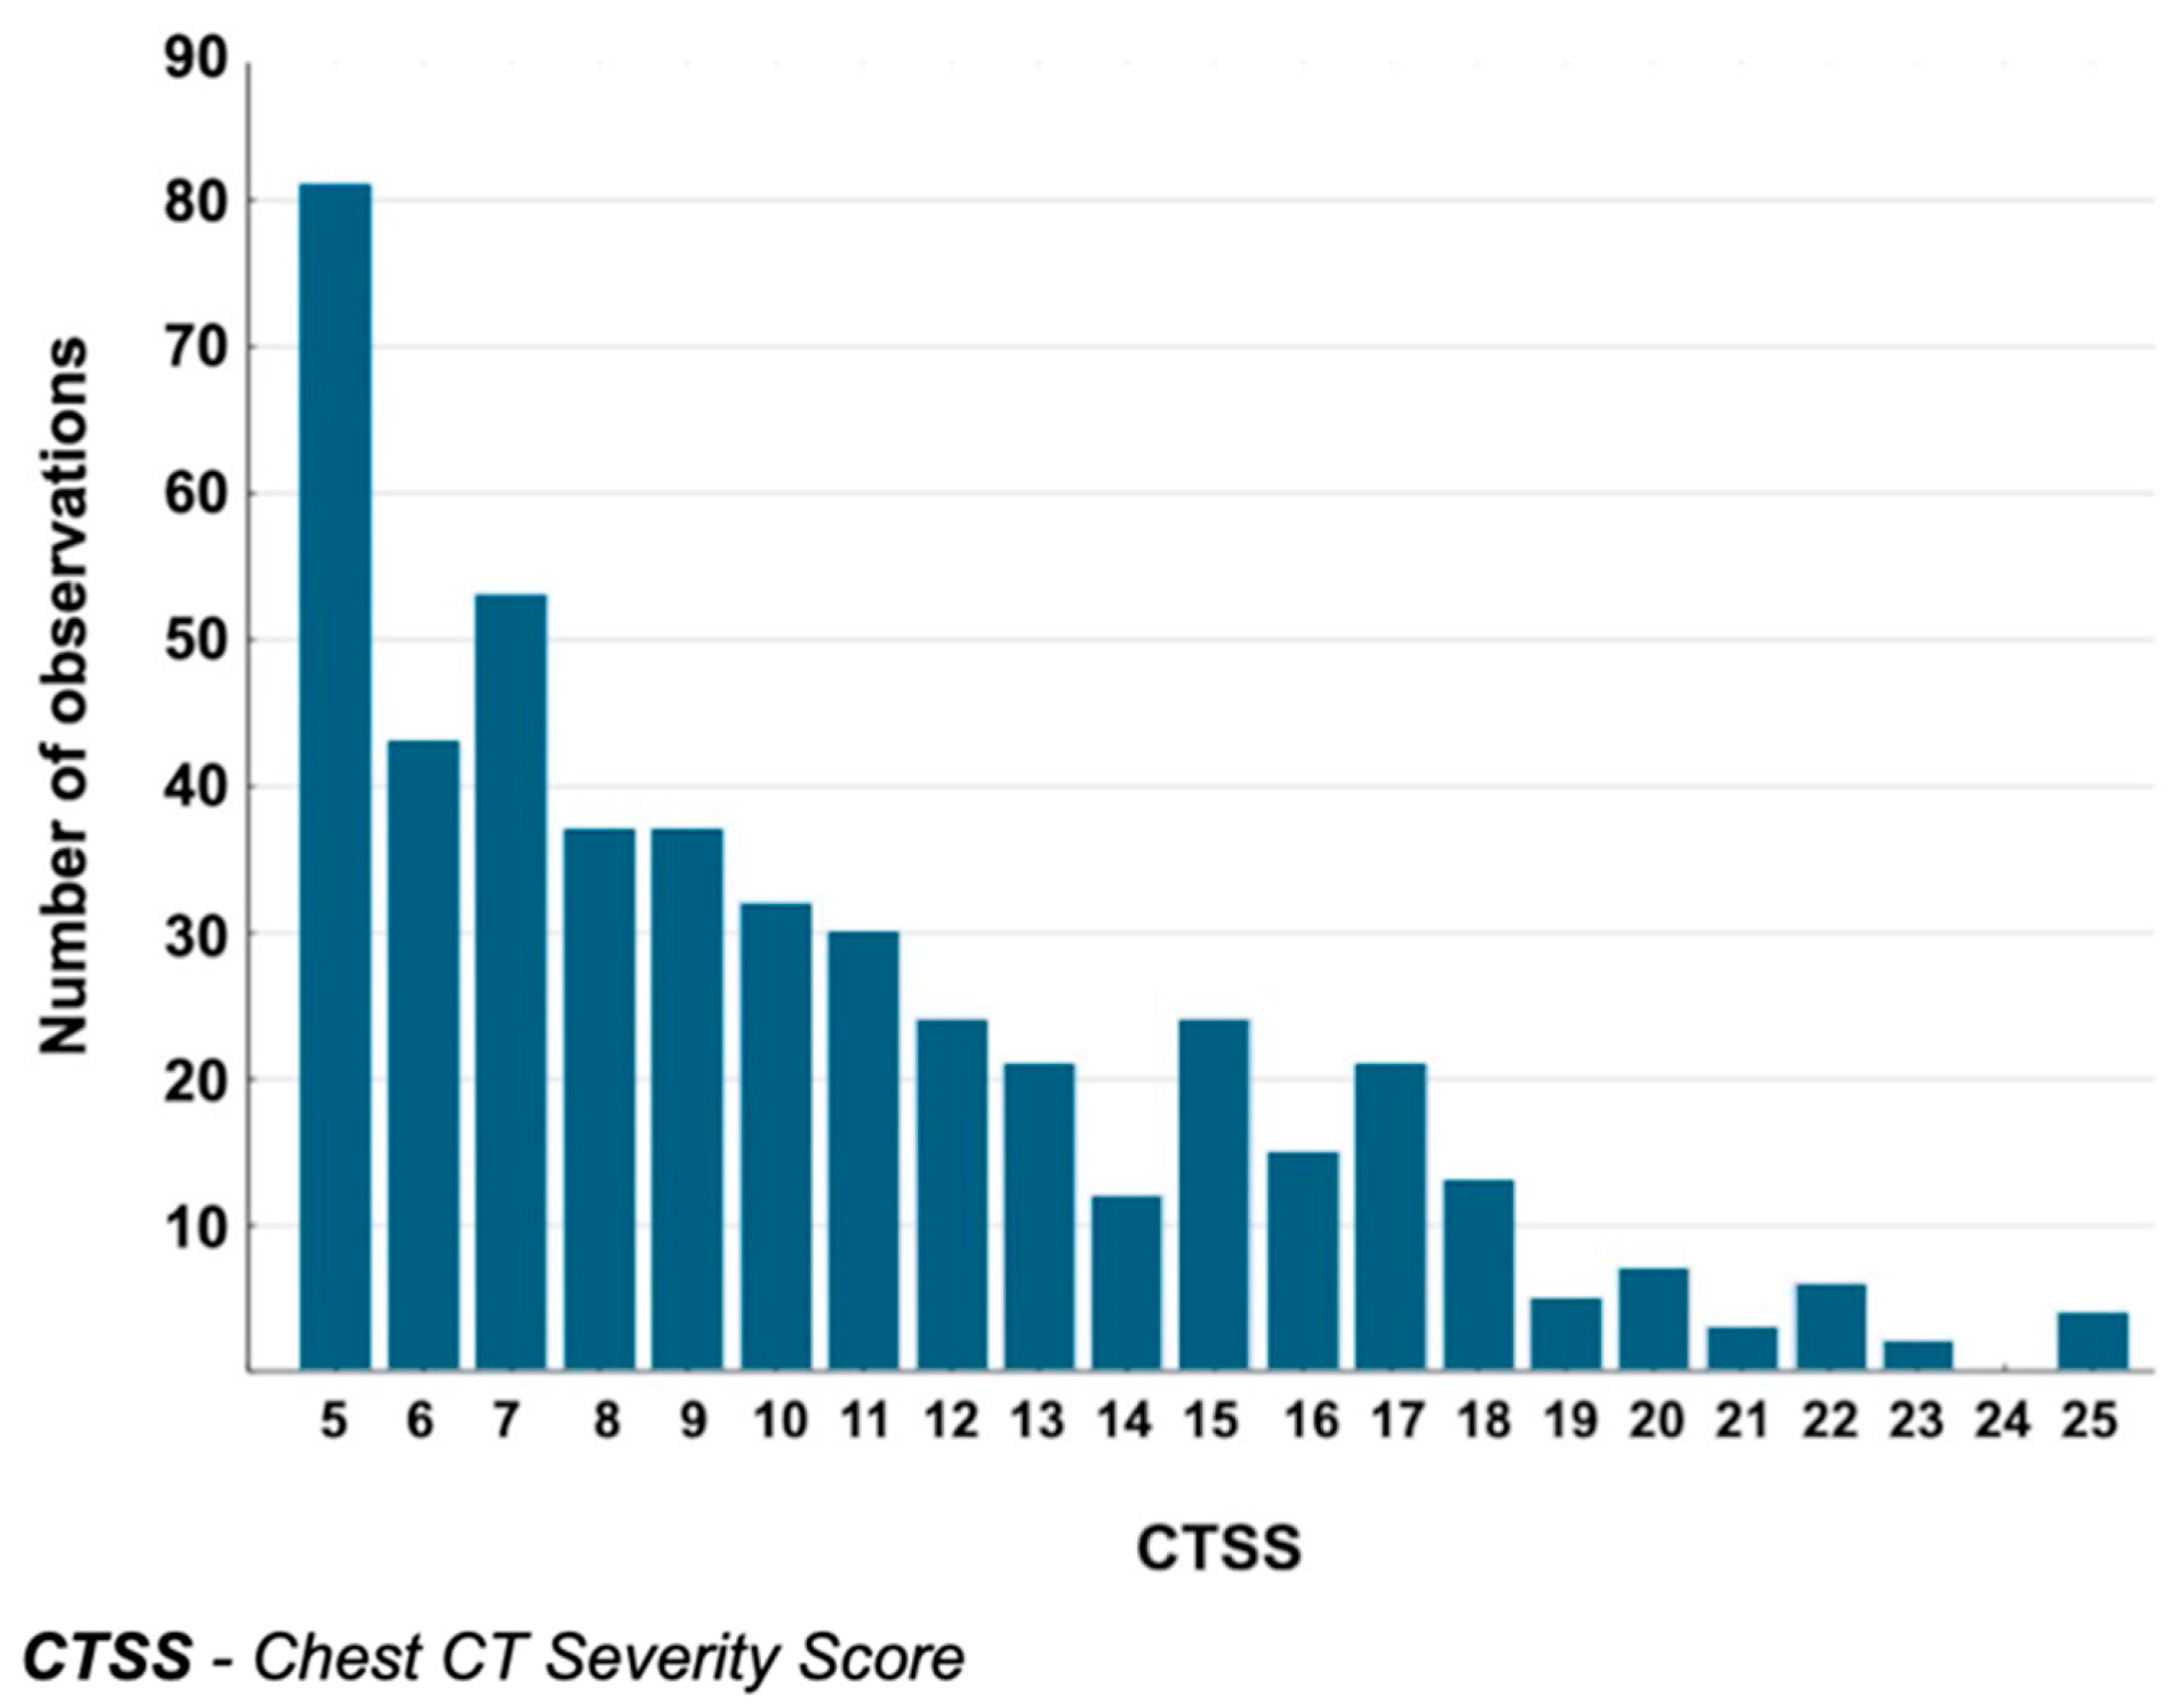
3.2. CTSS Values in the Analyzed Group
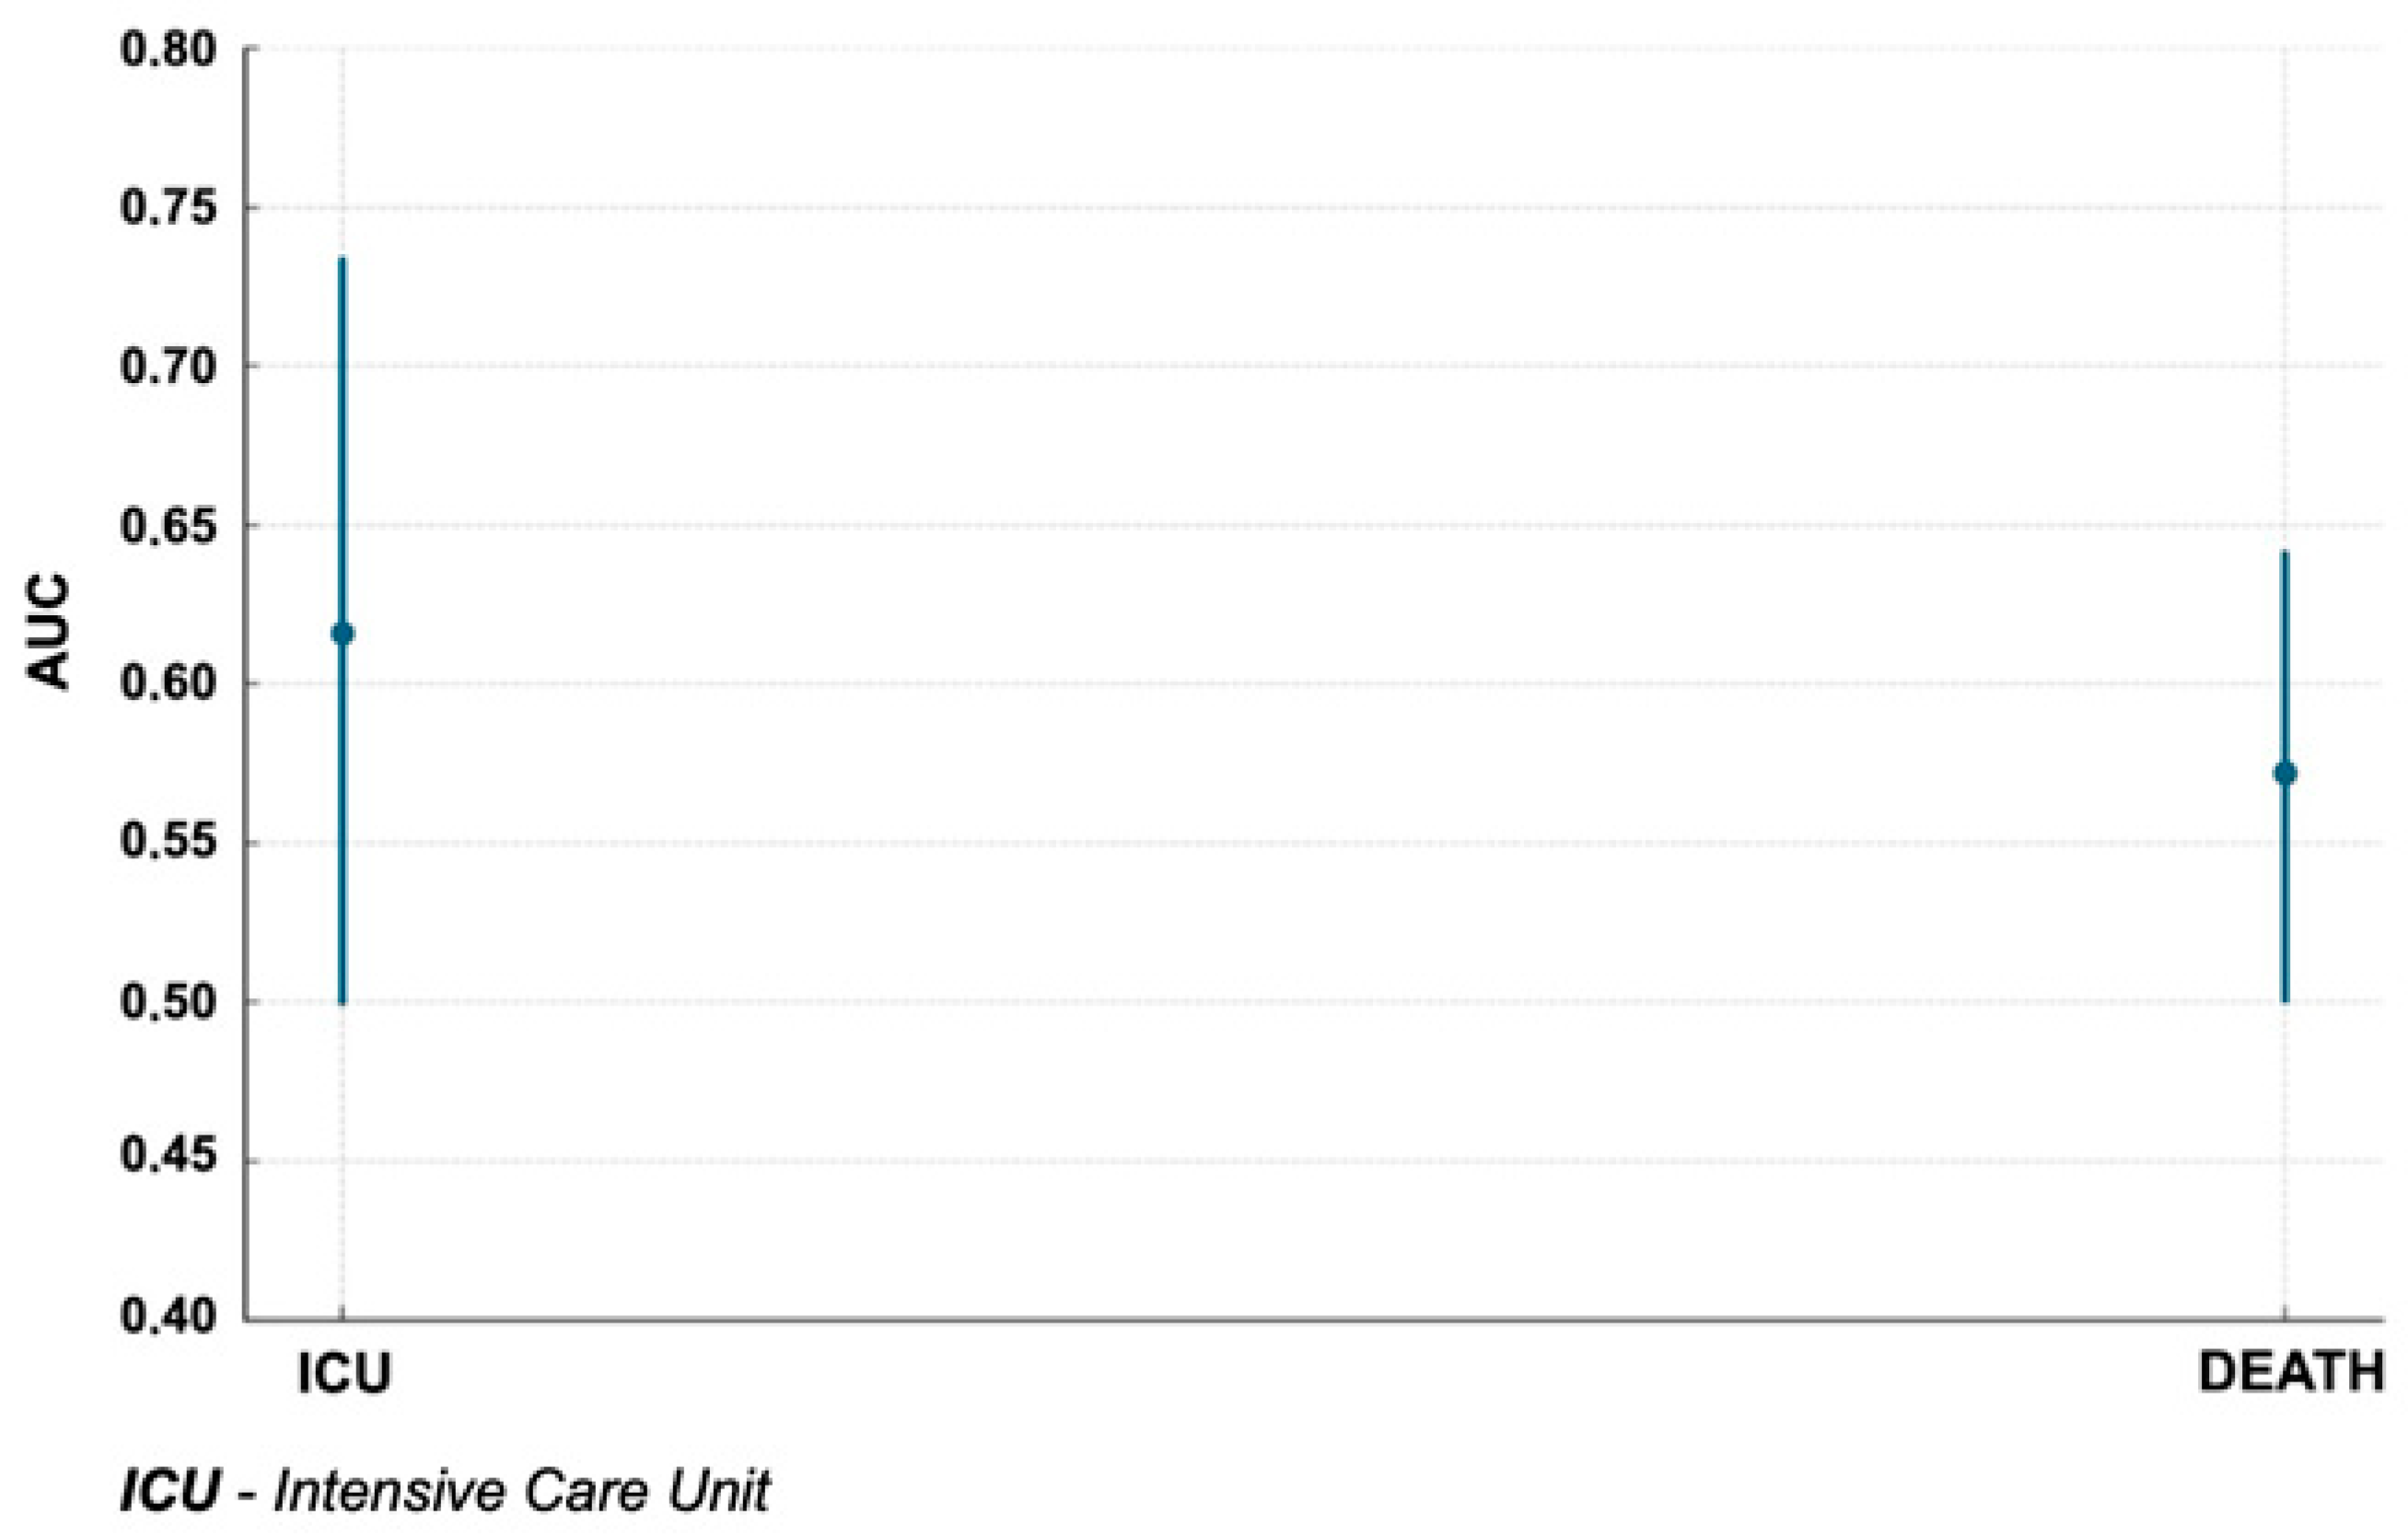
3.3. Relationship Between CTSS and Study Endpoints
3.4. Type of Imaging Changes and Clinical Course
3.5. Relationship Between CTSS and Laboratory Parameters
3.6. Relationship Between Oxygen Saturation, Dyspnea Scale, and CTSS
- Oxygen flow rate—a quantitative variable determining the level of oxygen support.
- Dyspnea scale with and without oxygen therapy as an indicator of subjective sensation of dyspnea among patients.
- The relationship of these parameters with other clinical and demographic features using statistical tests such as ANOVA and the Kruskal–Wallis test.
4. Discussion
4.1. Role of LDCT and CTSS in COVID-19 Diagnostics
4.2. The CTSS as a Predictor of COVID-19 Severity
4.3. Relevance of Age and Gender in CTSS Interpretation
4.4. Role of Imaging Morphology
4.5. CTSS and Laboratory Markers
4.6. The CTSS as a Predictor of Oxygen Therapy Requirements
4.7. Correlation of CTSS with Clinical Respiratory Insufficiency Symptoms
4.8. Modern Applications of Low-Dose CT and CT Severity Score in Clinical Practice and Guidelines—Development Perspectives
4.9. Limitations
5. Conclusions
Author Contributions
Funding
Institutional Review Board Statement
Informed Consent Statement
Data Availability Statement
Conflicts of Interest
References
- Ochani, R.; Asad, A.; Yasmin, F.; Shaikh, S.; Khalid, H.; Batra, S.; Sohail, M.R.; Mahmood, S.F.; Ochani, R.; Hussham Arshad, M.; et al. COVID-19 pandemic: From origins to outcomes. A comprehensive review of viral pathogenesis, clinical manifestations, diagnostic evaluation, and management. Infez. Med. 2021, 29, 20–36. [Google Scholar] [PubMed]
- Yüce, M.; Filiztekin, E.; Özkaya, K.G. COVID-19 diagnosis -A review of current methods. Biosens. Bioelectron. 2021, 172, 112752. [Google Scholar] [CrossRef] [PubMed]
- Bartsch, S.M.; Ferguson, M.C.; McKinnell, J.A.; O’SHea, K.J.; Wedlock, P.T.; Siegmund, S.S.; Lee, B.Y. The Potential Health Care Costs And Resource Use Associated With COVID-19 In The United States. Health Aff. 2020, 39, 927–935. [Google Scholar] [CrossRef] [PubMed]
- Safiabadi Tali, S.H.; LeBlanc, J.J.; Sadiq, Z.; Oyewunmi, O.D.; Camargo, C.; Nikpour, B.; Armanfard, N.; Sagan, S.M.; Jahanshahi-Anbuhi, S. Tools and Techniques for Severe Acute Respiratory Syndrome Coronavirus 2 (SARS-CoV-2)/COVID-19 Detection. Clin. Microbiol. Rev. 2021, 34, e00228-20. [Google Scholar] [CrossRef]
- World Health Organization. Use of Chest Imaging in COVID-19: A Rapid Advice Guide, 11 June 2020. 2020. Available online: https://iris.who.int/handle/10665/332336 (accessed on 7 June 2025).
- Li, J.; Yan, R.; Zhai, Y.; Qi, X.; Lei, J. Chest CT findings in patients with coronavirus disease 2019 (COVID-19): A comprehensive review. Diagn. Interv. Radiol. 2021, 27, 621–632. [Google Scholar] [CrossRef]
- Suliman, I.I.; Khouqeer, G.A.; Ahmed, N.A.; Abuzaid, M.M.; Sulieman, A. Low-Dose Chest CT Protocols for Imaging COVID-19 Pneumonia: Technique Parameters and Radiation Dose. Life 2023, 13, 992. [Google Scholar] [CrossRef]
- Agostini, A.; Floridi, C.; Borgheresi, A.; Badaloni, M.; Pirani, P.E.; Terilli, F.; Ottaviani, L.; Giovagnoni, A. Proposal of a low-dose, long-pitch, dual-source chest CT protocol on third-generation dual-source CT using a tin filter for spectral shaping at 100 kVp for CoronaVirus Disease 2019 (COVID-19) patients: A feasibility study. Radiol. Med. 2020, 125, 365–373. [Google Scholar] [CrossRef]
- Blokhin, I.; Gombolevskiy, V.; Chernina, V.; Gusev, M.; Gelezhe, P.; Aleshina, O.; Nikolaev, A.; Kulberg, N.; Morozov, S.; Reshetnikov, R. Inter-Observer Agreement between Low-Dose and Standard-Dose CT with Soft and Sharp Convolution Kernels in COVID-19 Pneumonia. J. Clin. Med. 2022, 11, 669. [Google Scholar] [CrossRef]
- Ghane, B.; Karimian, A.; Mostafapour, S.; Gholamiankhak, F.; Shojaerazavi, S.; Arabi, H. Quantitative Analysis of Image Quality in Low-Dose Computed Tomography Imaging for COVID-19 Patients. J. Med. Signals. Sens. 2023, 13, 118–128. [Google Scholar] [CrossRef]
- Zarei, F.; Jalli, R.; Chatterjee, S.; Haghighi, R.R.; Iranpour, P.; Chatterjee, V.V.; Emadi, S. Evaluation of Ultra-Low-Dose Chest Computed Tomography Images in Detecting Lung Lesions Related to COVID-19: A Prospective Study. Iran J. Med. Sci. 2022, 47, 338–349. [Google Scholar]
- Xie, X.; Zhong, Z.; Zhao, W.; Zheng, C.; Wang, F.; Liu, J. Chest CT for Typical Coronavirus Disease 2019 (COVID-19) Pneumonia: Relationship to Negative RT-PCR Testing. Radiology 2020, 296, E41–E45. [Google Scholar] [CrossRef] [PubMed]
- Prakash, J.; Kumar, N.; Saran, K.; Yadav, A.K.; Kumar, A.; Bhattacharya, P.K.; Prasad, A. Computed tomography severity score as a predictor of disease severity and mortality in COVID-19 patients: A systematic review and meta-analysis. J. Med. Imaging Radiat. Sci. 2023, 54, 364–375. [Google Scholar] [CrossRef] [PubMed]
- Jayachandran, A.K.; Nelson, V.; Shajahan, M.E. Chest CT severity score as a predictor of mortality and short-term prognosis in COVID-19. J. Fam. Med. Prim. Care 2022, 11, 4363–4367. [Google Scholar] [CrossRef] [PubMed]
- Bellos, I.; Tavernaraki, K.; Stefanidis, K.; Michalopoulou, O.; Lourida, G.; Korompoki, E.; Thanou, I.; Thanos, L.; Pefanis, A.; Argyraki, A. Chest CT severity score and radiological patterns as predictors of disease severity, ICU admission, and viral positivity in COVID-19 patients. Respir. Investig. 2021, 59, 436–445. [Google Scholar] [CrossRef]
- Yang, R.; Li, X.; Liu, H.; Zhen, Y.; Zhang, X.; Xiong, Q.; Luo, Y.; Gao, C.; Zeng, W. Chest CT Severity Score: An Imaging Tool for Assessing Severe COVID-19. Radiol. Cardiothorac. Imaging 2020, 2, e200047. [Google Scholar] [CrossRef]
- Lieveld, A.W.E.; Azijli, K.; Teunissen, B.P.; van Haaften, R.M.; Kootte, R.S.; Van Den Berk, I.A.H.; van der Horst, S.F.B.; de Gans, C.; van de Ven, P.M.; Nanayakkara, P.W.B. Chest CT in COVID-19 at the ED: Validation of the COVID-19 Reporting and Data System (CO-RADS) and CT Severity Score: A Prospective, Multicenter, Observational Study. Chest 2021, 159, 1126–1135. [Google Scholar] [CrossRef]
- Milenkovic, A.; Nikolic, S.; Elek, Z.; Pribakovic, J.A.; Ilic, A.; Bulatovic, K.; Gasic, M.; Jaksic, B.; Stojanovic, M.; Jaksic, D.M.; et al. Significance of Initial Chest CT Severity Score (CTSS) and Patient Characteristics in Predicting Outcomes in Hospitalized COVID-19 Patients: A Single Center Study. Viruses 2024, 16, 1683. [Google Scholar] [CrossRef]
- Salahshour, F.; Mehrabinejad, M.-M.; Toosi, M.N.; Gity, M.; Ghanaati, H.; Shakiba, M.; Sheybani, S.N.; Komaki, H.; Kolahi, S. Clinical and chest CT features as a predictive tool for COVID-19 clinical progress: Introducing a novel semi-quantitative scoring system. Eur. Radiol. 2021, 31, 5178–5188. [Google Scholar] [CrossRef]
- Bonanad, C.; García-Blas, S.; Tarazona-Santabalbina, F.; Sanchis, J.; Bertomeu-González, V.; Fácila, L.; Ariza, A.; Núñez, J.; Cordero, A. The Effect of Age on Mortality in Patients with COVID-19: A Meta-Analysis With 611,583 Subjects. J. Am. Med. Dir. Assoc. 2020, 21, 915–918. [Google Scholar] [CrossRef]
- Nokiani, A.A.; Shahnazari, R.; Abbasi, M.A.; Divsalar, F.; Bayazidi, M.; Sadatnaseri, A. CT-severity score in COVID-19 patients: For whom is it applicable best? Casp. J. Intern. Med. 2022, 13 (Suppl. 3), 228–235. [Google Scholar]
- Alilou, S.; Zangiabadian, M.; Pouramini, A.; Jaberinezhad, M.; Shobeiri, P.; Ghozy, S.; Haseli, S.; Beizavi, Z. Radiological Findings as Predictors of COVID-19 Lung Sequelae: A Systematic Review and Meta-analysis. Acad. Radiol. 2023, 30, 3076–3085. [Google Scholar] [CrossRef] [PubMed]
- Majrashi, N.A.; Alhulaibi, R.A.; Nammazi, I.H.; Alqasi, M.H.; Alyami, A.S.; Ageeli, W.A.; Abuhadi, N.H.; Kharizy, A.A.; Khormi, A.M.; Ghazwani, M.G.; et al. A Systematic Review of the Relationship between Chest CT Severity Score and Laboratory Findings and Clinical Parameters in COVID-19 Pneumonia. Diagnostics 2023, 13, 2223. [Google Scholar] [CrossRef] [PubMed]
- Zhang, B.; Zhang, J.; Chen, H.; Chen, L.; Chen, Q.; Li, M.; Chen, Z.; You, J.; Yang, K.; Zhang, S. Novel coronavirus disease 2019 (COVID-19): Relationship between chest CT scores and laboratory parameters. Eur. J. Nucl. Med. Mol. Imaging 2020, 47, 2083–2089. [Google Scholar] [CrossRef] [PubMed]
- Saeed, G.A.; Gaba, W.; Shah, A.; Al Helali, A.A.; Raidullah, E.; Al Ali, A.B.; Elghazali, M.; Ahmed, D.Y.; Al Kaabi, S.G.; Almazrouei, S.; et al. Correlation between Chest CT Severity Scores and the Clinical Parameters of Adult Patients with COVID-19 Pneumonia. Radiol. Res. Pract. 2021, 2021, 6697677. [Google Scholar] [CrossRef]
- Francone, M.; Iafrate, F.; Masci, G.M.; Coco, S.; Cilia, F.; Manganaro, L.; Panebianco, V.; Andreoli, C.; Colaiacomo, M.C.; Zingaropoli, M.A.; et al. Chest CT score in COVID-19 patients: Correlation with disease severity and short-term prognosis. Eur. Radiol. 2020, 30, 6808–6817. [Google Scholar] [CrossRef]
- Janssen, M.T.; Thijssen, M.G.; Krdzalic, J.; Gronenschild, M.H.; Ramiro, S.; Magro-Checa, C.; Landewé, R.B.; Mostard, R.L. Three-month follow-up after severe COVID-19 infection: Are chest CT results associated with respiratory outcomes and respiratory recovery in COVID-19 patients? BMC Pulm. Med. 2023, 23, 74. [Google Scholar] [CrossRef]
- Yanamandra, U.; Shobhit, S.; Paul, D.; Aggarwal, B.; Kaur, P.; Duhan, G.; Singh, A.; Srinath, R.; Saxena, P.; Menon, A.S. Relationship of Computed Tomography Severity Score with Patient Characteristics and Survival in Hypoxemic COVID-19 Patients. Cureus 2022, 14, e22847. [Google Scholar] [CrossRef]
- Ai, T.; Yang, Z.; Hou, H.; Zhan, C.; Chen, C.; Lv, W.; Tao, Q.; Sun, Z.; Xia, L. Correlation of Chest CT and RT-PCR Testing in Coronavirus Disease 2019 (COVID-19) in China: A Report of 1014 Cases. Radiology 2020, 296, E32–E40. [Google Scholar] [CrossRef]
- Maldonado, A.; Endara, P.; Abril, P.; Carrión, H.; Largo, C.; Benavides, P. ROX Index Variation as a Predictor of Outcomes in COVID-19 Patients. J. Clin. Med. 2024, 13, 3025. [Google Scholar] [CrossRef]
- Guo, L.; Jin, Z.; Gan, T.J.; Wang, E. Silent Hypoxemia in Patients with COVID-19 Pneumonia: A Review. Med. Sci. Monit. 2021, 27, e930776. [Google Scholar] [CrossRef]
- Shi, F.; Wang, J.; Shi, J.; Wu, Z.; Wang, Q.; Tang, Z.; He, K.; Shi, Y.; Shen, D. Review of Artificial Intelligence Techniques in Imaging Data Acquisition, Segmentation and Diagnosis for COVID-19. IEEE Rev. Biomed. Eng. 2021, 14, 4–15. [Google Scholar] [CrossRef]
- Li, L.; Qin, L.; Xu, Z.; Yin, Y.; Wang, X.; Kong, B.; Bai, J.; Lu, Y.; Fang, Z.; Song, Q.; et al. Artificial intelligence distinguishes COVID-19 from community acquired pneumonia on chest CT. Radiology 2020, 296, E65–E71. [Google Scholar] [CrossRef] [PubMed]
- Harmon, S.A.; Sanford, T.H.; Xu, S.; Turkbey, E.B.; Roth, H.; Xu, Z.; Yang, D.; Myronenko, A.; Anderson, V.; Amalou, A.; et al. Artificial intelligence for the detection of COVID-19 pneumonia on chest CT using multinational datasets. Nat. Commun. 2020, 11, 4080. [Google Scholar] [CrossRef] [PubMed]
- Tang, Z.; Zhao, W.; Xie, X.; Zhong, Z.; Shi, F.; Liu, J.; Shen, D. Severity assessment of coronavirus disease 2019 (COVID-19) using quantitative features from chest CT images. Eur. Radiol. 2020, 30, 6401–6410. [Google Scholar]


| Criterion According to NCCN | Value |
|---|---|
| Radiation dose for individuals with BMI ≤ 30 | ≤3 mSv |
| X-ray tube voltage | 100–120 kVp |
| X-ray tube current | ≤40 mAs |
| Detector collimation | ≤1.5 mm |
| Reconstruction slice thickness | ≤1 mm |
| Acquisition time | ≤15 s |
| Score | Extent of Lobe Involvement |
|---|---|
| 1 | ≤5% |
| 2 | 5–25% |
| 3 | 26–60% |
| 4 | 51–75% |
| 5 | >75% |
| Variable Type | Test Applied | Purpose |
|---|---|---|
| Paired, non-parametric | Wilcoxon signed-rank test | Compare matched values before/after |
| Continuous, normal | Pearson’s correlation | Assess linear correlation |
| Continuous, non-normal | Spearman’s/Kendall’s tau | Assess monotonic association |
| Independent groups | Mann–Whitney U test | Compare medians between two groups |
| >2 group comparison | ANOVA | Compare means across multiple groups |
| Variable | Descriptive | Statistics | |||
|---|---|---|---|---|---|
| N | Median | Q1 | Q3 | IQR | |
| CTSS1 | 462 | 9 | 6 | 13 | 7 |
| CTSS2 | 147 | 7 | 5 | 10 | 5 |
| CTSS3 | 6 | 11 | 7 | 22 | 15 |
| CTSS | 470 | 9 | 6 | 13 | 7 |
| Endpoint | CTSS Cut-Off | AUC | SE | 95% CI (Lower) | 95% CI (Upper) | Z | p-Value |
|---|---|---|---|---|---|---|---|
| ICU admission | 13 | 0.616 | 0.06 | 0.499 | 0.733 | 1.949 | 0.04 |
| Death | 15 | 0.572 | 0.036 | 0.501 | 0.642 | 1.992 | 0.0464 |
| Endpoint | CTSS (Cut-Off) | AUC (95% CI) | p-Value | Age Effect Adjusted |
|---|---|---|---|---|
| Death | 15 | 0.572 (0.501–0.642) | 0.0464 | Yes |
| Variable | Pearson | p-Value (Pearson) | Spearman | p-Value (Spearman) |
|---|---|---|---|---|
| Hospital stay duration | 0.07 | 0.22 | 0.01 | 0.76 |
| ICU stay duration | −0.01 | 0.78 | 0.13 | 0.06 |
| Localization | Patients | |||
|---|---|---|---|---|
| Number with Symptoms | Death | ICU | Length of Hospitalization | |
| Bilateral (both lungs) | 1091 | 113 | 222 | 10.2 (±16.5) |
| Unilateral—right lung | 16 | 0 | 5 | 8.2 (±5.11) |
| Unilateral—left lung | 4 | 0 | 1 | 11.5 (±3.53) |
| Single lesion | 110 | 11 | 29 | 9.2 (±5.41) |
| Multiple lesions | 999 | 102 | 199 | 10.3 (±17.2) |
| Disseminated lesions | 527 | 71 | 124 | 9.6 (±21.5) |
| Peripheral/subpleural lesions | 513 | 39 | 80 | 10.4 (±8.5) |
| Comparison | Correlation Method | Correlation Coefficient | p-Value |
|---|---|---|---|
| Age vs. % of lung involvement | Spearman | 0.93 | <0.01 |
| Age vs. % of lung involvement | Pearson | 0.917 | <0.01 |
| Laboratory Parameter | Spearman’s Coefficient | p-Value |
|---|---|---|
| CRP | 0.207 | <0.001 |
| LDH | 0.200 | <0.001 |
| Glucose | 0.178 | <0.001 |
| WBC | 0.176 | <0.001 |
| PCT | 0.169 | <0.001 |
| Ferritin | 0.251 | <0.001 |
| Neutrophils (%) | 0.166 | <0.001 |
| Urea | 0.160 | <0.001 |
| eGFR (ml/min) | −0.151 | <0.001 |
| Creatinine | 0.148 | <0.001 |
| Lymphocytes (%) | −0.144 | <0.001 |
| Variable | Significance (Yes/No) | p-Value | Statistical Test | p-Value Adjusted (Age/Sex) |
|---|---|---|---|---|
| Oxygen flow | yes | 0.001 | ANOVA | 0.0001 |
| Dyspnea scale with oxygen | yes | 0.035 | ANOVA | 0.3718 |
| Oxygen flow | yes | 0.025 | ANOVA | 0.0182 |
| Oxygen flow | yes | 0.0072 | KW-test | No data |
| Dyspnea scale with oxygen | yes | <0.001 | ANOVA | <0.001 |
| Dyspnea scale without oxygen | yes | <0.001 | ANOVA | <0.001 |
| Dyspnea scale with oxygen | yes | <0.001 | KW-test | 0.1252 |
| Dyspnea scale without oxygen | yes | <0.001 | KW-test | 0.2085 |
| Oxygen flow | yes | <0.001 | ANOVA | 0.0001 |
| Oxygen flow | yes | 0.00587 | KW-test | No data |
| Clinical Parameter | Correlation Coefficient (r) | p-Value |
|---|---|---|
| Dyspnea scale without oxygen therapy | 0.113 | 0.029 |
| Dyspnea scale with oxygen therapy | 0.378 | 0.030 |
| Oxygen saturation on admission (%) | −0.146 | 0.004 |
Disclaimer/Publisher’s Note: The statements, opinions and data contained in all publications are solely those of the individual author(s) and contributor(s) and not of MDPI and/or the editor(s). MDPI and/or the editor(s) disclaim responsibility for any injury to people or property resulting from any ideas, methods, instructions or products referred to in the content. |
© 2025 by the authors. Licensee MDPI, Basel, Switzerland. This article is an open access article distributed under the terms and conditions of the Creative Commons Attribution (CC BY) license (https://creativecommons.org/licenses/by/4.0/).
Share and Cite
Górecki, A.; Piech, P.; Bronikowska, A.; Szostak, Z.; Jankowska, A.; Kołodziejczyk, K.; Borowski, B.; Staśkiewicz, G. Safe, Smart, and Scalable: A Prospective Multicenter Study on Low-Dose CT and CTSS for Emergency Risk Stratification in COVID-19. J. Clin. Med. 2025, 14, 4423. https://doi.org/10.3390/jcm14134423
Górecki A, Piech P, Bronikowska A, Szostak Z, Jankowska A, Kołodziejczyk K, Borowski B, Staśkiewicz G. Safe, Smart, and Scalable: A Prospective Multicenter Study on Low-Dose CT and CTSS for Emergency Risk Stratification in COVID-19. Journal of Clinical Medicine. 2025; 14(13):4423. https://doi.org/10.3390/jcm14134423
Chicago/Turabian StyleGórecki, Andrzej, Piotr Piech, Anna Bronikowska, Zuzanna Szostak, Ada Jankowska, Karolina Kołodziejczyk, Bartosz Borowski, and Grzegorz Staśkiewicz. 2025. "Safe, Smart, and Scalable: A Prospective Multicenter Study on Low-Dose CT and CTSS for Emergency Risk Stratification in COVID-19" Journal of Clinical Medicine 14, no. 13: 4423. https://doi.org/10.3390/jcm14134423
APA StyleGórecki, A., Piech, P., Bronikowska, A., Szostak, Z., Jankowska, A., Kołodziejczyk, K., Borowski, B., & Staśkiewicz, G. (2025). Safe, Smart, and Scalable: A Prospective Multicenter Study on Low-Dose CT and CTSS for Emergency Risk Stratification in COVID-19. Journal of Clinical Medicine, 14(13), 4423. https://doi.org/10.3390/jcm14134423


