
Evaluation of Ultra-Low-Dose CBCT Protocols to Investigate Vestibular Bone Defects in the Context of Immediate Implant Planning: An Ex Vivo Study on Cadaver Skulls
 ,
,  and
and
Abstract
1. Introduction
2. Materials and Methods
- The protocol with the highest resolution (ENDO);
- The corresponding ULD protocol (same FOV, voltage, and voxel size; protocol A);
- A high-resolution protocol of the maxilla and mandible with a voxel size of 150 µm (protocol B);
- A high-resolution protocol with a larger FOV and a voxel size of 200 µm (protocol C).
2.1. Experimental Setup
2.2. Statistical Analysis
3. Results
4. Discussion
5. Conclusions
Author Contributions
Funding
Institutional Review Board Statement
Informed Consent Statement
Data Availability Statement
Acknowledgments
Conflicts of Interest
References
- Jung, R.E.; Zaugg, B.; Philipp, A.O.; Truninger, T.C.; Siegenthaler, D.W.; Hammerle, C.H. A prospective, controlled clinical trial evaluating the clinical radiological and aesthetic outcome after 5 years of immediately placed implants in sockets exhibiting periapical pathology. Clin. Oral Implants Res. 2013, 24, 839–846. [Google Scholar] [CrossRef]
- Kan, J.Y.K.; Rungcharassaeng, K.; Deflorian, M.; Weinstein, T.; Wang, H.L.; Testori, T. Immediate implant placement and provisionalization of maxillary anterior single implants. Periodontol. 2000 2018, 77, 197–212. [Google Scholar] [CrossRef] [PubMed]
- Hassani, A.; Hassani, M.; Bitaraf, T. Immediate vs Delayed Restorations of Immediately Placed Single Implants in the Anterior Maxilla: A Nonrandomized Clinical Study. Int. J. Oral Maxillofac. Implants 2021, 36, 1159–1164. [Google Scholar] [CrossRef] [PubMed]
- Puisys, A.; Auzbikaviciute, V.; Vindasiute-Narbute, E.; Pranskunas, M.; Razukevicus, D.; Linkevicius, T. Immediate implant placement vs. early implant treatment in the esthetic area. A 1-year randomized clinical trial. Clin. Oral Implants Res. 2022, 33, 634–655. [Google Scholar] [CrossRef]
- Slagter, K.W.; Meijer, H.J.; Bakker, N.A.; Vissink, A.; Raghoebar, G.M. Immediate Single-Tooth Implant Placement in Bony Defects in the Esthetic Zone: A 1-Year Randomized Controlled Trial. J. Periodontol. 2016, 87, 619–629. [Google Scholar] [CrossRef] [PubMed]
- Patel, R.; Ucer, C.; Wright, S.; Khan, R.S. Differences in Dental Implant Survival between Immediate vs. Delayed Placement: A Systematic Review and Meta-Analysis. Dent. J. 2023, 11, 218. [Google Scholar] [CrossRef]
- Araujo, M.G.; Lindhe, J. Dimensional ridge alterations following tooth extraction. An experimental study in the dog. J. Clin. Periodontol. 2005, 32, 212–218. [Google Scholar] [CrossRef]
- Botticelli, D.; Berglundh, T.; Lindhe, J. Hard-tissue alterations following immediate implant placement in extraction sites. J. Clin. Periodontol. 2004, 31, 820–828. [Google Scholar] [CrossRef]
- Chappuis, V.; Araujo, M.G.; Buser, D. Clinical relevance of dimensional bone and soft tissue alterations post-extraction in esthetic sites. Periodontology 2000 2017, 73, 73–83. [Google Scholar] [CrossRef]
- Hu, C.; Gong, T.; Lin, W.; Yuan, Q.; Man, Y. Immediate implant placement into posterior sockets with or without buccal bone dehiscence defects: A retrospective cohort study. J. Dent. 2017, 65, 95–100. [Google Scholar] [CrossRef]
- Chen, K.; Li, Z.; Liu, X.; Liu, Q.; Chen, Z.; Sun, Y.; Chen, Z.; Huang, B. Immediate Implant Placement with Buccal Bone Augmentation in the Anterior Maxilla with Thin Buccal Plate: A One-Year Follow-Up Case Series. J. Prosthodont. 2021, 30, 473–480. [Google Scholar] [CrossRef] [PubMed]
- Slagter, K.W.; Meijer, H.J.A.; Hentenaar, D.F.M.; Vissink, A.; Raghoebar, G.M. Immediate single-tooth implant placement with simultaneous bone augmentation versus delayed implant placement after alveolar ridge preservation in bony defect sites in the esthetic region: A 5-year randomized controlled trial. J. Periodontol. 2021, 92, 1738–1748. [Google Scholar] [CrossRef]
- Chen, S.T.; Darby, I.B.; Adams, G.G.; Reynolds, E.C. A prospective clinical study of bone augmentation techniques at immediate implants. Clin. Oral Implants Res. 2005, 16, 176–184. [Google Scholar] [CrossRef]
- Denardi, R.J.; da Silva, R.D.; Thome, G.; Andrighetto, A.R.; de Freitas, R.M.; Shimizu, R.H.; Shimizu, I.A.; Melo, A.C.M. Bone response after immediate placement of implants in the anterior maxilla: A systematic review. Oral Maxillofac. Surg. 2019, 23, 13–25. [Google Scholar] [CrossRef]
- Meijer, H.J.A.; Slagter, K.W.; Vissink, A.; Raghoebar, G.M. Buccal bone thickness at dental implants in the maxillary anterior region with large bony defects at time of immediate implant placement: A 1-year cohort study. Clin. Implant. Dent. Relat. Res. 2019, 21, 73–79. [Google Scholar] [CrossRef]
- Bornstein, M.M.; Scarfe, W.C.; Vaughn, V.M.; Jacobs, R. Cone beam computed tomography in implant dentistry: A systematic review focusing on guidelines, indications, and radiation dose risks. Int. J. Oral Maxillofac. Implants 2014, 29, 55–77. [Google Scholar] [CrossRef]
- Guerrero, M.E.; Jacobs, R.; Loubele, M.; Schutyser, F.; Suetens, P.; van Steenberghe, D. State-of-the-art on cone beam CT imaging for preoperative planning of implant placement. Clin. Oral Investig. 2006, 10, 1–7. [Google Scholar] [CrossRef]
- Nasseh, I.; Al-Rawi, W. Cone Beam Computed Tomography. Dent. Clin. N. Am. 2018, 62, 361–391. [Google Scholar] [CrossRef]
- Bonfanti, E.; Maddalone, M.; Pellegatta, A.; Citterio, C.L.; Baldoni, M. Digital Orthopantomography vs Cone Beam Computed Tomography-Part 2: A CBCT Analysis of Factors Influencing the Prevalence of Periapical Lesions. J. Contemp. Dent. Pract. 2019, 20, 664–669. [Google Scholar]
- Mao, W.Y.; Lei, J.; Lim, L.Z.; Gao, Y.; Tyndall, D.A.; Fu, K. Comparison of radiographical characteristics and diagnostic accuracy of intraosseous jaw lesions on panoramic radiographs and CBCT. Dentomaxillofacial Radiol. 2021, 50, 20200165. [Google Scholar] [CrossRef]
- Abdinian, M.; Yaghini, J.; Jazi, L. Comparison of intraoral digital radiography and cone-beam computed tomography in the measurement of periodontal bone defects. Dent. Med. Probl. 2020, 57, 269–273. [Google Scholar] [CrossRef] [PubMed]
- Torres, M.G.; Campos, P.S.; Segundo, N.P.; Navarro, M.; Crusoe-Rebello, I. Accuracy of linear measurements in cone beam computed tomography with different voxel sizes. Implant. Dent. 2012, 21, 150–155. [Google Scholar] [CrossRef] [PubMed]
- Fokas, G.; Vaughn, V.M.; Scarfe, W.C.; Bornstein, M.M. Accuracy of linear measurements on CBCT images related to presurgical implant treatment planning: A systematic review. Clin. Oral Implants Res. 2018, 29, 393–415. [Google Scholar] [CrossRef] [PubMed]
- Eftekhar, M.; Kaviani, H.; Rouzmeh, N.; Torabinia, A.; Baghban, A.A. Effect of voxel size on detection of fenestration, dehiscence and furcation defects using cone-beam computed tomography. Oral Radiol. 2021, 37, 677–686. [Google Scholar] [CrossRef]
- Kurt, M.H.; Bagis, N.; Evli, C.; Atakan, C.; Orhan, K. Comparison of the different voxel sizes in the estimation of peri-implant fenestration defects using cone beam computed tomography: An ex vivo study. Int. J. Implant. Dent. 2020, 6, 58. [Google Scholar] [CrossRef]
- Feragalli, B.; Rampado, O.; Abate, C.; Macri, M.; Festa, F.; Stromei, F.; Caputi, S.; Guglielmi, G. Cone beam computed tomography for dental and maxillofacial imaging: Technique improvement and low-dose protocols. Radiol. Med. 2017, 122, 581–588. [Google Scholar] [CrossRef]
- Al-Okshi, A.; Theodorakou, C.; Lindh, C. Dose optimization for assessment of periodontal structures in cone beam CT examinations. Dentomaxillofacial Radiol. 2017, 46, 20160311. [Google Scholar] [CrossRef]
- Ludlow, J.B.; Walker, C. Assessment of phantom dosimetry and image quality of i-CAT FLX cone-beam computed tomography. Am. J. Orthod. Dentofac. Orthop. 2013, 144, 802–817. [Google Scholar] [CrossRef]
- Jaju, P.P.; Jaju, S.P. Cone-beam computed tomography: Time to move from ALARA to ALADA. Imaging Sci. Dent. 2015, 45, 263–265. [Google Scholar] [CrossRef]
- Oenning, A.C.; Jacobs, R.; Pauwels, R.; Stratis, A.; Hedesiu, M.; Salmon, B.; On behalf of the DIMITRA Research Group. Cone-beam CT in paediatric dentistry: DIMITRA project position statement. Pediatr. Radiol. 2018, 48, 308–316. [Google Scholar] [CrossRef]
- Oenning, A.C.; Jacobs, R.; Salmon, B.; the DIMITRA Research Group. ALADAIP, beyond ALARA and towards personalized optimization for paediatric cone-beam CT. Int. J. Paediatr. Dent. 2021, 31, 676–678. [Google Scholar] [CrossRef] [PubMed]
- Coskun, I.; Kaya, B. Appraisal of the relationship between tooth inclination, dehiscence, fenestration, and sagittal skeletal pattern with cone beam computed tomography. Angle Orthod. 2019, 89, 544–551. [Google Scholar] [CrossRef] [PubMed]
- Gambarini, G.; Miccoli, G.; Gaimari, G.; Pompei, D.; Pilloni, A.; Piasecki, L.; Al-Sudani, D.; Di Nardo, D.; Testarelli, L. Detection of Bone Defects Using CBCT Exam in an Italian Population. Int. J. Dent. 2017, 2017, 7523848. [Google Scholar] [CrossRef]
- Sun, L.; Yuan, L.; Wang, B.; Zhang, L.; Shen, G.; Fang, B. Changes of alveolar bone dehiscence and fenestration after augmented corticotomy-assisted orthodontic treatment: A CBCT evaluation. Prog. Orthod. 2019, 20, 7. [Google Scholar] [CrossRef]
- Sun, L.; Zhang, L.; Shen, G.; Wang, B.; Fang, B. Accuracy of cone-beam computed tomography in detecting alveolar bone dehiscences and fenestrations. Am. J. Orthod. Dentofac. Orthop. 2015, 147, 313–323. [Google Scholar] [CrossRef]
- Kan, J.Y.; Rungcharassaeng, K.; Sclar, A.; Lozada, J.L. Effects of the facial osseous defect morphology on gingival dynamics after immediate tooth replacement and guided bone regeneration: 1-year results. J. Oral Maxillofac. Surg. 2007, 65 (Suppl. 1), 13–19. [Google Scholar] [CrossRef]
- Jones, D.; Mannocci, F.; Andiappan, M.; Brown, J.; Patel, S. The effect of alteration of the exposure parameters of a cone-beam computed tomographic scan on the diagnosis of simulated horizontal root fractures. J. Endod. 2015, 41, 520–525. [Google Scholar] [CrossRef]
- Liljeholm, R.; Kadesjo, N.; Benchimol, D.; Hellen-Halme, K.; Shi, X.Q. Cone-beam computed tomography with ultra-low dose protocols for pre-implant radiographic assessment: An in vitro study. Eur. J. Oral Implantol. 2017, 10, 351–359. [Google Scholar]
- Yadav, S.; Palo, L.; Mahdian, M.; Upadhyay, M.; Tadinada, A. Diagnostic accuracy of 2 cone-beam computed tomography protocols for detecting arthritic changes in temporomandibular joints. Am. J. Orthod. Dentofac. Orthop. 2015, 147, 339–344. [Google Scholar] [CrossRef]
- Barausse, C.; Felice, P.; Pistilli, R.; Pellegrino, G.; Bonifazi, L.; Tayeb, S.; Fazio, A.; Marvi, M.V.; Manzoli, L.; Ratti, S. Anatomical Measurements of the Malar Bone for Safe Zygomatic Implant Placement: A Study on Donated Bodies. J. Clin. Med. 2024, 13, 6798. [Google Scholar] [CrossRef]
- Orsini, E.; Quaranta, M.; Ratti, S.; Mariani, G.A.; Mongiorgi, S.; Billi, A.M.; Manzoli, L. The whole body donation program at the university of Bologna: A report based on the experience of one of the oldest university in Western world. Ann. Anat. 2021, 234, 151660. [Google Scholar] [CrossRef] [PubMed]
- Yeung, A.W.K.; Jacobs, R.; Bornstein, M.M. Novel low-dose protocols using cone beam computed tomography in dental medicine: A review focusing on indications, limitations, and future possibilities. Clin. Oral Investig. 2019, 23, 2573–2581. [Google Scholar] [CrossRef] [PubMed]
- Mangano, F.G.; Hauschild, U.; Veronesi, G.; Imburgia, M.; Mangano, C.; Admakin, O. Trueness and precision of 5 intraoral scanners in the impressions of single and multiple implants: A comparative in vitro study. BMC Oral Health 2019, 19, 101. [Google Scholar] [CrossRef]
- Lee, J.H.; Yun, J.H.; Han, J.S.; Yeo, I.L.; Yoon, H.I. Repeatability of Intraoral Scanners for Complete Arch Scan of Partially Edentulous Dentitions: An In Vitro Study. J. Clin. Med. 2019, 8, 1187. [Google Scholar] [CrossRef]
- Ender, A.; Zimmermann, M.; Mehl, A. Accuracy of complete- and partial-arch impressions of actual intraoral scanning systems in vitro. Int. J. Comput. Dent. 2019, 22, 11–19. [Google Scholar]
- Jennes, M.E.; Soetebeer, M.; Beuer, F. In vivo full-arch accuracy of intraoral scanners: A narrative review. Int. J. Comput. Dent. 2022, 25, 9–16. [Google Scholar]
- Van Pham, K. Endodontic length measurements using cone beam computed tomography with dedicated or conventional software at different voxel sizes. Sci. Rep. 2021, 11, 9432. [Google Scholar] [CrossRef]
- Van Pham, K. Endodontic length measurements using 3D Endo, cone-beam computed tomography, and electronic apex locator. BMC Oral Health 2021, 21, 271. [Google Scholar] [CrossRef]
- Kamaruddin, N.; Daud, F.; Yusof, A.; Aziz, M.E.; Rajion, Z.A. Comparison of automatic airway analysis function of Invivo5 and Romexis software. PeerJ 2019, 7, e6319. [Google Scholar] [CrossRef]
- Sobral, D.S.; Duarte, D.W.; Dornelles, R.F.V.; Moraes, C.A.C. 3D Virtual Planning for Rhinoplasty Using a Free Add-On for Open-Source Software. Aesthet. Surg. J. 2021, 41, NP1024–NP1032. [Google Scholar] [CrossRef]
- Lee, M.; Ang, C.; Andreadis, K.; Shin, J.; Rameau, A. An Open-Source Three-Dimensionally Printed Laryngeal Model for Injection Laryngoplasty Training. Laryngoscope 2021, 131, E890–E895. [Google Scholar] [CrossRef] [PubMed]
- Hamilton, A.; Gonzaga, L.; Amorim, K.; Wittneben, J.G.; Martig, L.; Morton, D.; Martin, W.; Gallucci, G.O.; Wismeijer, D. Selection criteria for immediate implant placement and immediate loading for single tooth replacement in the maxillary esthetic zone: A systematic review and meta-analysis. Clin. Oral Implants Res. 2023, 34, 304–348. [Google Scholar] [CrossRef] [PubMed]
- Tonetti, M.S.; Jung, R.E.; Avila-Ortiz, G.; Blanco, J.; Cosyn, J.; Fickl, S.; Figuero, E.; Goldstein, M.; Graziani, F.; Madianos, P.; et al. Management of the extraction socket and timing of implant placement: Consensus report and clinical recommendations of group 3 of the XV European Workshop in Periodontology. J. Clin. Periodontol. 2019, 46, 183–194. [Google Scholar] [CrossRef] [PubMed]
- de Las Heras Gala, H.; Torresin, A.; Dasu, A.; Rampado, O.; Delis, H.; Giron, I.H.; Theodorakou, C.; Andersson, J.; Holroyd, J.; Nilsson, M.; et al. Quality control in cone-beam computed tomography (CBCT) EFOMP-ESTRO-IAEA protocol (summary report). Phys. Med. 2017, 39, 67–72. [Google Scholar] [CrossRef]


| Protocol Name | FOV (in mm) | Voltage (in kV) | Voxel (in µm) | Current (in mA) | Dose (in µSv) | Exposure Time (in s) |
|---|---|---|---|---|---|---|
| ENDO | 40 × 50 | 90 | 75 | 12 | 80–120 | 15 |
| A | 50 × 50 | 90 | 75 | 9 | 20–40 | 5 |
| B | 100 × 60 | 90 | 150 | 7.1 | 22–32 | 5 |
| C | 100 × 100 | 90 | 200 | 7.1 | 44 | 4 |
| Skull 1 | FDI region | 15 | 14 | 12 | 11 | 21 | 22 | 23 | 24 | 25 | ||
| Measured Surfaces in mm2 | IOS | 20.25 | 37.44 | 34.45 | 20.17 | 24.90 | 31.68 | 43.09 | 20.42 | 21.93 | ||
| ENDO | 20.38 | 37.72 | 34.59 | 20.28 | 25.00 | 31.43 | 43.36 | 20.82 | 21.89 | |||
| Protocol A | 20.06 | 37.15 | 34.62 | 20.12 | 23.60 | 31.90 | 42.69 | 21.24 | 21.68 | |||
| Protocol B | 19.27 | 37.14 | 33.00 | 19.40 | 23.94 | 30.71 | 42.22 | 20.22 | 20.37 | |||
| Protocol C | 19.93 | 37.39 | 32.89 | 17.85 | 21.61 | 29.51 | 42.33 | 22.06 | 21.30 | |||
| FDI region | 45 | 44 | 43 | 42 | 41 | 31 | 32 | 33 | 34 | 35 | ||
| Measured Surfaces in mm2 | IOS | 22.26 | 11.43 | 30.94 | 19.61 | 17.43 | 19.14 | 22.35 | 24.97 | 7.51 | 18.15 | |
| ENDO | 22.45 | 11.02 | 31.00 | 19.65 | 17.27 | 19.73 | 22.08 | 24.73 | 6.94 | 18.74 | ||
| Protocol A | 22.54 | 11.77 | 30.94 | 19.92 | 17.57 | 19.93 | 21.86 | 24.75 | 7.75 | 17.13 | ||
| Protocol B | 21.21 | 11.00 | 27.77 | 17.98 | 16.81 | 19.76 | 22.69 | 23.93 | 7.57 | 16.24 | ||
| Protocol C | 20.97 | 9.97 | 28.54 | 17.79 | 17.75 | 19.35 | 22.46 | 24.48 | 6.09 | 16.51 | ||
| Skull 2 | FDI region | 14 | 13 | 12 | 11 | 21 | 22 | 23 | 24 | |||
| Measured Surfaces in mm2 | IOS | 14.28 | 22.59 | 19.86 | 15.96 | 15.48 | 17.29 | 18.44 | 14.83 | |||
| ENDO | 14.31 | 22.94 | 20.32 | 15.60 | 15.65 | 17.39 | 17.95 | 15.09 | ||||
| Protocol A | 14.28 | 22.89 | 19.96 | 15.70 | 15.85 | 17.69 | 17.29 | 15.27 | ||||
| Protocol B | 14.13 | 23.49 | 19.32 | 15.18 | 14.79 | 16.06 | 16.29 | 14.54 | ||||
| Protocol C | 15.21 | 24.18 | 19.01 | 15.34 | 15.39 | 16.66 | 18.46 | 14.71 | ||||
| FDI region | 44 | 43 | 42 | 41 | 31 | 32 | 33 | 34 | ||||
| Measured Surfaces in mm2 | IOS | 10.42 | 15.69 | 16.59 | 13.13 | 16.55 | 19.29 | 25.82 | 11.49 | |||
| ENDO | 10.59 | 15.28 | 16.13 | 12.81 | 16.24 | 19.72 | 26.02 | 11.75 | ||||
| Protocol A | 10.86 | 15.43 | 16.64 | 13.59 | 16.69 | 19.99 | 26.29 | 11.28 | ||||
| Protocol B | 10.30 | 14.90 | 16.47 | 12.85 | 16.11 | 19.02 | 26.07 | 11.78 | ||||
| Protocol C | 9.57 | 15.34 | 17.39 | 15.47 | 15.80 | 18.47 | 25.16 | 13.18 | ||||
| Skull 3 | FDI region | 13 | 12 | 11 | 21 | 22 | 23 | 24 | ||||
| Measured Surfaces in mm2 | IOS | 13.71 | 11.25 | 11.70 | 20.90 | 10.10 | 20.04 | 14.46 | ||||
| ENDO | 13.50 | 11.26 | 11.90 | 20.47 | 10.06 | 19.71 | 14.42 | |||||
| Protocol A | 13.31 | 10.83 | 11.94 | 20.58 | 9.61 | 19.77 | 14.33 | |||||
| Protocol B | 12.43 | 11.71 | 11.83 | 21.08 | 10.33 | 20.56 | 13.75 | |||||
| Protocol C | 12.53 | 11.01 | 11.30 | 19.33 | 9.58 | 21.24 | 14.53 | |||||
| FDI region | 45 | 44 | 43 | 42 | 41 | 31 | 32 | 33 | 34 | 35 | ||
| Measured Surfaces in mm2 | IOS | 12.82 | 26.22 | 15.18 | 7.72 | 15.04 | 26.40 | 6.89 | 30.78 | 22.41 | 9.07 | |
| ENDO | 12.59 | 26.61 | 14.92 | 7.47 | 15.06 | 26.06 | 6.88 | 30.43 | 22.40 | 9.30 | ||
| Protocol A | 12.70 | 27.02 | 14.46 | 7.85 | 14.95 | 26.71 | 6.05 | 29.98 | 22.91 | 9.01 | ||
| Protocol B | 12.07 | 27.15 | 14.42 | 6.77 | 15.18 | 26.83 | 6.89 | 29.69 | 22.23 | 8.63 | ||
| Protocol C | 11.40 | 29.06 | 14.06 | 6.94 | 14.66 | 26.07 | 5.82 | 29.43 | 21.79 | 8.42 | ||
| Skull 4 | FDI region | 15 | 14 | 13 | 11 | 21 | 22 | 23 | 24 | 25 | ||
| Measured Surfaces in mm2 | IOS | 15.86 | 15.05 | 21.73 | 24.24 | 27.27 | 19.70 | 29.42 | 13.30 | 10.28 | ||
| ENDO | 15.87 | 15.03 | 21.56 | 23.88 | 27.10 | 19.45 | 29.49 | 13.40 | 10.02 | |||
| Protocol A | 15.38 | 15.32 | 20.67 | 22.84 | 26.77 | 19.00 | 29.95 | 13.28 | 10.00 | |||
| Protocol B | 15.80 | 15.21 | 20.61 | 22.37 | 26.32 | 18.13 | 30.26 | 13.04 | 9.86 | |||
| Protocol C | 15.64 | 16.39 | 21.51 | 22.57 | 25.44 | 18.08 | 30.25 | 14.20 | 9.22 | |||
| FDI region | 43 | 42 | 31 | 32 | 33 | |||||||
| Measured Surfaces in mm2 | IOS | 16.56 | 13.71 | 12.68 | 15.37 | 44.31 | ||||||
| ENDO | 16.22 | 13.57 | 12.49 | 15.18 | 44.31 | |||||||
| Protocol A | 16.53 | 13.92 | 12.73 | 14.85 | 44.75 | |||||||
| Protocol B | 17.54 | 12.92 | 13.15 | 14.81 | 44.44 | |||||||
| Protocol C | 16.02 | 12.47 | 13.41 | 14.53 | 44.94 |
| p-Value | Mean (in mm2) | Min. (in mm2) | Max. (in mm2) | |
|---|---|---|---|---|
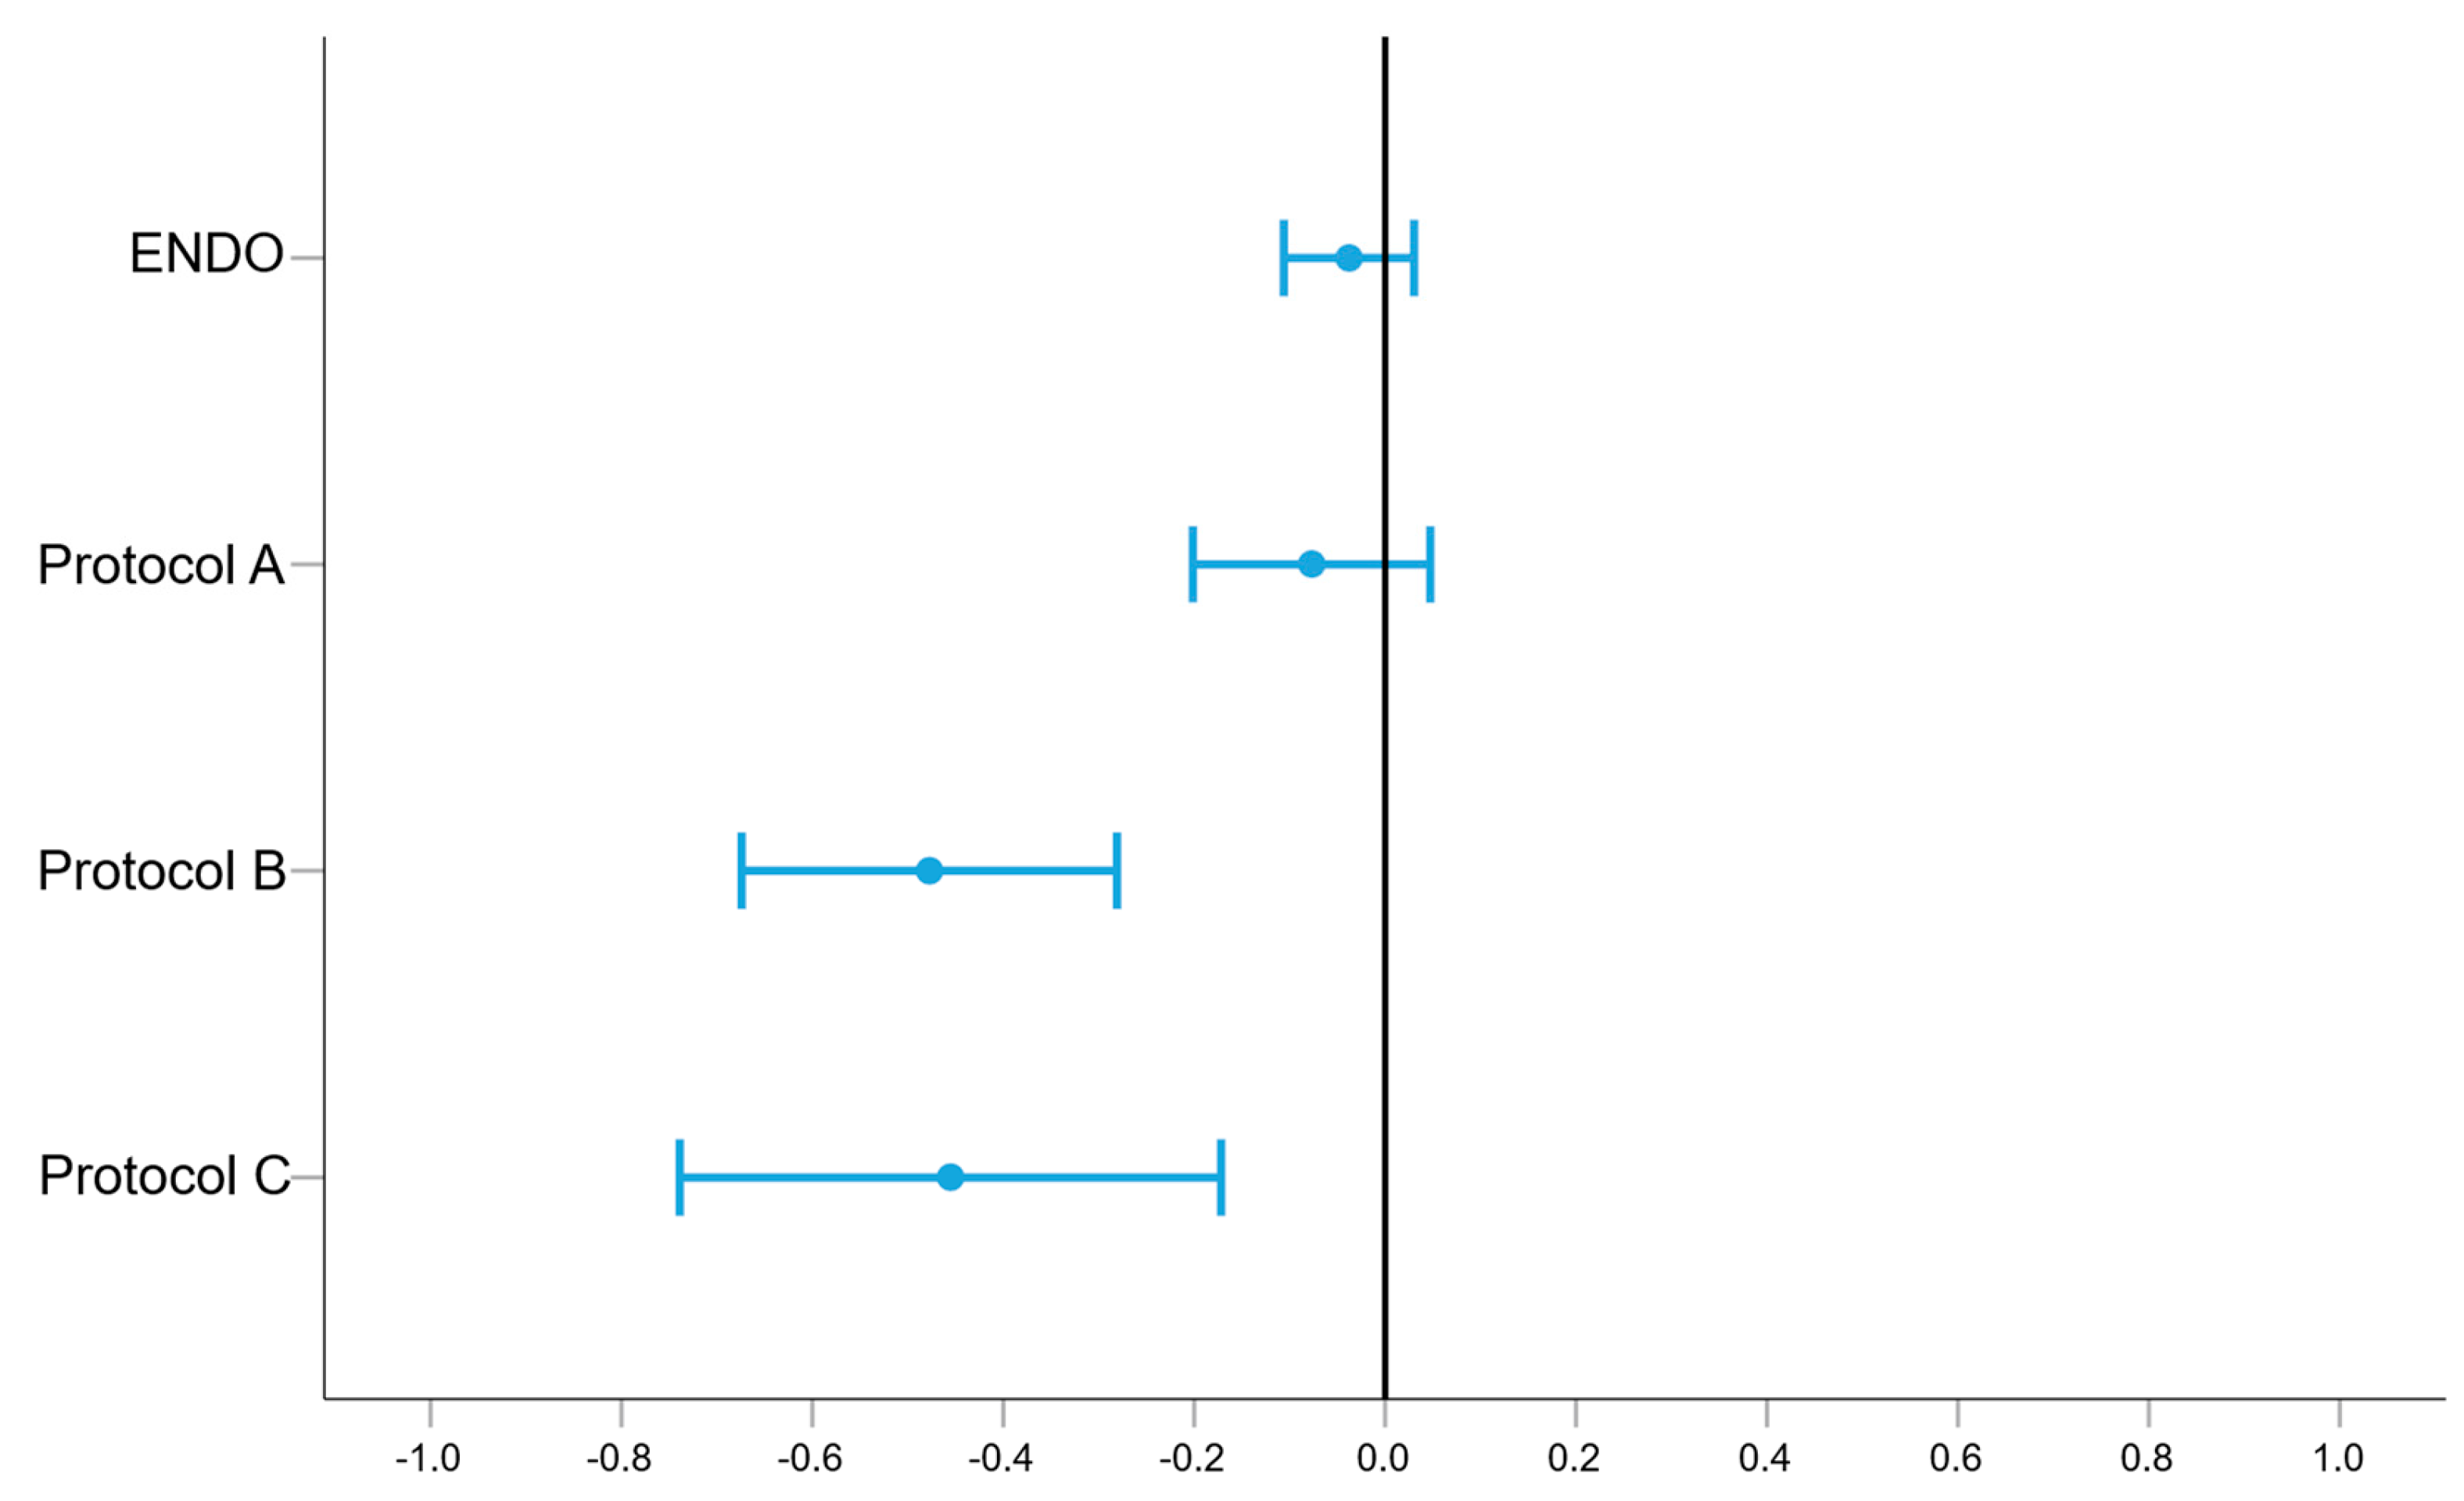
| ENDO | 0.271 | −0.038 | −0.106 | 0.030 |
| A | 0.220 | −0.077 | −0.201 | 0.047 |
| B | 0.000 | −0.477 | −0.674 | −0.281 |
| C | 0.002 | −0.455 | −0.739 | −0.172 |
| Limits of Agreement (in mm2) | p-Values (of t-Tests) | |
|---|---|---|
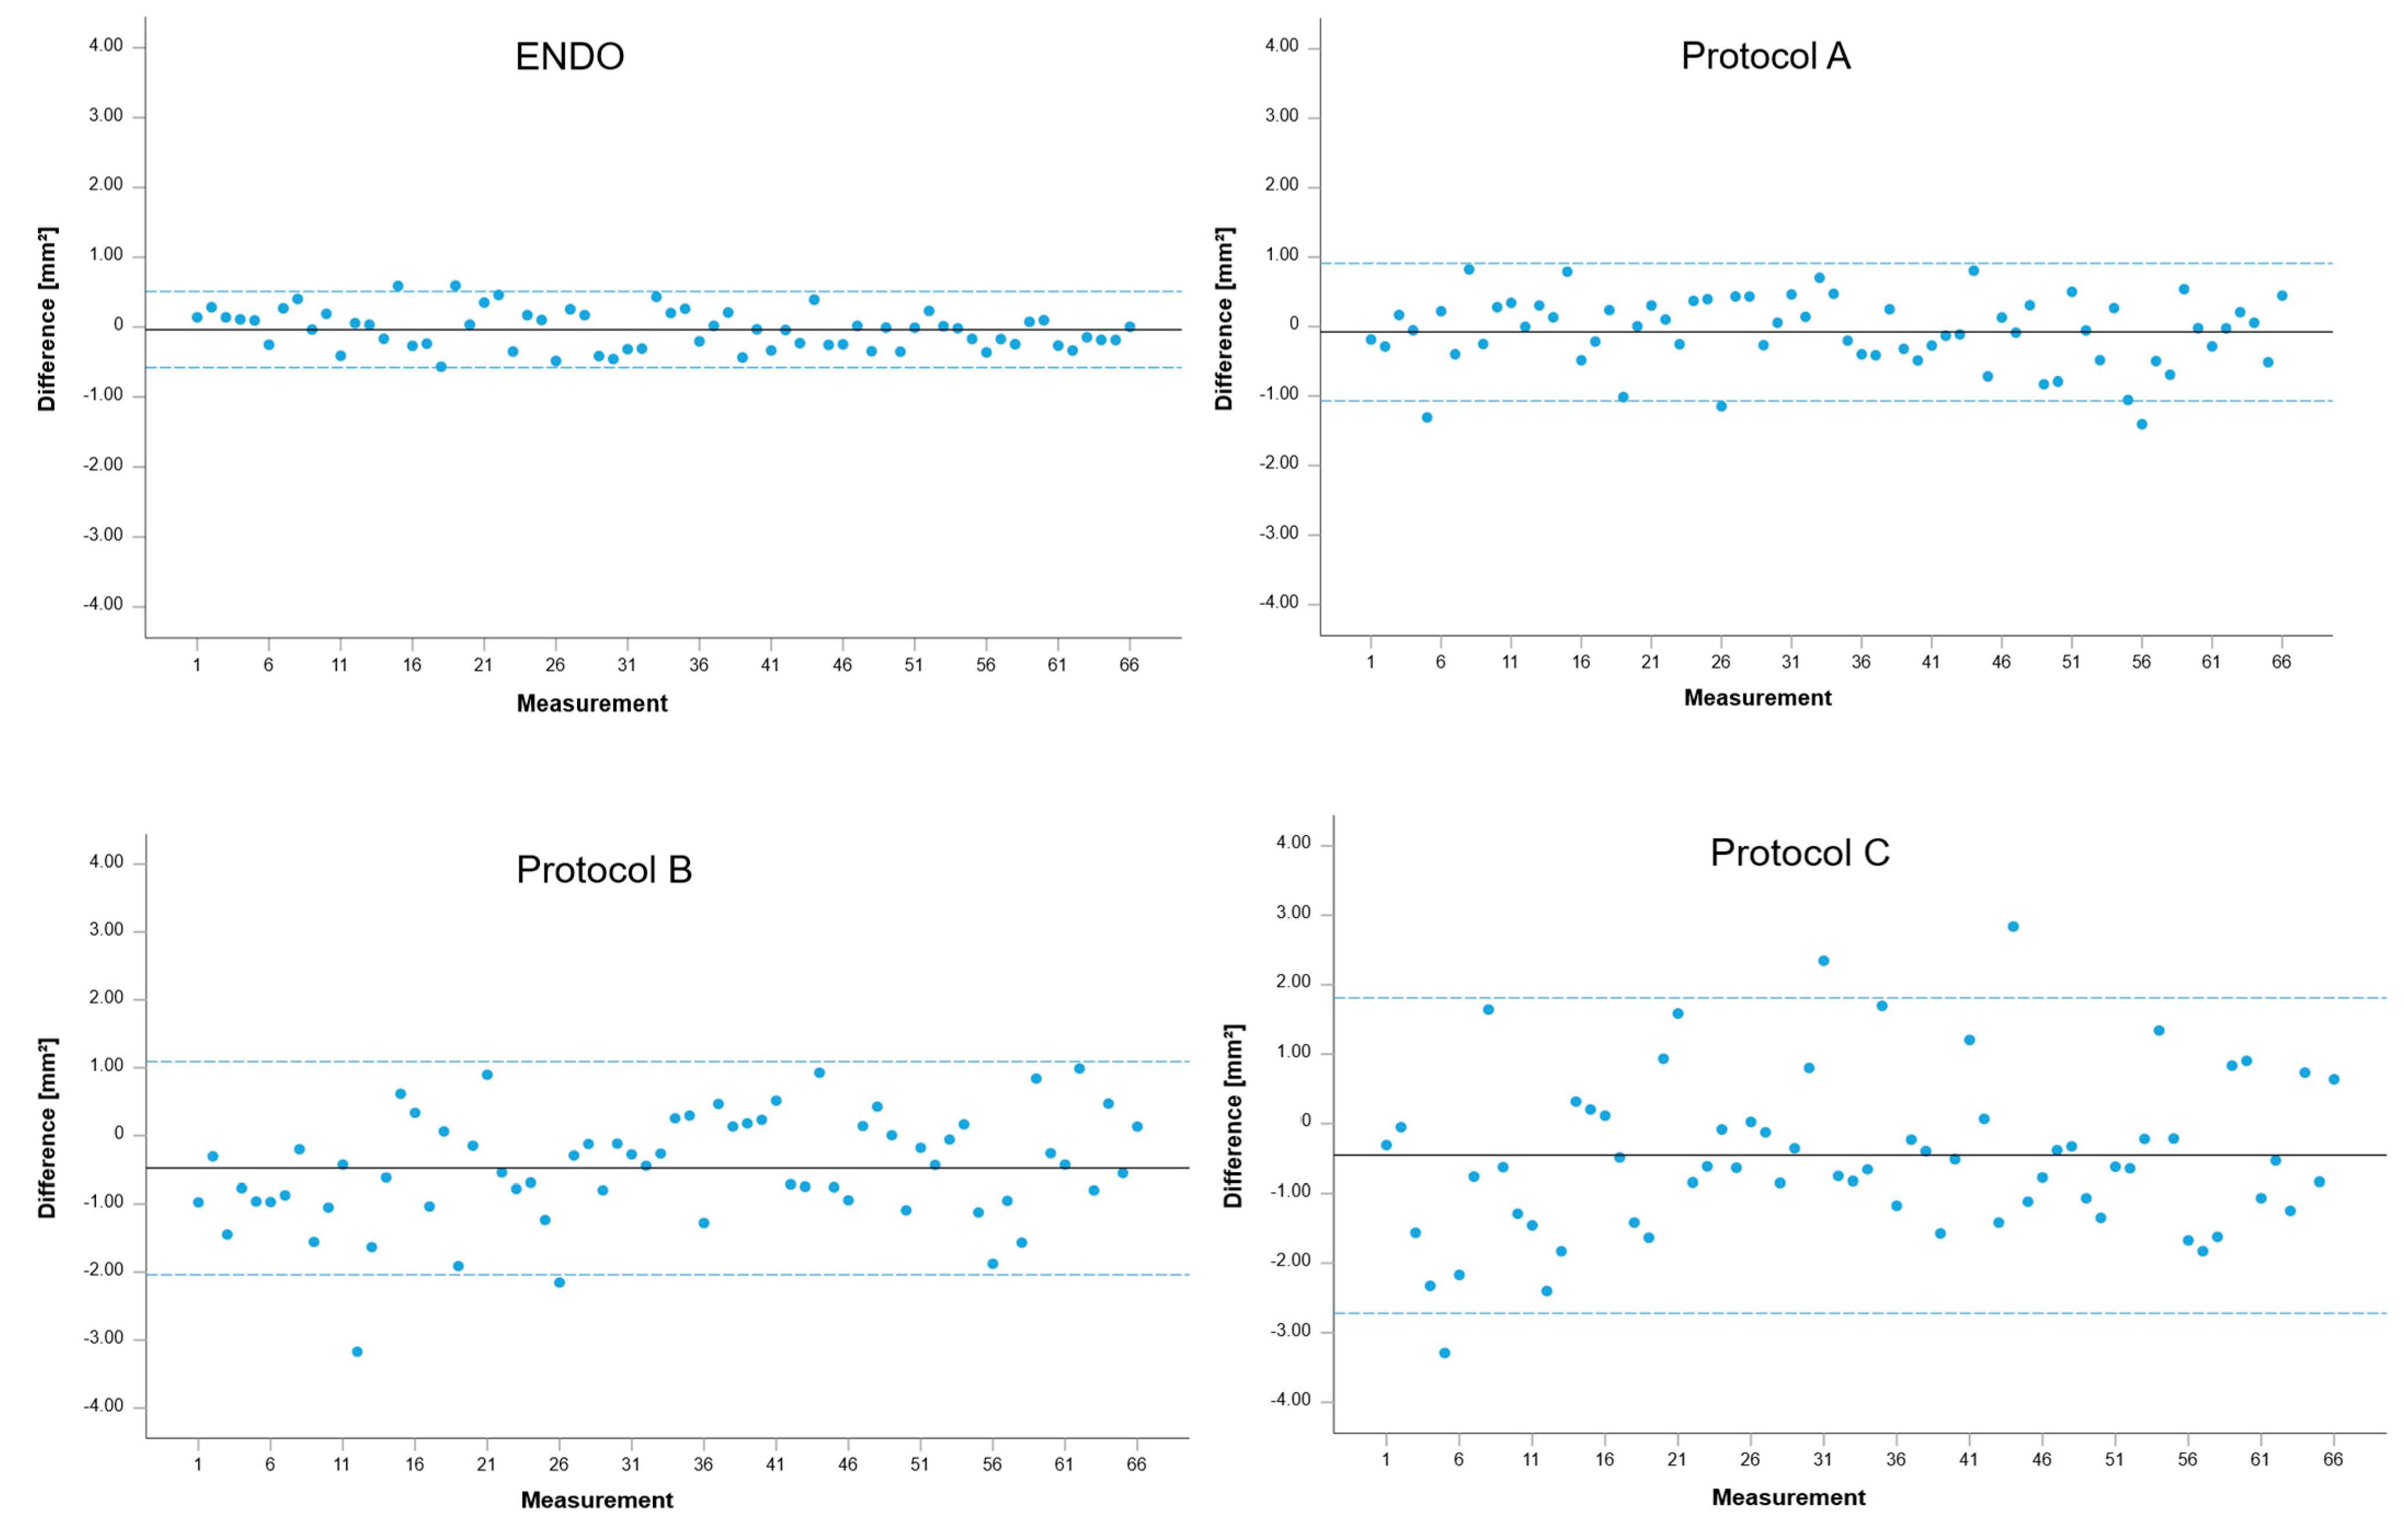
| ENDO | −0.58–0.51 | 0.271 |
| A | −1.07–0.91 | 0.220 |
| B | −2.04–1.09 | 0.000 |
| C | −2.72–1.81 | 0.002 |
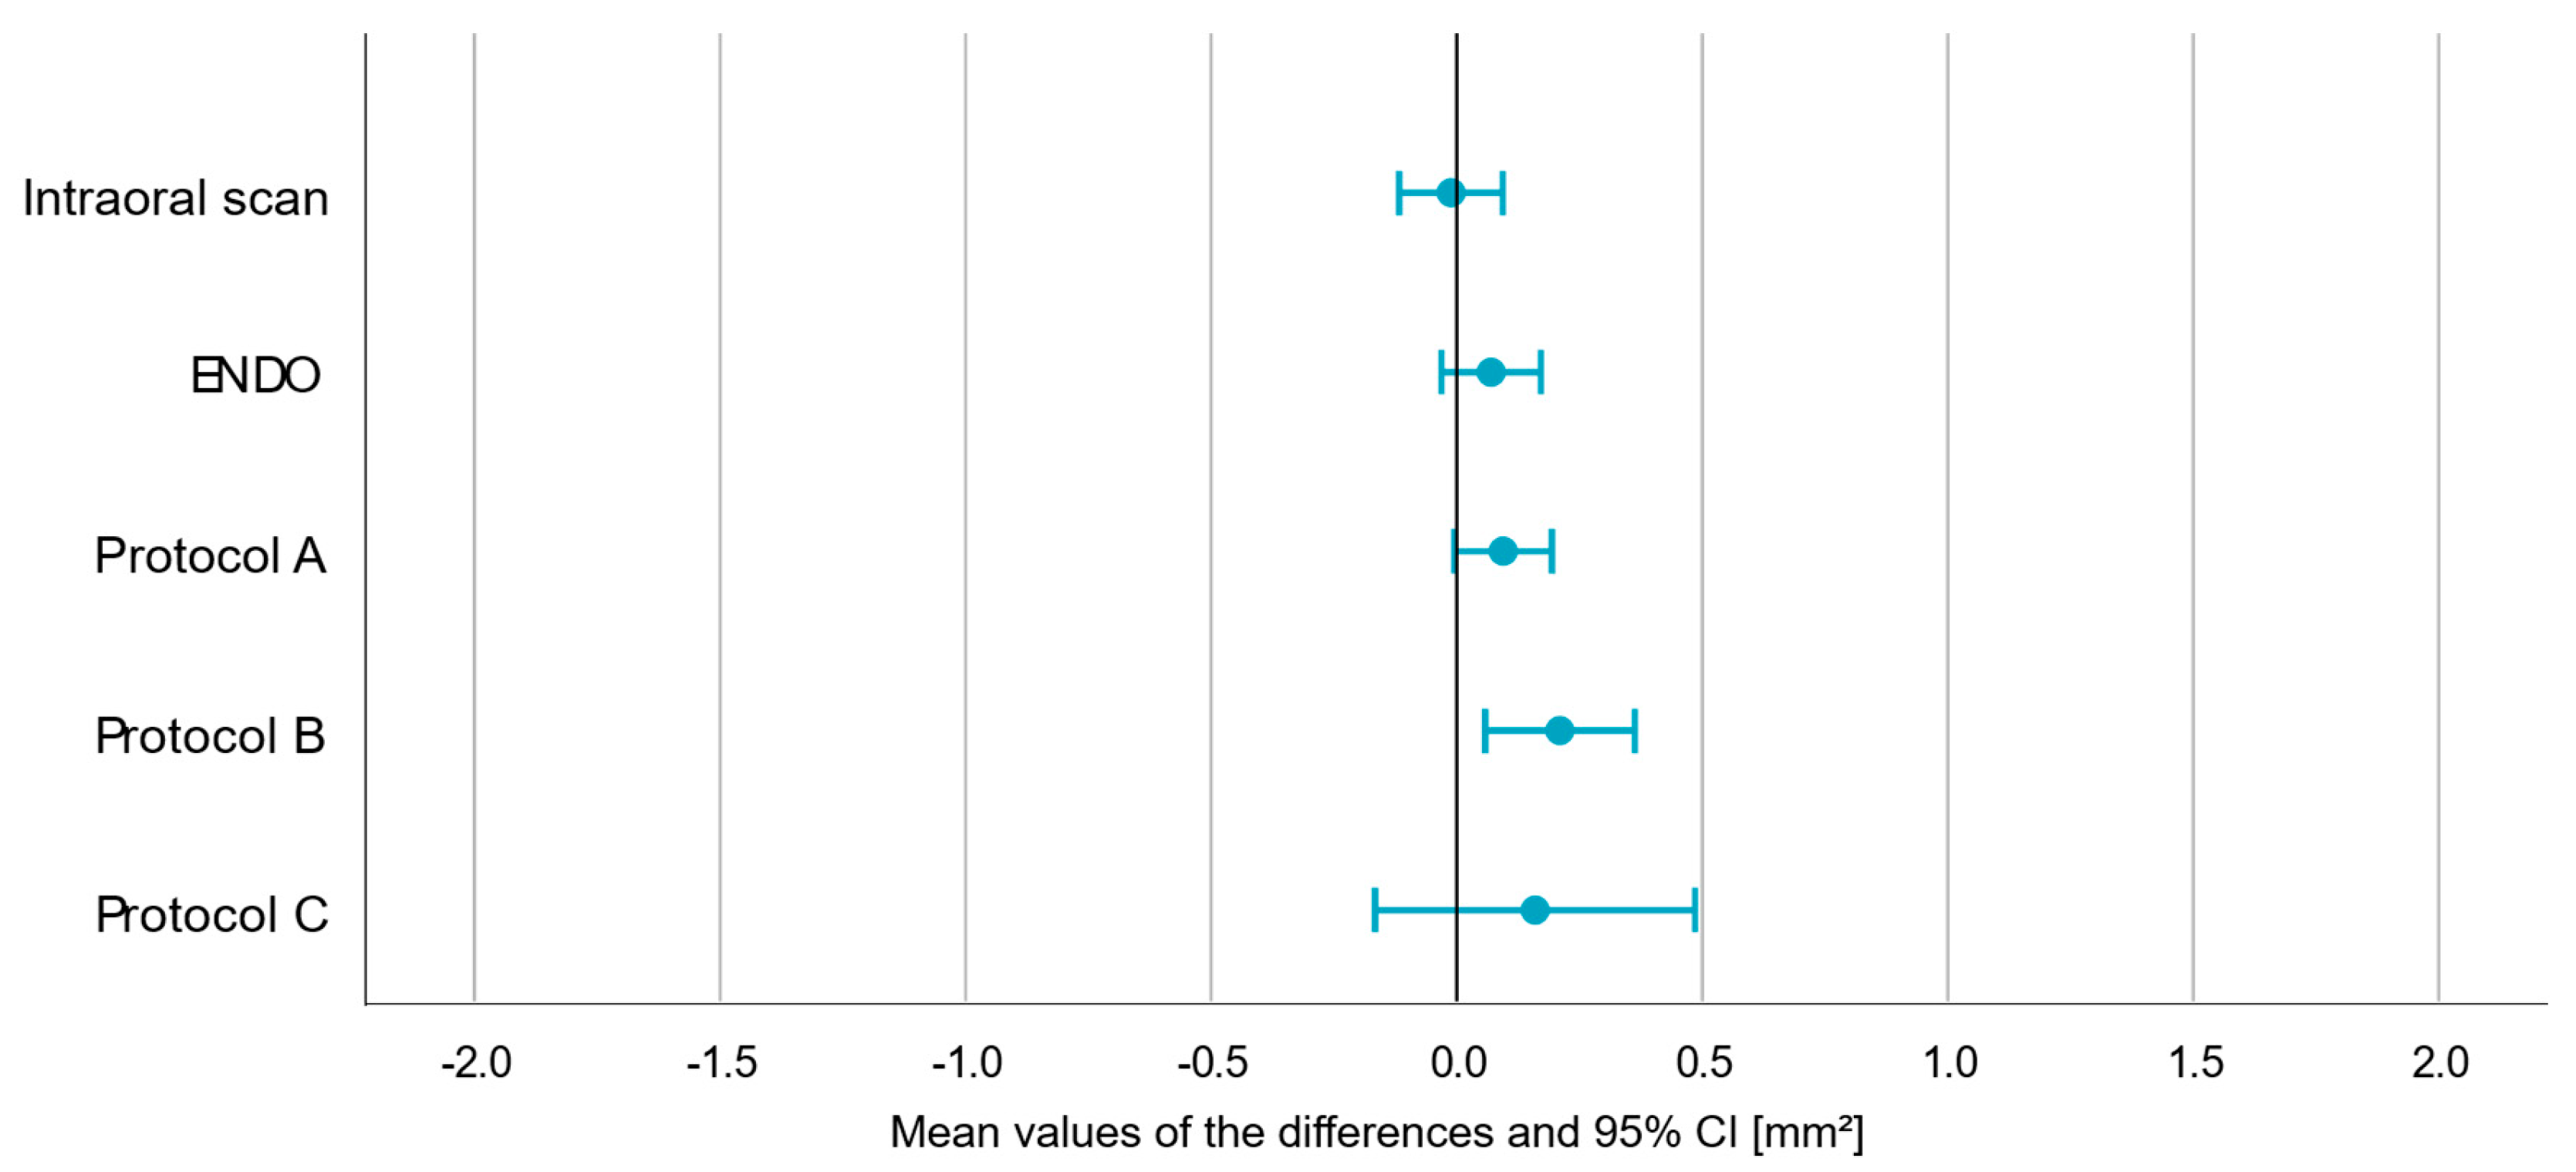
| p-Value | Mean (in mm2) | Min. (in mm2) | Max. (in mm2) | |
|---|---|---|---|---|
| IOS | 0.829 | −0.011 | −0.117 | 0.094 |
| ENDO | 0.165 | 0.070 | −0.031 | 0.172 |
| A | 0.062 | 0.095 | −0.005 | 0.194 |
| B | 0.008 | 0.211 | 0.058 | 0.363 |
| C | 0.324 | 0.160 | −0.165 | 0.485 |
| Limits of Agreement (in mm2) | p-Values (of t-Tests) | |
|---|---|---|
| IOS | −0.58–0.56 | 0.829 |
| ENDO | −0.48–0.62 | 0.165 |
| A | −0.45–0.64 | 0.062 |
| B | −0.62–1.04 | 0.008 |
| C | −1.61–1.93 | 0.324 |
Disclaimer/Publisher’s Note: The statements, opinions and data contained in all publications are solely those of the individual author(s) and contributor(s) and not of MDPI and/or the editor(s). MDPI and/or the editor(s) disclaim responsibility for any injury to people or property resulting from any ideas, methods, instructions or products referred to in the content. |
© 2025 by the authors. Licensee MDPI, Basel, Switzerland. This article is an open access article distributed under the terms and conditions of the Creative Commons Attribution (CC BY) license (https://creativecommons.org/licenses/by/4.0/).
Share and Cite
Böse, M.W.H.; Buchholz, J.; Beuer, F.; Pieralli, S.; Bumann, A. Evaluation of Ultra-Low-Dose CBCT Protocols to Investigate Vestibular Bone Defects in the Context of Immediate Implant Planning: An Ex Vivo Study on Cadaver Skulls. J. Clin. Med. 2025, 14, 4196. https://doi.org/10.3390/jcm14124196
Böse MWH, Buchholz J, Beuer F, Pieralli S, Bumann A. Evaluation of Ultra-Low-Dose CBCT Protocols to Investigate Vestibular Bone Defects in the Context of Immediate Implant Planning: An Ex Vivo Study on Cadaver Skulls. Journal of Clinical Medicine. 2025; 14(12):4196. https://doi.org/10.3390/jcm14124196
Chicago/Turabian StyleBöse, Mats Wernfried Heinrich, Jonas Buchholz, Florian Beuer, Stefano Pieralli, and Axel Bumann. 2025. "Evaluation of Ultra-Low-Dose CBCT Protocols to Investigate Vestibular Bone Defects in the Context of Immediate Implant Planning: An Ex Vivo Study on Cadaver Skulls" Journal of Clinical Medicine 14, no. 12: 4196. https://doi.org/10.3390/jcm14124196
APA StyleBöse, M. W. H., Buchholz, J., Beuer, F., Pieralli, S., & Bumann, A. (2025). Evaluation of Ultra-Low-Dose CBCT Protocols to Investigate Vestibular Bone Defects in the Context of Immediate Implant Planning: An Ex Vivo Study on Cadaver Skulls. Journal of Clinical Medicine, 14(12), 4196. https://doi.org/10.3390/jcm14124196