
Predictors of Mortality in Medical ICU Patients: A Retrospective Study in a Tertiary Care Center in Jordan
 , , ,
, , ,  , , , and
Abstract
1. Introduction
2. Materials and Methods
2.1. Study Design and Setting
2.2. Study Population
- Patient demographics: Age, gender.
- Comorbidities: Diabetes mellitus, Hypertension, Chronic Kidney Disease, liver cirrhosis, Ischemic Heart Disease, Heart Failure, chronic obstructive pulmonary disease, Asthma, obstructive sleep apnea.
- Date of Emergency department and ICU admission.
- ICU stay duration.
- Primary and secondary diagnosis: Respiratory Failure Type 1, “also known as Hypoxemic Respiratory Failure, which defined as inadequate oxygenation of hemoglobin”; Respiratory Failure Type 2, “also known as Hypercapnic Respiratory Failure, it occurs when alveolar ventilation is inadequate to clear CO2 produced by cellular metabolism and the level of CO2 increases in blood”; pneumonia (hospital-acquired pneumonia or community-acquired pneumonia); Stroke; Non-ST Elevation Myocardial Infarction; Upper Gastrointestinal Bleeding; acute kidney injury; decompensated liver cirrhosis, “It’s defined as patient with liver cirrhosis who have developed complications of cirrhosis, such as variceal hemorrhage, ascites, spontaneous bacterial peritonitis, hepatocellular carcinoma, hepatorenal syndrome, or hepatopulmonary syndrome”; Diabetic Ketoacidosis; Acute Respiratory Distress Syndrome, “Which defined as is an acute, diffuse, inflammatory form of lung injury that is associated with a variety of etiologies”; Acute Decompensated Heart Failure, “It’s a clinical syndrome of new or worsening signs and symptoms of HF that often lead to hospitalization or an emergency department visit”; urosepsis, “It’s a life-threatening organ dysfunction caused by a dysregulated host response to urinary tract infection”; Acute Liver Failure, “which defined as acute liver injury, hepatic encephalopathy (altered mental status), and an elevated prothrombin time/international normalized ratio (INR)”; Severe Asthma Exacerbation; Acute Pancreatitis; and others.
- Administration of vasopressors in the Emergency department.
- Whether the patient was intubated before ICU admission.
- Glasgow Coma Scale (GCS);
- Initial laboratory findings (hemoglobin and creatinine levels);
- Acute Physiology;
- Chronic Health Evaluation (APACHE) II score.
2.3. Ethical Approval
2.4. Statistical Analysis
3. Results
4. Discussion
5. Conclusions
Author Contributions
Funding
Institutional Review Board Statement
Data Availability Statement
Conflicts of Interest
Abbreviations
| ICU | Intensive Care Unit |
| APACHE | Acute Physiology and Chronic Health Evaluation |
| Emergency department | Accident and Emergency |
| GCS | Glasgow Coma Scale |
| AKI | Acute kidney injury |
| JUH | Jordan University Hospital |
| LOS | length of stay |
| HTN | Hypertension |
| DM | Diabetes mellitus |
| COPD | Chronic obstructive pulmonary disease |
| OSA | Obstructive sleep apnea |
| HAP | Hospital-acquired pneumonia |
| CAP | Community-acquired pneumonia |
| Hb | Hemoglobin |
| SD | Standard deviation |
| OR | Odds ratio |
| CI | Confidence interval |
| COVID-19 | Coronavirus disease of 2019 |
| AUROC | Area under the receiver operator characteristic curve |
Appendix A

| Admitted Through ER | |||||
|---|---|---|---|---|---|
| Characteristic | Overall, N = 1323 1 | Missing | No N = 308 1 | Yes N = 995 1 | p-Value 2 |
| Patient age | 65 (17) | 0 (0%) | 64 (17) | 65 (17) | 0.2 |
| Patient gender | 0 (0%) | 0.024 | |||
| Female | 608 (47%) | 161 (26%) | 447 (74%) | ||
| Male | 695 (53%) | 147 (21%) | 548 (79%) | ||
| Delay of admission | 18 (15) | 0 (0%) | 11 (11) | 20 (16) | <0.001 |
| Admission delay > 6 h | 0 (0%) | <0.001 | |||
| No | 298 (23%) | 135 (45%) | 163 (55%) | ||
| Yes | 1005 (77%) | 173 (17%) | 832 (83%) | ||
| ICU stay duration | 160 (174) | 0 (0%) | 253 (213) | 130 (149) | <0.001 |
| Pneumonia | 0 (0%) | 0.061 | |||
| CAP | 165 (13%) | 38 (23%) | 127 (77%) | ||
| HAP | 150 (12%) | 47 (31%) | 103 (69%) | ||
| No | 988 (76%) | 223 (23%) | 765 (77%) | ||
| DM | 0 (0%) | 0.14 | |||
| No | 642 (49%) | 163 (25%) | 479 (75%) | ||
| Yes | 661 (51%) | 145 (22%) | 516 (78%) | ||
| HTN | 0 (0%) | 0.010 | |||
| No | 519 (40%) | 142 (27%) | 377 (73%) | ||
| Yes | 784 (60%) | 166 (21%) | 618 (79%) | ||
| CKD | 0 (0%) | 0.6 | |||
| No | 940 (72%) | 226 (24%) | 714 (76%) | ||
| Yes | 363 (28%) | 82 (23%) | 281 (77%) | ||
| Liver cirrhosis | 0 (0%) | 0.5 | |||
| No | 1239 (95%) | 295 (24%) | 944 (76%) | ||
| Yes | 64 (4.9%) | 13 (20%) | 51 (80%) | ||
| IHD | 0 (0%) | 0.8 | |||
| No | 985 (76%) | 231 (23%) | 754 (77%) | ||
| Yes | 318 (24%) | 77 (24%) | 241 (76%) | ||
| Heart Failure | 0 (0%) | 0.8 | |||
| No | 980 (75%) | 233 (24%) | 747 (76%) | ||
| Yes | 323 (25%) | 75 (23%) | 248 (77%) | ||
| COPD/Asthma | 0 (0%) | 0.4 | |||
| No | 1136 (87%) | 264 (23%) | 872 (77%) | ||
| Yes | 167 (13%) | 44 (26%) | 123 (74%) | ||
| OSA | 0 (0%) | 0.6 | |||
| No | 1230 (94%) | 289 (23%) | 941 (77%) | ||
| Yes | 73 (5.6%) | 19 (26%) | 54 (74%) | ||
| GCS | 13.84 (2.73) | 6 (0.5%) | 14.57 (1.75) | 13.62 (2.93) | <0.001 |
| On vasopressor | 0 (0%) | <0.001 | |||
| No | 1018 (78%) | 290 (28%) | 728 (72%) | ||
| Yes | 285 (22%) | 18 (6.3%) | 267 (94%) | ||
| Intubated | 0 (0%) | 0.005 | |||
| No | 1198 (92%) | 295 (25%) | 903 (75%) | ||
| Yes | 105 (8.1%) | 13 (12%) | 92 (88%) | ||
| Mortality | 0 (0%) | 0.003 | |||
| No | 861 (66%) | 182 (21%) | 679 (79%) | ||
| Yes | 442 (34%) | 126 (29%) | 316 (71%) | ||
| Hb | 11.29 (2.81) | 2 (0.2%) | 11.22 (2.61) | 11.31 (2.87) | 0.5 |
| Cr | 2.36 (2.94) | 5 (0.4%) | 1.70 (1.76) | 2.56 (3.19) | <0.001 |
| APACHE score | 16 (8) | 419 (32%) | 15 (8) | 17 (7) | <0.001 |
| GCS score | 6 (0.5%) | 0.002 | |||
| 8 or more | 1224 (94%) | 299 (24%) | 925 (76%) | ||
| Less than 8 | 73 (5.6%) | 6 (8.2%) | 67 (92%) | ||
| Main diagnosis: Pneumonia | 0 (0%) | 0.10 | |||
| No | 1033 (79%) | 234 (23%) | 799 (77%) | ||
| Yes | 270 (21%) | 74 (27%) | 196 (73%) | ||
| Main diagnosis: Urosepsis | 0 (0%) | 0.004 | |||
| No | 1165 (89%) | 289 (25%) | 876 (75%) | ||
| Yes | 138 (11%) | 19 (14%) | 119 (86%) | ||
| Main diagnosis: Urosepsis type | 0 (0%) | 0.014 | |||
| No | 1165 (89%) | 289 (25%) | 876 (75%) | ||
| Not catheter associated | 72 (5.5%) | 11 (15%) | 61 (85%) | ||
| Catheter associated | 66 (5.1%) | 8 (12%) | 58 (88%) | ||
| Main diagnosis: AKI | 0 (0%) | <0.001 | |||
| No | 1185 (91%) | 296 (25%) | 889 (75%) | ||
| Yes | 118 (9.1%) | 12 (10%) | 106 (90%) | ||
| Main diagnosis: RF Type 2 | 0 (0%) | 0.024 | |||
| No | 1206 (93%) | 276 (23%) | 930 (77%) | ||
| Yes | 97 (7.4%) | 32 (33%) | 65 (67%) | ||
| Main diagnosis: UGIB | 0 (0%) | <0.001 | |||
| No | 1231 (94%) | 303 (25%) | 928 (75%) | ||
| Yes | 72 (5.5%) | 5 (6.9%) | 67 (93%) | ||
| Main diagnosis: Stroke | 0 (0%) | 0.2 | |||
| No | 1242 (95%) | 298 (24%) | 944 (76%) | ||
| Yes | 61 (4.7%) | 10 (16%) | 51 (84%) | ||
| Main diagnosis: NSTEMI | 0 (0%) | 0.010 | |||
| No | 1267 (97%) | 306 (24%) | 961 (76%) | ||
| Yes | 36 (2.8%) | 2 (5.6%) | 34 (94%) | ||
| Main diagnosis: ADHF | 0 (0%) | 0.4 | |||
| No | 1269 (97%) | 298 (23%) | 971 (77%) | ||
| Yes | 34 (2.6%) | 10 (29%) | 24 (71%) | ||
| 2nd diagnosis: AKI | 0 (0%) | 0.2 | |||
| No | 1195 (92%) | 277 (23%) | 918 (77%) | ||
| Yes | 108 (8.3%) | 31 (29%) | 77 (71%) | ||
| 2nd diagnosis: Pneumonia | 0 (0%) | 0.9 | |||
| No | 1259 (97%) | 298 (24%) | 961 (76%) | ||
| Yes | 44 (3.4%) | 10 (23%) | 34 (77%) | ||
| 2nd diagnosis: Urosepsis | 0 (0%) | 0.2 | |||
| No | 1275 (98%) | 304 (24%) | 971 (76%) | ||
| Yes | 28 (2.1%) | 4 (14%) | 24 (86%) | ||
| 2nd diagnosis: ADHF | 0 (0%) | 0.053 | |||
| No | 1277 (98%) | 306 (24%) | 971 (76%) | ||
| Yes | 26 (2.0%) | 2 (7.7%) | 24 (92%) | ||
| 2nd diagnosis: RF Type 2 | 0 (0%) | 0.078 | |||
| No | 1280 (98%) | 299 (23%) | 981 (77%) | ||
| Yes | 23 (1.8%) | 9 (39%) | 14 (61%) | ||
| Urosepsis: Primary or secondary | 0 (0%) | 0.001 | |||
| No | 1137 (87%) | 285 (25%) | 852 (75%) | ||
| Yes | 166 (13%) | 23 (14%) | 143 (86%) | ||
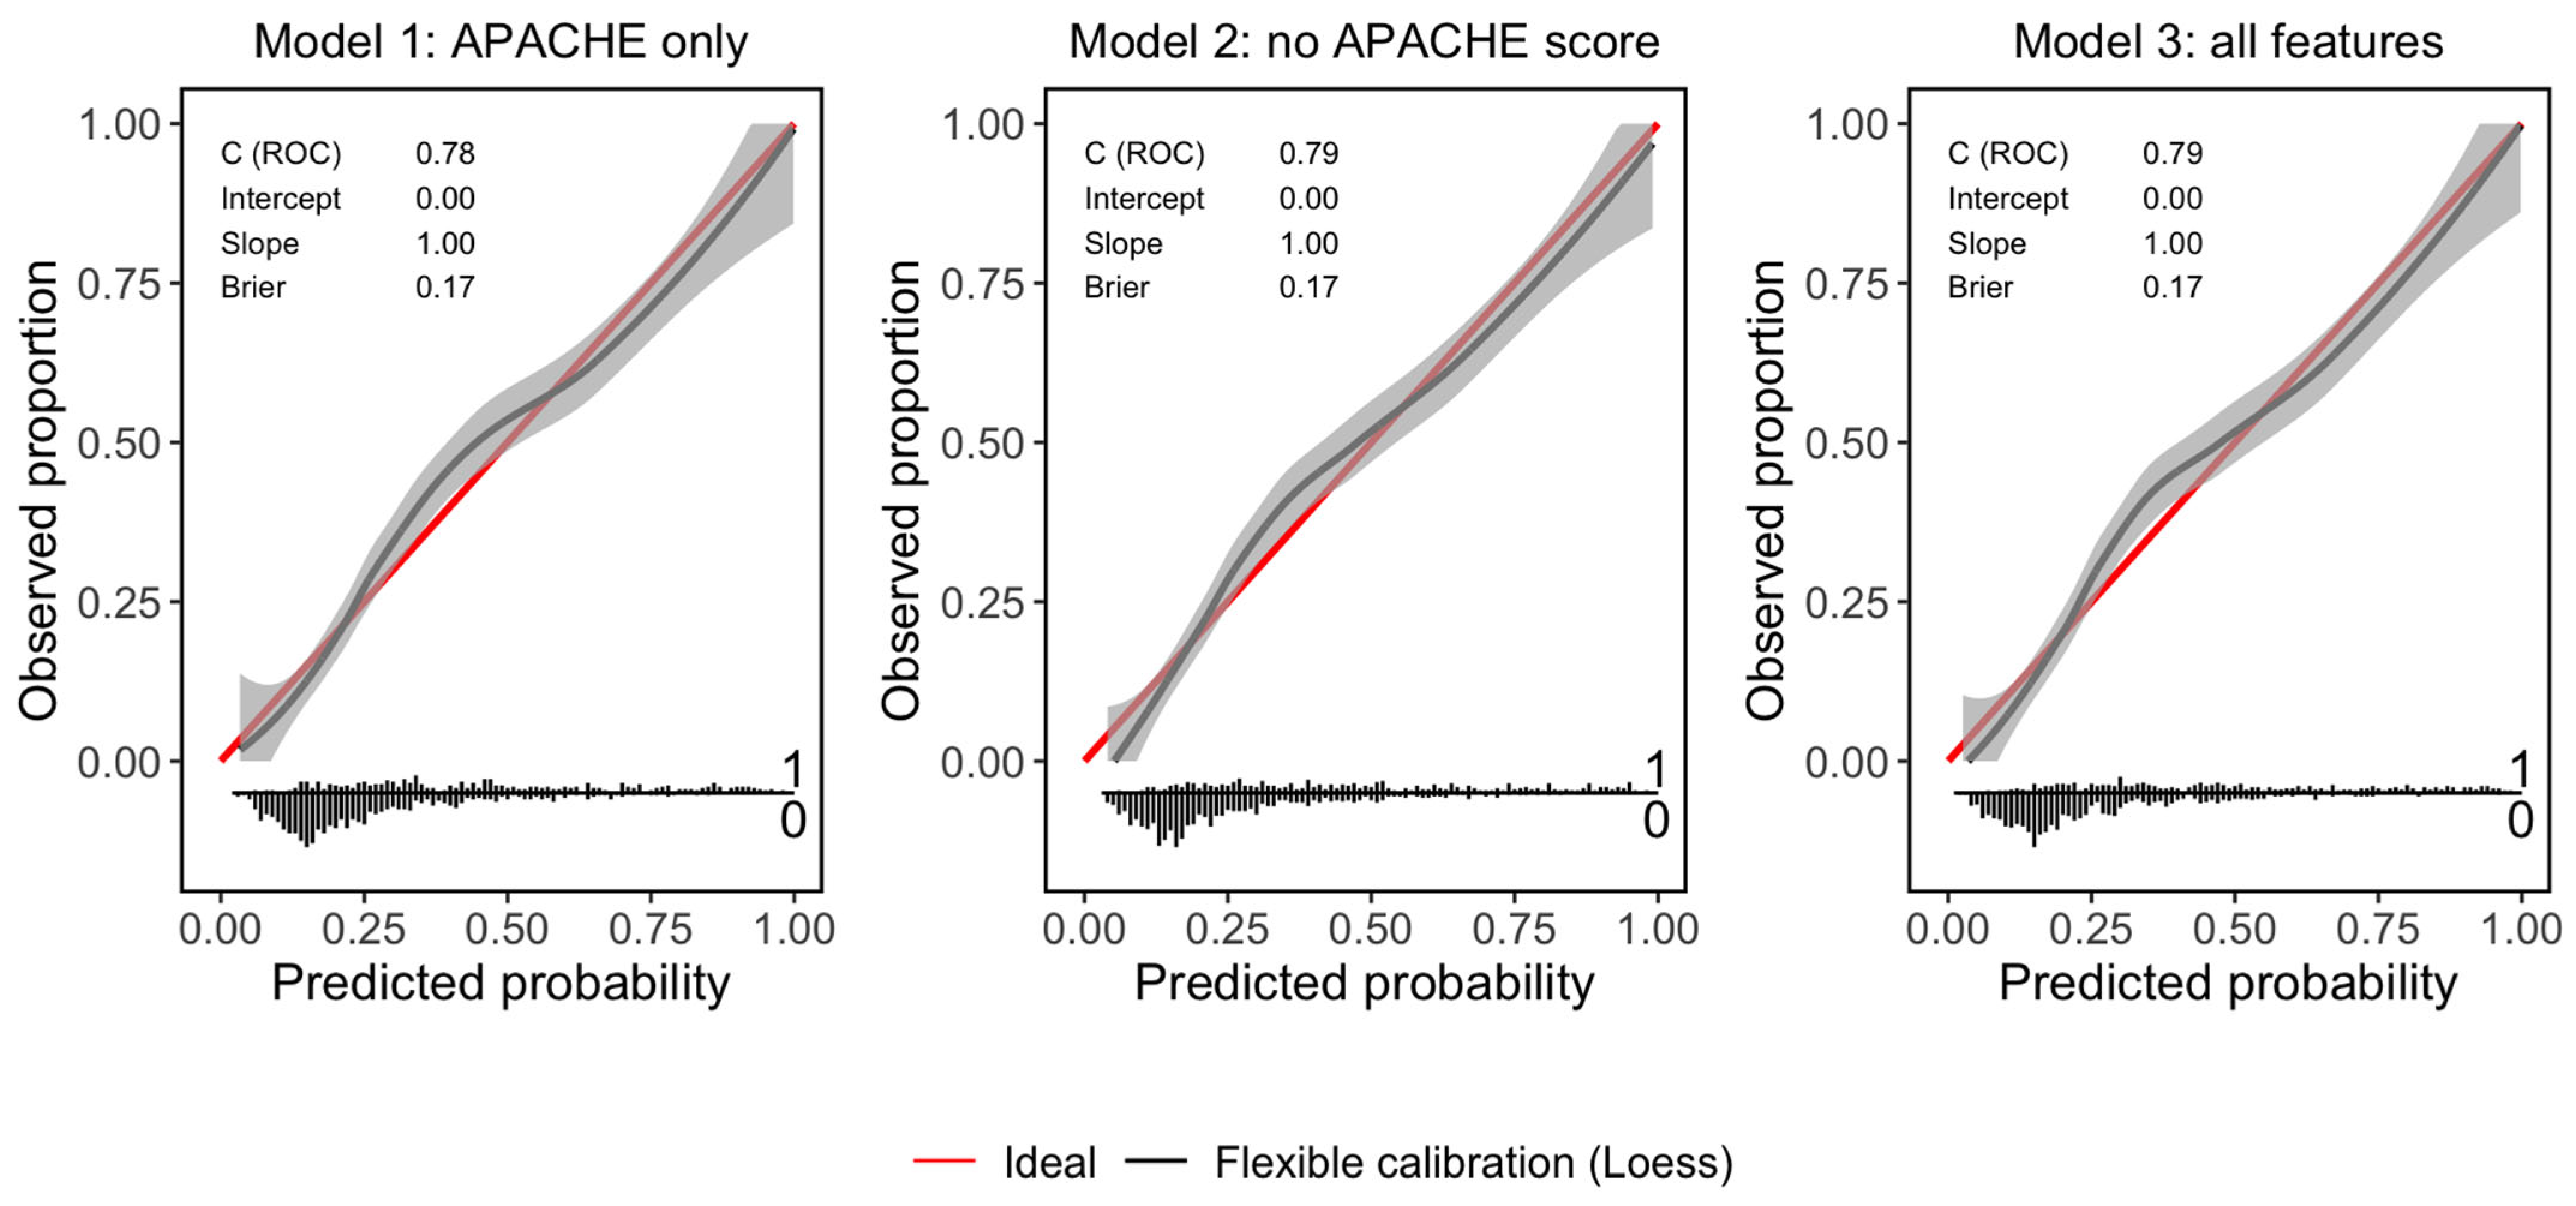
| Metric | Model 1: APACHE Only | Model 2: No APACHE Score | Model 3: All Features |
|---|---|---|---|
| Accuracy | 73.22% | 74.06% | 74.14% |
| Sensitivity | 89.2% | 88.97% | 89.2% |
| Specificity | 42.08% | 45.02% | 44.8% |
| AUROC | 0.78 | 0.79 | 0.79 |
| Brier score | 0.17 | 0.17 | 0.17 |

References
- Gopalan, P.D.; Pershad, S. Decision-making in ICU—A systematic review of factors considered important by ICU clinician decision makers with regard to ICU triage decisions. J. Crit. Care 2019, 50, 99–110. [Google Scholar] [CrossRef] [PubMed]
- Tang, H.; Jin, Z.; Deng, J.; She, Y.; Zhong, Y.; Sun, W.; Ren, Y.; Cao, N.; Chen, C. Development and validation of a deep learning model to predict the survival of patients in ICU. J. Am. Med. Inform. Assoc. JAMIA 2022, 29, 1567–1576. [Google Scholar] [CrossRef]
- Ohno-Machado, L.; Resnic, F.S.; Matheny, M.E. PROGNOSIS IN CRITICAL CARE. Annu. Rev. Biomed. Eng. 2006, 8, 567–599. [Google Scholar] [CrossRef]
- Groenland, C.N.L.; Termorshuizen, F.; Rietdijk, W.J.R.; van den Brule, J.; Dongelmans, D.A.; de Jonge, E.; de Lange, E.W.; de Smet, A.M.G.A.; de Keizer, N.F.; Weigel, J.D.; et al. Emergency Department to ICU Time Is Associated with Hospital Mortality: A Registry Analysis of 14,788 Patients From Six University Hospitals in The Netherlands. Crit. Care Med. 2019, 47, 1564–1571. [Google Scholar] [CrossRef] [PubMed]
- Parkhe, M.; Myles, P.S.; Leach, D.S.; Maclean, A.V. Outcome of emergency department patients with delayed admission to an intensive care unit. Emerg. Med. 2002, 14, 50–57. [Google Scholar] [CrossRef] [PubMed]
- Worku, A.; Haisch, D.; Parekh, M.; Sultan, A.; Shumet, A.; G/Selassie, K.; O’Donnell, M.; Binegdie, A.; Sherman, C.B.; Schluger, N.W. Epidemiology and Outcomes of Critical Illness and Novel Predictors of Mortality in an Ethiopian Medical Intensive Care Unit. J. Intensive Care Med. 2024, 39, 778–784. [Google Scholar] [CrossRef]
- Almansour, I.M.; Ahmad, M.M.; Alnaeem, M.M. Characteristics, Mortality Rates, and Treatments Received in Last Few Days of Life for Patients Dying in Intensive Care Units: A Multicenter Study. Am. J. Hosp. Palliat. Care 2020, 37, 761–766. [Google Scholar] [CrossRef]
- Godinjak, A.; Iglica, A.; Rama, A.; Tančica, I.; Jusufović, S.; Ajanović, A.; Kukuljac, A. Predictive value of SAPS II and APACHE II scoring systems for patient outcome in a medical intensive care unit. Acta Medica Acad. 2016, 45, 97–103. [Google Scholar] [CrossRef]
- Knaus, W.A.; Draper, E.A.; Wagner, D.P.; Zimmerman, J.E. APACHE II: A severity of disease classification system. Crit. Care Med. 1985, 13, 818–829. [Google Scholar] [CrossRef]
- Quintairos, A.; Pilcher, D.; Salluh, J.I.F. ICU scoring systems. Intensive Care Med. 2023, 49, 223–225. [Google Scholar] [CrossRef]
- Lloyd-Thomas, A.R.; Wright, I.; Lister, T.A.; Hinds, C.J. Prognosis of patients receiving intensive care for lifethreatening medical complications of haematological malignancy. Br. Med. J. Clin. Res. Ed. 1988, 296, 1025–1029. [Google Scholar] [CrossRef] [PubMed]
- Ludwigs, U.; Hulting, J. Acute Physiology and Chronic Health Evaluation II scoring system in acute myocardial infarction: A prospective validation study. Crit Care Med. 1995, 23, 854–859. [Google Scholar] [CrossRef] [PubMed]
- Maher, E.R.; Robinson, K.N.; Scoble, J.E.; Farrimond, J.G.; Browne, D.R.G.; Sweny, P.; Moorhead, J.F. Prognosis of critically-ill patients with acute renal failure: APACHE II score and other predictive factors. QJM 1989, 72, 857–866. [Google Scholar] [PubMed]
- Edwards, A.T.; Ng, K.J.; Shandall, A.A.; Price-Thomas, J.M. Experience with the APACHE II severity of disease scoring system in predicting outcome in a surgical intensive therapy unit. J. R. Coll. Surg. Edinb. 1991, 36, 37–40. [Google Scholar]
- Headley, J.; Theriault, R.; Smith, T.L. Independent validation of APACHE II severity of illness score for predicting mortality in patients with breast cancer admitted to the intensive care unit. Cancer 1992, 70, 497–503. [Google Scholar] [CrossRef] [PubMed]
- Song, X.; Liu, X.Y.; Wang, H.R.; Guo, X.Y.; Kashani, K.B.; Ma, P.L. Association between anemia and ICU outcomes. Chin. Med.J. 2021, 134, 1744–1746. [Google Scholar] [CrossRef]
- Definition of Boarded Patient. Available online: https://www.acep.org/patient-care/policy-statements/definition-of-boarded-patient (accessed on 28 February 2025).
- Angotti, L.B.; Richards, J.B.; Fisher, D.F.; Sankoff, J.D.; Seigel, T.A.; Al Ashry, H.S.; Wilcox, S.R. Duration of Mechanical Ventilation in the Emergency Department. West. J. Emerg. Med. 2017, 18, 972–979. [Google Scholar] [CrossRef]
- Chalfin, D.B.; Trzeciak, S.; Likourezos, A.; Baumann, B.M.; Dellinger, R.P.; DELAY-ED study group. Impact of delayed transfer of critically ill patients from the emergency department to the intensive care unit. Crit. Care Med. 2007, 35, 1477–1483. [Google Scholar] [CrossRef]
- Goldhill, D.R.; McNarry, A.F.; Hadjianastassiou, V.G.; Tekkis, P.P. The longer patients are in hospital before Intensive Care admission the higher their mortality. Intensive Care Med. 2004, 30, 1908–1913. [Google Scholar] [CrossRef]
- Agustin, M.; Price, L.L.; Andoh-Duku, A.; LaCamera, P. Impact of Delayed Admission to the Intensive Care Unit from the Emergency Department upon Sepsis Outcomes and Sepsis Protocol Compliance. Crit. Care Res. Pract. 2017, 2017, 9616545. [Google Scholar] [CrossRef]
- Cardoso, L.T.; Grion, C.M.; Matsuo, T.; Anami, E.H.; Kauss, I.A.; Seko, L.; Bonametti, A.M. Impact of delayed admission to intensive care units on mortality of critically ill patients: A cohort study. Crit. Care 2011, 15, R28. [Google Scholar] [CrossRef] [PubMed]
- Mathews, K.S.; Durst, M.S.; Vargas-Torres, C.; Olson, A.D.; Mazumdar, M.; Richardson, L.D. Effect of Emergency Department and ICU Occupancy on Admission Decisions and Outcomes for Critically Ill Patients. Crit. Care Med. 2018, 46, 720–727. [Google Scholar] [CrossRef]
- Singer, A.J.; Thode, H.C.; Viccellio, P.; Pines, J.M. The association between length of emergency department boarding and mortality. Acad. Emerg. Med. Off. J. Soc. Acad. Emerg. Med. 2011, 18, 1324–1329. [Google Scholar] [CrossRef]
- Rincon, F.; Mayer, S.A.; Rivolta, J.; Stillman, J.; Boden-Albala, B.; Elkind, M.S.V.; Marshall, R.; Chong, J.Y. Impact of delayed transfer of critically ill stroke patients from the Emergency Department to the Neuro-ICU. Neurocrit. Care 2010, 13, 75–81. [Google Scholar] [CrossRef]
- Dhand, N.; Khatkar, M. Sample Size Calculator for Estimating a Proportion. 2014. Available online: https://statulator.com/SampleSize/ss1P.html (accessed on 16 March 2025).
- Demass, T.B.; Guadie, A.G.; Mengistu, T.B.; Belay, Z.A.; Melese, A.A.; Berneh, A.A.; Mihret, L.G.; Wagaye, F.E.; Bantie, G.M. The magnitude of mortality and its predictors among adult patients admitted to the Intensive care unit in Amhara Regional State, Northwest Ethiopia. Sci. Rep. 2023, 13, 12010. [Google Scholar] [CrossRef]
- Unal, A.U.; Kostek, O.; Takir, M.; Caklili, O.; Uzunlulu, M.; Oguz, A. Prognosis of patients in a medical intensive care unit. North. Clin. Istanb. 2015, 2, 189–195. [Google Scholar] [CrossRef]
- Capuzzo, M.; Volta, C.; Tassinati, T.; Moreno, R.; Valentin, A.; Guidet, B.; Iapichino, G.; Martin, C.; Perneger, T.; Combescure, C.; et al. Hospital mortality of adults admitted to Intensive Care Units in hospitals with and without Intermediate Care Units: A multicentre European cohort study. Crit. Care 2014, 18, 551. [Google Scholar] [CrossRef]
- Mayyas, F.; Tashtoush, M.; Tashtoush, Z. Predictors of intensive care unit length of stay and mortality among unvaccinated COVID-19 patients in Jordan. Infect. Prev. Pract. 2023, 5, 100278. [Google Scholar] [CrossRef]
- Al Oweidat, K.; Al-Amer, R.; Saleh, M.Y.; Albtoosh, A.S.; Toubasi, A.A.; Ribie, M.K.; Hasuneh, M.M.; Alfaqheri, D.L.; Alshurafa, A.H.; Ribie, M.; et al. Mortality, Intensive Care Unit Admission, and Intubation among Hospitalized Patients with COVID-19: A One-Year Retrospective Study in Jordan. J. Clin. Med. 2023, 12, 2651. [Google Scholar] [CrossRef] [PubMed]
- Kiekkas, P.; Tzenalis, A.; Gklava, V.; Stefanopoulos, N.; Voyagis, G.; Aretha, D. Delayed Admission to the Intensive Care Unit and Mortality of Critically Ill Adults: Systematic Review and Meta-analysis. BioMed Res. Int. 2022, 2022, 4083494. [Google Scholar] [CrossRef] [PubMed]
- Hope, A.A.; Gong, M.N.; Guerra, C.; Wunsch, H. Frailty Before Critical Illness and Mortality for Elderly Medicare Beneficiaries. J. Am. Geriatr. Soc. 2015, 63, 1121–1128. [Google Scholar] [CrossRef]
- McNelly, A.S.; Rawal, J.; Shrikrishna, D.; Hopkinson, N.S.; Moxham, J.; Harridge, S.D.; Hart, N.; Montgomery, H.E.; Puthucheary, Z.A. An Exploratory Study of Long-Term Outcome Measures in Critical Illness Survivors: Construct Validity of Physical Activity, Frailty, and Health-Related Quality of Life Measures. Crit. Care Med. 2016, 44, e362–e369. [Google Scholar] [CrossRef]
- Bastos, P.G.; Sun, X.; Wagner, D.P.; Wu, A.W.; Knaus, W.A. Glasgow Coma Scale score in the evaluation of outcome in the intensive care unit: Findings from the Acute Physiology and Chronic Health Evaluation III study. Crit. Care Med. 1993, 21, 1459–1465. [Google Scholar] [CrossRef]
- Belletti, A.; Castro, M.L.; Silvetti, S.; Greco, T.; Biondi-Zoccai, G.; Pasin, L.; Zangrillo, A.; Landoni, G. The Effect of inotropes and vasopressors on mortality: A meta-analysis of randomized clinical trials. BJA Br. J. Anaesth. 2015, 115, 656–675. [Google Scholar] [CrossRef]
- Salacup, G.; Lo, K.B.; Gul, F.; Peterson, E.; De Joy, R.; Bhargav, R.; Pelayo, J.; Albano, J.; Azmaiparashvili, Z.; Benzaquen, S.; et al. Characteristics and clinical outcomes of COVID-19 patients in an underserved-inner city population: A single tertiary center cohort. J. Med. Virol. 2021, 93, 416–423. [Google Scholar] [CrossRef]
- Jung, S.M.; Kim, Y.J.; Ryoo, S.M.; Kim, W.Y. Relationship between low hemoglobin levels and mortality in patients with septic shock. Acute Crit. Care 2019, 34, 141–147. [Google Scholar] [CrossRef]
- Tezcan, B.; Kosovali, B.D.; Can, M.; Demirbag, A.E.; Yavuz, A.; Mutlu, N.M. The Relationship Between Mortality and Hemoglobin Levels in Intensive Care Patients with Acute Respiratory Distress Syndrome. J. Crit. Intensive Care 2023, 14, 66. [Google Scholar] [CrossRef]
- Thomas, J.; Jensen, L.; Nahirniak, S.; Gibney, R.T.N. Anemia and blood transfusion practices in the critically ill: A prospective cohort review. Heart Lung J. Crit. Care 2010, 39, 217–225. [Google Scholar] [CrossRef] [PubMed]
- Hajjar, L.A.; Auler Junior, J.O.C.; Santos, L.; Galas, F. Blood tranfusion in critically ill patients: State of the art. Clinics 2007, 62, 507–524. [Google Scholar] [CrossRef] [PubMed]
| Mortality | |||||
|---|---|---|---|---|---|
| Characteristic | Overall, N = 1323 1 | Missing | No N = 861 1 | Yes N = 442 1 | p-Value 2 |
| Patient age | 65 (17) | 0 (0%) | 63 (18) | 69 (15) | <0.001 |
| Patient gender | 0 (0%) | 0.2 | |||
| Female | 608 (47%) | 412 (68%) | 196 (32%) | ||
| Male | 695 (53%) | 449 (65%) | 246 (35%) | ||
| Delay of admission | 18 (15) | 0 (0%) | 18 (15) | 17 (15) | 0.067 |
| Admission delay > 6 h | 0 (0%) | 0.006 | |||
| No | 298 (23%) | 177 (59%) | 121 (41%) | ||
| Yes | 1005 (77%) | 684 (68%) | 321 (32%) | ||
| ICU stay duration | 160 (174) | 0 (0%) | 123 (133) | 231 (218) | <0.001 |
| Admitted through ER | 0 (0%) | 0.003 | |||
| No | 308 (24%) | 182 (59%) | 126 (41%) | ||
| Yes | 995 (76%) | 679 (68%) | 316 (32%) | ||
| Pneumonia | 0 (0%) | <0.001 | |||
| CAP | 165 (13%) | 89 (54%) | 76 (46%) | ||
| HAP | 150 (12%) | 77 (51%) | 73 (49%) | ||
| No | 988 (76%) | 695 (70%) | 293 (30%) | ||
| DM | 0 (0%) | 0.8 | |||
| No | 642 (49%) | 422 (66%) | 220 (34%) | ||
| Yes | 661 (51%) | 439 (66%) | 222 (34%) | ||
| HTN | 0 (0%) | >0.9 | |||
| No | 519 (40%) | 343 (66%) | 176 (34%) | ||
| Yes | 784 (60%) | 518 (66%) | 266 (34%) | ||
| CKD | 0 (0%) | 0.4 | |||
| No | 940 (72%) | 614 (65%) | 326 (35%) | ||
| Yes | 363 (28%) | 247 (68%) | 116 (32%) | ||
| Liver cirrhosis | 0 (0%) | >0.9 | |||
| No | 1239 (95%) | 819 (66%) | 420 (34%) | ||
| Yes | 64 (4.9%) | 42 (66%) | 22 (34%) | ||
| IHD | 0 (0%) | >0.9 | |||
| No | 985 (76%) | 650 (66%) | 335 (34%) | ||
| Yes | 318 (24%) | 211 (66%) | 107 (34%) | ||
| Heart Failure | 0 (0%) | 0.6 | |||
| No | 980 (75%) | 644 (66%) | 336 (34%) | ||
| Yes | 323 (25%) | 217 (67%) | 106 (33%) | ||
| COPD/Asthma | 0 (0%) | 0.041 | |||
| No | 1136 (87%) | 739 (65%) | 397 (35%) | ||
| Yes | 167 (13%) | 122 (73%) | 45 (27%) | ||
| OSA | 0 (0%) | 0.026 | |||
| No | 1230 (94%) | 804 (65%) | 426 (35%) | ||
| Yes | 73 (5.6%) | 57 (78%) | 16 (22%) | ||
| GCS | 13.84 (2.73) | 6 (0.5%) | 14.38 (1.85) | 12.78 (3.69) | <0.001 |
| On vasopressor | 0 (0%) | <0.001 | |||
| No | 1018 (78%) | 727 (71%) | 291 (29%) | ||
| Yes | 285 (22%) | 134 (47%) | 151 (53%) | ||
| Intubated | 0 (0%) | <0.001 | |||
| No | 1198 (92%) | 837 (70%) | 361 (30%) | ||
| Yes | 105 (8.1%) | 24 (23%) | 81 (77%) | ||
| Hb | 11.29 (2.81) | 2 (0.2%) | 11.52 (2.75) | 10.84 (2.87) | <0.001 |
| Cr | 2.36 (2.94) | 5 (0.4%) | 2.46 (3.23) | 2.16 (2.25) | 0.8 |
| APACHE score | 16 (8) | 419 (32%) | 15 (7) | 19 (8) | <0.001 |
| GCS score | 6 (0.5%) | <0.001 | |||
| 8 or more | 1224 (94%) | 839 (69%) | 385 (31%) | ||
| Less than 8 | 73 (5.6%) | 19 (26%) | 54 (74%) | ||
| Main diagnosis: Pneumonia | 0 (0%) | <0.001 | |||
| No | 1033 (79%) | 723 (70%) | 310 (30%) | ||
| Yes | 270 (21%) | 138 (51%) | 132 (49%) | ||
| Main diagnosis: Urosepsis | 0 (0%) | 0.5 | |||
| No | 1165 (89%) | 773 (66%) | 392 (34%) | ||
| Yes | 138 (11%) | 88 (64%) | 50 (36%) | ||
| Main diagnosis: Urosepsis type | 0 (0%) | 0.4 | |||
| No | 1165 (89%) | 773 (66%) | 392 (34%) | ||
| Not catheter associated | 72 (5.5%) | 49 (68%) | 23 (32%) | ||
| Catheter associated | 66 (5.1%) | 39 (59%) | 27 (41%) | ||
| Main diagnosis: AKI | 0 (0%) | 0.2 | |||
| No | 1185 (91%) | 777 (66%) | 408 (34%) | ||
| Yes | 118 (9.1%) | 84 (71%) | 34 (29%) | ||
| Main diagnosis: RF Type 2 | 0 (0%) | 0.078 | |||
| No | 1206 (93%) | 789 (65%) | 417 (35%) | ||
| Yes | 97 (7.4%) | 72 (74%) | 25 (26%) | ||
| Main diagnosis: UGIB | 0 (0%) | 0.057 | |||
| No | 1231 (94%) | 806 (65%) | 425 (35%) | ||
| Yes | 72 (5.5%) | 55 (76%) | 17 (24%) | ||
| Main diagnosis: Stroke | 0 (0%) | >0.9 | |||
| No | 1242 (95%) | 821 (66%) | 421 (34%) | ||
| Yes | 61 (4.7%) | 40 (66%) | 21 (34%) | ||
| Main diagnosis: NSTEMI | 0 (0%) | 0.5 | |||
| No | 1267 (97%) | 839 (66%) | 428 (34%) | ||
| Yes | 36 (2.8%) | 22 (61%) | 14 (39%) | ||
| Main diagnosis: ADHF | 0 (0%) | 0.4 | |||
| No | 1269 (97%) | 841 (66%) | 428 (34%) | ||
| Yes | 34 (2.6%) | 20 (59%) | 14 (41%) | ||
| 2nd diagnosis: AKI | 0 (0%) | 0.076 | |||
| No | 1195 (92%) | 798 (67%) | 397 (33%) | ||
| Yes | 108 (8.3%) | 63 (58%) | 45 (42%) | ||
| 2nd diagnosis: Pneumonia | 0 (0%) | 0.7 | |||
| No | 1259 (97%) | 833 (66%) | 426 (34%) | ||
| Yes | 44 (3.4%) | 28 (64%) | 16 (36%) | ||
| 2nd diagnosis: Urosepsis | 0 (0%) | <0.001 | |||
| No | 1275 (98%) | 851 (67%) | 424 (33%) | ||
| Yes | 28 (2.1%) | 10 (36%) | 18 (64%) | ||
| 2nd diagnosis: ADHF | 0 (0%) | 0.7 | |||
| No | 1277 (98%) | 843 (66%) | 434 (34%) | ||
| Yes | 26 (2.0%) | 18 (69%) | 8 (31%) | ||
| 2nd diagnosis: RF Type 2 | 0 (0%) | 0.6 | |||
| No | 1280 (98%) | 847 (66%) | 433 (34%) | ||
| Yes | 23 (1.8%) | 14 (61%) | 9 (39%) | ||
| Urosepsis: Primary or secondary | 0 (0%) | 0.040 | |||
| No | 1137 (87%) | 763 (67%) | 374 (33%) | ||
| Yes | 166 (13%) | 98 (59%) | 68 (41%) | ||
| Characteristic | OR 1 | 95% CI 1 | p-Value |
|---|---|---|---|
| ICU stay duration | 1.00 | 1.00, 1.00 | <0.001 |
| Admitted through ER | |||
| No | — | — | |
| Yes | 0.64 | 0.47, 0.89 | 0.007 |
| CKD | |||
| No | — | — | |
| Yes | 0.78 | 0.57, 1.05 | 0.10 |
| COPD/Asthma | |||
| No | — | — | |
| Yes | 0.60 | 0.39, 0.90 | 0.017 |
| On vasopressor | |||
| No | — | — | |
| Yes | 2.36 | 1.71, 3.26 | <0.001 |
| Intubated | |||
| No | — | — | |
| Yes | 5.67 | 3.41, 9.69 | <0.001 |
| Hb | 0.92 | 0.88, 0.97 | 0.003 |
| APACHE score | 1.06 | 1.03, 1.08 | <0.001 |
| Main diagnosis: Pneumonia | |||
| No | — | — | |
| Yes | 1.87 | 1.36, 2.57 | <0.001 |
| Main diagnosis: Stroke | |||
| No | — | — | |
| Yes | 1.75 | 0.92, 3.22 | 0.079 |
| Main diagnosis: NSTEMI | |||
| No | — | — | |
| Yes | 1.85 | 0.85, 3.89 | 0.11 |
| 2nd diagnosis: Urosepsis | |||
| No | — | — | |
| Yes | 3.17 | 1.34, 7.75 | 0.009 |
| Characteristic | OR 1 | 95% CI 1 | p-Value |
|---|---|---|---|
| Patient age | 1.02 | 1.01, 1.02 | <0.001 |
| ICU stay duration | 1.00 | 1.00, 1.00 | <0.001 |
| Admitted through ER | |||
| No | — | — | |
| Yes | 0.61 | 0.44, 0.84 | 0.003 |
| COPD/Asthma | |||
| No | — | — | |
| Yes | 0.66 | 0.43, 1.00 | 0.056 |
| GCS | 0.86 | 0.81, 0.91 | <0.001 |
| On vasopressor | |||
| No | — | — | |
| Yes | 2.41 | 1.75, 3.33 | <0.001 |
| Intubated | |||
| No | — | — | |
| Yes | 3.52 | 1.97, 6.40 | <0.001 |
| Hb | 0.92 | 0.87, 0.96 | <0.001 |
| Main diagnosis: Pneumonia | |||
| No | — | — | |
| Yes | 1.65 | 1.21, 2.27 | 0.002 |
| 2nd diagnosis: Urosepsis | |||
| No | — | — | |
| Yes | 2.67 | 1.13, 6.55 | 0.027 |
| Characteristic | OR 1 | 95% CI 1 | p-Value |
|---|---|---|---|
| Patient age | 1.01 | 1.00, 1.02 | 0.003 |
| ICU stay duration | 1.00 | 1.00, 1.00 | <0.001 |
| Admitted through ER | |||
| No | — | — | |
| Yes | 0.62 | 0.45, 0.86 | 0.004 |
| COPD/Asthma | |||
| No | — | — | |
| Yes | 0.62 | 0.40, 0.94 | 0.026 |
| GCS | 0.88 | 0.82, 0.93 | <0.001 |
| On vasopressor | |||
| No | — | — | |
| Yes | 2.30 | 1.66, 3.18 | <0.001 |
| Intubated | |||
| No | — | — | |
| Yes | 3.43 | 1.91, 6.25 | <0.001 |
| Hb | 0.92 | 0.87, 0.97 | 0.001 |
| Cr | 0.96 | 0.91, 1.01 | 0.2 |
| APACHE score | 1.03 | 1.01, 1.06 | 0.018 |
| Main diagnosis: Pneumonia | |||
| No | — | — | |
| Yes | 1.65 | 1.20, 2.26 | 0.002 |
| 2nd diagnosis: Urosepsis | |||
| No | — | — | |
| Yes | 2.64 | 1.12, 6.48 | 0.029 |
Disclaimer/Publisher’s Note: The statements, opinions and data contained in all publications are solely those of the individual author(s) and contributor(s) and not of MDPI and/or the editor(s). MDPI and/or the editor(s) disclaim responsibility for any injury to people or property resulting from any ideas, methods, instructions or products referred to in the content. |
© 2025 by the authors. Licensee MDPI, Basel, Switzerland. This article is an open access article distributed under the terms and conditions of the Creative Commons Attribution (CC BY) license (https://creativecommons.org/licenses/by/4.0/).
Share and Cite
Gharibeh, T.; Abu-Helalah, M.; Alshraideh, H.; Abu Awwad, M.; Al Bzour, Z.; Abuzayed, M.; Taweel, L.; Al-Fayyadh, Z.; Wraikat, B.; Alfaqeeh, Y.; et al. Predictors of Mortality in Medical ICU Patients: A Retrospective Study in a Tertiary Care Center in Jordan. J. Clin. Med. 2025, 14, 4039. https://doi.org/10.3390/jcm14124039
Gharibeh T, Abu-Helalah M, Alshraideh H, Abu Awwad M, Al Bzour Z, Abuzayed M, Taweel L, Al-Fayyadh Z, Wraikat B, Alfaqeeh Y, et al. Predictors of Mortality in Medical ICU Patients: A Retrospective Study in a Tertiary Care Center in Jordan. Journal of Clinical Medicine. 2025; 14(12):4039. https://doi.org/10.3390/jcm14124039
Chicago/Turabian StyleGharibeh, Tarek, Munir Abu-Helalah, Hussam Alshraideh, Manar Abu Awwad, Zaid Al Bzour, Majd Abuzayed, Luma Taweel, Zahraa Al-Fayyadh, Bushra Wraikat, Yomna Alfaqeeh, and et al. 2025. "Predictors of Mortality in Medical ICU Patients: A Retrospective Study in a Tertiary Care Center in Jordan" Journal of Clinical Medicine 14, no. 12: 4039. https://doi.org/10.3390/jcm14124039
APA StyleGharibeh, T., Abu-Helalah, M., Alshraideh, H., Abu Awwad, M., Al Bzour, Z., Abuzayed, M., Taweel, L., Al-Fayyadh, Z., Wraikat, B., Alfaqeeh, Y., & Aburumman, L. (2025). Predictors of Mortality in Medical ICU Patients: A Retrospective Study in a Tertiary Care Center in Jordan. Journal of Clinical Medicine, 14(12), 4039. https://doi.org/10.3390/jcm14124039