
Psychosocial Factors, Stress, and Well-Being: Associations with Common Dermatological Manifestations in a Large Polish Cross-Sectional Analysis
 ,
,  and
and
Abstract
1. Introduction
2. Materials and Methods
2.1. Data Collection
2.2. Statistical Analysis
3. Results
3.1. Demographic Characteristics
3.2. Frequency of Skin Signs and Symptoms
3.3. The Presence of Features Characterizing the Skin Condition
3.4. Factors Influencing Skin Signs and Symptoms
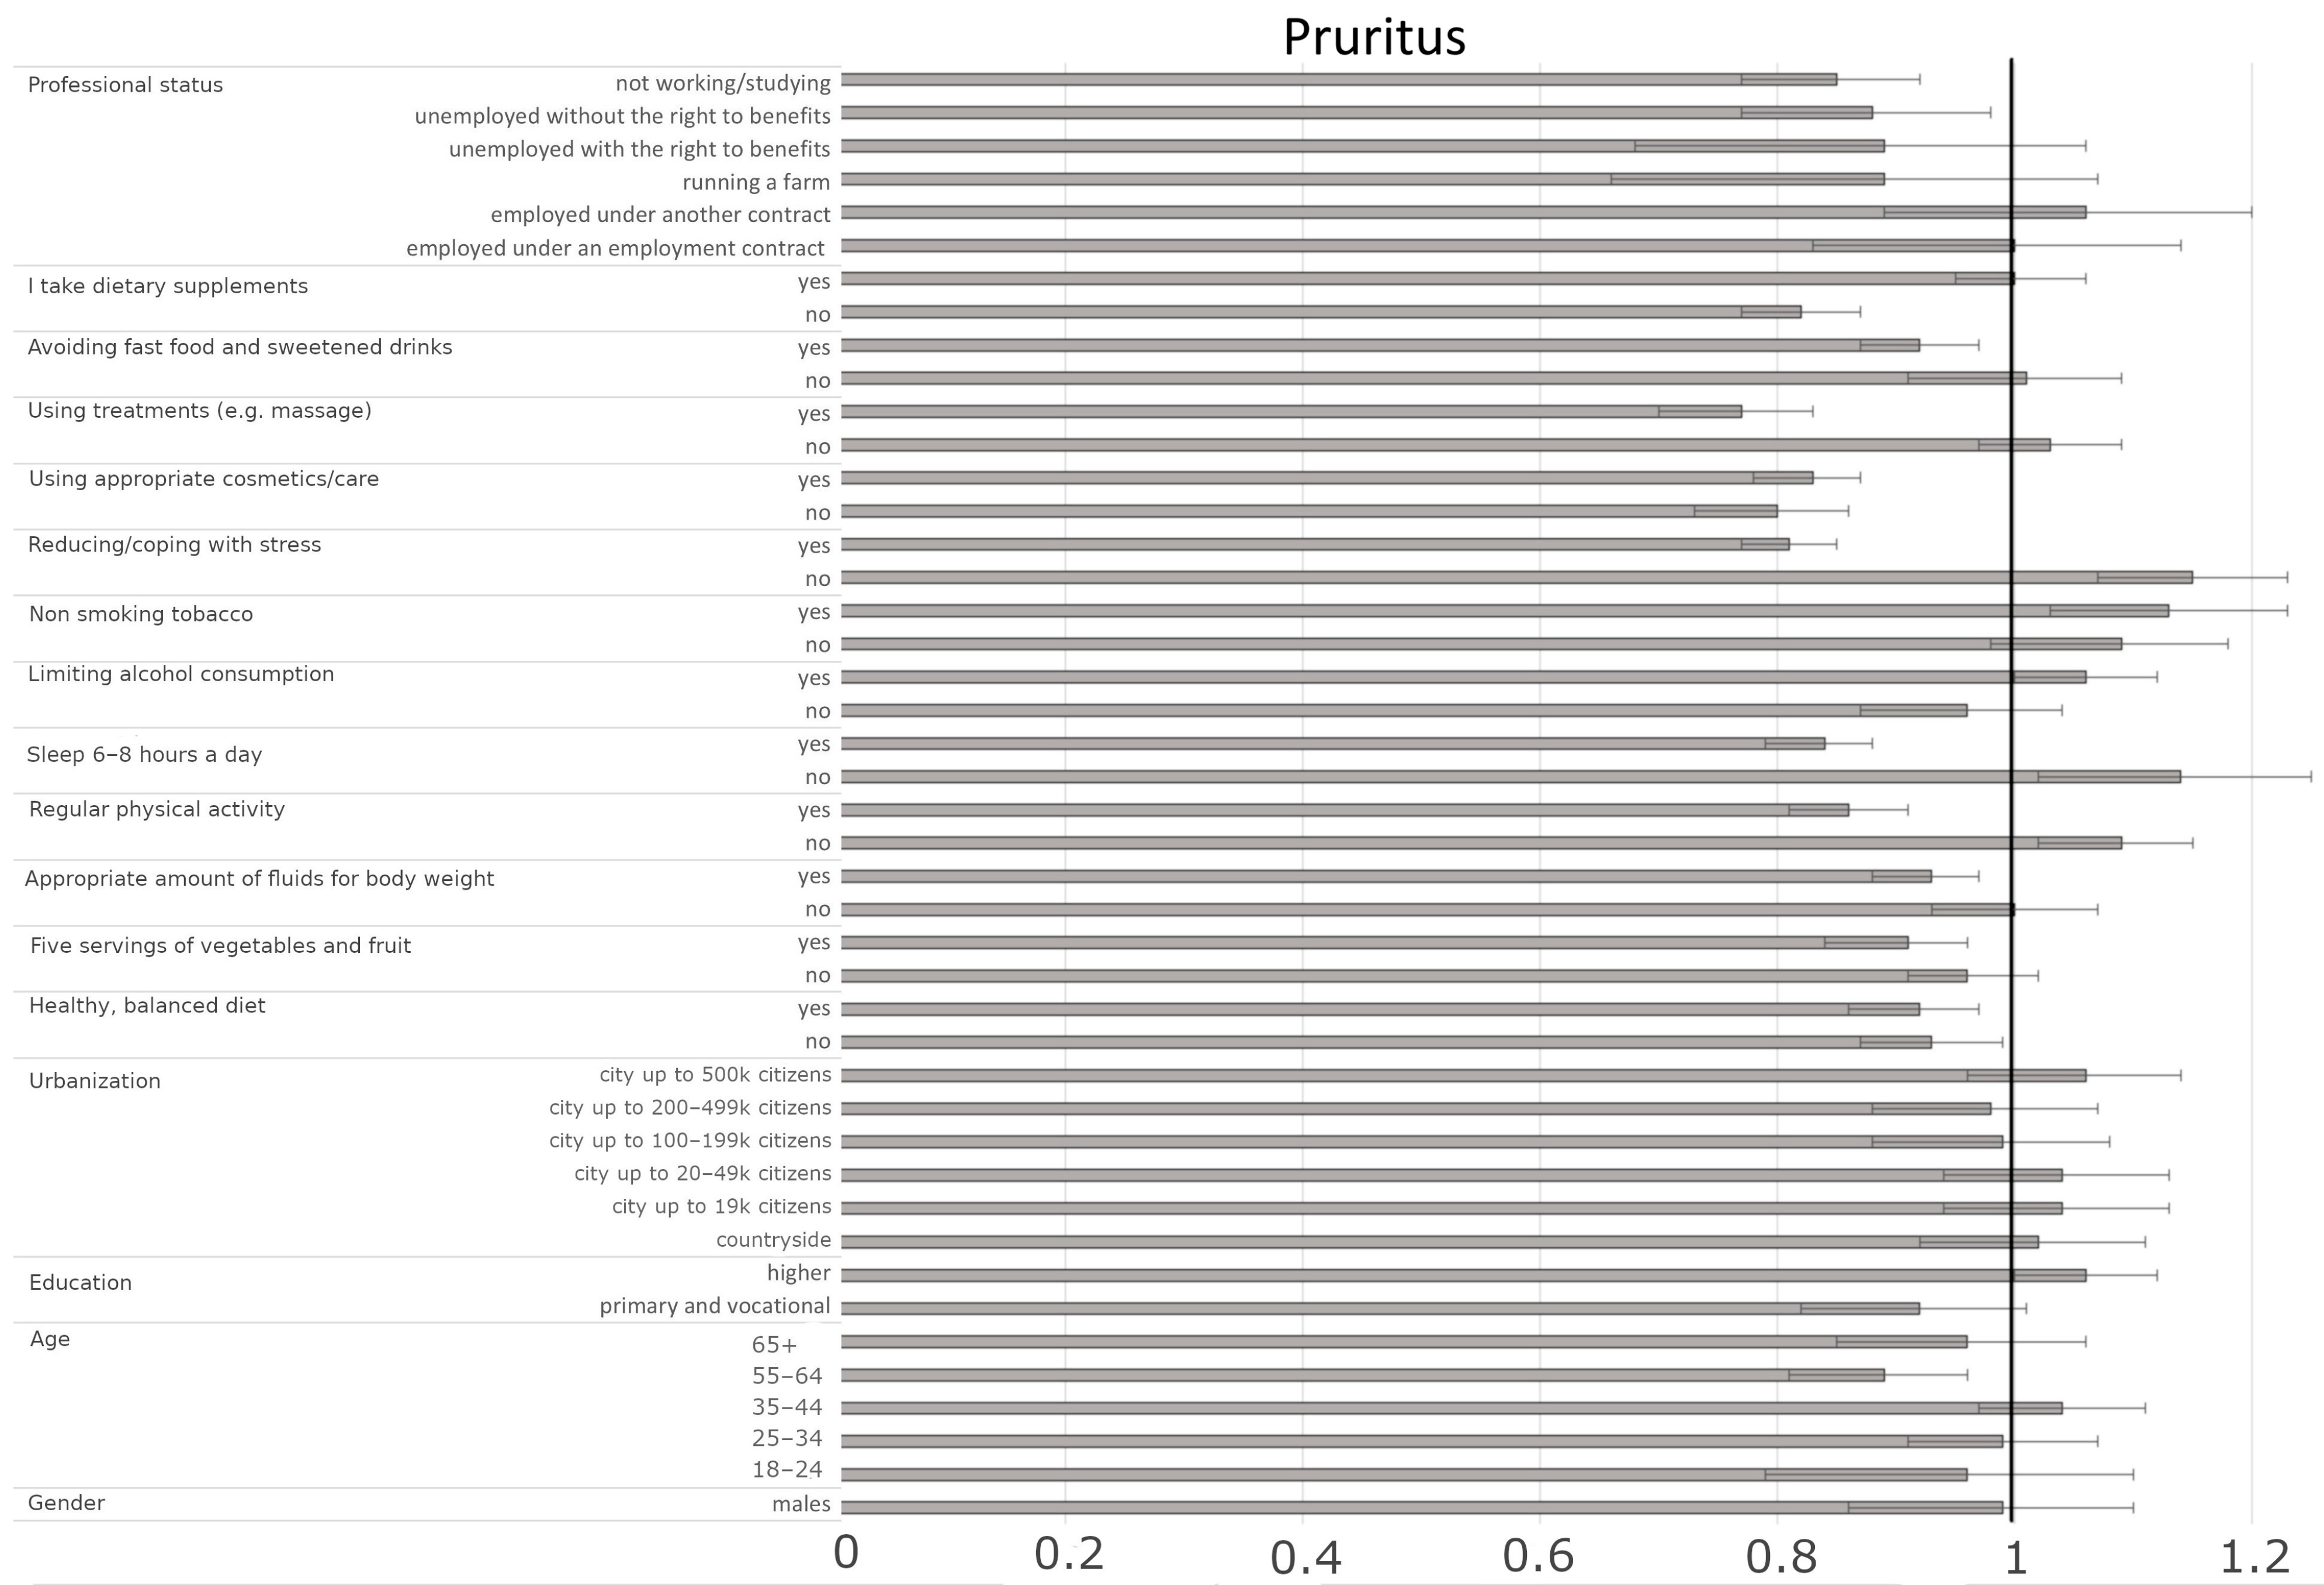
3.4.1. Factors Influencing the Presence of Pruritus
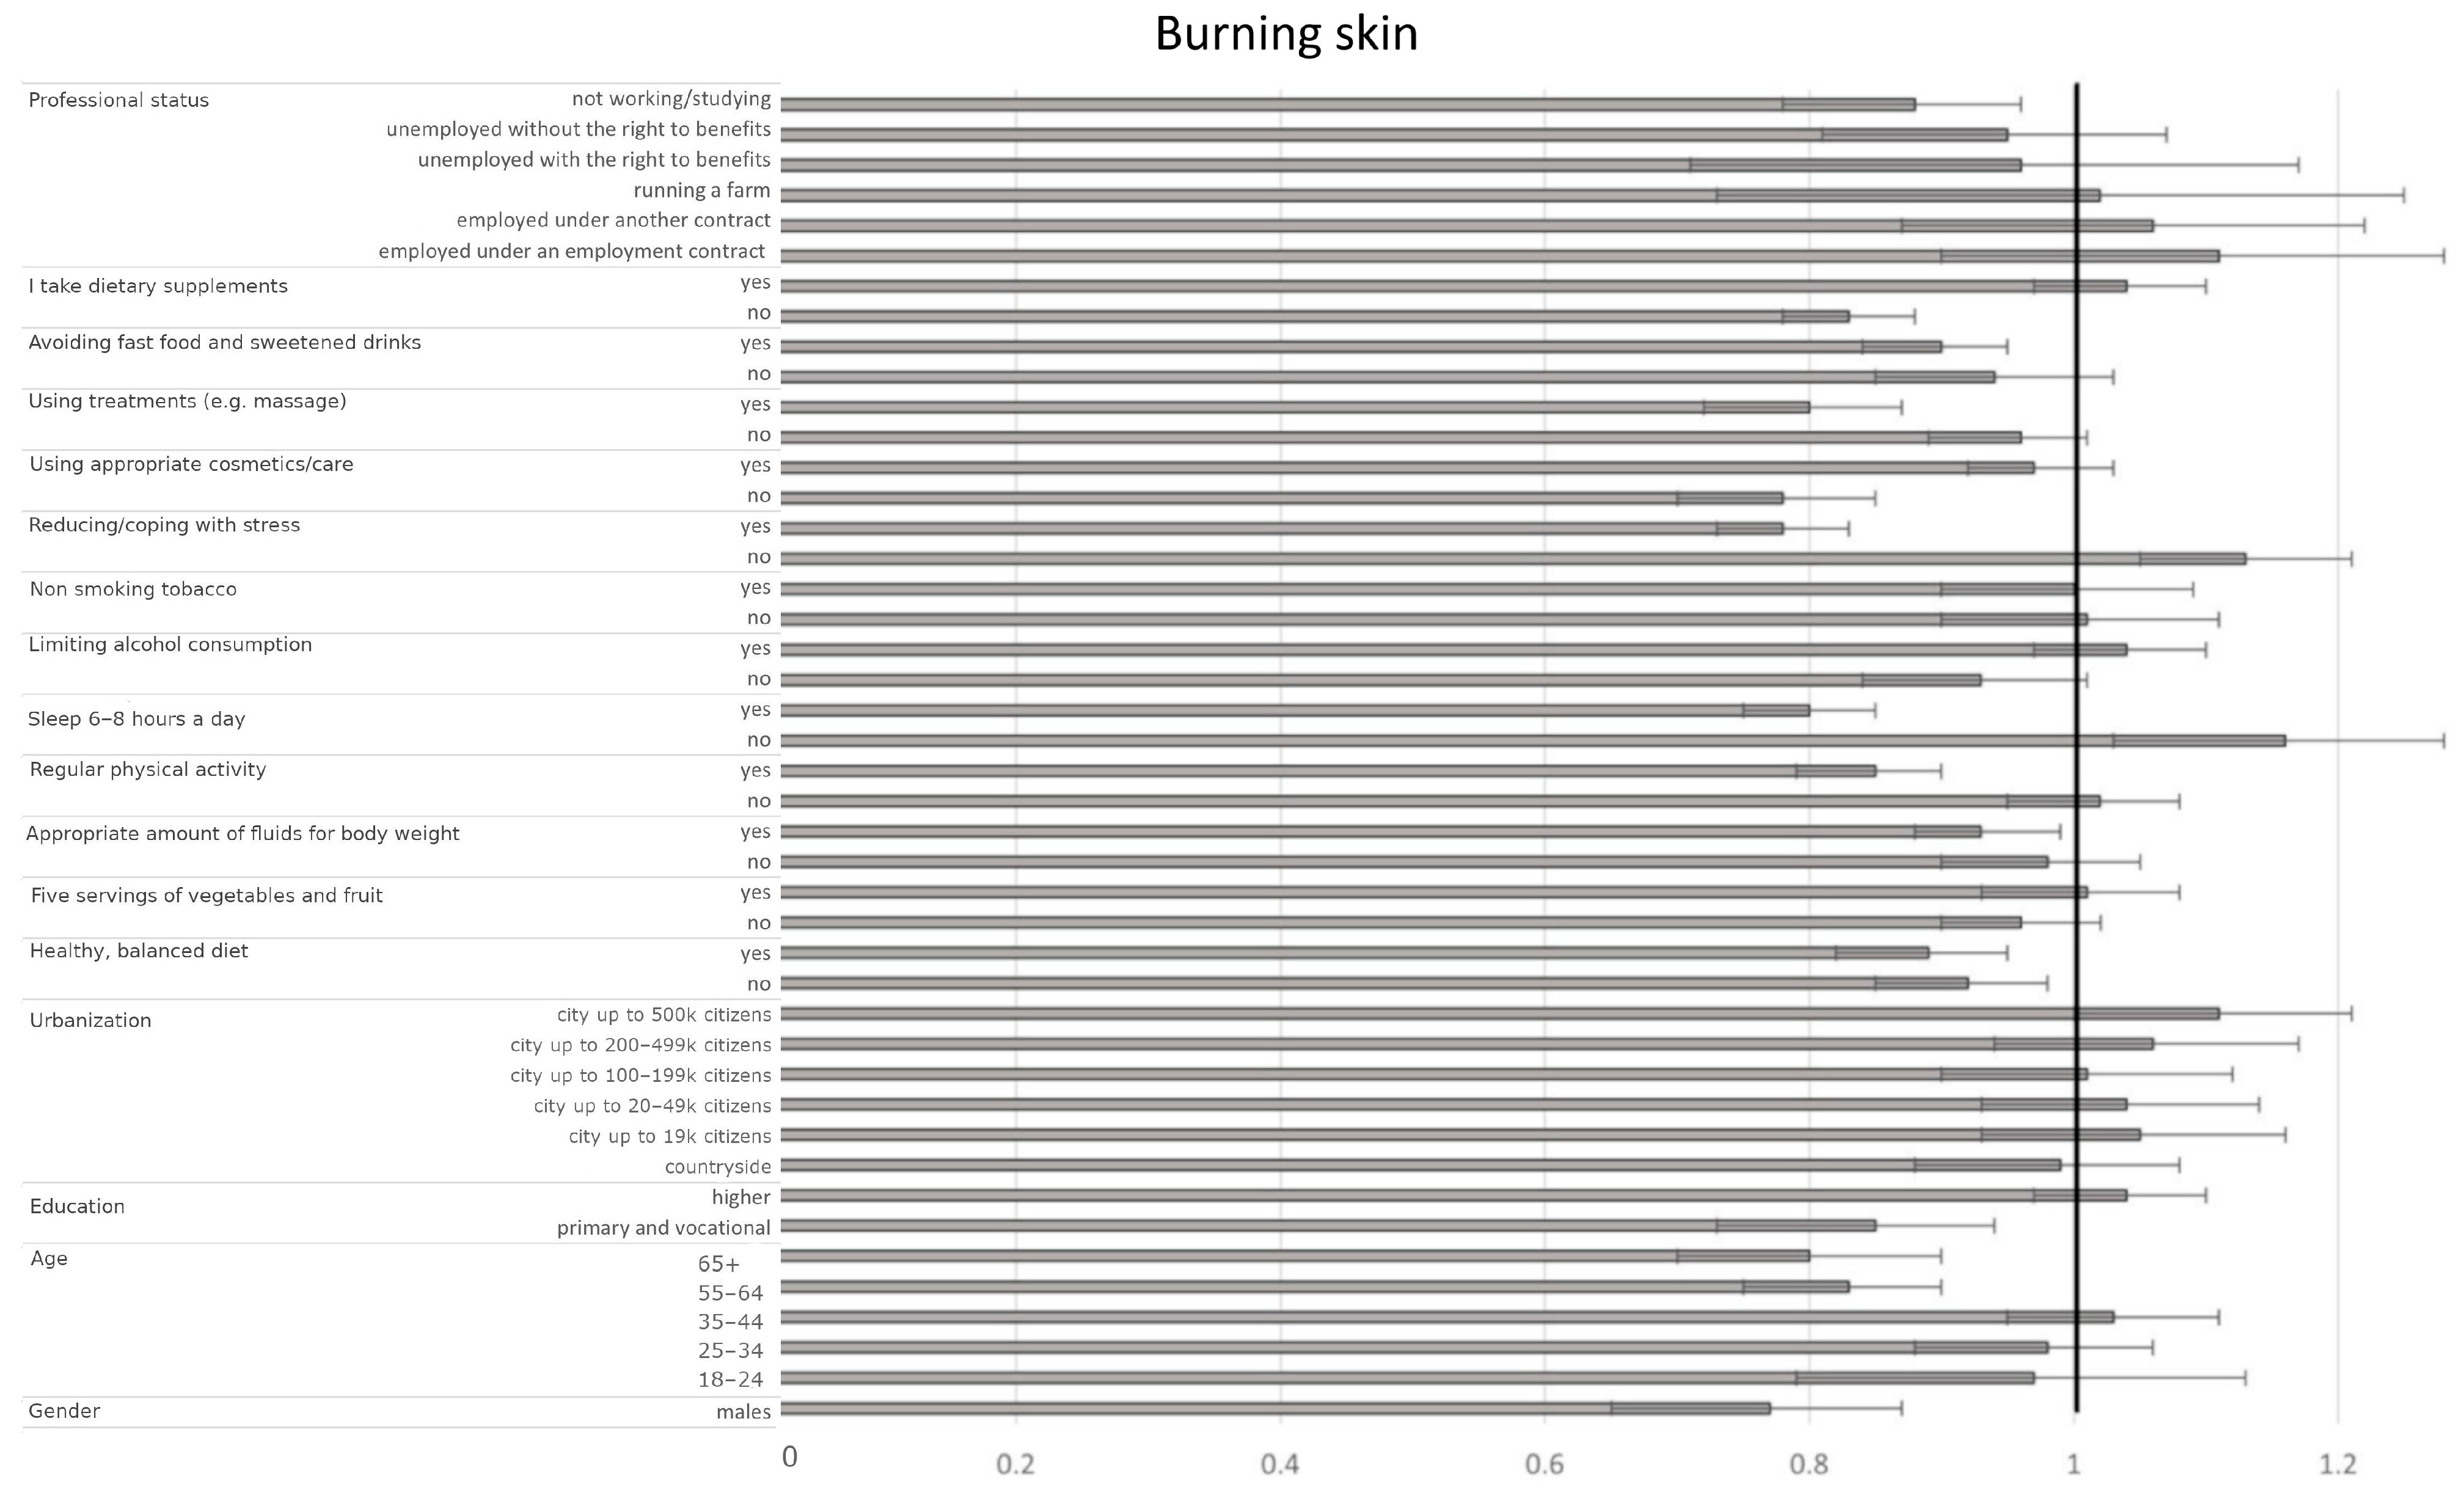
3.4.2. Factors Influencing Burning Sensation of the Skin
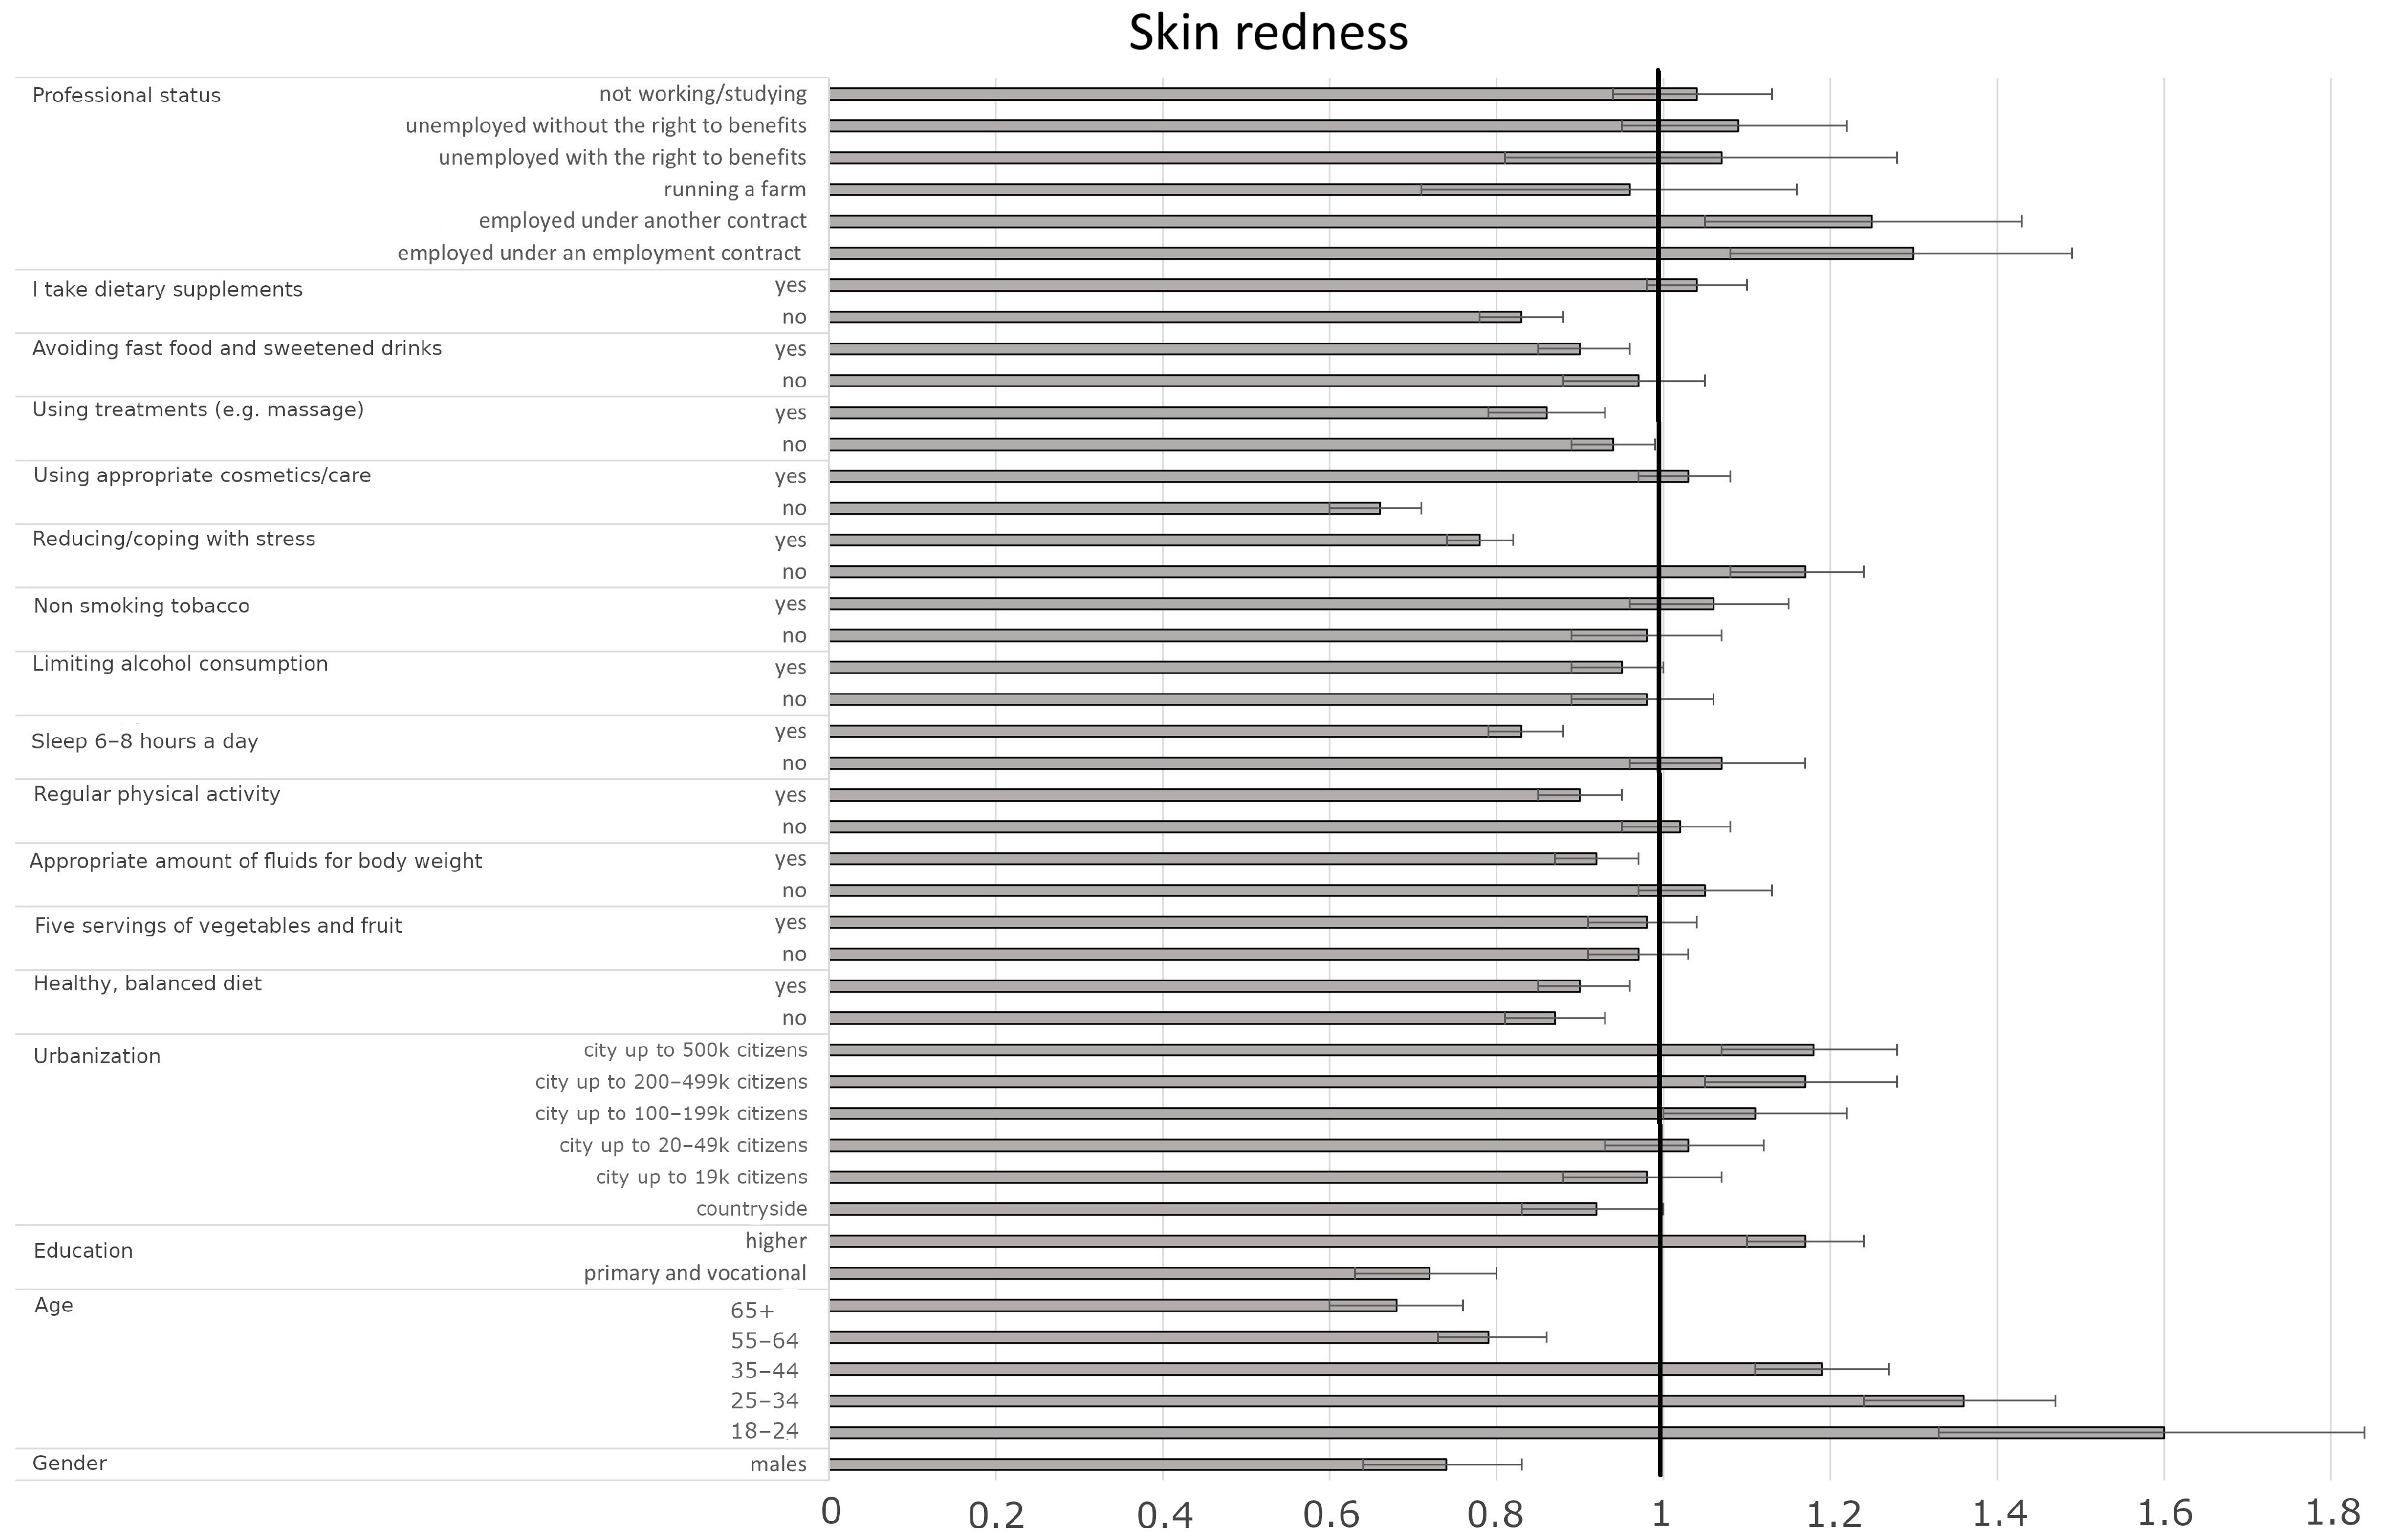
3.4.3. Factors Influencing the Presence of Skin Redness
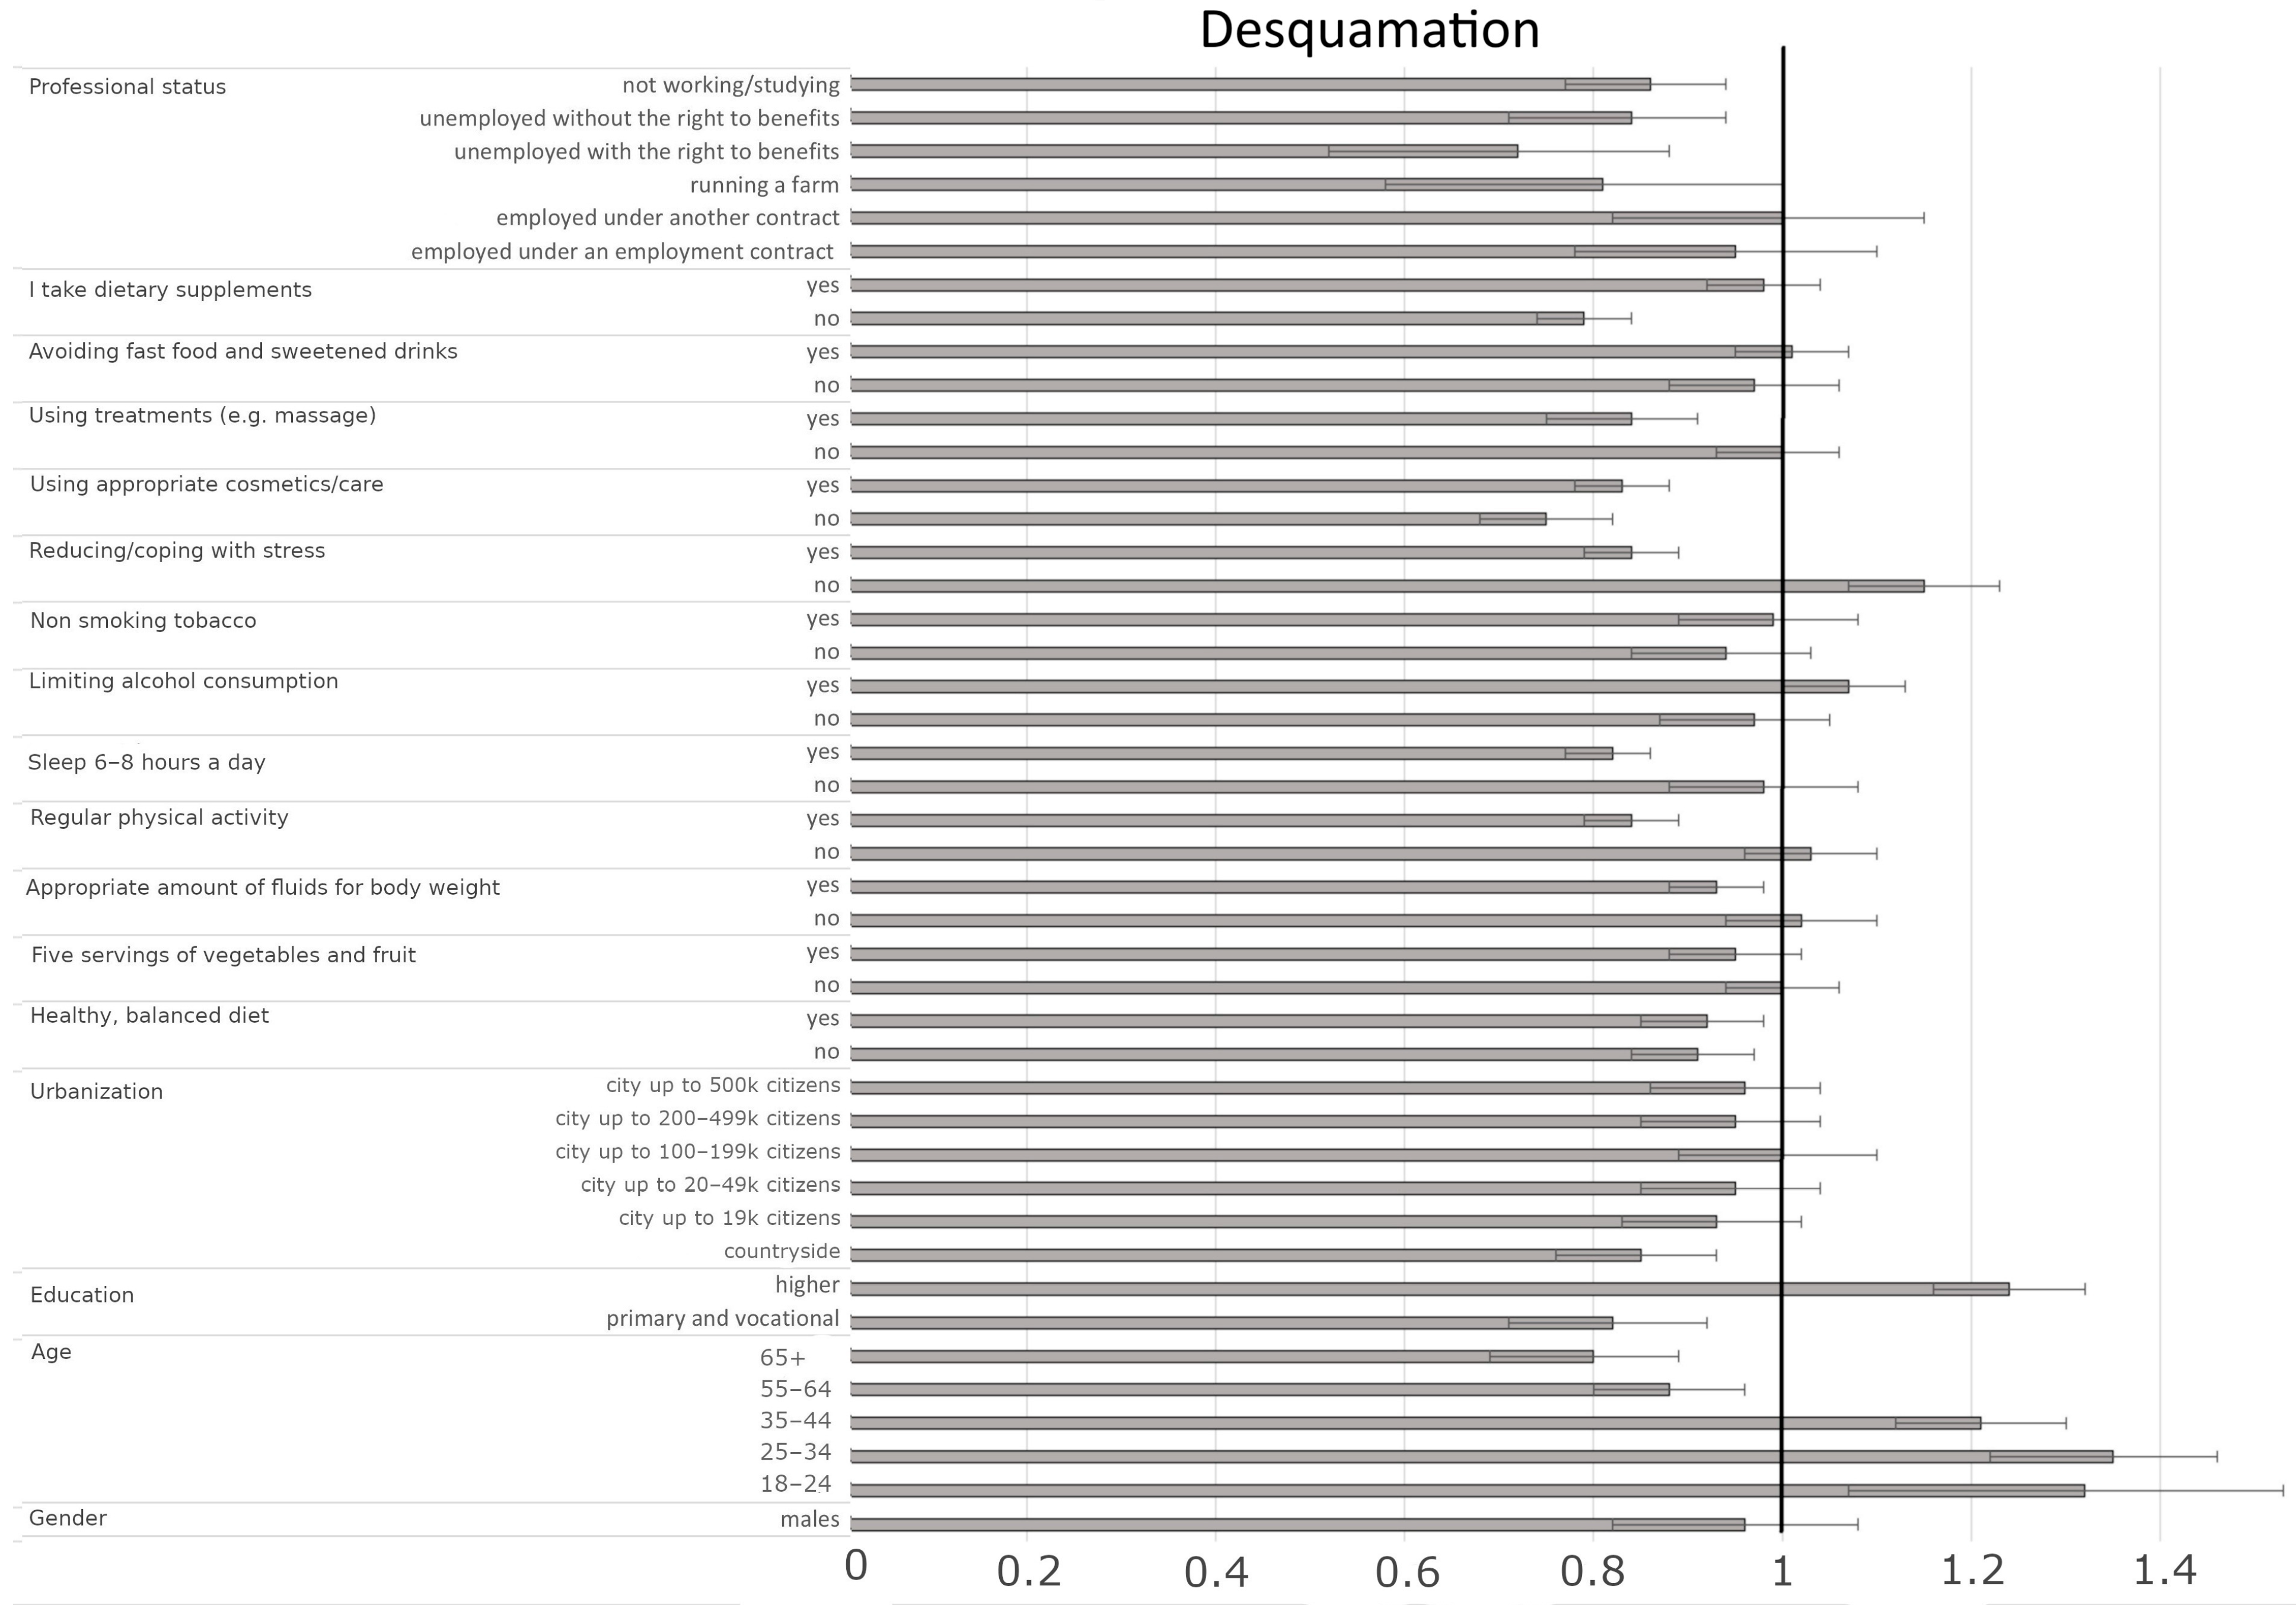
3.4.4. Factors Influencing the Presence of Skin Desquamation
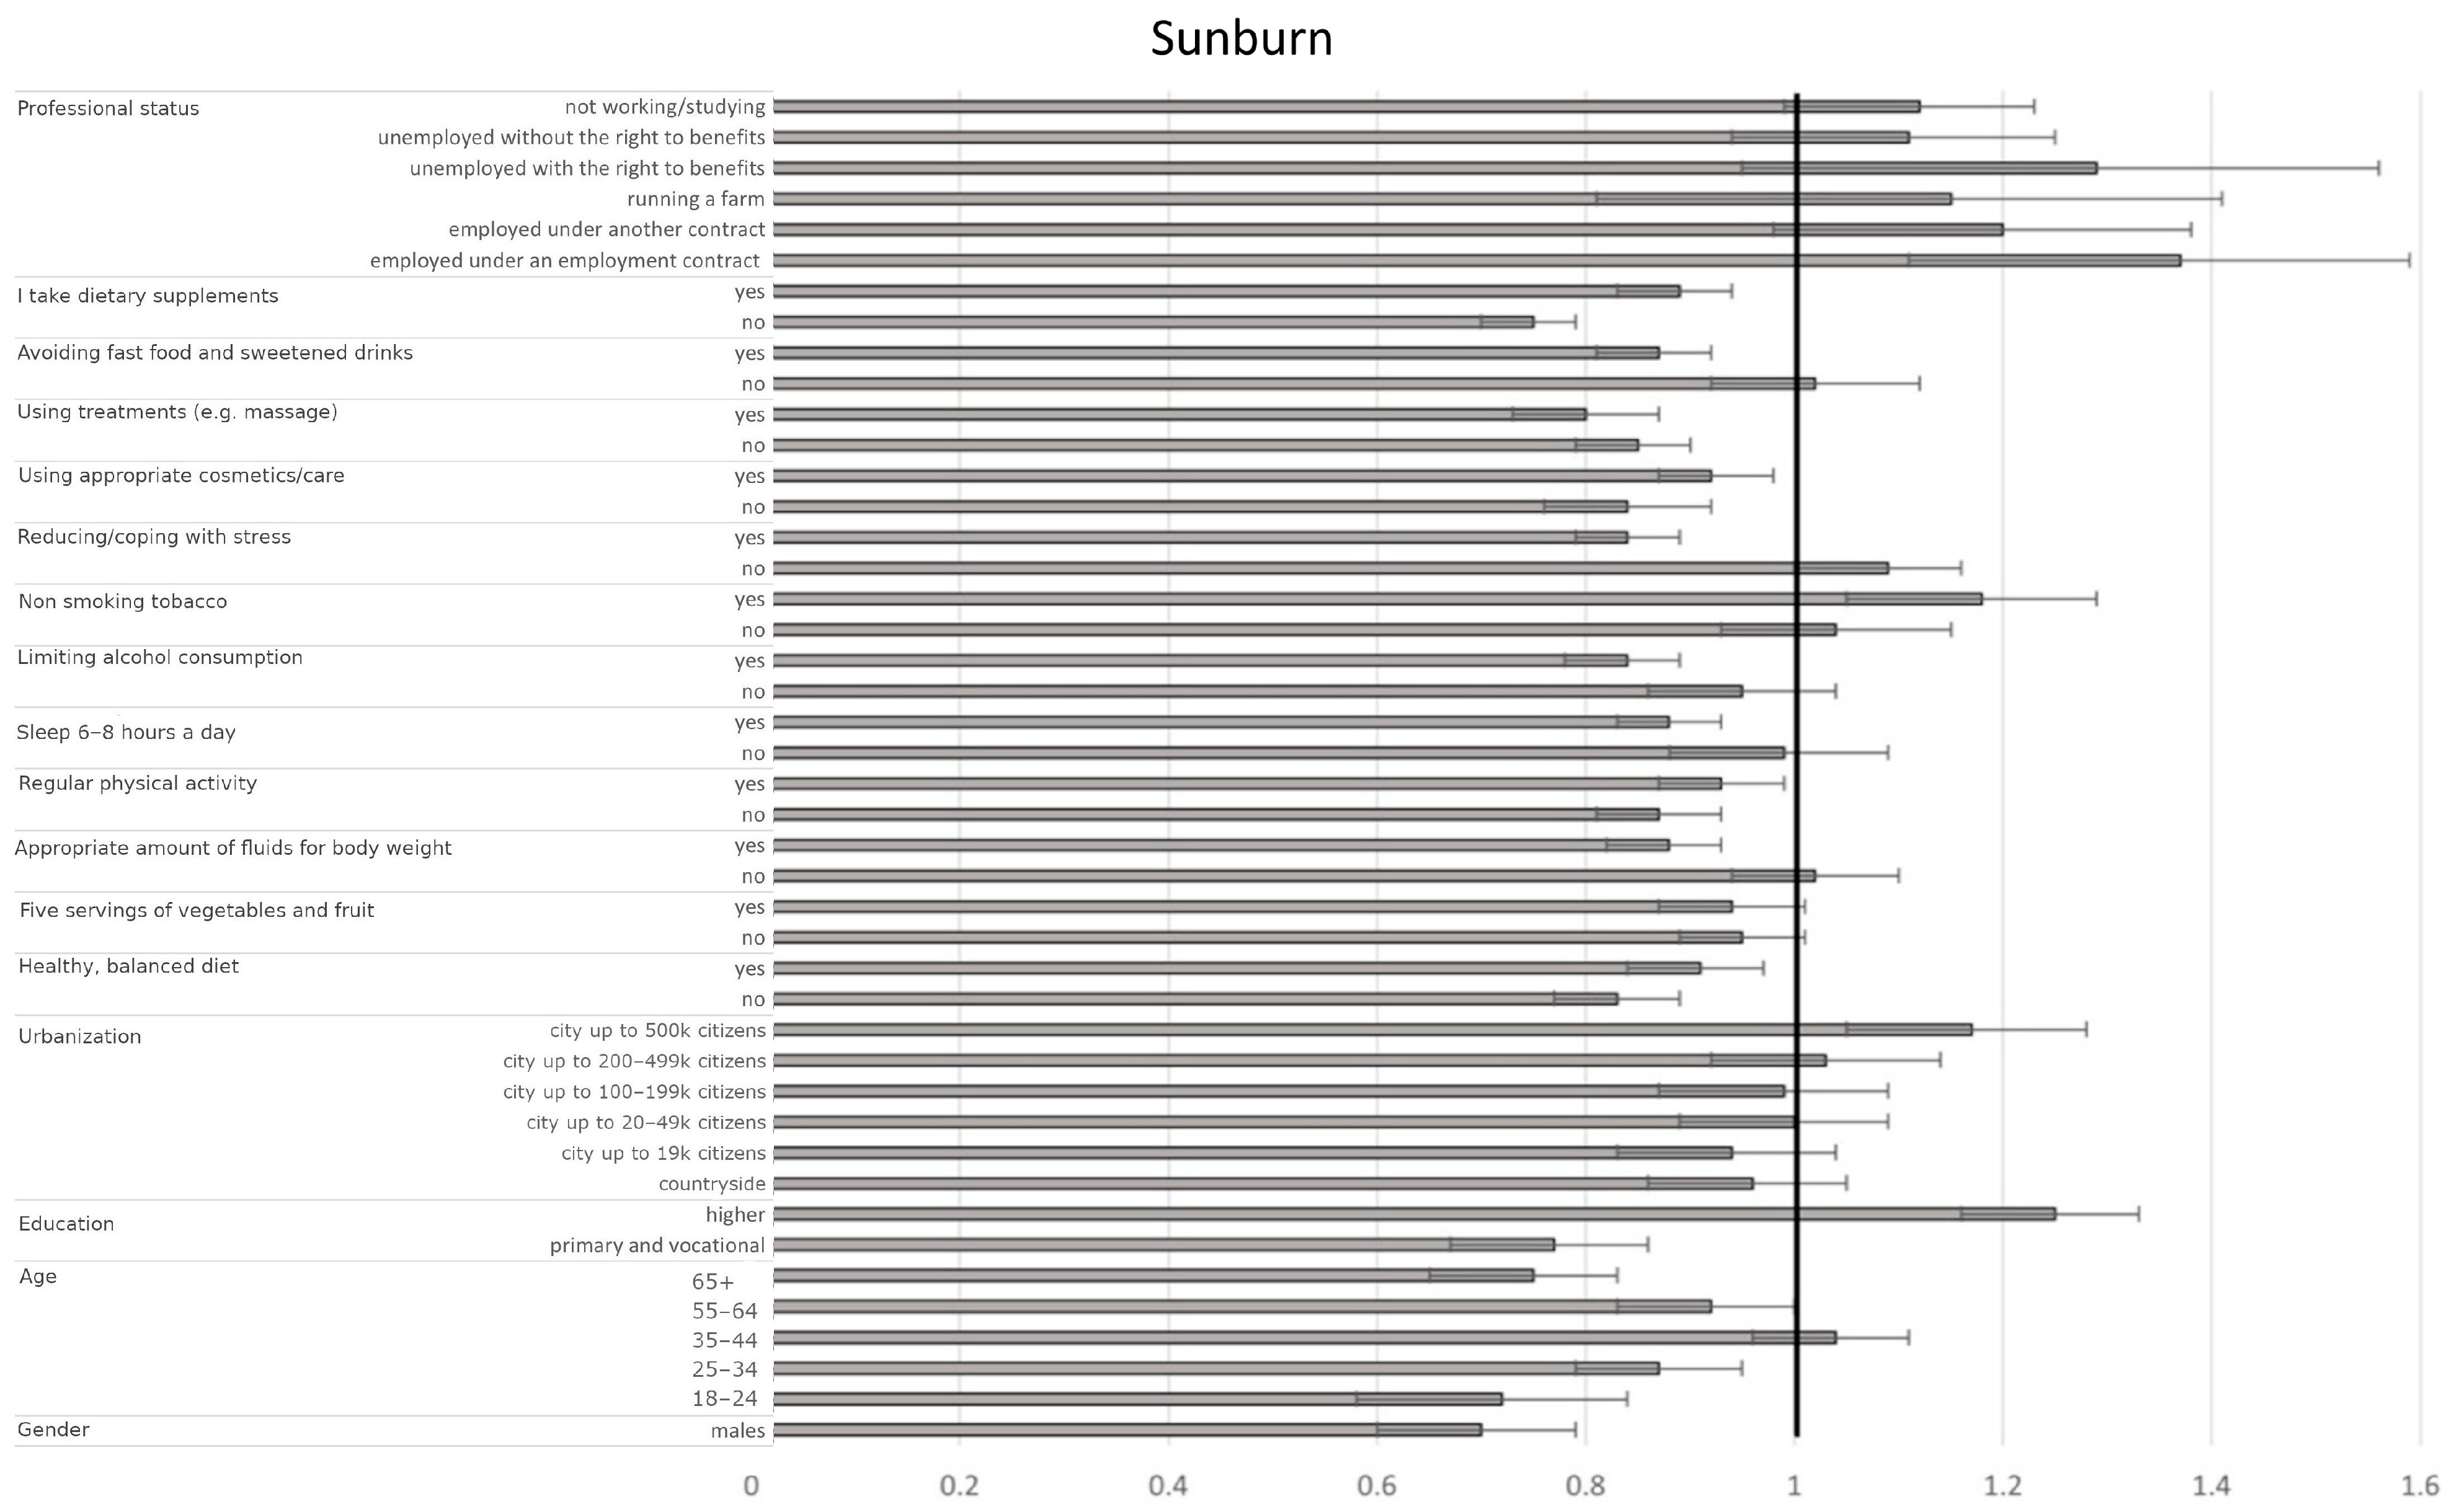
3.4.5. Factors Influencing the Presence of Sunburn
4. Discussion
5. Conclusions
Author Contributions
Funding
Institutional Review Board Statement
Informed Consent Statement
Data Availability Statement
Acknowledgments
Conflicts of Interest
References
- James, K.A.; Stromin, J.I.; Steenkamp, N.; Combrinck, M.I. Understanding the relationships between physiological and psychosocial stress, cortisol and cognition. Front. Endocrinol. 2023, 14, 1085950. [Google Scholar] [CrossRef] [PubMed]
- McEwen, B.S.; Gianaros, P.J. Central role of the brain in stress and adaptation: Links to socioeconomic status, health, and disease. Ann. New York Acad. Sci. 2010, 1186, 190–222. [Google Scholar] [CrossRef] [PubMed]
- Al’Abadie, M.S.; Kent, G.G.; Gawkrodger, D.J. The relationship between stress and the onset and exacerbation of psoriasis and other skin conditions. Br. J. Dermatol. 1994, 130, 199–203. [Google Scholar] [CrossRef] [PubMed]
- Shah, N.; Shukla, R.; Chaudhari, P.; Patil, S.; Patil, A.; Nadkarni, N.; Goldust, M. Prevalence of acne vulgaris and its clinico-epidemiological pattern in adult patients: Results of a prospective, observational study. J. Cosmet. Dermatol. 2021, 20, 3672–3678. [Google Scholar] [CrossRef]
- Balieva, F.; Schut, C.; Kupfer, J.; Lien, L.; Misery, L.; Sampogna, F.; von Euler, L.; Dalgard, F.J. Perceived stress in patients with inflammatory and non-inflammatory skin conditions. An observational controlled study among 255 Norwegian dermatological outpatients. Ski. Health Dis. 2022, 2, e162. [Google Scholar] [CrossRef]
- Gouin, J.P.; Kiecolt-Glaser, J.K. The impact of psychological stress on wound healing: Methods and mechanisms. Immunol. Allergy Clin. N. Am. 2011, 31, 81–93. [Google Scholar] [CrossRef]
- Rojas, I.G.; Padgett, D.A.; Sheridan, J.F.; Marucha, P.T. Stress-induced susceptibility to bacterial infection during cutaneous wound healing. Brain Behav. Immun. 2002, 16, 74–84. [Google Scholar] [CrossRef]
- Hall, J.M.; Cruser, D.; Podawiltz, A.; Mummert, D.I.; Jones, H.; Mummert, M.E. Psychological Stress and the Cutaneous Immune Response: Roles of the HPA Axis and the Sympathetic Nervous System in Atopic Dermatitis and Psoriasis. Dermatol. Res. Pract. 2012, 2012, 403908. [Google Scholar] [CrossRef]
- Chen, Y.; Lyga, J. Brain-skin connection: Stress, inflammation and skin aging. Inflamm. Allergy Drug Targets 2014, 13, 177–190. [Google Scholar] [CrossRef]
- Graubard, R.; Perez-Sanchez, A.; Katta, R. Stress and Skin: An Overview of Mind Body Therapies as a Treatment Strategy in Dermatology. Dermatol. Pract. Concept. 2021, 11, e2021091. [Google Scholar] [CrossRef]
- Oizumi, R.; Sugimoto, Y.; Aibara, H. The Potential of Exercise on Lifestyle and Skin Function: Narrative Review. JMIR Dermatol. 2024, 7, e51962. [Google Scholar] [CrossRef] [PubMed]
- Katta, R.; Desai, S.P. Diet and Dermatology: The Role of Dietary Intervention in Skin Disease. J. Clin. Aesthet. Dermatol. 2014, 7, 46–51. [Google Scholar] [PubMed]
- Schagen, S.K.; Zampeli, V.A.; Makrantonaki, E.; Zouboulis, C.C. Discovering the link between nutrition and skin aging. Dermato-Endocrinology 2012, 4, 298–307. [Google Scholar] [CrossRef] [PubMed]
- Kliniec, K.; Tota, M.; Zalesińska, A.; Łyko, M.; Jankowska-Konsur, A. Skin Cancer Risk, Sun-Protection Knowledge and Behavior in Athletes-A Narrative Review. Cancers 2023, 15, 3281. [Google Scholar] [CrossRef]
- Naka, F.; Melnick, L.; Gorelik, M.; Morel, K.D. A dermatologic perspective on multisystem inflammatory syndrome in children. Clin. Dermatol. 2020, 39, 163. [Google Scholar] [CrossRef]
- Gaudinski, M.R.; Milner, J.D. Atopic Dermatitis and Allergic Urticaria: Cutaneous Manifestations of Immunodeficiency. Immunol. Allergy Clin. N. Am. 2016, 37, 1–10. [Google Scholar] [CrossRef]
- Yang, J.; Yang, H.; Xu, A.; He, L. A Review of Advancement on Influencing Factors of Acne: An Emphasis on Environment Characteristics. Front. Public Health 2020, 8, 450. [Google Scholar] [CrossRef]
- Araviiskaia, E.; Berardesca, E.; Bieber, T.; Gontijo, G.; Viera, M.S.; Marrot, L.; Chuberre, B.; Dreno, B. The impact of airborne pollution on skin. J. Eur Acad. Dermatol. Venereol. 2019, 33, 1496–1505. [Google Scholar] [CrossRef]
- Kupryś-Lipińska, I.; Elgalal, A.; Kuna, P. Urban-rural differences in the prevalence of atopic diseases in the general population in Lodz Province (Poland). Adv. Dermatol. Allergol. /Postępy Dermatol. I Alergologii 2009, 26, 249–256. [Google Scholar]
- Krzych-Fałta, E.; Furmańczyk, K.; Piekarska, B.; Tomaszewska, A.; Sybilski, A.; Samoliński, B.K. Allergies in urban versus countryside settings in Poland as part of the Epidemiology of the Allergic Diseases in Poland (ECAP) study—challenge the early differential diagnosis. Alergol. Pol. 2016, 3, 253–258. [Google Scholar] [CrossRef]
- Priftis, K.N.; Anthracopoulos, M.B.; Nikolaou-Papanagiotou, A.; Mantziou, V.; Paliatsos, A.G.; Tzavelas, G.; Nicolaidou, P.; Mantzouranis, E. Increased sensitization in urban vs. rural environment--rural protection or an urban living effect? Pediatr. Allergy Immunol. 2008, 19, 209–216. [Google Scholar] [CrossRef] [PubMed]
- Yosipovitch, G.; Skayem, C.; Saint Aroman, M.; Taieb, C.; Inane, M.; Ben Hayoun, Y.; Cullel, N.P.; Baissac, C.; Halioua, B.; Richard, M.A.; et al. International study on prevalence of itch: Examining the role of itch as a major global public health problem. Br. J. Dermatol. 2024, 191, 713–719. [Google Scholar] [CrossRef] [PubMed]
- Matterne, U.; Apfelbacher, C.J.; Loerbroks, A.; Schwarzer, T.; Büttner, M.; Ofenloch, R.; Diepgen, T.; Weisshaar, E. Prevalence, correlates and characteristics of chronic pruritus: A population-based cross-sectional study. Acta Derm. Venereol. 2011, 91, 674–679. [Google Scholar] [CrossRef] [PubMed]
- Weisshaar, E.; Dalgard, F.J. Epidemiology of Itch: Adding to the Burden of Skin Morbidity. Acta Derm. Venereol. 2009, 89, 339–350. [Google Scholar] [CrossRef]

| Trait | Men n (%) | Women n (%) | Other n (%) | Total n (%) | Men-Women Difference Significance |
|---|---|---|---|---|---|
| Gender | 4887 (18.1) | 22,043 (81.7) | 70 (0.3) | 27,000 (100.0) | |
| AGE (years) | χ2 = 382.47; df = 5; p < 0.001 | ||||
| 18–24 | 172 (0.6) | 770 (2.9) | 13 (0.05) | 955 (3.5) | |
| 25–34 | 658 (2.4) | 3061 (11.3) s | 9 (0.03) | 3728 (13.8) | |
| 35–44 | 987 (3.7) | 5312 (19.7) s | 13 (0.05) | 6312 (23.4) | |
| 45–54 | 849 (3.1) | 5530 (20.5) s | 17 (0.1) | 6396 (23.7) | |
| 55–64 | 864 (3.2) s | 3653 (13.5) | 5 (0.02) | 4522 (16.7) | |
| 65+ | 1357 (5.0) s | 3717 (13.8) | 13 (0.05) | 5087 (18.8) | |
| Education | χ2 = 46.97; df = 2; p < 0.001 | ||||
| primary and vocational | 562 (2.1) s | 1853 (6.9) | 13 (0.05) | 2428 (9.0) | |
| secondary and post-secondary | 1755 (6.5) | 8149 (30.2) s | 31 (0.1) | 9935 (36.8) | |
| higher | 2570 (9.5) | 12,041 (44.6) s | 26 (0.1) | 14,637 (54.2) | |
| Urbanization | χ2 = 113.46 df = 6 p < 0.001 | ||||
| countryside | 861 (3.2) | 4609 (17.1) s | 17 (0.1) | 5487 (20.3) | |
| city up to 19,000 citizens | 547 (2.0) | 2538 (9.4) s | 5 (0.02) | 3090 (11.4) | |
| city of 20–49,000 citizens | 619 (2.3) | 3517 (13.0) s | 1 (0.004) | 4137 (15.3) | |
| city of 50–99,000 citizens | 558 (2.1) s | 2382 (8.8) | 7 (0.03) | 2947 (10.9) | |
| city of 100–199,000 citizens | 571 (2.1) s | 2162 (8.0) | 7 (0.03) | 2740 (10.1) | |
| city of 200–499,000 citizens | 528 (2.0) | 2497 (9.2) s | 11 (0.04) | 3036 | |
| city of 500,000 or more citizens | 1203 (4.5) s | 4338 (16.1) | 22 (0.1) | 5563 (20.6) | |
| Professional Status | χ2 = 125.44 df = 6 p < 0.001 | ||||
| Employed under an employment contract or running your own business | 2805 (10.4) | 13,265 (49.1) s | 34 (0.1) | 16,104 (59.6) | |
| Employed under another contract (mandate contract. contract for specific work) | 314 (1.2) | 1381 (5.1) | 4 (0.01) | 1699 (6.3) | |
| Running a farm | 60 (0.2) | 296 (1.1) | 1 (0.004) | 357 (1.3) | |
| Pensioner | 1437 (5.3) s | 5121 (19.0) | 15 (0.1) | 6573 (24.3) | |
| Unemployed with the right to benefits | 32 (0.1) | 263 (1.0) s | 1 (0.004%) | 296 (1.1) | |
| Unemployed without the right to benefits | 118 (0.4) | 813 (3.0) s | 6 (0.02) | 937 (3.5) | |
| Not working/studying | 121 (0.4) | 904 (3.3) s | 9 (0.03) | 1034 (3.8) | |
| Trait | Men | Women | Other | Total | Men-Women Difference Significance |
|---|---|---|---|---|---|
| Pruritus | χ2 = 5.86; df = 4; p = 0.2098 | ||||
| at least several times a month | 1216 | 5221 | 21 | 6458 | |
| % | 4.5% | 19.3% | 0.1% | 23.9% | |
| occasionally—less than a few times a month | 1977 | 9233 | 27 | 11,237 | |
| % | 7.3% | 34.2% | 0.1% | 41.6% | |
| never | 1694 | 7589 | 22 | 9305 | |
| % | 6.3% | 28.1% | 0.1% | 34.5% | |
| Burning sensation | χ2 = 97.52; df = 4; p < 0.001 | ||||
| at least several times a month | 390 | 2000 s | 11 | 2401 | |
| % | 1.4% | 7.4% | 0.04% | 8.9% | |
| occasionally—less than a few times a month | 1018 | 5919 s | 20 | 6957 | |
| % | 3.8% | 21.9% | 0.1% | 25.8% | |
| never | 3479 s | 14,124 | 39 | 17,642 | |
| % | 12.9% | 52.3% | 0.1% | 65.3% | |
| Redness | χ2 = 217.59; df = 4; p < 0.001 | ||||
| at least several times a month | 862 | 4756 s | 17 | 5635 | |
| % | 3.2% | 17.6% | 0.1% | 20.9% | |
| occasionally—less than a few times a month | 1476 | 8328 s | 23 | 9827 | |
| % | 5.5% | 30.8% | 0.1% | 36.4% | |
| never | 2549 s | 8959 | 30 | 11,538 | |
| % | 9.4% | 33.2% | 0.1% | 42.7% | |
| Rash | χ2 = 151.04; df = 4; p < 0.001 | ||||
| at least several times a month | 351 s | 1424 | 5 | 1780 | |
| % | 1.3% | 5.3% | 0.02% | 6.6% | |
| occasionally—less than a few times a month | 1121 | 7011 s | 26 | 8158 s | |
| % | 4.15% | 26.0% | 0.1% | 30.2% | |
| never | 3415 s | 13,608 | 39 | 17,062 | |
| % | 12.7% | 50.4% | 0.1% | 63.2% | |
| Desquamation | χ2 = 110.88; df = 4; p < 0.001 | ||||
| at least several times a month | 660 s | 2463 | 16 | 3139 | |
| % | 2.4% | 9.1% | 0.1% | 11.6% | |
| occasionally—less than a few times a month | 962 | 5802 s | 20 | 6784 | |
| % | 3.6% | 21.5% | 0.1% | 25.1% | |
| never | 3265 s | 13,778 | 34 | 17,077 | |
| % | 12.1% | 51.0% | 0.1% | 63.3% | |
| Sunburn | χ2 = 63.71; df = 4; p < 0.001 | ||||
| at least several times a month | 104 s | 393 | 2 | 499 | |
| % | 0.4% | 1.5% | 0.01% | 1.9% | |
| occasionally—less than a few times a month | 1499 | 8067 s | 20 | 9586 | |
| % | 5.6% | 29.9% | 0.07% | 35.5% | |
| never | 3284 s | 13,583 | 48 s | 16,915 | |
| % | 12.2% | 50.3% | 0.2% | 62.7% | |
| Trait | Men | Women | Other | Total | Men-Women Difference Significance |
|---|---|---|---|---|---|
| Freckles | χ2 = 327.73; df = 2; p < 0.001 | ||||
| yes | 797 | 6245 s | 16 | 7058 | |
| % | 3.0% | 23.1% | 0.1% | 26.1% | |
| no | 3789 s | 14,962 | 48 | 18,799 | |
| % | 14.0% | 55.4% | 0.2% | 69.6% | |
| don’t know | 301 s | 836 | 6 | 1143 | |
| % | 1.1% | 3.1% | 0.02% | 4.2% | |
| Moles/birthmarks | χ2 = 133.29; df = 2; p < 0.001 | ||||
| yes | 3182 | 16,089 s | 47 | 19,318 | |
| % | 11.8% | 59.6% | 0.2% | 71.5% | |
| no | 1422 s | 5144 | 13 | 6579 | |
| % | 5.3% | 19.1% | 0.05% | 24.4% | |
| don’t know | 283 s | 810 | 10 | 1103 | |
| % | 1.0% | 3.0% | 0.04% | 4.1% | |
| Discoloration/sunspots | χ2 = 884.71; df = 2; p < 0.001 | ||||
| yes | 981 | 9477 s | 22 | 10,480 | |
| % | 3.6% | 35.1% | 0.1% | 38.8% | |
| no | 3386 s | 10,911 | 37 | 14,334 | |
| % | 12.5% | 40.4% | 0.1% | 53.1% | |
| don’t know | 520 s | 1655 | 11 | 2186 | |
| % | 1.9% | 6.1% | 0.04% | 8.1% | |
| Visible blood vessels | χ2 = 1187.95; df = 2; p < 0.001 | ||||
| yes | 1227 | 11,531 s | 32 | 12,790 | |
| % | 4.5% | 42.7% | 0.1% | 47.4% | |
| no | 3210 s | 9176 | 29 | 12,415 | |
| % | 11.9% | 34.0% | 0.1% | 46.0% | |
| don’t know | 450 s | 1336 | 9 | 1795 | |
| % | 1.7% | 4.9% | 0.03% | 6.6% | |
| Dry skin (also if it only affects parts of it) | χ2 = 641.15; df = 2; p < 0.001 | ||||
| yes | 2248 | 14,423 s | 49 | 16,720 | |
| % | 8.3% | 53.4% | 0.2% | 61.93% | |
| no | 2062 s | 5902 | 14 | 7978 | |
| % | 7.6% | 21.9% | 0.1% | 29.55% | |
| don’t know | 577 s | 1718 | 7 | 2302 | |
| % | 2.1% | 6.4% | 0.03% | 8.53% | |
| Oily skin (also if it only affects parts of it) | χ2 = 159.21; df = 2; p < 0.001 | ||||
| yes | 1486 | 8455 s | 31 | 9972 | |
| % | 5.5% | 31.3% | 0.1% | 36.9% | |
| no | 2769 s | 11,698 | 29 | 14,496 | |
| % | 10.3% | 43.3% | 0.1% | 53.7% | |
| don’t know | 632 s | 1890 | 10 | 2532 | |
| % | 2.3% | 7.0% | 0.04% | 9.4% | |
| Delicate wrinkles | χ2 = 1099.32; df = 2; p < 0.001 | ||||
| yes | 2969 | 18,139 s | 44 | 21,152 | |
| % | 11.0% | 67.2% | 0.2% | 78.3% | |
| no | 1471 s | 3072 | 21 | 4564 | |
| % | 5.4% | 11.4% | 0.1% | 16.9% | |
| don’t know | 447 s | 832 | 5 | 1284 | |
| % | 1.7% | 3.1% | 0.02% | 4.8% | |
| Crow’s feet | χ2 = 1428.80; df = 2; p < 0.001 | ||||
| yes | 1086 | 11,406 | 28 | 12,520 | |
| % | 4.0% | 42.2% | 0.1% | 46.4% | |
| no | 3136 s | 9104 | 33 | 12,273 | |
| % | 11.6% | 33.7% | 0.1% | 45.5% | |
| don’t know | 665 s | 1533 | 9 | 2207 | |
| % | 2.5% | 5.7% | 0.03% | 8.2% | |
| Deep wrinkles | χ2 = 151.70; df = 2; p < 0.001 | ||||
| yes | 421 | 3396 s | 11 | 3828 | |
| % | 1.6% | 12.6% | 0.0% | 14.2% | |
| no | 3898 s | 16,258 | 51 | 20,207 | |
| % | 14.4% | 60.2% | 0.2% | 74.8% | |
| don’t know | 568 s | 2389 | 8 | 2965 | |
| % | 2.1% | 8.8% | 0.03% | 11.0% | |
| Glabellar lines (Lion’s frown) | χ2 = 1510.76; df = 2; p < 0.001 | ||||
| yes | 385 | 7907 s | 19 | 8311 | |
| % | 1.4% | 29.3% | 0.1% | 30.8% | |
| no | 3127 s | 10,431 | 35 | 13,593 | |
| % | 11.6% | 38.6% | 0.1% | 50.3% | |
| don’t know | 1375 s | 3705 | 16 | 5096 | |
| % | 5.1% | 13.7% | 0.1% | 18.9% | |
| Breakouts | χ2 = 163.70; df = 2; p < 0.001 | ||||
| yes | 1350 | 8044 s | 31 | 9425 | |
| % | 5.0% | 29.8% | 0.1% | 34.9% | |
| no | 3088 s | 12,611 | 33 | 15,732 | |
| % | 11.4% | 46.7% | 0.1% | 58.3% | |
| don’t know | 449 s | 1388 | 6 | 1843 | |
| % | 1.7% | 5.1% | 0.02% | 6.8% | |
| High sensitivity to external factors/cosmetics | χ2 = 693.64; df = 2; p < 0.001 | ||||
| yes | 720 | 7467 s | 29 | 8216 | |
| % | 2.7% | 27.7% | 0.1% | 30.4% | |
| no | 3285 s | 11,396 | 37 | 14,718 | |
| % | 12.2% | 42.2% | 0.1% | 54.5% | |
| don’t know | 882 s | 3180 | 4 | 4066 | |
| % | 3.3% | 11.8% | 0.01% | 15.1% | |
| Furrows | χ2 = 255.05; df = 2; p < 0.001 | ||||
| yes | 583 | 4864 s | 9 | 5456 | |
| % | 2.2% | 18.0% | 0.0% | 20.2% | |
| no | 3576 s | 14,212 | 50 | 17,838 | |
| % | 13.2% | 52.6% | 0.2% | 66.1% | |
| don’t know | 728 s | 2967 | 11 | 3706 | |
| % | 2.7% | 11.0% | 0.04% | 13.7% | |
| Drooping face oval | χ2 = 1898.490; df = 2; p < 0.001 | ||||
| yes | 492 | 9414 s | 27 | 9933 | |
| % | 1.8% | 34.9% | 0.1% | 36.8% | |
| no | 3379 s | 9006 | 31 | 12,416 | |
| % | 12.5% | 33.4% | 0.1% | 46.0% | |
| don’t know | 1016 s | 3623 | 12 | 4651 | |
| % | 3.8% | 13.4% | 0.04% | 17.2% | |
| Loose skin | χ2 = 1080.79; df = 2; p < 0.001 | ||||
| yes | 576 | 7689 s | 23 | 8288 | |
| % | 2.1% | 28.5% | 0.1% | 30.7% | |
| no | 3462 s | 10,665 | 29 | 14,156 | |
| % | 12.8% | 39.5% | 0.1% | 52.4% | |
| don’t know | 849 s | 3689 | 18 | 4556 | |
| % | 3.1% | 13.7% | 0.1% | 16.9% | |
| Erythema/redness | χ2 = 133.62; df = 2; p < 0.001 | ||||
| yes | 816 | 5336 s | 18 | 6170 | |
| % | 3.0% | 19.8% | 0.1% | 22.9% | |
| no | 3543 s | 14,758 | 39 | 18,340 | |
| % | 13.1% | 54.7% | 0.1% | 67.9% | |
| don’t know | 528 s | 1949 | 13 | 2490 | |
| % | 2.0% | 7.2% | 0.05% | 9.2% | |
| Transverse forehead wrinkles | χ2 = 60.36; df = 2; p < 0.001 | ||||
| yes | 2091 | 9956 s | 28 | 12,075 | |
| % | 7.7% | 36.9% | 0.1% | 44.7% | |
| no | 2285 | 10,501 s | 35 | 12,821 | |
| % | 8.5% | 38.9% | 0.1% | 47.5% | |
| don’t know | 511 s | 1586 | 7 | 2104 | |
| % | 1.9% | 5.9% | 0.03% | 7.8% | |
| Stretch marks | χ2 = 1775.03; df = 2; p < 0.001 | ||||
| yes | 737 | 10,568 s | 31 | 11,336 | |
| % | 2.7% | 39.1% | 0.1% | 42.0% | |
| no | 3750 s | 10,433 | 35 | 14,218 | |
| % | 13.9% | 38.6% | 0.1% | 52.7% | |
| don’t know | 400 s | 1042 | 4 | 1446 | |
| % | 1.5% | 3.9% | 0.01% | 5.4% | |
| Cellulite | χ2 = 6042.44; df = 2; p < 0.001 | ||||
| yes | 283 | 14,452 s | 33 | 14,768 | |
| % | 1.0% | 53.5% | 0.1% | 54.7% | |
| no | 4085 s | 6033 | 30 | 10,148 | |
| % | 15.1% | 22.3% | 0.1% | 37.6% | |
| don’t know | 519 s | 1558 | 7 | 2084 | |
| % | 1.9% | 5.8% | 0.03% | 7.7% | |
| Excessive body hair | χ2 = 86.14; df = 2; p < 0.001 | ||||
| yes | 616 | 3995 s | 10 | 4621 | |
| % | 2.3% | 14.8% | 0.04% | 17.1% | |
| no | 3925 s | 16,629 | 50 | 20,604 | |
| % | 14.5% | 61.6% | 0.2% | 76.3% | |
| don’t know | 346 s | 1419 | 10 | 1775 | |
| % | 1.3% | 5.3% | 0.04% | 6.6% | |
| Reducing/Coping with Stress | |||||
| I try to reduce/deal with stress to take care of my skin. | χ2 = 97.08; df = 2; p < 0.001 | ||||
| yes | 2187 s | 8263 | 28 | 10,478 | |
| % | 8.1% | 30.6% | 0.1% | 38.8% | |
| sometimes | 1906 | 10,111 s | 28 | 12,045 | |
| % | 7.1% | 37.4% | 0.1% | 44.6% | |
| no | 794 | 3669 s | 14 | 4477 | |
| % | 2.9% | 13.6% | 0.1% | 16.6% | |
| Trait | Estimate | OR | Lower 95 CI OR | Uppper 95 CI OR | p |
|---|---|---|---|---|---|
| Intercept 1 | −0.72 | 0.49 | 0.41 | 0.58 | <0.001 |
| Intercept 2 | 1.12 | 3.08 | 2.58 | 3.66 | <0.001 |
| Gender | |||||
| men | −0.01 | 0.99 | 0.88 | 1.12 | 0.9069 |
| women | reference | ||||
| Age | |||||
| 18–24 | −0.04 | 0.96 | 0.82 | 1.13 | 0.6110 |
| 25–34 | −0.01 | 0.99 | 0.91 | 1.07 | 0.7798 |
| 35–44 | 0.04 | 1.04 | 0.97 | 1.11 | 0.2720 |
| 45–54 | reference | ||||
| 55–64 | −0.12 | 0.89 | 0.82 | 0.97 | 0.0053 |
| 65+ | −0.04 | 0.96 | 0.86 | 1.07 | 0.4742 |
| Education | |||||
| primary and vocational | −0.08 | 0.92 | 0.83 | 1.02 | 0.1235 |
| secondary and post-secondary | reference | ||||
| higher | 0.06 | 1.06 | 1.00 | 1.12 | 0.0596 |
| Urbanization | |||||
| countryside | 0.02 | 1.02 | 0.93 | 1.12 | 0.6764 |
| city up to 19,000 citizens | 0.04 | 1.04 | 0.95 | 1.14 | 0.4066 |
| city of 20–49,000 citizens | 0.04 | 1.04 | 0.95 | 1.14 | 0.3801 |
| city of 50–99,000 citizens | reference | ||||
| city of 100–199,000 citizens | −0.01 | 0.99 | 0.90 | 1.10 | 0.8982 |
| city of 200–499,000 citizens | −0.02 | 0.98 | 0.89 | 1.08 | 0.6734 |
| city of to 500,000 or more citizens | 0.06 | 1.06 | 0.98 | 1.16 | 0.1587 |
| A healthy, balanced diet | |||||
| no | −0.08 | 0.93 | 0.87 | 0.99 | 0.0232 |
| sometimes | reference | ||||
| yes | −0.08 | 0.92 | 0.87 | 0.98 | 0.0099 |
| At least five servings of vegetables and fruit | |||||
| no | −0.05 | 0.96 | 0.90 | 1.01 | 0.1274 |
| sometimes | reference | ||||
| yes | −0.09 | 0.91 | 0.86 | 0.98 | 0.0075 |
| Appropriate amount of fluids for body weight | |||||
| no | −0.005 | 1.00 | 0.93 | 1.07 | 0.8949 |
| sometimes | reference | ||||
| yes | −0.07 | 0.93 | 0.89 | 0.98 | 0.0096 |
| Regular physical activity. at least 150 min a week | |||||
| no | 0.08 | 1.09 | 1.03 | 1.16 | 0.0049 |
| sometimes | reference | ||||
| yes | −0.15 | 0.86 | 0.81 | 0.91 | <0.001 |
| Sleep 6–8 h a day | |||||
| no | 0.13 | 1.14 | 1.03 | 1.26 | 0.0098 |
| sometimes | reference | ||||
| yes | −0.17 | 0.84 | 0.80 | 0.89 | <0.001 |
| Severely limiting alcohol consumption | |||||
| no | −0.04 | 0.96 | 0.88 | 1.05 | 0.3582 |
| sometimes | reference | ||||
| yes | 0.06 | 1.06 | 1.00 | 1.12 | 0.0407 |
| Non smoking tobacco products | |||||
| no | 0.09 | 1.09 | 1.00 | 1.20 | 0.0597 |
| sometimes | reference | ||||
| yes | 0.12 | 1.13 | 1.03 | 1.23 | 0.0067 |
| Reducing/coping with stress | |||||
| no | 0.14 | 1.15 | 1.07 | 1.23 | <0.001 |
| sometimes | reference | ||||
| yes | −0.21 | 0.81 | 0.77 | 0.85 | <0.001 |
| Using appropriate cosmetics/care | |||||
| no | −0.22 | 0.80 | 0.74 | 0.87 | <0.001 |
| sometimes | reference | ||||
| yes | −0.19 | 0.83 | 0.79 | 0.88 | <0.001 |
| Using treatments (massages. beauty treatments. aesthetic medicine treatments. etc.) | |||||
| no | 0.03 | 1.03 | 0.97 | 1.09 | 0.3622 |
| sometimes | reference | ||||
| yes | −0.26 | 0.77 | 0.71 | 0.84 | <0.001 |
| Avoiding fast food and sweetened (carbonated or not) drinks | |||||
| no | 0.01 | 1.01 | 0.93 | 1.11 | 0.7860 |
| sometimes | reference | ||||
| yes | −0.08 | 0.92 | 0.87 | 0.97 | 0.0045 |
| I take dietary supplements | |||||
| no | −0.20 | 0.82 | 0.77 | 0.87 | <0.001 |
| sometimes | reference | ||||
| yes | −0.005 | 1.00 | 0.94 | 1.05 | 0.8687 |
| Professional status | |||||
| employed under an employment contract or running your own business | 0.003 | 1.00 | 0.86 | 1.17 | 0.9667 |
| employed under another contract (mandate contract. contract for specific work) | 0.06 | 1.06 | 0.92 | 1.23 | 0.4235 |
| running a farm | −0.11 | 0.89 | 0.71 | 1.12 | 0.3310 |
| pensioner | reference | ||||
| unemployed with the right to benefits | −0.12 | 0.89 | 0.72 | 1.10 | 0.2834 |
| unemployed without the right to benefits | −0.13 | 0.88 | 0.78 | 0.99 | 0.0319 |
| not working/studying | −0.16 | 0.85 | 0.78 | 0.93 | <0.001 |
| Body mass | 0.05 | 1.05 | 0.99 | 1.11 | 0.0940 |
| Trait | Estimate | OR | Lower 95 CI OR | Uppper 95 CI OR | p |
|---|---|---|---|---|---|
| Intercept 1 | −1.73 | 0.18 | 0.15 | 0.22 | <0.001 |
| Intercept 2 | 0.0001 | 1.00 | 0.82 | 1.21 | 0.9989 |
| Gender | |||||
| men | −0.26 | 0.77 | 0.67 | 0.89 | <0.001 |
| women | reference | ||||
| Age | |||||
| 18–24 | −0.03 | 0.97 | 0.81 | 1.15 | 0.7029 |
| 25–34 | −0.02 | 0.98 | 0.90 | 1.08 | 0.7285 |
| 35–44 | 0.03 | 1.03 | 0.95 | 1.11 | 0.4999 |
| 45–54 | reference | ||||
| 55–64 | −0.19 | 0.83 | 0.76 | 0.91 | <0.001 |
| 65+ | −0.23 | 0.80 | 0.70 | 0.90 | <0.001 |
| Education | |||||
| primary and vocational | −0.16 | 0.85 | 0.76 | 0.97 | 0.0118 |
| secondary and post-secondary | reference | ||||
| higher | 0.04 | 1.04 | 0.98 | 1.11 | 0.1827 |
| Urbanization | |||||
| countryside | −0.01 | 0.99 | 0.90 | 1.10 | 0.8954 |
| city up to 19,000 citizens | 0.05 | 1.05 | 0.94 | 1.17 | 0.3952 |
| city of 20–49,000 citizens | 0.04 | 1.04 | 0.94 | 1.15 | 0.4842 |
| city of 50–99,000 citizens | reference | ||||
| city of 100–199,000 citizens | 0.01 | 1.01 | 0.90 | 1.12 | 0.9151 |
| city of 200–499,000 citizens | 0.06 | 1.06 | 0.95 | 1.18 | 0.3073 |
| city up to 500,000 or more citizens | 0.10 | 1.11 | 1.01 | 1.22 | 0.0390 |
| A healthy, balanced diet | |||||
| no | −0.08 | 0.92 | 0.86 | 0.99 | 0.0306 |
| sometimes | reference | ||||
| yes | −0.11 | 0.89 | 0.83 | 0.96 | 0.0011 |
| At least five servings of vegetables and fruit | |||||
| no | −0.04 | 0.96 | 0.90 | 1.02 | 0.1907 |
| sometimes | reference | ||||
| yes | 0.01 | 1.01 | 0.94 | 1.09 | 0.8430 |
| Appropriate amount of fluids for body weight | |||||
| no | −0.02 | 0.98 | 0.91 | 1.06 | 0.6967 |
| sometimes | reference | ||||
| yes | −0.08 | 0.93 | 0.87 | 0.98 | 0.0099 |
| Regular physical activity, at least 150 min a week | |||||
| no | 0.02 | 1.02 | 0.96 | 1.09 | 0.4758 |
| sometimes | reference | ||||
| yes | −0.16 | 0.85 | 0.80 | 0.91 | <0.001 |
| Sleep 6–8 h a day | |||||
| no | 0.15 | 1.16 | 1.04 | 1.29 | 0.0057 |
| sometimes | reference | ||||
| yes | −0.22 | 0.80 | 0.75 | 0.85 | <0.001 |
| Severely limiting alcohol consumption | |||||
| no | −0.07 | 0.93 | 0.85 | 1.02 | 0.1400 |
| sometimes | reference | ||||
| yes | 0.04 | 1.04 | 0.98 | 1.11 | 0.1954 |
| Non smoking tobacco products | |||||
| no | 0.01 | 1.01 | 0.91 | 1.12 | 0.9149 |
| sometimes | reference | ||||
| yes | −0.001 | 1.00 | 0.91 | 1.10 | 0.9884 |
| Reducing/coping with stress | |||||
| no | 0.12 | 1.13 | 1.05 | 1.21 | 0.0014 |
| sometimes | reference | ||||
| yes | −0.25 | 0.78 | 0.73 | 0.83 | <0.001 |
| Using appropriate cosmetics/care | |||||
| no | −0.25 | 0.78 | 0.71 | 0.86 | <0.001 |
| sometimes | reference | ||||
| yes | −0.04 | 0.97 | 0.91 | 1.02 | 0.2450 |
| Using treatments (massages. beauty treatments. aesthetic medicine treatments. etc.) | |||||
| no | −0.04 | 0.96 | 0.91 | 1.03 | 0.2568 |
| sometimes | reference | ||||
| yes | −0.22 | 0.80 | 0.73 | 0.88 | <0.001 |
| Avoiding fast food and sweetened (carbonated or not) drinks | |||||
| no | −0.07 | 0.94 | 0.85 | 1.03 | 0.1897 |
| sometimes | reference | ||||
| yes | −0.10 | 0.90 | 0.85 | 0.96 | 0.0012 |
| I take dietary supplements | |||||
| no | −0.19 | 0.83 | 0.78 | 0.88 | <0.001 |
| sometimes | reference | ||||
| yes | 0.04 | 1.04 | 0.98 | 1.11 | 0.2014 |
| Professional status | |||||
| employed under an employment contract or running your own business | 0.11 | 1.11 | 0.94 | 1.32 | 0.2196 |
| employed under another contract (mandate contract. contract for specific work) | 0.06 | 1.06 | 0.90 | 1.25 | 0.4897 |
| running a farm | 0.02 | 1.02 | 0.79 | 1.31 | 0.8697 |
| pensioner | reference | ||||
| unemployed with the right to benefits | −0.04 | 0.96 | 0.75 | 1.21 | 0.7185 |
| unemployed without the right to benefits | −0.05 | 0.95 | 0.83 | 1.09 | 0.4738 |
| not working/studying | −0.13 | 0.88 | 0.80 | 0.98 | 0.0168 |
| Body mass | 0.06 | 1.06 | 1.00 | 1.13 | 0.0692 |
| Trait | Estimate | OR | Lower 95 CI OR | Uppper 95 CI OR | p |
|---|---|---|---|---|---|
| Intercept 1 | −1.02 | 0.36 | 0.30 | 0.43 | <0.001 |
| Intercept 2 | 0.71 | 2.04 | 1.71 | 2.43 | <0.001 |
| Gender | |||||
| men | −0.30 | 0.74 | 0.65 | 0.84 | <0.001 |
| women | reference | ||||
| Age (years) | |||||
| 18–24 | 0.47 | 1.60 | 1.36 | 1.87 | <0.001 |
| 25–34 | 0.31 | 1.36 | 1.25 | 1.48 | <0.001 |
| 35–44 | 0.17 | 1.19 | 1.11 | 1.27 | <0.001 |
| 45–54 | reference | ||||
| 55–64 | −0.24 | 0.79 | 0.72 | 0.85 | <0.001 |
| 65+ | −0.39 | 0.68 | 0.60 | 0.76 | <0.001 |
| Education | |||||
| primary and vocational | −0.33 | 0.72 | 0.64 | 0.81 | <0.001 |
| secondary and post-secondary | reference | ||||
| higher | 0.16 | 1.17 | 1.10 | 1.24 | <0.001 |
| Urbanization | |||||
| countryside | −0.08 | 0.92 | 0.84 | 1.01 | 0.0876 |
| city up to 19,000 citizens | −0.02 | 0.98 | 0.89 | 1.08 | 0.7329 |
| city of 20–49,000 citizens | 0.03 | 1.03 | 0.94 | 1.13 | 0.4865 |
| city of 50–99,000 citizens | reference | ||||
| city of 100–199,000 citizens | 0.10 | 1.11 | 1.00 | 1.22 | 0.0449 |
| city of 200–499,000 citizens | 0.16 | 1.17 | 1.06 | 1.29 | 0.0016 |
| city of 500,000 or more citizens | 0.16 | 1.18 | 1.08 | 1.29 | <0.001 |
| A healthy, balanced diet | |||||
| no | −0.14 | 0.87 | 0.81 | 0.93 | <0.001 |
| sometimes | reference | ||||
| yes | −0.11 | 0.90 | 0.84 | 0.95 | <0.001 |
| At least five servings of vegetables and fruit | |||||
| no | −0.03 | 0.97 | 0.91 | 1.03 | 0.2840 |
| sometimes | reference | ||||
| yes | −0.02 | 0.98 | 0.92 | 1.05 | 0.6553 |
| Appropriate amount of fluids for body weight | |||||
| no | 0.05 | 1.05 | 0.97 | 1.13 | 0.2156 |
| sometimes | reference | ||||
| yes | −0.08 | 0.92 | 0.87 | 0.97 | 0.0017 |
| Regular physical activity. at least 150 min a week | |||||
| no | 0.02 | 1.02 | 0.96 | 1.09 | 0.4457 |
| sometimes | reference | ||||
| yes | −0.11 | 0.90 | 0.85 | 0.95 | <0.001 |
| Sleep 6–8 h a day | |||||
| no | 0.07 | 1.07 | 0.97 | 1.18 | 0.1781 |
| sometimes | reference | ||||
| yes | −0.19 | 0.83 | 0.78 | 0.87 | <0.001 |
| Severely limiting alcohol consumption | |||||
| no | −0.02 | 0.98 | 0.90 | 1.07 | 0.7138 |
| sometimes | reference | ||||
| yes | −0.05 | 0.95 | 0.90 | 1.01 | 0.1079 |
| Nonsmoking tobacco products | |||||
| no | −0.03 | 0.98 | 0.89 | 1.07 | 0.5976 |
| sometimes | reference | ||||
| yes | 0.06 | 1.06 | 0.97 | 1.16 | 0.2113 |
| Reducing/coping with stress | |||||
| no | 0.16 | 1.17 | 1.10 | 1.26 | <0.001 |
| sometimes | reference | ||||
| yes | −0.25 | 0.78 | 0.74 | 0.82 | <0.001 |
| Using appropriate cosmetics/care | |||||
| no | −0.42 | 0.66 | 0.61 | 0.72 | <0.001 |
| sometimes | reference | ||||
| yes | 0.03 | 1.03 | 0.98 | 1.09 | 0.2346 |
| Using treatments (massages. beauty treatments. aesthetic medicine treatments. etc.) | |||||
| no | −0.06 | 0.94 | 0.89 | 0.99 | 0.0250 |
| sometimes | reference | ||||
| yes | −0.16 | 0.86 | 0.79 | 0.93 | <0.001 |
| Avoiding fast food and sweetened (carbonated or not) drinks | |||||
| no | −0.03 | 0.97 | 0.89 | 1.06 | 0.5432 |
| sometimes | reference | ||||
| yes | −0.11 | 0.90 | 0.84 | 0.95 | <0.001 |
| I take dietary supplements | |||||
| no | −0.19 | 0.83 | 0.78 | 0.88 | <0.001 |
| sometimes | reference | ||||
| yes | 0.04 | 1.04 | 0.98 | 1.10 | 0.1891 |
| Professional status | |||||
| employed under an employment contract or running your own business | 0.26 | 1.30 | 1.11 | 1.52 | 0.0010 |
| employed under another contract (mandate contract. contract for specific work) | 0.22 | 1.25 | 1.07 | 1.45 | 0.0038 |
| running a farm | −0.04 | 0.96 | 0.76 | 1.21 | 0.7354 |
| pensioner | reference | ||||
| unemployed with the right to benefits | 0.07 | 1.07 | 0.86 | 1.33 | 0.5226 |
| unemployed without the right to benefits | 0.08 | 1.09 | 0.96 | 1.23 | 0.1774 |
| not working/studying | 0.04 | 1.04 | 0.95 | 1.14 | 0.4006 |
| Body mass | 0.07 | 1.07 | 1.01 | 1.13 | 0.0212 |
| Trait | Estimate | OR | Lower 95 CI OR | Uppper 95 CI OR | p |
|---|---|---|---|---|---|
| Intercept 1 | −1.73 | 0.18 | 0.15 | 0.22 | <0.001 |
| Intercept 2 | 0.0001 | 1.00 | 0.82 | 1.21 | 0.9989 |
| Gender | |||||
| men | −0.26 | 0.77 | 0.67 | 0.89 | <0.001 |
| women | reference | ||||
| Age | |||||
| 18–24 | −0.03 | 0.97 | 0.81 | 1.15 | 0.7029 |
| 25–34 | −0.02 | 0.98 | 0.90 | 1.08 | 0.7285 |
| 35–44 | 0.03 | 1.03 | 0.95 | 1.11 | 0.4999 |
| 45–54 | reference | ||||
| 55–64 | −0.19 | 0.83 | 0.76 | 0.91 | <0.001 |
| 65+ | −0.23 | 0.80 | 0.70 | 0.90 | <0.001 |
| Education | |||||
| primary and vocational | −0.16 | 0.85 | 0.76 | 0.97 | 0.0118 |
| secondary and post-secondary | reference | ||||
| higher | 0.04 | 1.04 | 0.98 | 1.11 | 0.1827 |
| Urbanization | |||||
| countryside | −0.01 | 0.99 | 0.90 | 1.10 | 0.8954 |
| city up to 19,000 citizens | 0.05 | 1.05 | 0.94 | 1.17 | 0.3952 |
| city of 20–49,000 citizens | 0.04 | 1.04 | 0.94 | 1.15 | 0.4842 |
| city of 50–99,000 citizens | reference | ||||
| city of 100–199,000 citizens | 0.01 | 1.01 | 0.90 | 1.12 | 0.9151 |
| city of 200–499,000 citizens | 0.06 | 1.06 | 0.95 | 1.18 | 0.3073 |
| city up to 500,000 or more citizens | 0.10 | 1.11 | 1.01 | 1.22 | 0.0390 |
| A healthy, balanced diet | |||||
| no | −0.08 | 0.92 | 0.86 | 0.99 | 0.0306 |
| sometimes | reference | ||||
| yes | −0.11 | 0.89 | 0.83 | 0.96 | 0.0011 |
| At least five servings of vegetables and fruit | |||||
| no | −0.04 | 0.96 | 0.90 | 1.02 | 0.1907 |
| sometimes | reference | ||||
| yes | 0.01 | 1.01 | 0.94 | 1.09 | 0.8430 |
| Appropriate amount of fluids for body weight | |||||
| no | −0.02 | 0.98 | 0.91 | 1.06 | 0.6967 |
| sometimes | reference | ||||
| yes | −0.08 | 0.93 | 0.87 | 0.98 | 0.0099 |
| Regular physical activity, at least 150 min a week | |||||
| no | 0.02 | 1.02 | 0.96 | 1.09 | 0.4758 |
| sometimes | reference | ||||
| yes | −0.16 | 0.85 | 0.80 | 0.91 | <0.001 |
| Sleep 6–8 h a day | |||||
| no | 0.15 | 1.16 | 1.04 | 1.29 | 0.0057 |
| sometimes | reference | ||||
| yes | −0.22 | 0.80 | 0.75 | 0.85 | <0.001 |
| Severely limiting alcohol consumption | |||||
| no | −0.07 | 0.93 | 0.85 | 1.02 | 0.1400 |
| sometimes | reference | ||||
| yes | 0.04 | 1.04 | 0.98 | 1.11 | 0.1954 |
| Non smoking tobacco products | |||||
| no | 0.01 | 1.01 | 0.91 | 1.12 | 0.9149 |
| sometimes | reference | ||||
| yes | −0.001 | 1.00 | 0.91 | 1.10 | 0.9884 |
| Reducing/coping with stress | |||||
| no | 0.12 | 1.13 | 1.05 | 1.21 | 0.0014 |
| sometimes | reference | ||||
| yes | −0.25 | 0.78 | 0.73 | 0.83 | <0.001 |
| Using appropriate cosmetics/care | |||||
| no | −0.25 | 0.78 | 0.71 | 0.86 | <0.001 |
| sometimes | reference | ||||
| yes | −0.04 | 0.97 | 0.91 | 1.02 | 0.2450 |
| Using treatments (massages. beauty treatments. aesthetic medicine treatments. etc.) | |||||
| no | −0.04 | 0.96 | 0.91 | 1.03 | 0.2568 |
| sometimes | reference | ||||
| yes | −0.22 | 0.80 | 0.73 | 0.88 | <0.001 |
| Avoiding fast food and sweetened (carbonated or not) drinks | |||||
| no | −0.07 | 0.94 | 0.85 | 1.03 | 0.1897 |
| sometimes | reference | ||||
| yes | −0.10 | 0.90 | 0.85 | 0.96 | 0.0012 |
| I take dietary supplements | |||||
| no | −0.19 | 0.83 | 0.78 | 0.88 | <0.001 |
| sometimes | reference | ||||
| yes | 0.04 | 1.04 | 0.98 | 1.11 | 0.2014 |
| Professional status | |||||
| employed under an employment contract or running your own business | 0.11 | 1.11 | 0.94 | 1.32 | 0.2196 |
| employed under another contract (mandate contract. contract for specific work) | 0.06 | 1.06 | 0.90 | 1.25 | 0.4897 |
| running a farm | 0.02 | 1.02 | 0.79 | 1.31 | 0.8697 |
| pensioner | reference | ||||
| unemployed with the right to benefits | −0.04 | 0.96 | 0.75 | 1.21 | 0.7185 |
| unemployed without the right to benefits | −0.05 | 0.95 | 0.83 | 1.09 | 0.4738 |
| not working/studying | −0.13 | 0.88 | 0.80 | 0.98 | 0.0168 |
| Body mass | 0.06 | 1.06 | 1.00 | 1.13 | 0.0692 |
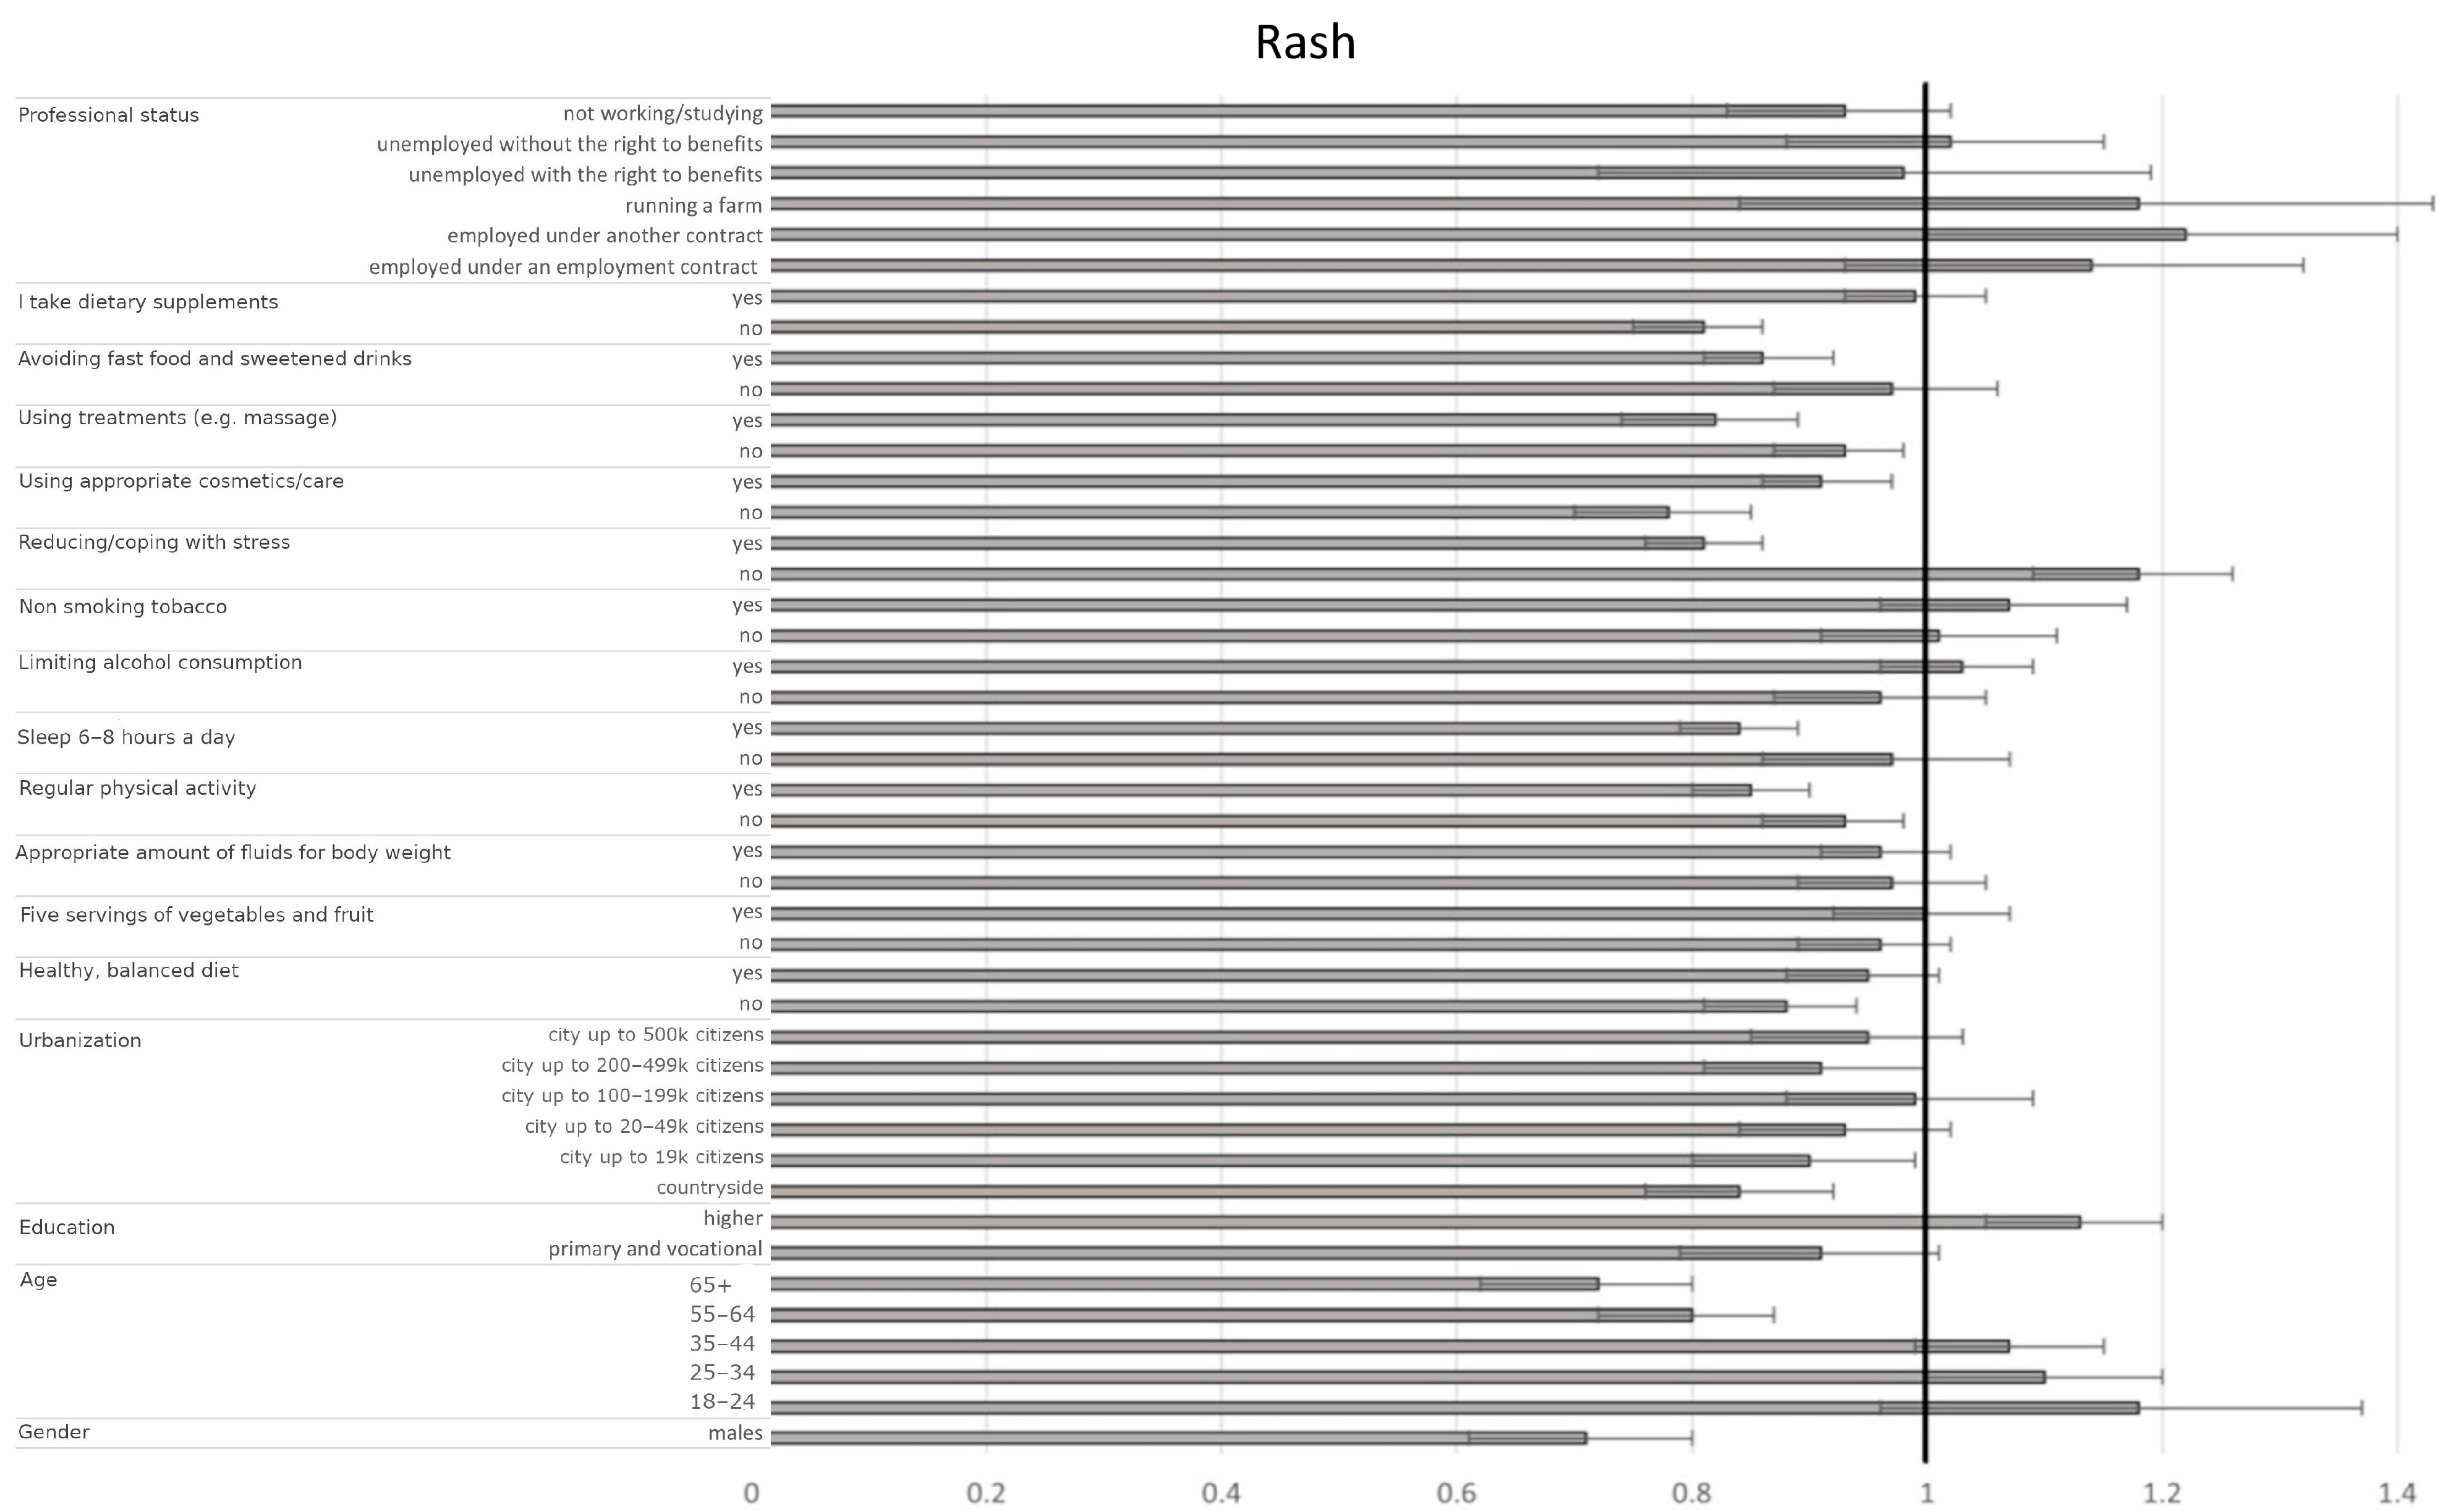
| Trait | Estimate | OR | Lower 95 CI OR | Uppper 95 CI OR | p |
|---|---|---|---|---|---|
| Intercept 1 | −1.51 | 0.22 | 0.18 | 0.27 | <0.001 |
| Intercept 2 | 0.01 | 1.01 | 0.83 | 1.22 | 0.9184 |
| Gender | |||||
| men | −0.04 | 0.96 | 0.84 | 1.10 | 0.5303 |
| women | reference | ||||
| Age | |||||
| 18–24 | 0.28 | 1.32 | 1.11 | 1.57 | 0.0016 |
| 25–34 | 0.30 | 1.35 | 1.24 | 1.48 | <0.001 |
| 35–44 | 0.19 | 1.21 | 1.12 | 1.30 | <0.001 |
| 45–54 | reference | ||||
| 55–64 | −0.13 | 0.88 | 0.80 | 0.96 | 0.0057 |
| 65+ | −0.22 | 0.80 | 0.71 | 0.91 | <0.001 |
| Education | |||||
| primary and vocational | −0.20 | 0.82 | 0.72 | 0.93 | 0.0015 |
| secondary and post-secondary | reference | ||||
| higher | 0.22 | 1.24 | 1.16 | 1.32 | <0.001 |
| Urbanization | |||||
| countryside | −0.16 | 0.85 | 0.77 | 0.94 | 0.0021 |
| city up to 19,000 citizens | −0.07 | 0.93 | 0.84 | 1.03 | 0.1634 |
| city of 20–49,000 citizens | −0.05 | 0.95 | 0.86 | 1.05 | 0.3215 |
| city of 50–99,000 citizens | reference | ||||
| city of 100–199,000 citizens | −0.003 | 1.00 | 0.90 | 1.11 | 0.9507 |
| city of 200–499,000 citizens | −0.05 | 0.95 | 0.86 | 1.05 | 0.3408 |
| city of 500,000 or more citizens | −0.04 | 0.96 | 0.88 | 1.06 | 0.4252 |
| A healthy, balanced diet | |||||
| no | −0.10 | 0.91 | 0.85 | 0.98 | 0.0090 |
| sometimes | reference | ||||
| yes | −0.08 | 0.92 | 0.86 | 0.99 | 0.0225 |
| At least five servings of vegetables and fruit | |||||
| no | −0.002 | 1.00 | 0.94 | 1.06 | 0.9591 |
| sometimes | reference | ||||
| yes | −0.05 | 0.95 | 0.88 | 1.02 | 0.1723 |
| Appropriate amount of fluids for body weight | |||||
| no | 0.02 | 1.02 | 0.94 | 1.10 | 0.6878 |
| sometimes | reference | ||||
| yes | −0.07 | 0.93 | 0.88 | 0.98 | 0.0108 |
| Regular physical activity. at least 150 min a week | |||||
| no | 0.03 | 1.03 | 0.96 | 1.10 | 0.4140 |
| sometimes | reference | ||||
| yes | −0.17 | 0.84 | 0.79 | 0.89 | <0.001 |
| Sleep 6–8 h a day | |||||
| no | −0.02 | 0.98 | 0.88 | 1.08 | 0.6448 |
| sometimes | reference | ||||
| yes | −0.19 | 0.82 | 0.78 | 0.87 | <0.001 |
| Severely limiting alcohol consumption | |||||
| no | −0.03 | 0.97 | 0.89 | 1.07 | 0.5698 |
| sometimes | reference | ||||
| yes | 0.07 | 1.07 | 1.01 | 1.14 | 0.0326 |
| Non smoking tobacco products | |||||
| no | −0.06 | 0.94 | 0.85 | 1.04 | 0.2181 |
| sometimes | reference | ||||
| yes | −0.01 | 0.99 | 0.90 | 1.09 | 0.7705 |
| Reducing/coping with stress | |||||
| no | 0.14 | 1.15 | 1.07 | 1.23 | <0.001 |
| sometimes | reference | ||||
| yes | −0.18 | 0.84 | 0.79 | 0.89 | <0.001 |
| Using appropriate cosmetics/care | |||||
| no | −0.29 | 0.75 | 0.68 | 0.82 | <0.001 |
| sometimes | reference | ||||
| yes | −0.19 | 0.83 | 0.78 | 0.88 | <0.001 |
| Using treatments (massages. beauty treatments. aesthetic medicine treatments. etc.) | |||||
| no | 0.004 | 1.00 | 0.94 | 1.07 | 0.8948 |
| sometimes | reference | ||||
| yes | −0.17 | 0.84 | 0.77 | 0.93 | <0.001 |
| Avoiding fast food and sweetened (carbonated or not) drinks | |||||
| no | −0.03 | 0.97 | 0.88 | 1.06 | 0.4870 |
| sometimes | reference | ||||
| yes | 0.01 | 1.01 | 0.95 | 1.07 | 0.7561 |
| I take dietary supplements | |||||
| no | −0.23 | 0.79 | 0.74 | 0.84 | <0.001 |
| sometimes | reference | ||||
| yes | −0.02 | 0.98 | 0.92 | 1.04 | 0.4299 |
| Professional status | |||||
| employed under an employment contract or running your own business | −0.05 | 0.95 | 0.80 | 1.12 | 0.5295 |
| employed under another contract (mandate contract. contract for specific work) | −0.0002 | 1.00 | 0.85 | 1.18 | 0.9983 |
| running a farm | −0.22 | 0.81 | 0.62 | 1.04 | 0.0955 |
| pensioner | reference | ||||
| unemployed with the right to benefits | −0.33 | 0.72 | 0.56 | 0.92 | 0.0095 |
| unemployed without the right to benefits | −0.17 | 0.84 | 0.74 | 0.97 | 0.0143 |
| not working/studying | −0.15 | 0.86 | 0.78 | 0.95 | 0.0042 |
| Body mass | 0.02 | 1.02 | 0.96 | 1.09 | 0.4507 |
| Trait | Estimate | OR | Lower 95 CI OR | Uppper 95 CI OR | p |
|---|---|---|---|---|---|
| Intercept 1 | −3.46 | 0.03 | 0.03 | 0.04 | <0.001 |
| Intercept 2 | 0.06 | 1.06 | 0.87 | 1.29 | 0.5477 |
| Gender | |||||
| men | −0.36 | 0.70 | 0.61 | 0.80 | <0.001 |
| women | reference | ||||
| Age | |||||
| 18–24 | −0.33 | 0.72 | 0.60 | 0.86 | <0.001 |
| 25–34 | −0.14 | 0.87 | 0.79 | 0.95 | 0.0021 |
| 35–44 | 0.04 | 1.04 | 0.97 | 1.12 | 0.2700 |
| 45–54 | reference | ||||
| 55–64 | −0.08 | 0.92 | 0.84 | 1.01 | 0.0904 |
| 65+ | −0.28 | 0.75 | 0.67 | 0.85 | <0.001 |
| Education | |||||
| primary and vocational | −0.26 | 0.77 | 0.68 | 0.87 | <0.001 |
| secondary and post-secondary | reference | ||||
| higher | 0.22 | 1.25 | 1.17 | 1.34 | <0.001 |
| Urbanization | |||||
| countryside | −0.04 | 0.96 | 0.87 | 1.06 | 0.4379 |
| city up to 19,000 citizens | −0.06 | 0.94 | 0.84 | 1.05 | 0.2526 |
| city of 20–49,000 citizens | 0.005 | 1.00 | 0.91 | 1.11 | 0.9251 |
| city of 50–99,000 citizens | reference | ||||
| city of 100–199,000 citizens | −0.01 | 0.99 | 0.89 | 1.11 | 0.8577 |
| city of 200–499,000 citizens | 0.03 | 1.03 | 0.92 | 1.14 | 0.6225 |
| city up to 500,000 or more citizens | 0.16 | 1.17 | 1.06 | 1.29 | 0.0016 |
| A healthy, balanced diet | |||||
| no | −0.19 | 0.83 | 0.77 | 0.89 | <0.001 |
| sometimes | reference | ||||
| yes | −0.09 | 0.91 | 0.85 | 0.98 | 0.0075 |
| At least five servings of vegetables and fruit | |||||
| no | −0.05 | 0.95 | 0.89 | 1.01 | 0.1210 |
| sometimes | reference | ||||
| yes | −0.06 | 0.94 | 0.87 | 1.01 | 0.1122 |
| Appropriate amount of fluids for body weight | |||||
| no | 0.02 | 1.02 | 0.94 | 1.10 | 0.6224 |
| sometimes | reference | ||||
| yes | −0.12 | 0.88 | 0.83 | 0.94 | <0.001 |
| Regular physical activity, at least 150 min a week | |||||
| no | −0.14 | 0.87 | 0.81 | 0.93 | <0.001 |
| sometimes | reference | ||||
| yes | −0.07 | 0.93 | 0.87 | 0.99 | 0.0218 |
| Sleep 6–8 h a day | |||||
| no | −0.01 | 0.99 | 0.89 | 1.10 | 0.8315 |
| sometimes | reference | ||||
| yes | −0.13 | 0.88 | 0.83 | 0.93 | <0.001 |
| Severely limiting alcohol consumption | |||||
| no | −0.05 | 0.95 | 0.86 | 1.04 | 0.2638 |
| sometimes | reference | ||||
| yes | −0.17 | 0.84 | 0.79 | 0.90 | <0.001 |
| Non smoking tobacco products | |||||
| no | 0.04 | 1.04 | 0.93 | 1.15 | 0.5062 |
| sometimes | reference | ||||
| yes | 0.17 | 1.18 | 1.07 | 1.31 | <0.001 |
| Reducing/coping with stress | |||||
| no | 0.09 | 1.09 | 1.02 | 1.18 | 0.0168 |
| sometimes | reference | ||||
| yes | −0.18 | 0.84 | 0.79 | 0.89 | <0.001 |
| Using appropriate cosmetics/care | |||||
| no | −0.18 | 0.84 | 0.76 | 0.92 | <0.001 |
| sometimes | reference | ||||
| yes | −0.09 | 0.92 | 0.86 | 0.97 | 0.0041 |
| Using treatments (massages, beauty treatments, aesthetic medicine treatments, etc.) | |||||
| no | −0.16 | 0.85 | 0.80 | 0.91 | <0.001 |
| sometimes | reference | ||||
| yes | −0.23 | 0.80 | 0.73 | 0.87 | <0.001 |
| Avoiding fast food and sweetened (carbonated or not) drinks | |||||
| no | 0.02 | 1.02 | 0.92 | 1.12 | 0.7162 |
| sometimes | reference | ||||
| yes | −0.14 | 0.87 | 0.82 | 0.93 | <0.001 |
| I take dietary supplements | |||||
| no | −0.28 | 0.75 | 0.71 | 0.80 | <0.001 |
| sometimes | reference | ||||
| yes | −0.11 | 0.89 | 0.84 | 0.95 | 0.0004 |
| Professional status | |||||
| employed under an employment contract or running your own business | 0.31 | 1.37 | 1.15 | 1.63 | <0.001 |
| employed under another contract (mandate contract. contract for specific work) | 0.18 | 1.20 | 1.02 | 1.42 | 0.0301 |
| running a farm | 0.14 | 1.15 | 0.89 | 1.49 | 0.2845 |
| pensioner | reference | ||||
| unemployed with the right to benefits | 0.25 | 1.29 | 1.02 | 1.63 | 0.0368 |
| unemployed without the right to benefits | 0.11 | 1.11 | 0.97 | 1.28 | 0.1252 |
| not working/studying | 0.12 | 1.12 | 1.01 | 1.25 | 0.0276 |
| Body mass | 0.12 | 1.12 | 1.06 | 1.20 | <0.001 |
Disclaimer/Publisher’s Note: The statements, opinions and data contained in all publications are solely those of the individual author(s) and contributor(s) and not of MDPI and/or the editor(s). MDPI and/or the editor(s) disclaim responsibility for any injury to people or property resulting from any ideas, methods, instructions or products referred to in the content. |
© 2025 by the authors. Licensee MDPI, Basel, Switzerland. This article is an open access article distributed under the terms and conditions of the Creative Commons Attribution (CC BY) license (https://creativecommons.org/licenses/by/4.0/).
Share and Cite
Kubrak, A.; Zimny-Zając, A.; Makuch, S.; Jankowska-Polańska, B.; Tański, W.; Szepietowski, J.C.; Agrawal, S. Psychosocial Factors, Stress, and Well-Being: Associations with Common Dermatological Manifestations in a Large Polish Cross-Sectional Analysis. J. Clin. Med. 2025, 14, 3943. https://doi.org/10.3390/jcm14113943
Kubrak A, Zimny-Zając A, Makuch S, Jankowska-Polańska B, Tański W, Szepietowski JC, Agrawal S. Psychosocial Factors, Stress, and Well-Being: Associations with Common Dermatological Manifestations in a Large Polish Cross-Sectional Analysis. Journal of Clinical Medicine. 2025; 14(11):3943. https://doi.org/10.3390/jcm14113943
Chicago/Turabian StyleKubrak, Anna, Anna Zimny-Zając, Sebastian Makuch, Beata Jankowska-Polańska, Wojciech Tański, Jacek C. Szepietowski, and Siddarth Agrawal. 2025. "Psychosocial Factors, Stress, and Well-Being: Associations with Common Dermatological Manifestations in a Large Polish Cross-Sectional Analysis" Journal of Clinical Medicine 14, no. 11: 3943. https://doi.org/10.3390/jcm14113943
APA StyleKubrak, A., Zimny-Zając, A., Makuch, S., Jankowska-Polańska, B., Tański, W., Szepietowski, J. C., & Agrawal, S. (2025). Psychosocial Factors, Stress, and Well-Being: Associations with Common Dermatological Manifestations in a Large Polish Cross-Sectional Analysis. Journal of Clinical Medicine, 14(11), 3943. https://doi.org/10.3390/jcm14113943