

Are Changes in Physical Activity, Pain, and Quality of Life in Patients with Knee Osteoarthritis After Exercise Therapy and Education Beyond Normal Fluctuations? A Comparative Study

 ,
,  , ,
, , 
Abstract
1. Introduction
2. Method
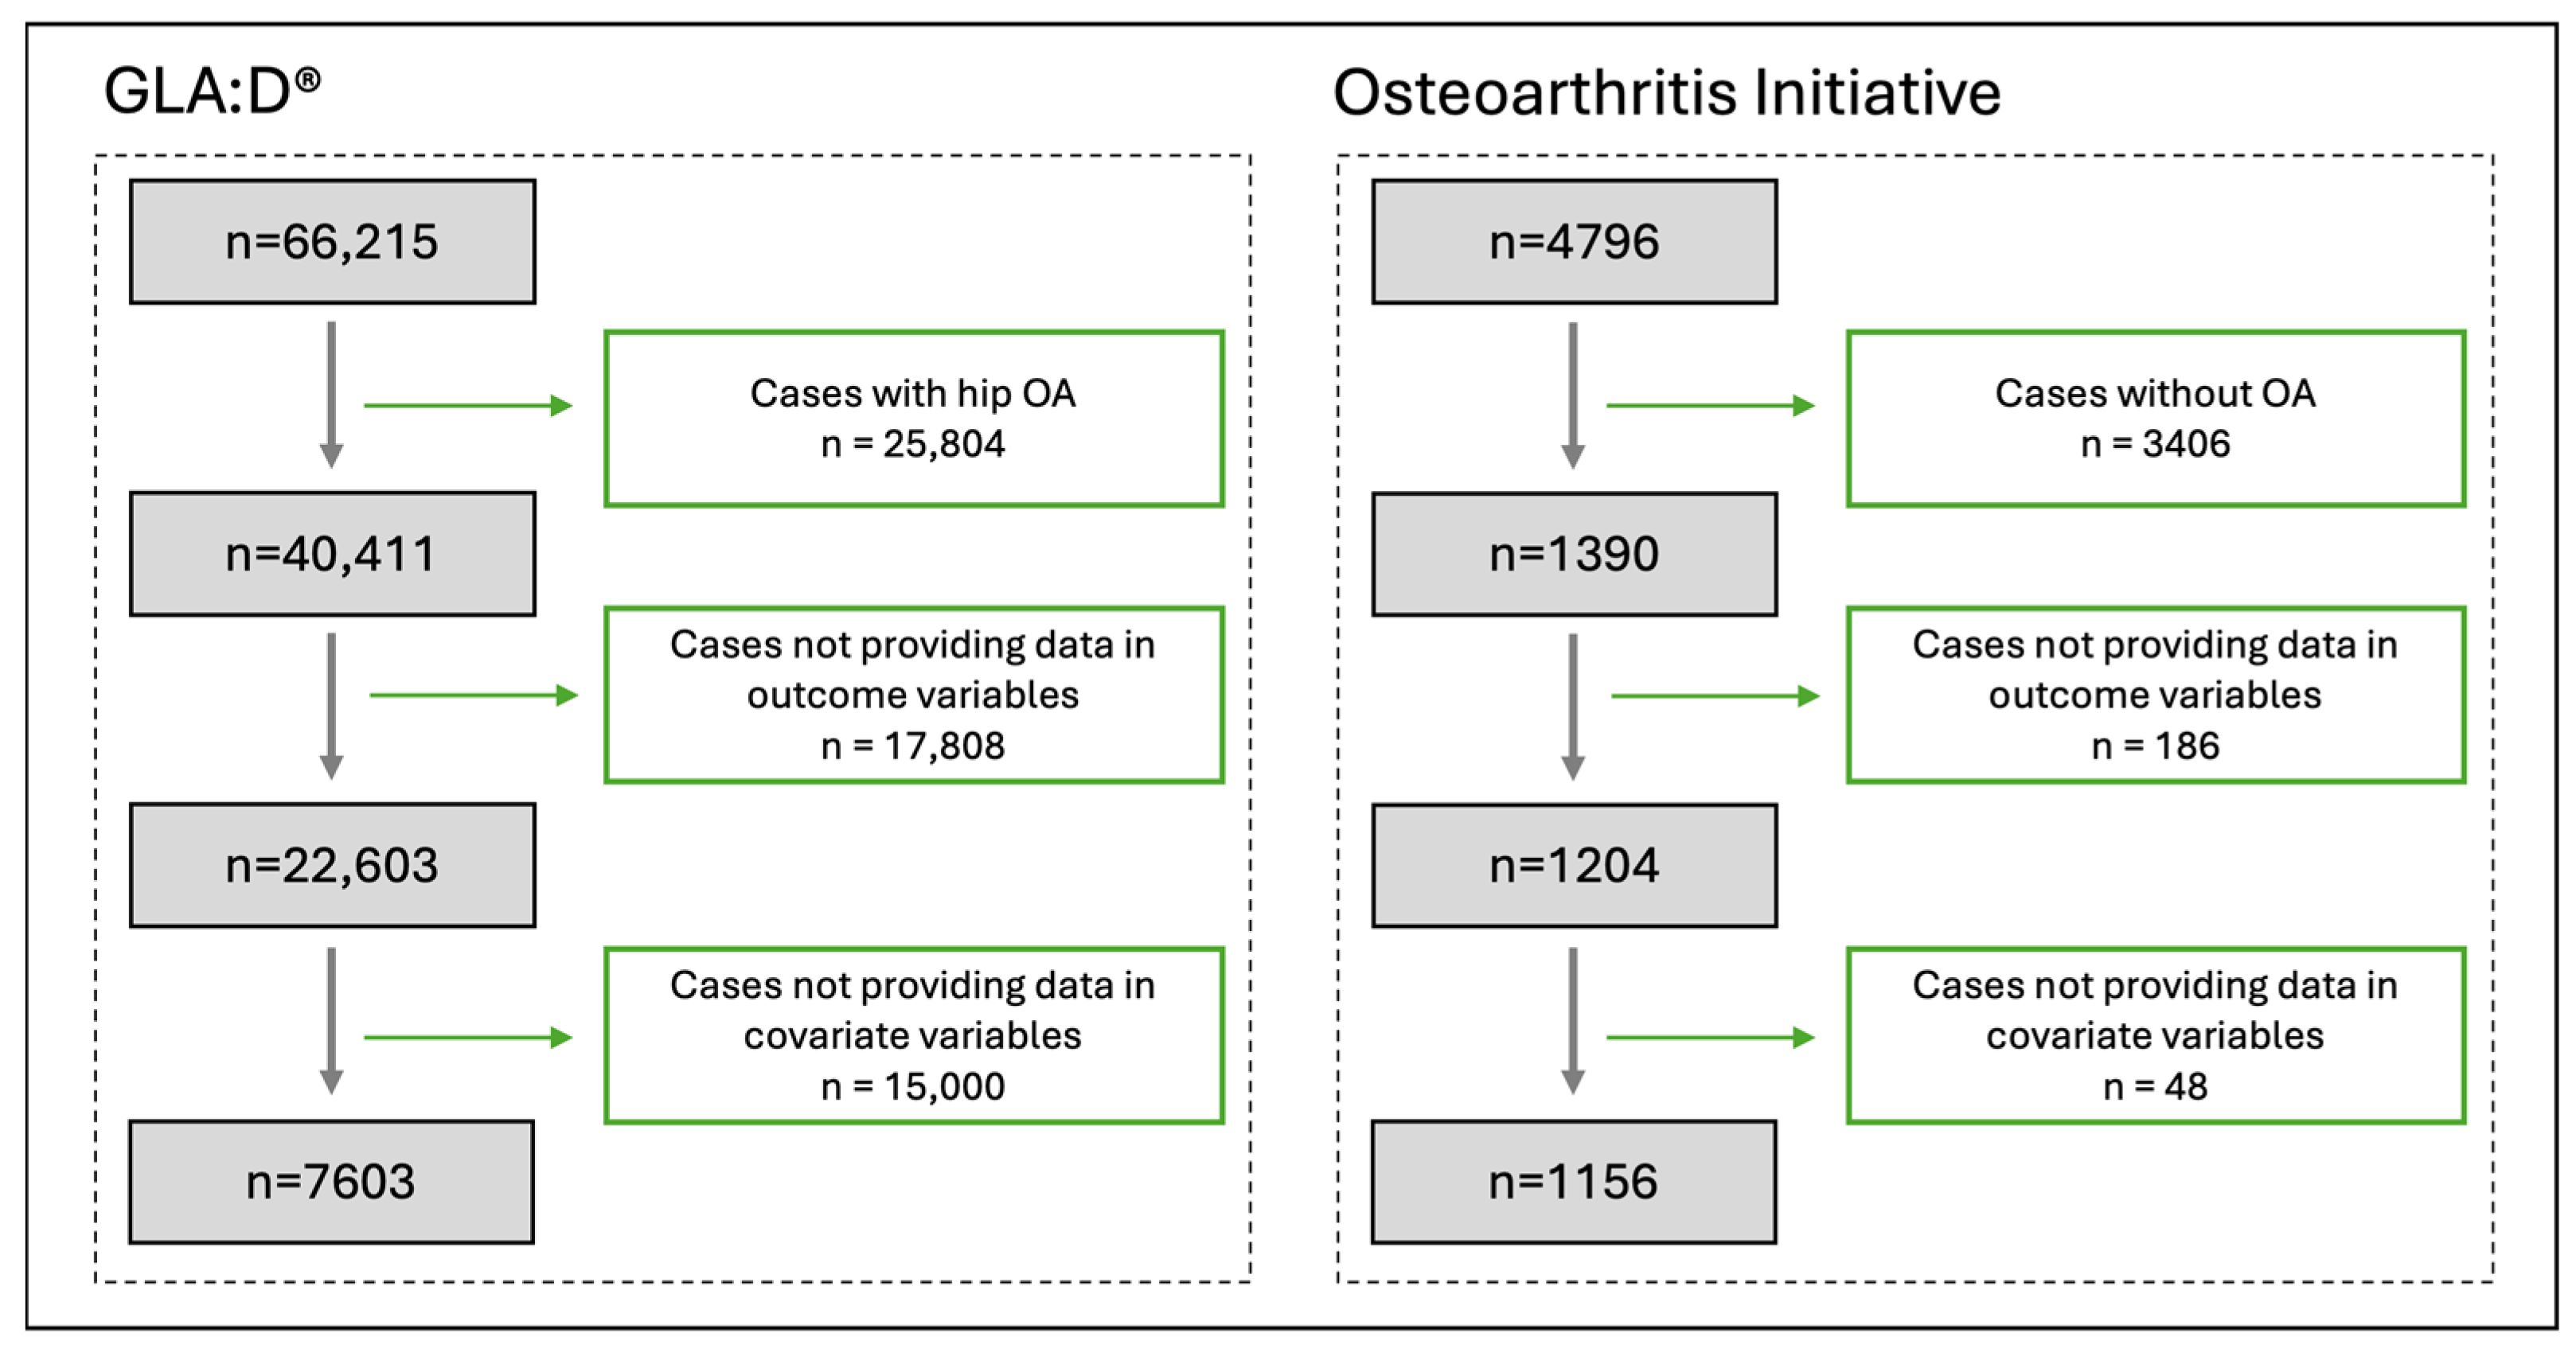
2.1. Source of Data and Participants
2.2. Outcome
2.3. Covariables
2.4. Matching of Participants
- Computing covariable means: The process begins by calculating the covariable means in the treatment group.
- Optimizing control group weights: Next, the weights of the control group are optimized to minimize the differences between the weighted means of the control group’s covariable and the treatment group’s covariable means.
- Creating a balanced dataset: Finally, control samples are replicated according to these optimized weights to create a balanced dataset that closely resembles the treatment group.
2.5. Statistical Analysis Methods
2.6. Supplementary Analyses
3. Result
3.1. Participants
3.2. Patient Characteristics
3.3. Changes in PA, Pain Intensity, and QOL
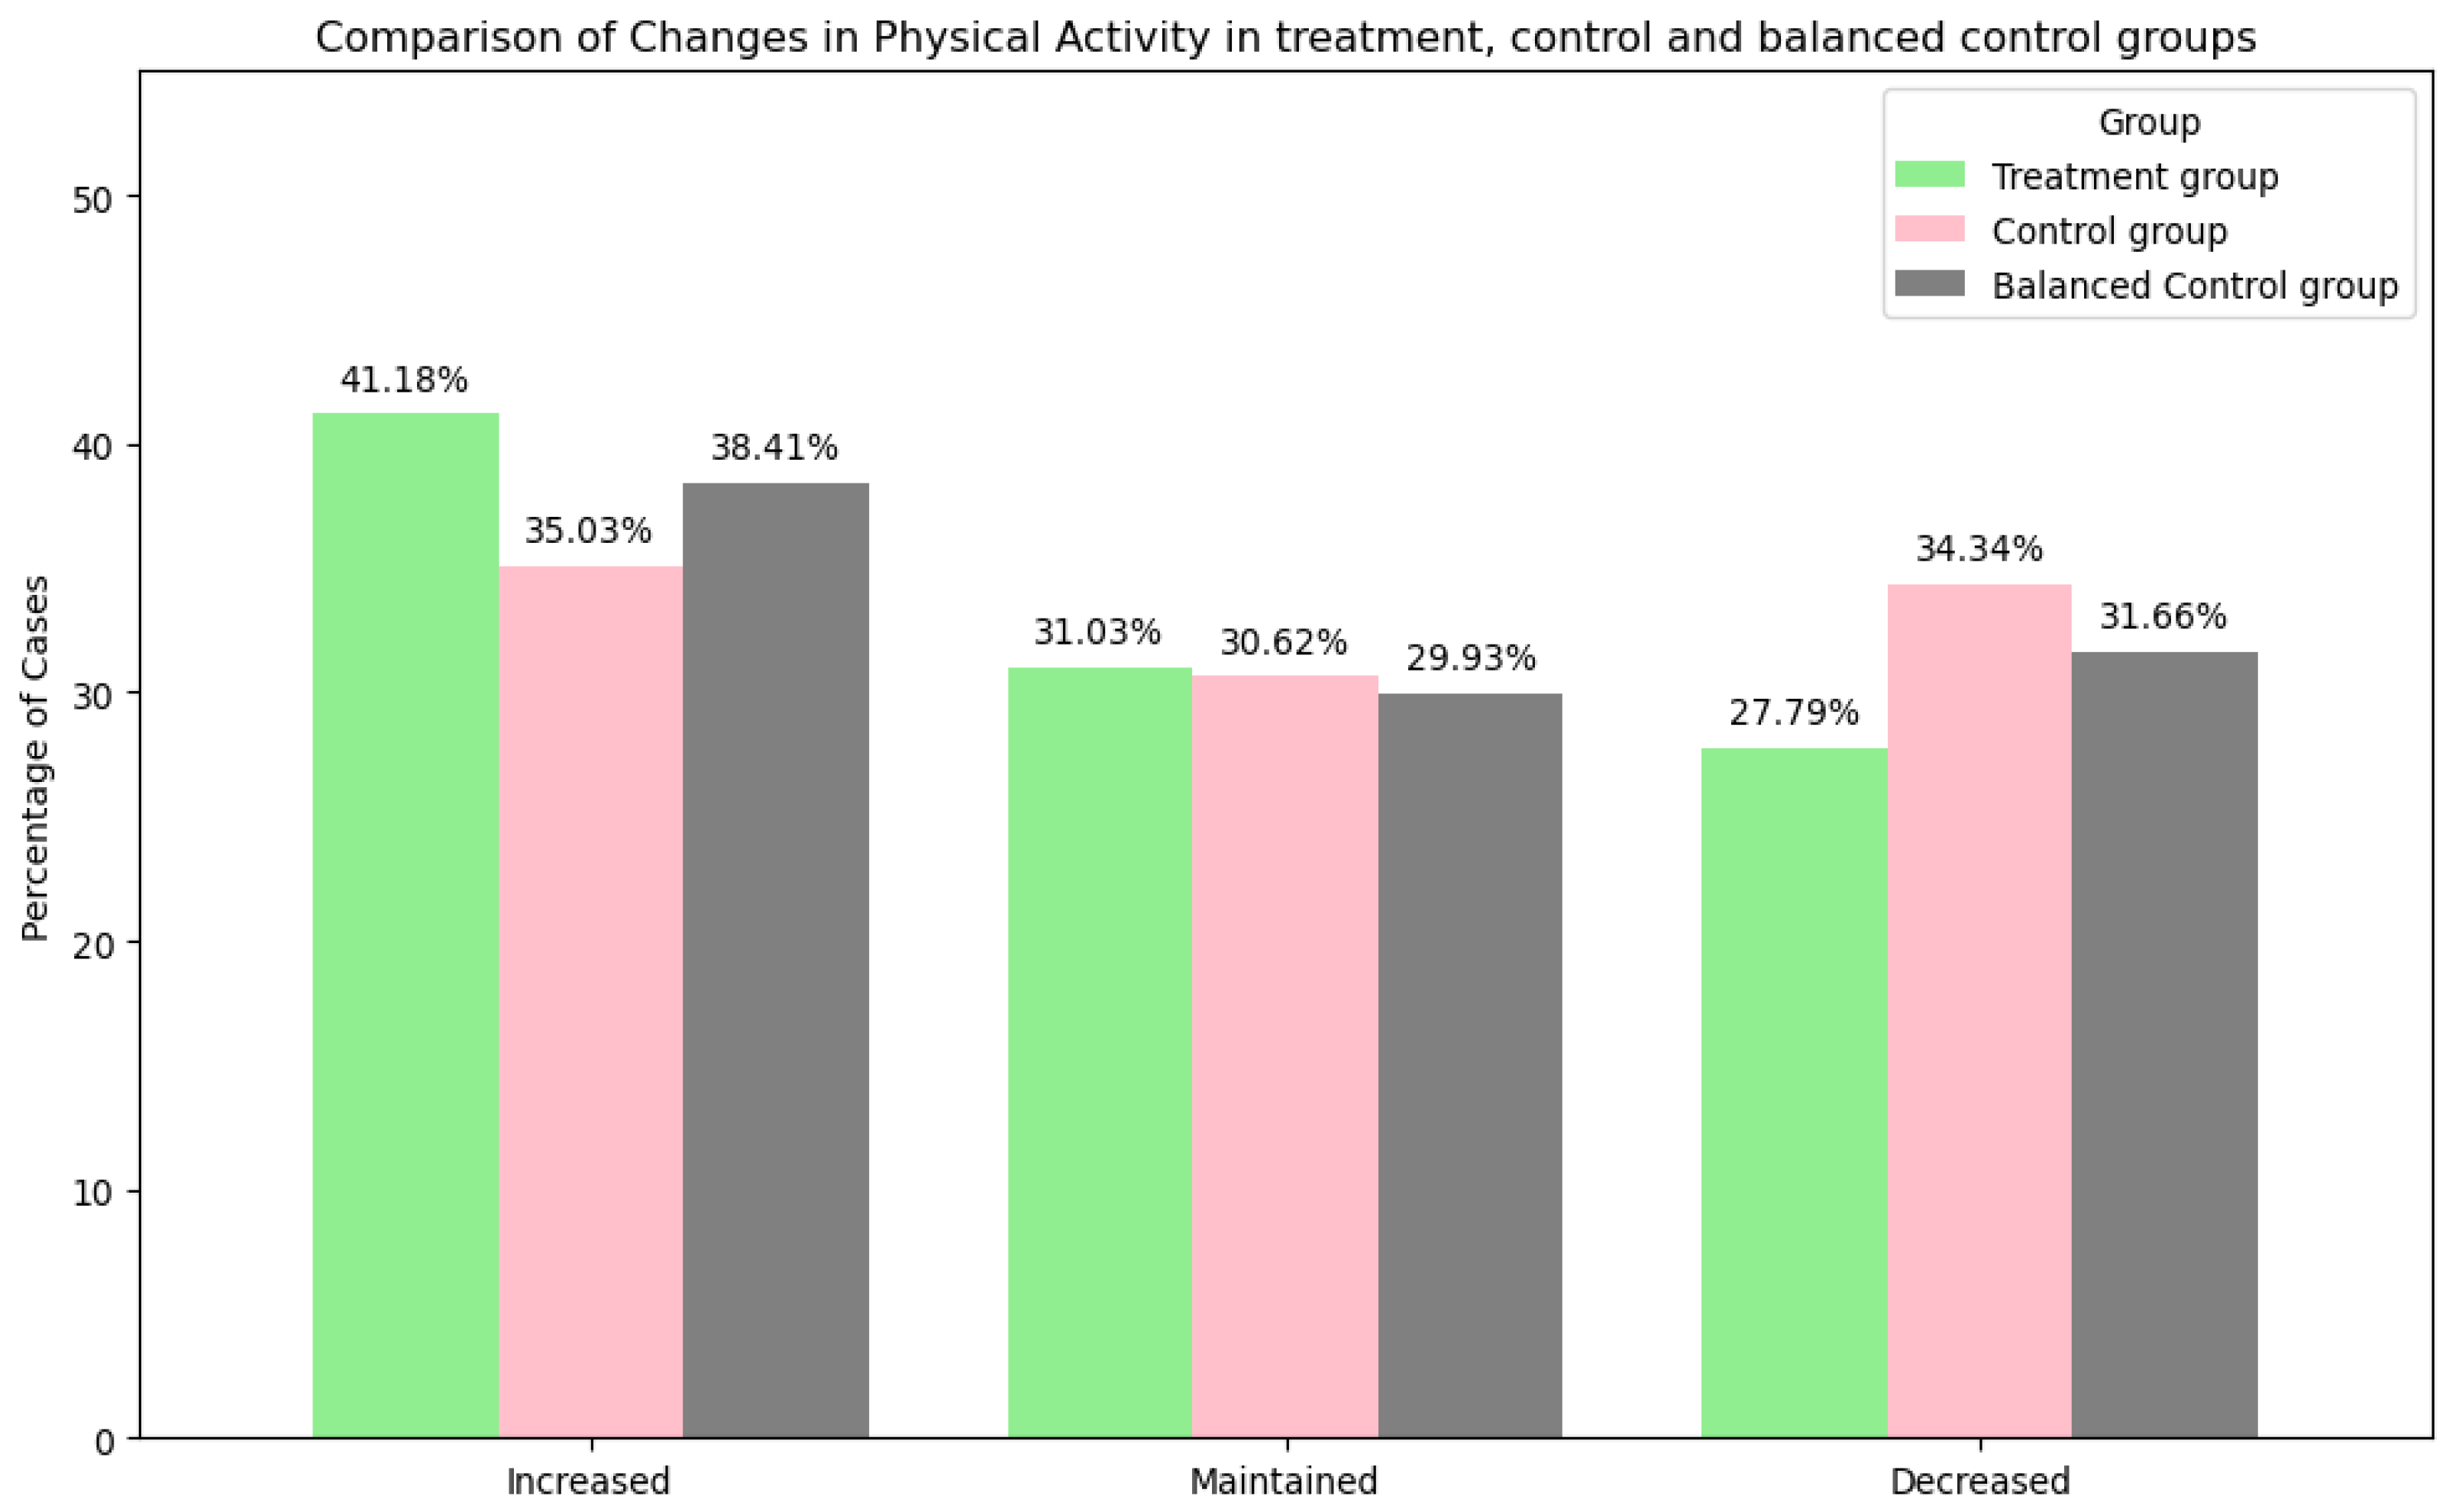
- Physical Activity
- 2.
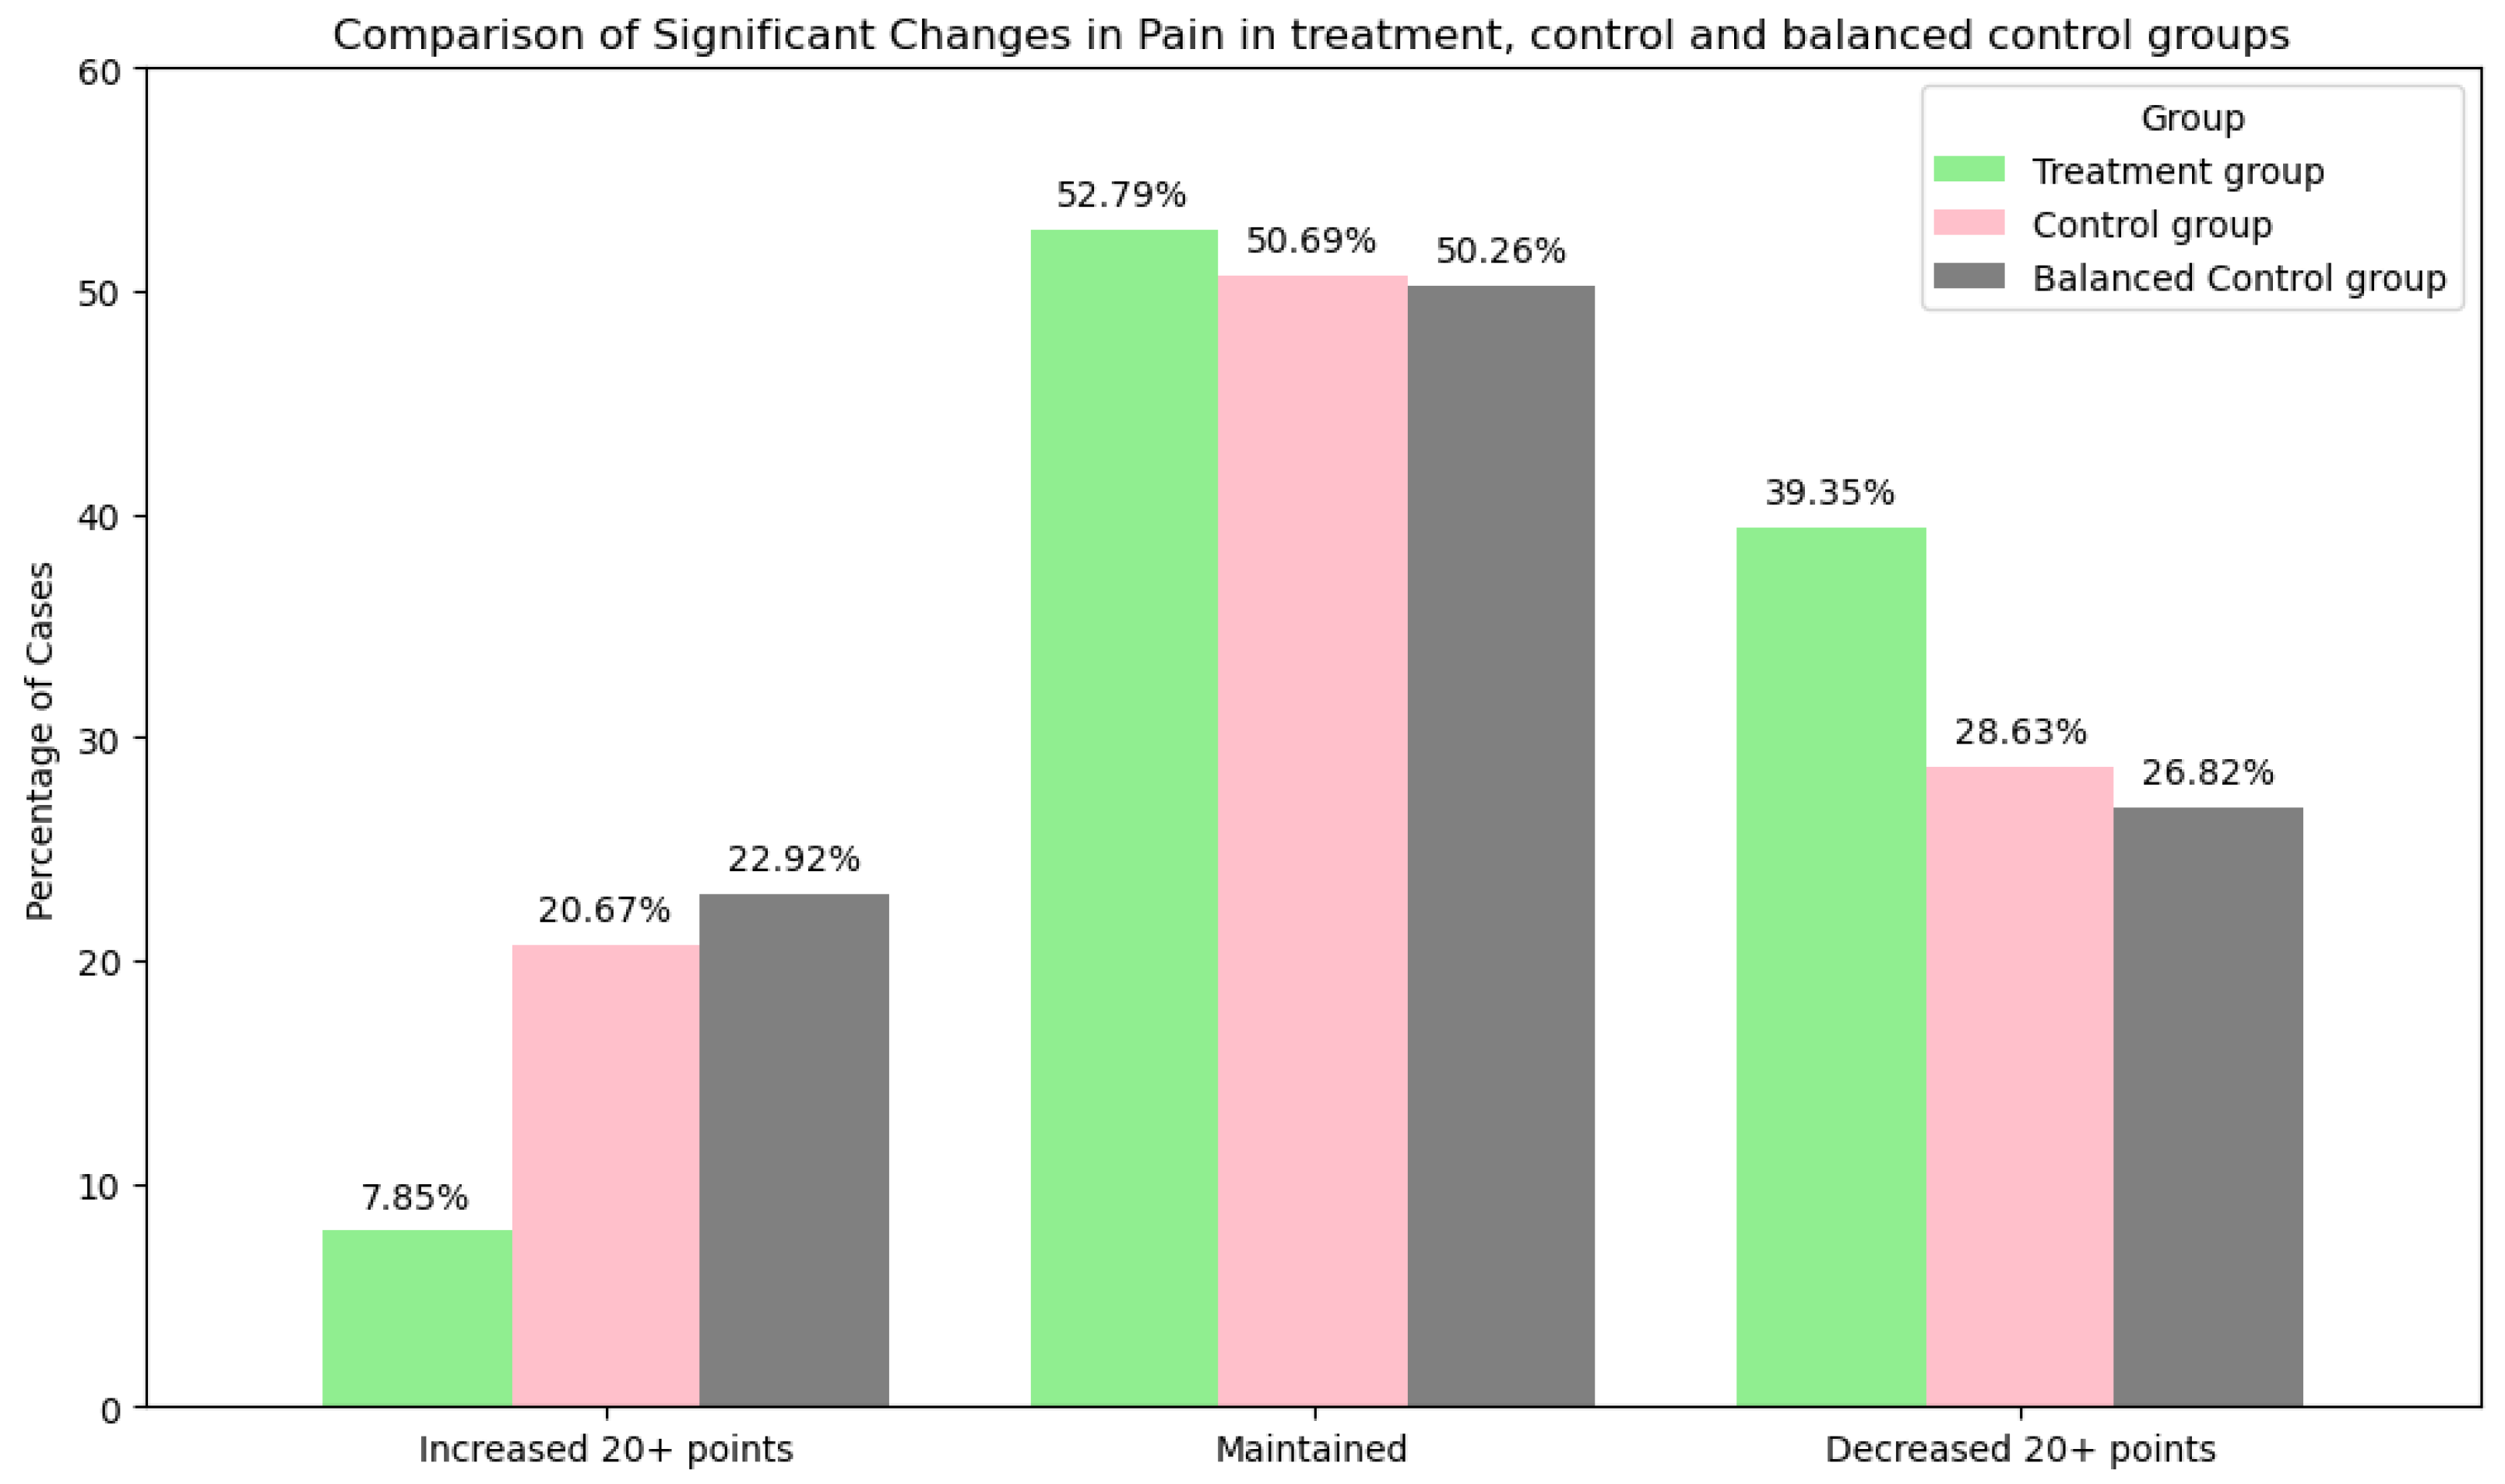
- Pain Intensity
- 3.
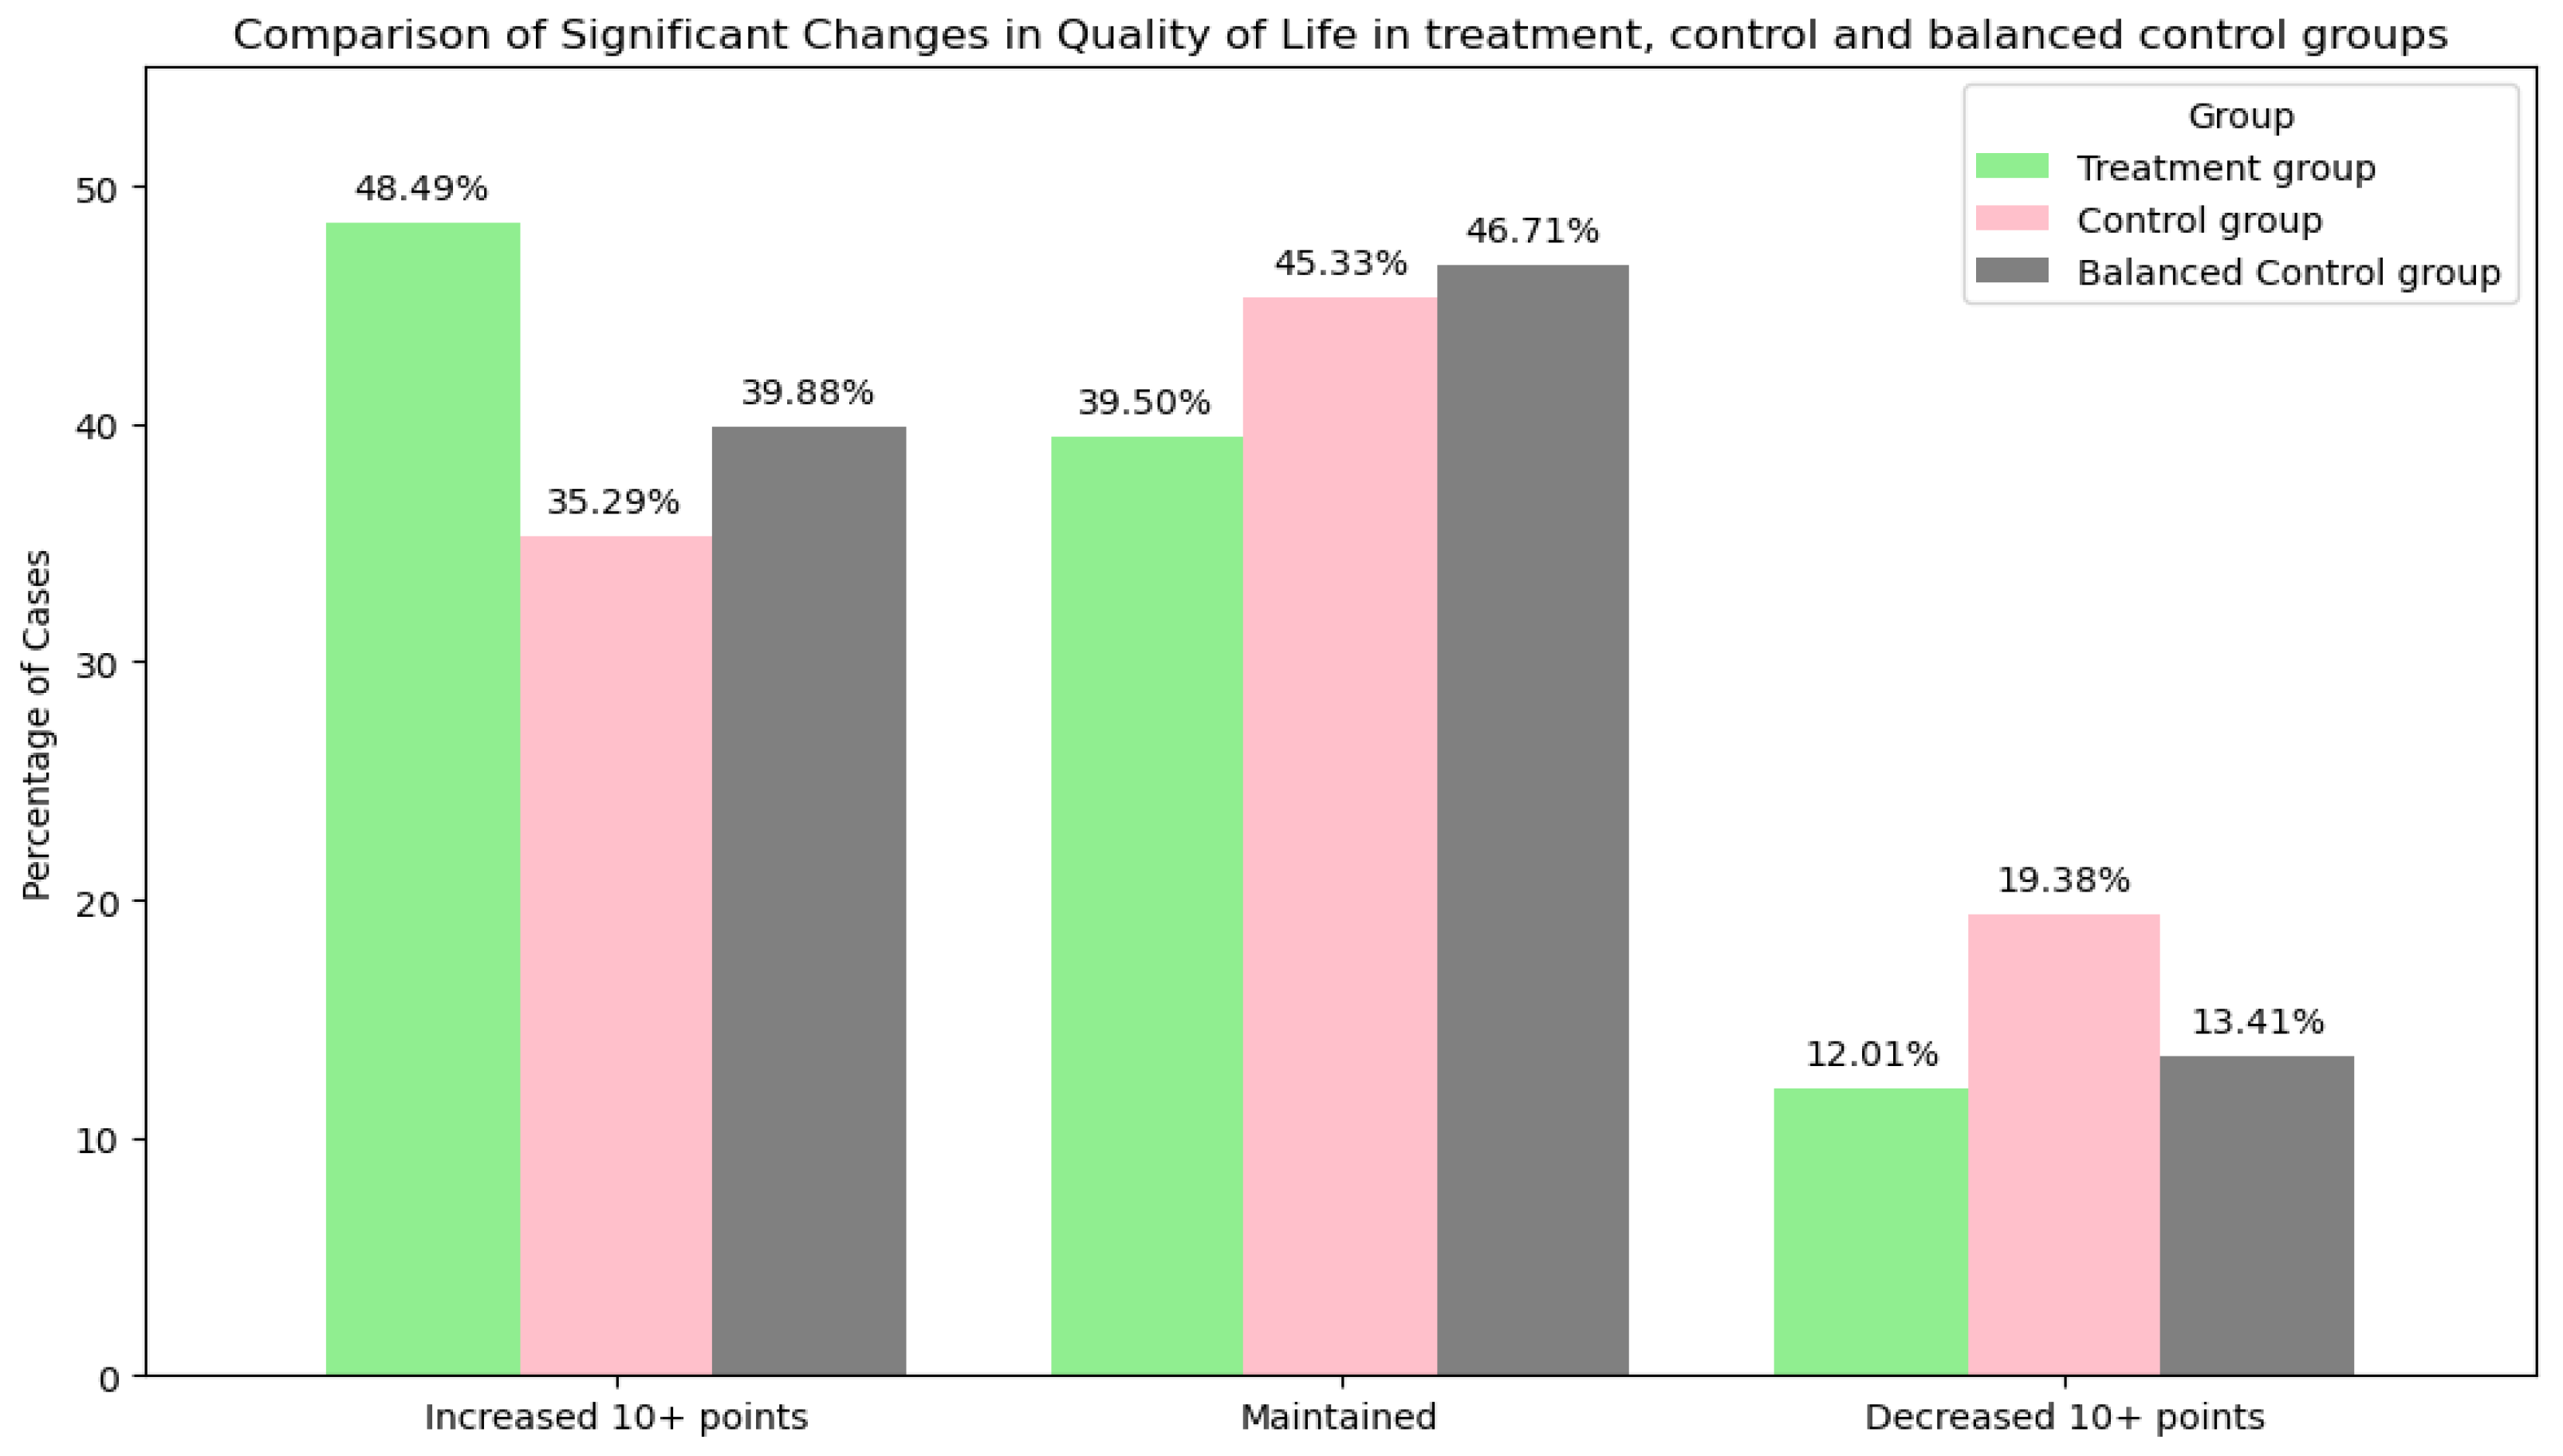
- Quality of Life
3.4. Supplementary Analyses
4. Discussion
4.1. Summary
4.2. Methodological Considerations
4.3. Interpretation of Results
4.4. Limitations
5. Conclusions
Supplementary Materials
Author Contributions
Funding
Institutional Review Board Statement
Informed Consent Statement
Data Availability Statement
Acknowledgments
Conflicts of Interest
Abbreviations
| PA | Physical activity |
| QOL | Quality of life |
| OA | Osteoarthritis |
| GLA:D® | Good Life with osteoArthritis in Denmark |
| OAI | Osteoarthritis Initiative |
| RCTs | Randomized controlled trials |
References
- Physical Activity: World Health Organization. Available online: https://www.who.int/news-room/fact-sheets/detail/physical-activity (accessed on 14 April 2025).
- Anderson, E.; Durstine, J.L. Physical activity, exercise, and chronic diseases: A brief review. Sports Med. Health Sci. 2019, 1, 3–10. [Google Scholar] [CrossRef]
- Wojcieszek, A.; Kurowska, A.; Majda, A.; Liszka, H.; Gądek, A. The Impact of Chronic Pain, Stiffness and Difficulties in Performing Daily Activities on the Quality of Life of Older Patients with Knee Osteoarthritis. Int. J. Environ. Res. Public Health 2022, 19, 16815. [Google Scholar] [CrossRef] [PubMed]
- WHOQOL—Measuring Quality of Life|The World Health Organization. Available online: https://www.who.int/tools/whoqol (accessed on 16 April 2025).
- Global Recommendations on Physical Activity for Health WHO, Geneva, 2010. Available online: https://www.researchgate.net/publication/277925592_Global_Recommendations_on_Physical_Activity_for_Health_WHO_Geneva_2010 (accessed on 17 July 2024).
- Troiano, R.P.; Berrigan, D.; Dodd, K.W.; Mâsse, L.C.; Tilert, T.; Mcdowell, M. Physical Activity in the United States Measured by Accelerometer. Med. Sci. Sports Exerc. 2008, 40, 181–188. [Google Scholar] [CrossRef] [PubMed]
- Kohl, H.W.; Craig, C.L.; Lambert, E.V.; Inoue, S.; Alkandari, J.R.; Leetongin, G.; Kahlmeier, S.; for the Lancet Physical Activity Series Working Group. The pandemic of physical inactivity: Global action for public health. Lancet 2012, 380, 294–305. [Google Scholar] [CrossRef] [PubMed]
- Bauman, A.E.; Reis, R.S.; Sallis, J.F.; Wells, J.C.; Loos, R.J.F.; Martin, B.W.; Lancet Physical Activity Series Working Group. Correlates of physical activity: Why are some people physically active and others not? Lancet 2012, 380, 258–271. [Google Scholar] [CrossRef]
- Behera, N.S.; Duong, V.; Eyles, J.; Cui, H.; Gould, D.; Barton, C.; Belton, J.; Hunter, D.; Bunzli, S. How Does Osteoarthritis Education Influence Knowledge, Beliefs, and Behavior in People With Knee and Hip Osteoarthritis? A Systematic Review. Arthritis Care Res. 2024, 76, 1511–1531. [Google Scholar] [CrossRef]
- Da Silva, J.M.R.; De Rezende, M.U.; Spada, T.C.; Francisco, L.D.S.; De Farias, F.E.S.; Da Silva, C.A.C.; Cernigoy, C.H.D.A.; Greve, J.M.D.; Ciolac, E.G. Educational program promoting regular physical exercise improves functional capacity and daily living physical activity in subjects with knee osteoarthritis. BMC Musculoskelet. Disord. 2017, 18, 546. [Google Scholar] [CrossRef]
- Skou, S.T.; Roos, E.M. Good Life with osteoArthritis in Denmark (GLA:D™): Evidence-based education and supervised neuromuscular exercise delivered by certified physiotherapists nationwide. BMC Musculoskelet. Disord. 2017, 18, 72. [Google Scholar] [CrossRef]
- Bannuru, R.R.; Osani, M.C.; Vaysbrot, E.E.; Arden, N.K.; Bennell, K.; Bierma-Zeinstra, S.M.A.; Kraus, V.B.; Lohmander, L.S.; Abbott, J.H.; Bhandari, M.; et al. OARSI guidelines for the non-surgical management of knee, hip, and polyarticular osteoarthritis. Osteoarthr. Cartil. 2019, 27, 1578–1589. [Google Scholar] [CrossRef]
- Thorstensson, C.A.; Garellick, G.; Rystedt, H.; Dahlberg, L.E. Better Management of Patients with Osteoarthritis: Development and Nationwide Implementation of an Evidence-Based Supported Osteoarthritis Self-Management Programme. Musculoskelet. Care 2015, 13, 67–75. [Google Scholar] [CrossRef]
- Hariton, E.; Locascio, J.J. Randomised controlled trials—The gold standard for effectiveness research: Study design: Randomised controlled trials. BJOG Int. J. Obstet. Gynaecol. 2018, 125, 1716. [Google Scholar] [CrossRef] [PubMed]
- Smith, J.L.; Innes, A.Q.; Burns, D.S.; Deniszczyc, D.; Selfe, J.; MacConville, S.; Deighton, K.; Kelly, B.M. A scalable 12-week exercise and education programme reduces symptoms and improves function and wellbeing in people with hip and knee osteoarthritis. Front. Rehabil. Sci. 2023, 4, 1147938. [Google Scholar] [CrossRef]
- Skou, S.T.; Roos, E.M.; Laursen, M.B.; Rathleff, M.S.; Arendt-Nielsen, L.; Simonsen, O.; Rasmussen, S. A Randomized, Controlled Trial of Total Knee Replacement. N. Engl. J. Med. 2015, 373, 1597–1606. [Google Scholar] [CrossRef] [PubMed]
- y Dorte Thalund Grønne, Ewa Roos, Søren Thorgaard Skou, Alice Kongsted and Jan Hartvigsen, “GLA:D® Denmark Annual Report 2022. Available online: https://glaid.dk/pdf/GLAD_Annual_Report_2022_f.pdf (accessed on 1 March 2025).
- Nevitt, M.C.; Felson, D.T.; Lester, G. The Osteoarthritis Initiative. Available online: http://nda.nih.gov.s3.amazonaws.com/cms/prod/StudyDesignProtocolAndAppendices.pdf (accessed on 1 March 2025).
- Ageberg, E.; Link, A.; Roos, E.M. Feasibility of neuromuscular training in patients with severe hip or knee OA: The individualized goal-based NEMEX-TJR training program. BMC Musculoskelet. Disord. 2010, 11, 126. [Google Scholar] [CrossRef]
- Sakellariou, G.; Conaghan, P.G.; Zhang, W.; Bijlsma, J.W.J.; Boyesen, P.; D’Agostino, M.A.; Doherty, M.; Fodor, D.; Kloppenburg, M.; Miese, F.; et al. EULAR recommendations for the use of imaging in the clinical management of peripheral joint osteoarthritis. Ann. Rheum. Dis. 2017, 76, 1484–1494. [Google Scholar] [CrossRef]
- Alghadir, A.H.; Anwer, S.; Iqbal, A.; Iqbal, Z.A. Test–retest reliability, validity, and minimum detectable change of visual analog, numerical rating, and verbal rating scales for measurement of osteoarthritic knee pain. J. Pain Res. 2018, 11, 851–856. [Google Scholar] [CrossRef]
- Visual Analogue Scale, Physiopedia. Available online: https://www.physio-pedia.com/Visual_Analogue_Scale (accessed on 14 April 2025).
- Numeric Pain Rating Scale. Physiopedia. Available online: https://www.physio-pedia.com/Numeric_Pain_Rating_Scale (accessed on 14 April 2025).
- Roos, E.M.; Toksvig-Larsen, S. Knee injury and Osteoarthritis Outcome Score (KOOS)—Validation and comparison to the WOMAC in total knee replacement. Health Qual. Life Outcomes 2003, 1, 17. [Google Scholar] [CrossRef]
- Felson, D.; Rabasa, G.; Jafarzadeh, S.; Nevitt, M.; Lewis, C.; Segal, N.; White, D. Factors associated with pain resolution in those with knee pain: The MOST study. Osteoarthr. Cartil. 2021, 29, 1666–1672. [Google Scholar] [CrossRef]
- Seefeldt, V.; Malina, R.M.; Clark, M.A. Factors affecting levels of physical activity in adults. Sports Med. 2002, 32, 143–168. [Google Scholar] [CrossRef]
- Alghadir, A.H.; Khan, M.M. Factors affecting pain and physical functions in patients with knee osteoarthritis: An observational study. Medicine 2022, 101, e31748. [Google Scholar] [CrossRef]
- Hainmueller, J. Entropy Balancing for Causal Effects: A Multivariate Reweighting Method to Produce Balanced Samples in Observational Studies. Polit. Anal. 2012, 20, 25–46. [Google Scholar] [CrossRef]
- Dams, J.; Buchholz, A.; Kraus, L.; Reimer, J.; Scherbaum, N.; Konnopka, A.; König, H.-H. Excess costs of alcohol-dependent patients in German psychiatric care compared with matched non-alcohol-dependent individuals from the general population: A secondary analysis of two datasets. BMJ Open 2018, 8, e020563. [Google Scholar] [CrossRef] [PubMed]
- Austin, P.C. An Introduction to Propensity Score Methods for Reducing the Effects of Confounding in Observational Studies. Multivar. Behav. Res. 2011, 46, 399–424. [Google Scholar] [CrossRef] [PubMed]
- Katz, N.P.; Paillard, F.C.; Ekman, E. Determining the clinical importance of treatment benefits for interventions for painful orthopedic conditions. J. Orthop. Surg. Res. 2015, 10, 24. [Google Scholar] [CrossRef]
- Baumbach, L.; Grønne, D.; Møller, N.; Skou, S.; Roos, E. Changes in physical activity and the association between pain and physical activity—A longitudinal analysis of 17,454 patients with knee or hip osteoarthritis from the GLA:D® registry. Osteoarthr. Cartil. 2023, 31, 258–266. [Google Scholar] [CrossRef]
- Lin, W.; Alizai, H.; Joseph, G.; Srikhum, W.; Nevitt, M.; Lynch, J.; McCulloch, C.; Link, T. Physical activity in relation to knee cartilage T2 progression measured with 3 T MRI over a period of 4 years: Data from the Osteoarthritis Initiative. Osteoarthr. Cartil. 2013, 21, 1558–1566. [Google Scholar] [CrossRef]
- Young, J.J.; Zywiel, M.G.; Skou, S.T.; Chandran, V.; Davey, J.R.; Gandhi, R.; Mahomed, N.N.; Syed, K.; Veillette, C.J.H.; Rampersaud, Y.R.; et al. Total Knee Arthroplasty Versus Education and Exercise for Knee Osteoarthritis: A Propensity-Matched Analysis. Arthritis Care Res. 2024, 76, 682–690. [Google Scholar] [CrossRef]
- Fu, E.L. Target Trial Emulation to Improve Causal Inference from Observational Data: What, Why, and How? J. Am. Soc. Nephrol. 2023, 34, 1305–1314. [Google Scholar] [CrossRef]
- Carrasco, C.; Mendes, F.; Bravo, J.; Pereira, C.; Tomas-Carus, P. Factors influencing physical activity: A cross-sectional study of the community-dwelling older adults in a Portuguese rural area. Int. J. Older People Nurs. JASN 2021, 16, e12371. [Google Scholar] [CrossRef]
- Södergren, M.; Sundquist, J.; Johansson, S.-E.; Sundquist, K. Physical activity, exercise and self-rated health: A population-based study from Sweden. BMC Public Health 2008, 8, 352. [Google Scholar] [CrossRef]
- Abu Saad, H.; Low, P.K.; Jamaluddin, R.; Chee, H.P. Level of Physical Activity and Its Associated Factors among Primary Healthcare Workers in Perak, Malaysia. Int. J. Environ. Res. Public Health 2020, 17, 5947. [Google Scholar] [CrossRef]
- Englund, M.; Turkiewicz, A. Regression to the mean for physical function and quality of life in clinical trials for symptomatic knee osteoarthritis. Osteoarthr. Cartil. 2024, 33, 391–395. [Google Scholar] [CrossRef]
- Collins, J.E.; Neogi, T.; Losina, E. Trajectories of Structural Disease Progression in Knee Osteoarthritis. Arthritis Care Res. 2021, 73, 1354–1362. [Google Scholar] [CrossRef]
- Koes, B.W.; Chiarotto, A.; Thorlund, J.B.; Grønne, D.T.; Roos, E.M.; Skou, S.T. Does Pain Medication Use Influence the Outcome of 8 Weeks of Education and Exercise Therapy in Patients with Knee or Hip Osteoarthritis? An Observational Study. Pain Med. 2022, 23, 1457–1463. [Google Scholar] [CrossRef]
- Henriksen, M.; Nielsen, S.; Christensen, R.; Kristensen, L.; Bliddal, H.; Bartholdy, C.; Boesen, M.; Ellegaard, K.; Hunter, D.; Altman, R.; et al. Who are likely to benefit from the Good Life with osteoArthritis in Denmark (GLAD) exercise and education program? An effect modifier analysis of a randomised controlled trial. Osteoarthr. Cartil. 2022, 31, 106–114. [Google Scholar] [CrossRef]
- Thorlund, J.B.; Roos, E.M.; Goro, P.; Ljungcrantz, E.G.; Grønne, D.T.; Skou, S.T. Patients use fewer analgesics following supervised exercise therapy and patient education: An observational study of 16 499 patients with knee or hip osteoarthritis. Br. J. Sports Med. 2020, 55, 670–675. [Google Scholar] [CrossRef]
- Lim, W.B.; Al-Dadah, O. Conservative treatment of knee osteoarthritis: A review of the literature. World J. Orthop. 2022, 13, 212–229. [Google Scholar] [CrossRef]
- Yu, S.P.; Hunter, D.J. Managing osetoarthritis. Aust. Prescr. 2015, 38, 115–119. [Google Scholar] [CrossRef]
- Alfatafta, H.; Alfatafta, M.; Onchonga, D.; Hammoud, S.; Khatatbeh, H.; Zhang, L.; Boncz, I.; Lohner, S.; Molics, B. Effect of the knee replacement surgery on activity level based on ActivPAL: A systematic review and meta-analysis study. BMC Musculoskelet. Disord. 2022, 23, 576. [Google Scholar] [CrossRef]
- Coenen, P.; Straat, C.; Kuijer, P.P. Knee arthroplasty: A window of opportunity to improve physical activity in daily life, sports and work. BMJ Open Sport Exerc. Med. 2020, 6, e000822. [Google Scholar] [CrossRef]
- Hanreich, C.; Martelanz, L.; Koller, U.; Windhager, R.; Waldstein, W. Sport and Physical Activity Following Primary Total Knee Arthroplasty: A Systematic Review and Meta-Analysis. J. Arthroplast. 2020, 35, 2274–2285.e1. [Google Scholar] [CrossRef]
- Khan, M.; Osman, K.; Green, G.; Haddad, F.S. The epidemiology of failure in total knee arthroplasty: Avoiding your next revision. Bone Jt. J. 2016, 98-B, 105–112. [Google Scholar] [CrossRef]
- Pitta, M.; Esposito, C.I.; Li, Z.; Lee, Y.-Y.; Wright, T.M.; Padgett, D.E. Failure After Modern Total Knee Arthroplasty: A Prospective Study of 18,065 Knees. J. Arthroplast. 2018, 33, 407–414. [Google Scholar] [CrossRef]
- Mathis, D.T.; Lohrer, L.; Amsler, F.; Hirschmann, M.T. Reasons for failure in primary total knee arthroplasty—An analysis of prospectively collected registry data. J. Orthop. 2021, 23, 60–66. [Google Scholar] [CrossRef]
- Postler, A.; Lützner, C.; Beyer, F.; Tille, E.; Lützner, J. Analysis of Total Knee Arthroplasty revision causes. BMC Musculoskelet. Disord. 2018, 19, 55. [Google Scholar] [CrossRef]
- Jabbal, M.; Simpson, A.H.R.; Walmsley, P. Mechanisms of bone loss in revision total knee arthroplasty and current treatment options. Orthop. Rev. 2023, 15, 75359. [Google Scholar] [CrossRef]
- Beswick, A.D.; Wylde, V.; Gooberman-Hill, R.; Blom, A.; Dieppe, P. What proportion of patients report long-term pain after total hip or knee replacement for osteoarthritis? A systematic review of prospective studies in unselected patients. BMJ Open 2012, 2, e000435. [Google Scholar] [CrossRef]
- Grønne, D.T.; Sari, D.M.; Skou, S.T.; Roos, E.M.; Demirbüken, I.; Thorlund, J.B. Impact of prior knee surgery on change in knee pain, quality of life, and walking speed following supervised education and exercise therapy: An analysis of 30,545 people with knee osteoarthritis. Clin. Rheumatol. 2024, 43, 3925–3934. [Google Scholar] [CrossRef]
- Rusticus, S.A.; Lovato, C.Y. Impact of Sample Size and Variability on the Power and Type I Error Rates of Equivalence Tests: A Simulation Study. Pract. Assess. Res. Eval. 2014, 19, 11. [Google Scholar] [CrossRef]
- Rafiei, M.; Das, S.; Bakhtiari, M.; Roos, E.M.; Skou, S.T.; Grønne, D.T.; Baumbach, J.; Baumbach, L. Personalized Predictions for Changes in Knee Pain Among Patients With Osteoarthritis Participating in Supervised Exercise and Education: Prognostic Model Study. JMIR Rehabilitation Assist. Technol. 2025, 12, e60162. [Google Scholar] [CrossRef]
- GLA:D® International Network,” Glad International. Available online: https://gladinternational.org/ (accessed on 16 April 2025).
- Structured Education and Neuromuscular Exercise Program for Hip and/or Knee Osteoarthritis: A Health Technology Assessment. Ont. Health Technol. Assess. Ser. 2018, 18, 1–110.
- GLA:D Physiotherapy Program for Osteoarthritis Relief–Proven Approach - Exercise Classes, Physiotherapist Supervised. Thrive Physio Plus. Available online: https://www.thrivephysioplus.com.au/services/glad-physiotherapy/ (accessed on 16 April 2025).

| GLA:D® | OAI | |||
|---|---|---|---|---|
| Variable | Original Variable | Translation | Original Variable | Translation |
| Age | The current age in years | No change | The current age in years | No change |
| Gender | 1: Male 2: Female | No change | 1: Male 2: Female | No change |
| BMI | No change | No change | ||
| Depression | 1: I am not anxious or depressed 2: I am slightly anxious or depressed 3: I am moderately anxious or depressed 4: I am severely anxious or depressed 5: I am extremely anxious or depressed | No change | 1: Rarely/none of the time (< 1 day) 2: Some of the time (1–2 days) 3: Much of the time (3–4 days) 4: Most or all of the time (5–7 days) | No change |
| Employment status | 1. Employed/student 2. On sick leave full-time 3. On sick leave part-time 4. Retired 5. Unemployed 6. Self-imposed early retirement 7. Early retirement due to low ability to work | 1: Works for pay 2: Not working in part due to health 3: Not working other reasons | 1: Works for pay 2: Unpaid work for family business 3: Not working in part due to health 4: Not working other reasons | 1: Employed/student 2: On sick leave full-time 3: Unemployed |
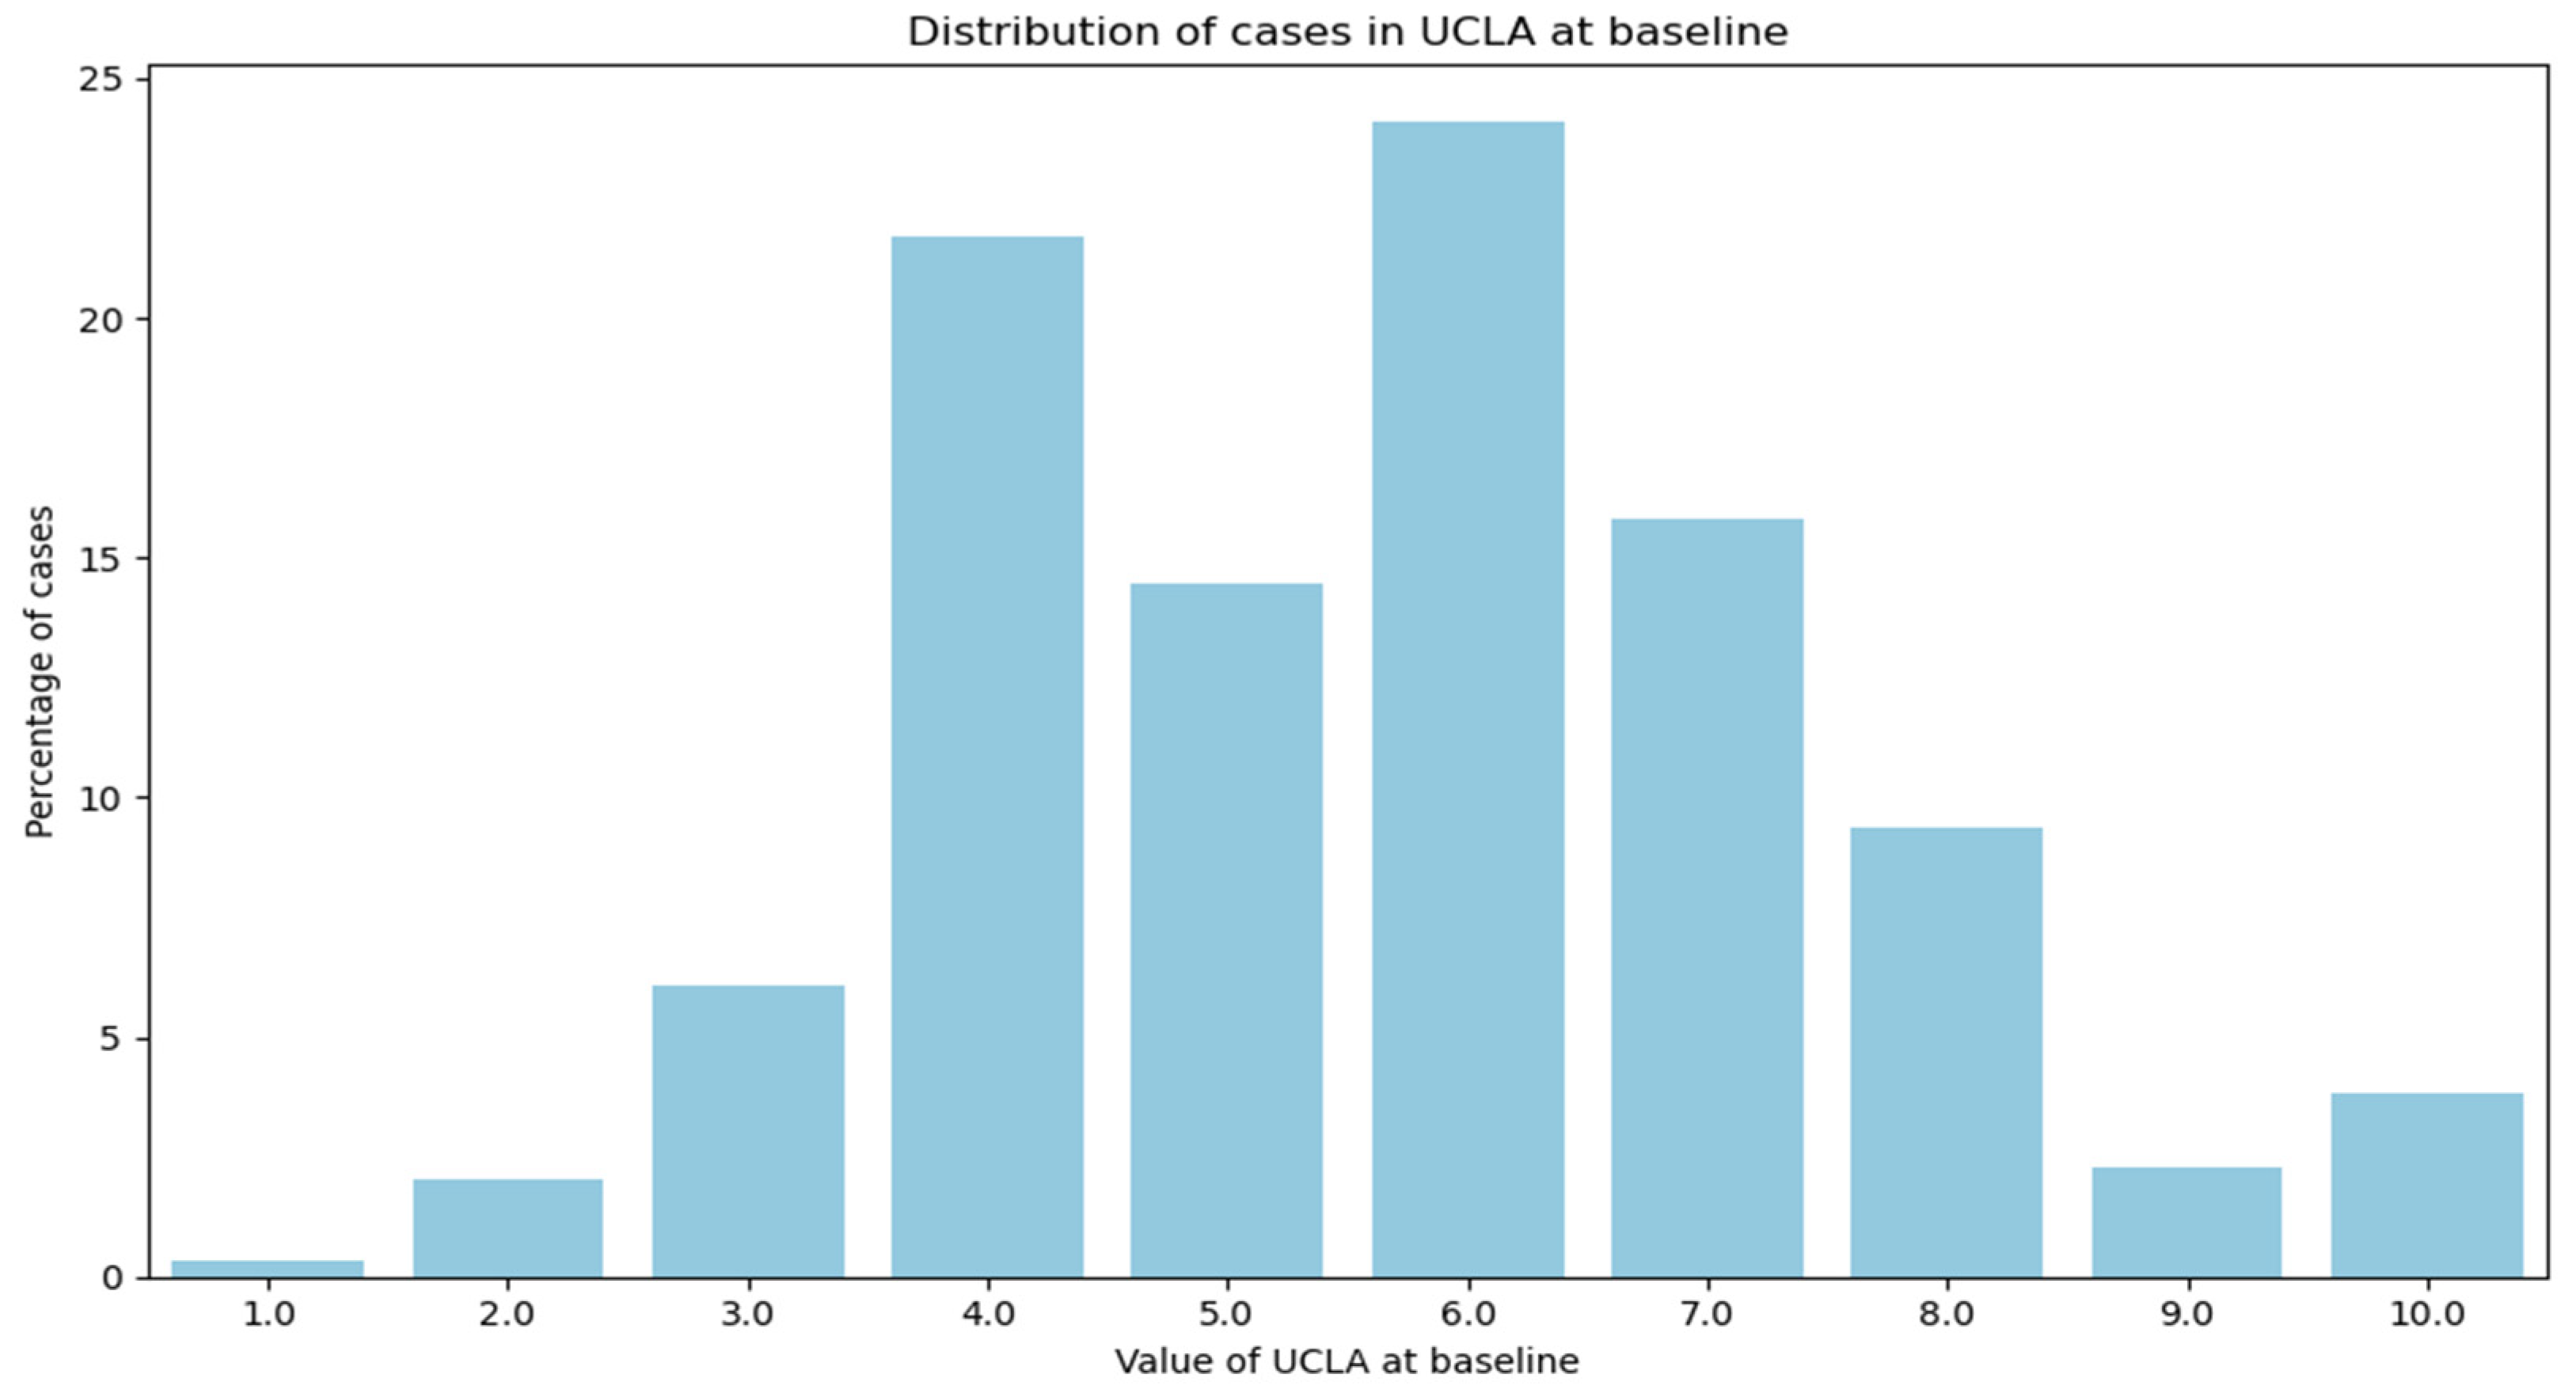
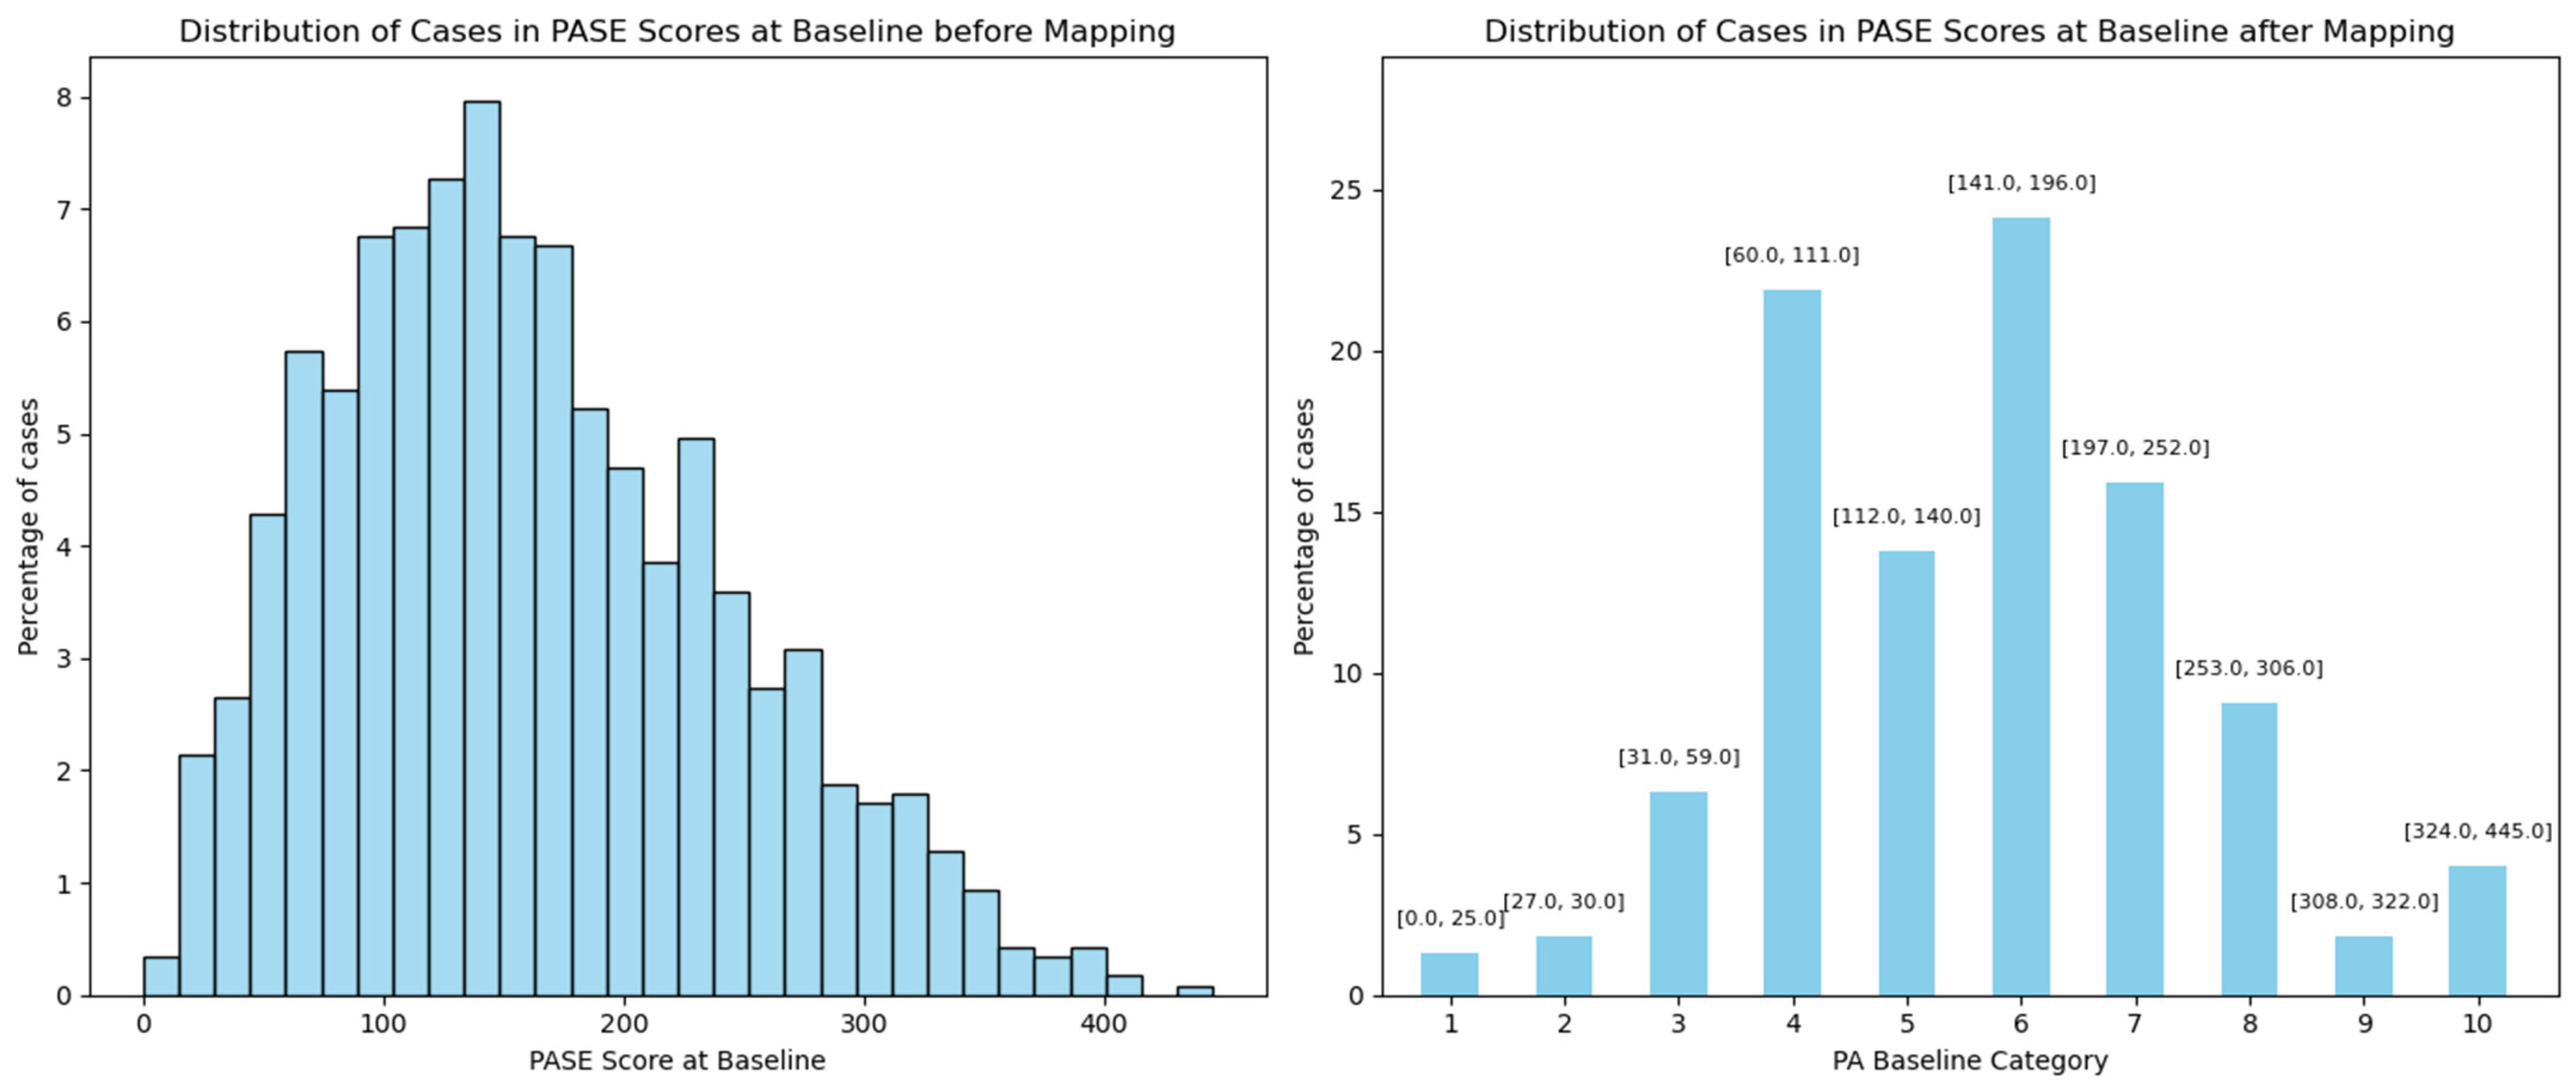
| Baseline PA | Categorical variable from 1 to 10 | No change | Continuous variable from 0 to 445 | Mapped based on UCLA distribution |
| Baseline pain | 0 to 100 | No change | Included two variables: 1. Pain in the left knee, 0 to 10 2. Pain in the right knee, 0 to 10 | 1. Left knee > right knee ==> left knee Left knee < right knee ==> right knee 2. Converted from 0 to 10 to 0 to 100 based on the VAS |
| Baseline QOL | 0 to 100 | No change | 0 to 100 | No change |
| Variables | GLA:D® Included Cases, Mean or Number of Cases n = 7603 | Control Group (OAI) Included Cases, Mean or Number of Cases n = 1156 | Balanced Control Group (OAI) Included Cases, Mean or Number of Cases n = 1156 |
|---|---|---|---|
| Co-Variable | |||
| Age (years) | Min: 23 Max: 85 Mean: 56.69 SD: 6.81 | Min: 45 Max: 79 Mean: 61.15 SD: 9.083 | Min: 45 Max: 79 Mean: 56.58 SD: 7.81 |
| Gender | 1: Male: 2279 (29.97%) 2: Female: 5324 (70.03%) | 1: Male: 642 (55.54%) 2: Female: 514 (44.46%) | 1: Male: 414 (35.81%) 2: Female: 742 (64.19%) |
| BMI (kg/m2) | Min: 17.03 Max: 72.27 Mean: 29.59 SD: 5.82 | min: 18.20 max: 48.70 mean: 30.10 SD: 4.80 | min: 18.2 max: 46.7 mean: 29.61 SD: 4.87 |
| Depression (1–4, low to high) | Rarely: 7188 (94.56%) Sometimes: 314 (4.13%) Often: 88 (1.16%) Usually: 13 (0.17%) | 1: Rarely: 873 (75.52%) 2: Sometimes: 231 (19.98%) 3: Often: 31 (2.68%) 4: Usually: 21 (1.82%) | 1: Rarely: 1018 (88.06%) 2: Sometimes: 134 (11.59%) 3: Often: 3 (0.26%) 4: Usually: 1 (0.09%) |
| Employment status | Employed/student: 6782 (89.17%) On sick leave full-time: 451 (5.93%) Unemployed: 370 (4.87%) | 1: Employed/student: 715 (61.85%) 2: On sick leave full-time: 79 (6.83%) 3: Unemployed: 362 (31.31%) | 1: Employed/student: 1043 (90.22%) 2: On sick leave full-time: 57 (4.93%) 3: Unemployed: 56 (4.84%) |
| Baseline PA (0–10, worst to best) | 9: 422 (5.55%) 8: 267 (3.51%) 7: 628 (8.26%) 6: 1237 (16.27%) 5: 1694 (22.28%) 4: 1162 (15.28%) 3: 1484 (19.52%) 2: 481 (6.33%) 1: 194 (2.55%) 0: 34 (0.45%) | 6: 279 (24.13%) 4: 251 (21.71%) 7: 185 (16.00%) 5: 158 (13.67%) 8: 106 (9.17%) 3: 73 (6.31%) 10: 47 (4.07%) 2: 21 (1.82%) 9: 21 (1.82%) 1: 15 (1.30%) | 6: 278 (24.05%) 7: 213 (18.43%) 4: 209 (18.08%) 8: 131 (11.33%) 5: 129 (11.16%) 3: 89 (7.70%) 10: 55 (4.76%) 9: 21 (1.82%) 2: 16 (1.38%) 1: 15 (1.30%) |
| Baseline pain (0–10, best to worst) | Min: 0 Max: 100 Mean: 47.21 SD: 22.31 | Min: 0 Max: 100 Mean: 50.36 SD: 25.19 | Min: 0 Max: 100 Mean: 47.48 SD: 25.45 |
| Baseline QOL (0–10, worst to best) | Min: 0 Max: 100 Mean: 45.05 SD: 15.09 | Min: 0 Max: 100 Mean: 51.83 SD: 19.19 | Min: 0 Max: 100 Mean: 44.58 SD: 20.32 |
| Outcome | |||
| Changes in PA | Increased: 3131 (41.17%) Maintained: 2359 (31.02%) Decreased: 2113 (27.80%) | Increased: 405 (35.03%) Maintained: 354 (30.62%) Decreased: 397 (34.34%) | Increased: 438 (37.89%) Maintained: 349 (30.19%) Decreased: 369 (31.92%) |
| Changes in pain | Increased 20+ mm on the VAS: 597 (7.85%) Maintained: 4014 (52.78%) Decreased 20+ mm on the VAS: 2992 (39.37%) | Increased 20+ mm on the VAS: 239 (20.67%) Maintained: 586 (50.69%) Decreased 20+ mm on the VAS: 331 (28.63%) | Increased 20+ mm on the VAS: 265 (22.92%) Maintained: 579 (50.09%) Decreased 20+ mm on the VAS: 312 (26.99%) |
| Changes in QOL | Increased 10+ mm on the KOOS scale: 3687 (48.49%) Maintained: 3003 (39.49%) Decreased 10+ mm on the KOOS scale: 913 (12.01%) | Increased 10+ mm on the KOOS scale: 408 (35.29%) Maintained: 524 (45.33%) Decreased 10+ mm on the KOOS scale: 224 (19.38%) | Increased 10+ mm on the KOOS scale: 456 (39.45%) Maintained: 540 (46.71%) Decreased 10+ mm on the KOOS scale: 160 (13.84%) |
Disclaimer/Publisher’s Note: The statements, opinions and data contained in all publications are solely those of the individual author(s) and contributor(s) and not of MDPI and/or the editor(s). MDPI and/or the editor(s) disclaim responsibility for any injury to people or property resulting from any ideas, methods, instructions or products referred to in the content. |
© 2025 by the authors. Licensee MDPI, Basel, Switzerland. This article is an open access article distributed under the terms and conditions of the Creative Commons Attribution (CC BY) license (https://creativecommons.org/licenses/by/4.0/).
Share and Cite
Rafiei, M.; Das, S.; Roos, E.M.; Skou, S.T.; Baumbach, J.; Baumbach, L. Are Changes in Physical Activity, Pain, and Quality of Life in Patients with Knee Osteoarthritis After Exercise Therapy and Education Beyond Normal Fluctuations? A Comparative Study. J. Clin. Med. 2025, 14, 3406. https://doi.org/10.3390/jcm14103406
Rafiei M, Das S, Roos EM, Skou ST, Baumbach J, Baumbach L. Are Changes in Physical Activity, Pain, and Quality of Life in Patients with Knee Osteoarthritis After Exercise Therapy and Education Beyond Normal Fluctuations? A Comparative Study. Journal of Clinical Medicine. 2025; 14(10):3406. https://doi.org/10.3390/jcm14103406
Chicago/Turabian StyleRafiei, Mahdie, Supratim Das, Ewa M. Roos, Søren T. Skou, Jan Baumbach, and Linda Baumbach. 2025. "Are Changes in Physical Activity, Pain, and Quality of Life in Patients with Knee Osteoarthritis After Exercise Therapy and Education Beyond Normal Fluctuations? A Comparative Study" Journal of Clinical Medicine 14, no. 10: 3406. https://doi.org/10.3390/jcm14103406
APA StyleRafiei, M., Das, S., Roos, E. M., Skou, S. T., Baumbach, J., & Baumbach, L. (2025). Are Changes in Physical Activity, Pain, and Quality of Life in Patients with Knee Osteoarthritis After Exercise Therapy and Education Beyond Normal Fluctuations? A Comparative Study. Journal of Clinical Medicine, 14(10), 3406. https://doi.org/10.3390/jcm14103406