Article

The Future Diabetes Mortality: Challenges in Meeting the 2030 Sustainable Development Goal of Reducing Premature Mortality from Diabetes

by
Kaustubh Wagh
1,*,
Alexander Kirpich
1 and
Gerardo Chowell
1,2,*
1
Department of Population Health Sciences, School of Public Health, Georgia State University, Atlanta, GA 30303, USA
2
Department of Applied Mathematics, Kyung Hee University, Yongin 17104, Republic of Korea
*
Authors to whom correspondence should be addressed.
J. Clin. Med. 2025, 14(10), 3364; https://doi.org/10.3390/jcm14103364
Submission received: 11 April 2025 / Revised: 8 May 2025 / Accepted: 9 May 2025 / Published: 12 May 2025

Abstract

:
Objective: This study seeks to forecast the global burden of diabetes-related mortality by type, age group, WHO region, and income classification through 2030, and to assess progress toward Sustainable Development Goal (SDG) 3.4, which aims to reduce premature mortality (among people age 30–70 years) from noncommunicable diseases (including diabetes) by one-third. Methods: We analyzed diabetes mortality data from the Institute for Health Metrics and Evaluation, Global Burden of Disease 2019, covering 30 years (1990–2019). Using this historical dataset, we generated 11-year prospective forecasts (2020–2030) globally and stratified by diabetes type (type 1, type 2), age groups, WHO regions, and World Bank income classifications. We employed multiple time series and epidemic modeling approaches to enhance predictive accuracy, including ARIMA, GAM, GLM, Facebook’s Prophet, n-sub-epidemic, and spatial wave models. We compared model outputs to identify consistent patterns and trends. Results: Our forecasts indicate a substantial increase in global diabetes-related mortality, with type 2 diabetes driving the majority of deaths. By 2030, annual diabetes mortality is projected to reach 1.63 million deaths (95% PI: 1.48–1.91 million), reflecting a 10% increase compared to 2019. Particularly concerning is the projected rise in mortality among adults aged 15–49 and 50–69 years, especially in Southeast Asia and low- and middle-income countries. Mortality in upper-middle-income countries is also expected to increase significantly, exceeding a 50% rise compared to 2019. Conclusions: Diabetes-related deaths are rising globally, particularly in younger and middle-aged adults in resource-limited settings. These trends jeopardize the achievement of SDG 3.4. Urgent action is needed to strengthen prevention, early detection, and management strategies, especially in Southeast Asia and low-income regions. Our findings provide data-driven insights to inform global policy and target public health interventions.

1. Introduction

Diabetes mellitus, a chronic metabolic disorder characterized by high blood sugar levels, is a growing global health crisis. The International Diabetes Federation estimates that 537 million adults worldwide currently live with diabetes, a number projected to rise to 783 million by 2045 [1]. Recent global burden assessments show a significant increase in diabetes prevalence during the past three decades, with the steepest rises occurring in low- and middle-income countries [2,3,4]. Diabetes occurs when the pancreas produces insufficient insulin or the body cannot effectively use it, leading to hyperglycemia. Prolonged high blood glucose levels increase the risk of severe complications such as heart attacks, strokes, kidney failure, and limb amputations. Diabetes is classified into three types. Type 1 diabetes results from autoimmune destruction of insulin-producing beta cells, with no known cause or prevention; type 2 diabetes, which accounts for more than 95% of all cases, occurs when the body develops insulin resistance, often due to obesity, physical inactivity, and genetic predisposition [5]. Unlike type 1, type 2 diabetes is largely preventable. Gestational diabetes develops during pregnancy, increasing the risk of complications for both mother and child and predisposing both to type 2 diabetes later in life.
In recent years, diabetes-related deaths have surged globally, making it one of the leading causes of mortality [6]. According to the World Health Organization (WHO), diabetes was the eighth leading cause of death in 2019, responsible for 1.6 million deaths [7,8]. Mortality trends indicate a 70% increase in diabetes-related deaths since 1990, with the greatest burden observed in Southeast Asia and Sub-Saharan Africa. The geographic and demographic distribution of diabetes varies significantly [9]. Developing countries, particularly in Asia and Africa, are experiencing a diabetes epidemic fueled by rapid urbanization, sedentary lifestyles, and changing diets [10]. Socioeconomic disparities exacerbate the crisis, as limited healthcare access and financial constraints lead to poor disease management, particularly in lower-income populations. Diabetes is more common in men than in women, and prevalence increases with age. However, a concerning rise in younger adult cases (ages 15–49) suggests future health and economic implications.
Given the rising burden of diabetes mortality, robust forecasting is crucial for informing public health policies, optimizing resource allocation, and developing targeted intervention strategies. Previous forecasting studies have used traditional statistical models such as autoregressive integrated moving average (ARIMA) and machine learning-based frameworks [11,12]. However, many of these models fail to account for socioeconomic heterogeneity, spatial dependencies, and the influence of multiple epidemic waves. Accurate forecasting of diabetes mortality is essential to guide policymakers in implementing effective prevention programs. It can also help global health initiatives understand progress toward the WHO’s Sustainable Development Goal (SDG) 3.4, which aims to reduce premature mortality from noncommunicable diseases, including diabetes, by one-third by 2030 [13,14,15].
Among WHO regions, Southeast Asia region has the highest diabetes mortality rates, particularly in India, Pakistan, and Bangladesh, where rapid urbanization and limited healthcare infrastructure contribute to rising deaths. Forecasting mortality in this region is crucial for understanding the global trajectory of diabetes mortality by 2030.
Similarly, the diabetes burden is staggering in both low- and middle-income countries (LMICs) and upper-middle income countries (UMICs). Urbanization, dietary shifts, and inadequate healthcare access are key drivers of the crisis in LMICs, leading to severe economic consequences, including lost productivity and rising healthcare costs. Even in UMICs, where healthcare infrastructure is relatively better, managing diabetes remains complex and costly due to its chronic nature.
This study aims to address the global burden of diabetes mortality by employing a novel forecasting approach that integrates sub-epidemic and spatial wave models. Our model incorporates diabetes type, age groups, WHO regions, and World Bank income classifications. To our knowledge, this is the first study to use Global Burden of Disease 2019 data for comprehensive global diabetes mortality forecasting. Historically, diabetes mortality has been highest among adults older than 50 years of age. However, with increasing cases among younger age groups (15–49 years), there is an urgent need to evaluate future mortality patterns across age demographics. We focus on forecasting mortality under 70 years of age, given its importance in measuring premature noncommunicable disease deaths per SDG 3.4.

2. Materials and Methods

2.1. Data Collection and Preparation

We accessed publicly available diabetes mortality data from Our World in Data through https://ourworldindata.org/data and downloaded it on 23 March 2024. The original source of data is the Institute for Health Metrics and Evaluation, Global Burden of Disease 2019, which was retrieved on 22 September 2021, according to Our World in Data [16]. The mortality (number of deaths caused by diabetes) data were available for the years 1990 to 2019 (30 years) with annual frequency and segregated by type, age groups, WHO regions, and WB’s income classification. We used all 30 years of data, so we set the calibration period to 30 years and the forecasting horizon between 2020 and 2030 (11 years). Data were preprocessed using Microsoft Excel pivot tables. All forecasting analyses were conducted using Rstudio, Posit Software, Boston, MA, USA and MATLAB, MathWorks Inc., Natick, MA, USA. Specifically, we used the StatModPredict dashboard (developed in RStudio v. 4.3.2) to generate forecasts from the ARIMA, GAM, GLM, and Prophet models (Taylor & Letham, 2018). For the ensemble n-sub-epidemic modeling framework, we employed the SubEpiPredict toolbox (subEpiPredict toolbox) implemented in MATLAB (R2023b) [17]. These modeling toolboxes were developed to facilitate reproducible, user-friendly forecasting workflows. A brief description of the models is provided below and a comprehensive overview of each model is included in the Supplementary Materials.

2.2. Forecasting Models

2.2.1. ARIMA (Autoregressive Integrated Moving Average)

ARIMA is a time series model that builds forecasts by identifying patterns in past mortality data [18]. It combines three components: trends over time (autoregression), smoothing of random fluctuations (moving average), and differencing to stabilize the data. ARIMA works best for short-term forecasting when historical trends are stable and linear [19]. However, it is less effective when mortality patterns shift suddenly due to interventions or emerging risk factors [19].

2.2.2. GAM (Generalized Additive Model)

GAMs extend traditional regression models that allow for flexible, nonlinear relationships between time and mortality outcomes [20]. Instead of fitting a straight line, GAMs use smooth curves to model long-term trends in diabetes deaths [21]. This makes them well suited for capturing gradual changes in mortality that may result from evolving lifestyle behaviors, treatment access, or demographic shifts.

2.2.3. GLM (Generalized Linear Model)

GLMs are classic statistical models used to relate a response variable (like mortality count) to one or more predictors (such as time). They assume a specific relationship—often linear—between the predictors and the outcome, and use a distribution suited for the type of data (e.g., Poisson or normal) [22]. GLMs are straightforward, interpretable, and effective when trends are relatively smooth and consistent.

2.2.4. Prophet (Developed by Meta/Facebook)

Prophet is a decomposable time series model that breaks down mortality trends into three components: an overall trend, seasonal effects (e.g., annual patterns), and abrupt changes due to major events or interventions [23]. It is highly automated and designed to handle missing data and outliers well [24]. Prophet is especially useful for longer-term forecasting where trends may shift, making it helpful for identifying inflection points in chronic disease burden.

2.2.5. n-Sub-Epidemic Model

This model interprets mortality trends as a series of overlapping “sub-epidemics”, each representing a surge or phase in diabetes deaths [25,26]. Each sub-epidemic has its own timing and intensity, allowing the overall model to capture complex mortality dynamics—such as plateaus or multiple peaks—often seen in real-world chronic disease progression. It is particularly powerful in reflecting regional differences or the cumulative effects of repeated disruptions.

2.2.6. Ensemble Sub-Epidemic Models (Unweighted and Weighted)

These models combine forecasts from the top-performing sub-epidemic models. The unweighted ensemble gives equal importance to each model, while the weighted version gives more influence to models with better historical fit [27]. This ensemble approach improves robustness by balancing strengths across models and helps produce more reliable forecasts with quantified uncertainty.
Under the n-sub-epidemic modeling framework, we developed several models, including the ensemble unweighted (NSE UW), the ensemble weighted (NSE W), and the top two individually ranked models (NSE ranked (1) and NSE ranked (2)). We focused on NSE UW and NSE W through Table 1 and Figure 1, excluding individual NSE-ranked models, as they are encapsulated within the ensemble approaches. The ensemble models (NSE UW, NSE W) are superior to individual models (NSE ranked (1), NSE ranked (2)) as they improve forecasting performance by systematically incorporating the predictive accuracy of individual models [27]. However, for transparency and to show the individual models that informed our ensemble approaches, we presented the results of NSE-ranked (1) and NSE-ranked (2) models in panel Figure 2, Figure 3, Figure 4 and Figure 5. The panel figures (Figure 2, Figure 3, Figure 4 and Figure 5) illustrate the forecast derived from numerous models. The black circles to the left of the vertical dashed line denote observed diabetes deaths up to the year 2019, which marked the end of the calibration period. The red solid line marks the trajectory of the best-fit model, while black dashed lines represent the 95% prediction intervals. The vertical dashed black line signifies the start of the forecast period (2020–2030).

2.3. Model Evaluation

Models were evaluated using a set of performance metrics that measure point and probabilistic forecast accuracy simultaneously [27]. Models were evaluated based on mean square error and mean absolute error, which quantify the deviation between predicted and the observed values for a given point in time. In this context, smaller values indicate better model performance. The reliability of uncertainty was evaluated based on the proportion of observations fall in the predicted intervals, with 95% P.I coverage where higher values ideally estimate better calibrated uncertainty [28]. In addition, WIS provides balance between sharp and out-of-range predictions due to penalizing prediction intervals that are too wide and observations that fall outside predicted range, thus sustaining an overall balance between forecast sharpness and calibration [25].

2.4. Quantifying Forecast

We quantified the trends in each model. We used the percentage change formula to calculate the relative change (%) in the number of diabetes-related deaths between 2019 and 2030. The formula was (Forecast (2030) − Observed (2019)/Observed (2019)) × 100. Here, forecast (2030) refers to the forecasted number of diabetes-related deaths in 2030, and observed (2019) refers to the observed number of diabetes-related deaths in 2019, which is the last year of available data. We calculated the overall diabetes-related mortality in 2030 by first calculating the mean forecast across all models for each diabetes type separately and then aggregating these type-specific estimates to obtain the total burden.

3. Results

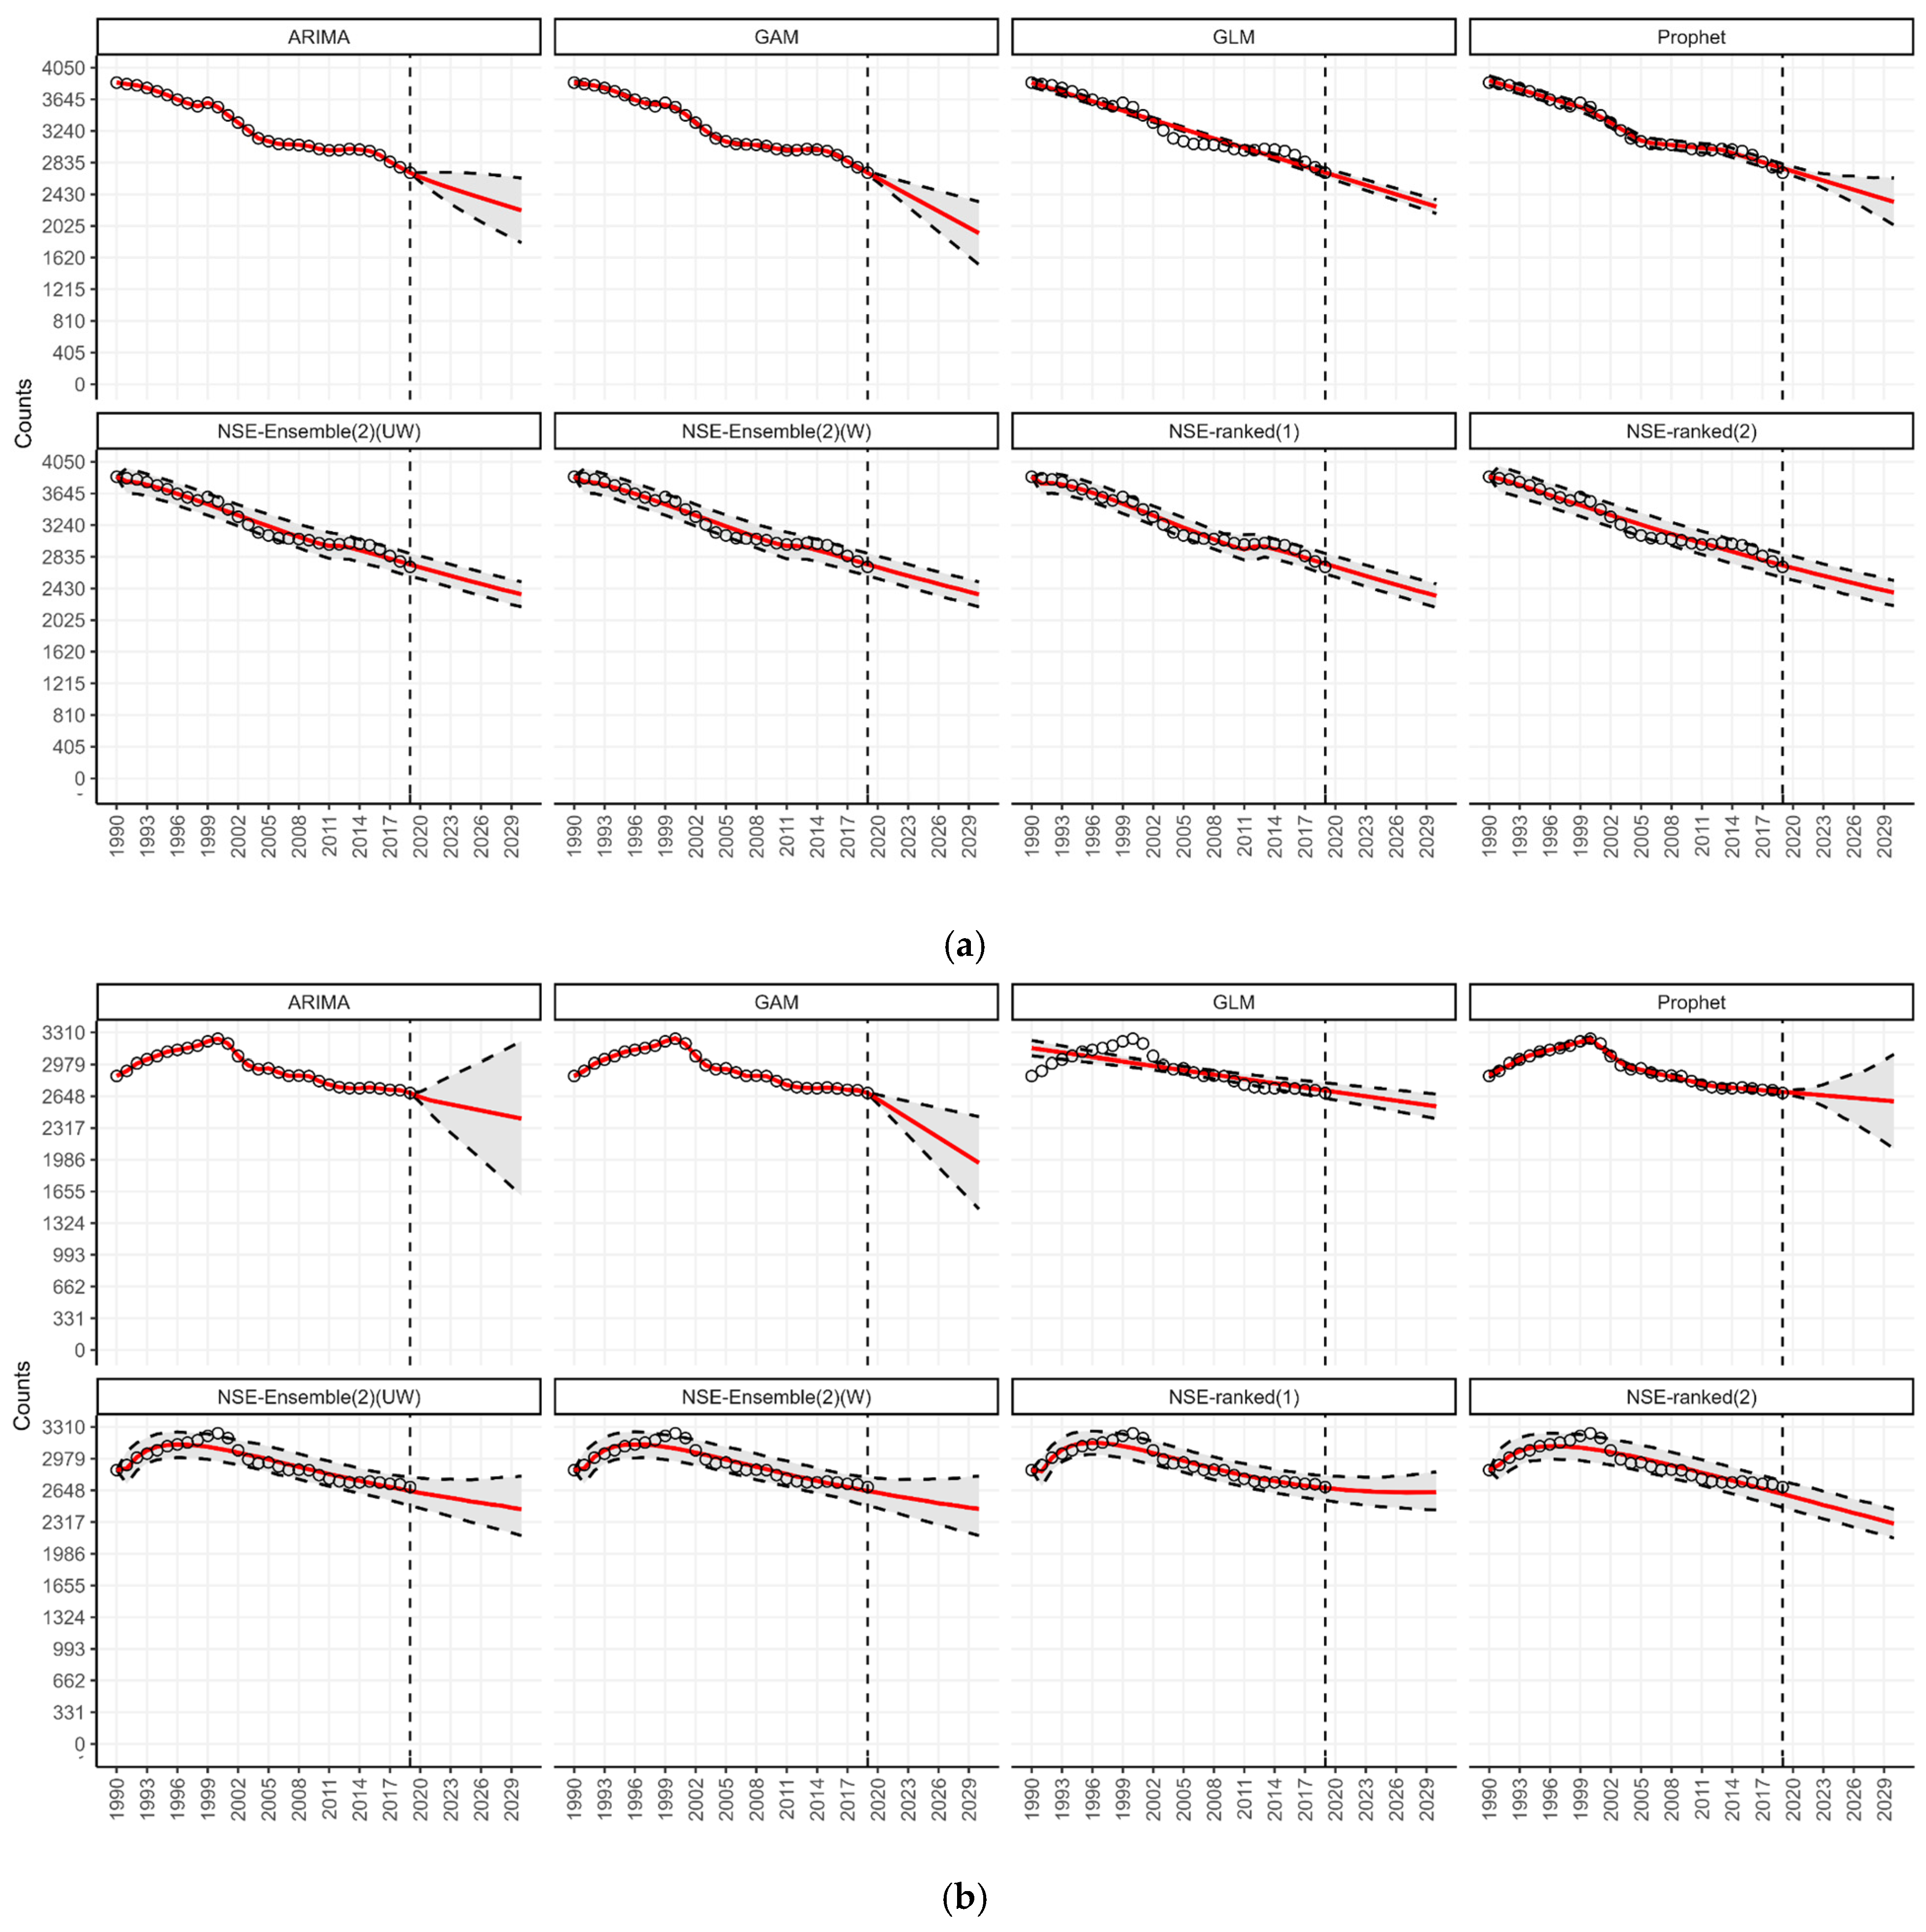
3.1. Forecasting by Type of Diabetes

Our 11-year-ahead forecasts from the six different models indicate an increase in the number of deaths from type 1 diabetes (Figure 1). Although the magnitude of deaths from type 1 diabetes is significantly lower than that of type 2 diabetes, there was a rise in type 1-related mortality between 1990 and 2019 (Figure 2a,b). In the Prophet and GAM models, a total of 92.9 thousand and 90.3 thousand (95% PI 85.6, 100.3, and 95% PI 86.0, 94.6) type 1 diabetes-related deaths could be added globally per year by 2030, respectively (Table 1). This would be more than a 15 percent rise in the annual type 1 diabetes-related deaths compared to 2019. Overall, the number of deaths from diabetes doubled between 1990 and 2019. Most diabetes-related deaths are attributed to type 2 diabetes and people greater than 50 years of age (Figure 1). Based on the global trend, our 11-year-ahead forecasts from the different models continue to support a significant increase in the number of deaths from type 2 diabetes (Figure 1). According to our forecasts from the GAM, ARIMA, and Prophet models, 1.9 million or more (95% PI: (1.9; 2.1), (1.8; 2.1), (1.8; 2.0), respectively) deaths could be added globally per year by 2030 (Table 1). This would be more than a 30 percent rise in the annual type 2 diabetes-related deaths compared to 2019.
Figure 2. (a) Forecasts for the number of deaths from type 1 diabetes globally from 2020 to 2030. (b) Forecasts for the number of deaths from type 2 diabetes globally from 2020 to 2030.
Jcm 14 03364 g002

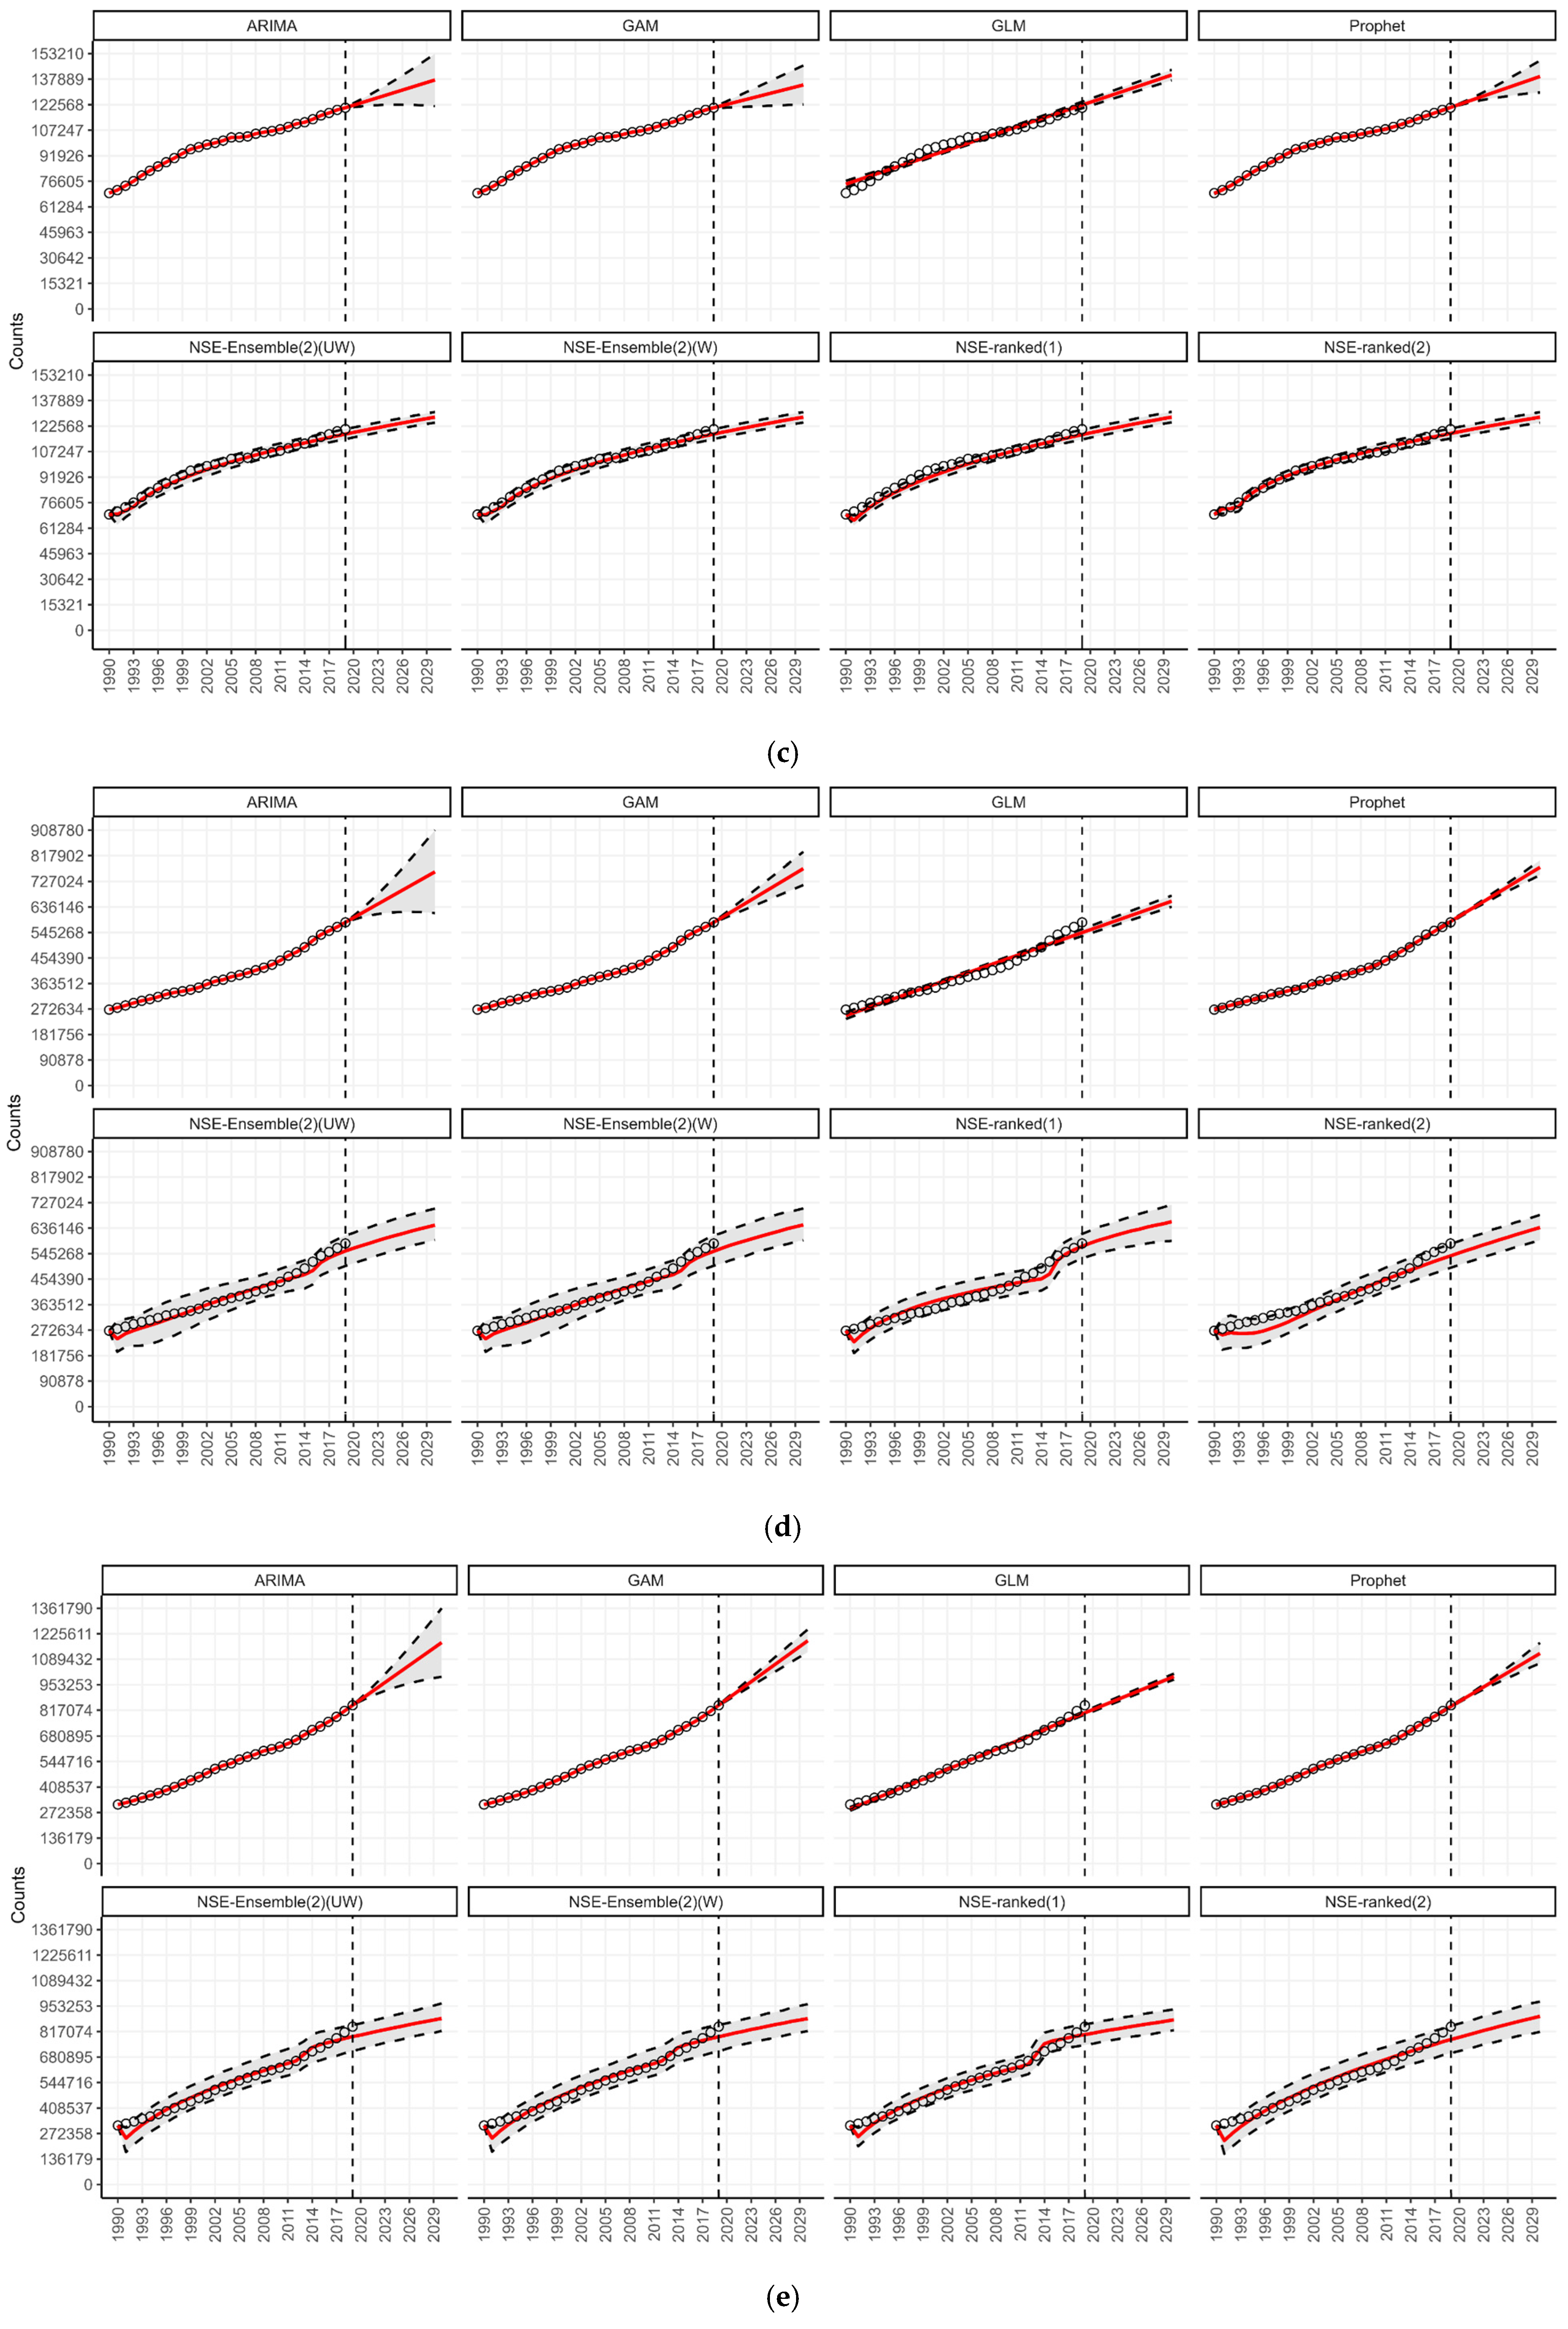
3.2. Forecasting by Age Groups

Our 11-year-ahead forecasts from the eight different models continue to support an increase in the number of deaths from diabetes for age groups 15–49 and 50–69 years (Figure 3c,d). According to our forecasts from the Prophet and GLM models, approximately 140 thousand (95% PI: 137.3; 143.6, and 95% PI: 130.0; 149.1) deaths could be added globally per year by 2030 in the age group 15–49 (Table 1). This would be more than a 15 percent rise in the annual diabetes-related deaths in this age group compared to 2019 (Figure 1). Similarly, forecasts from the Prophet and GAM models suggest a total of 778 thousand (95% PI: 750.5; 801.5, and 95% PI: 714.5; 831.7) deaths could be added globally per year by 2030 in the age group 50–69 (Table 1). This would be more than a 30 percent rise in the annual diabetes-related deaths in this age group compared to 2019 (Figure 1). The forecasting details of all age groups are included in Figure 3a–e.
Figure 3. (a) Forecasts for the number of deaths from diabetes among age group under 5 years globally from 2020 to 2030. (b) Forecasts for the number of deaths from diabetes among age group 5–14 years globally from 2020 to 2030. (c) Forecasts for the number of deaths from diabetes among age group 15–49 years globally from 2020 to 2030. (d) Forecasts for the number of deaths from diabetes among age group 50–69 years globally from 2020 to 2030. (e) Forecasts for the number of deaths from diabetes among age group 70+ years globally from 2020 to 2030.
Jcm 14 03364 g003aJcm 14 03364 g003b

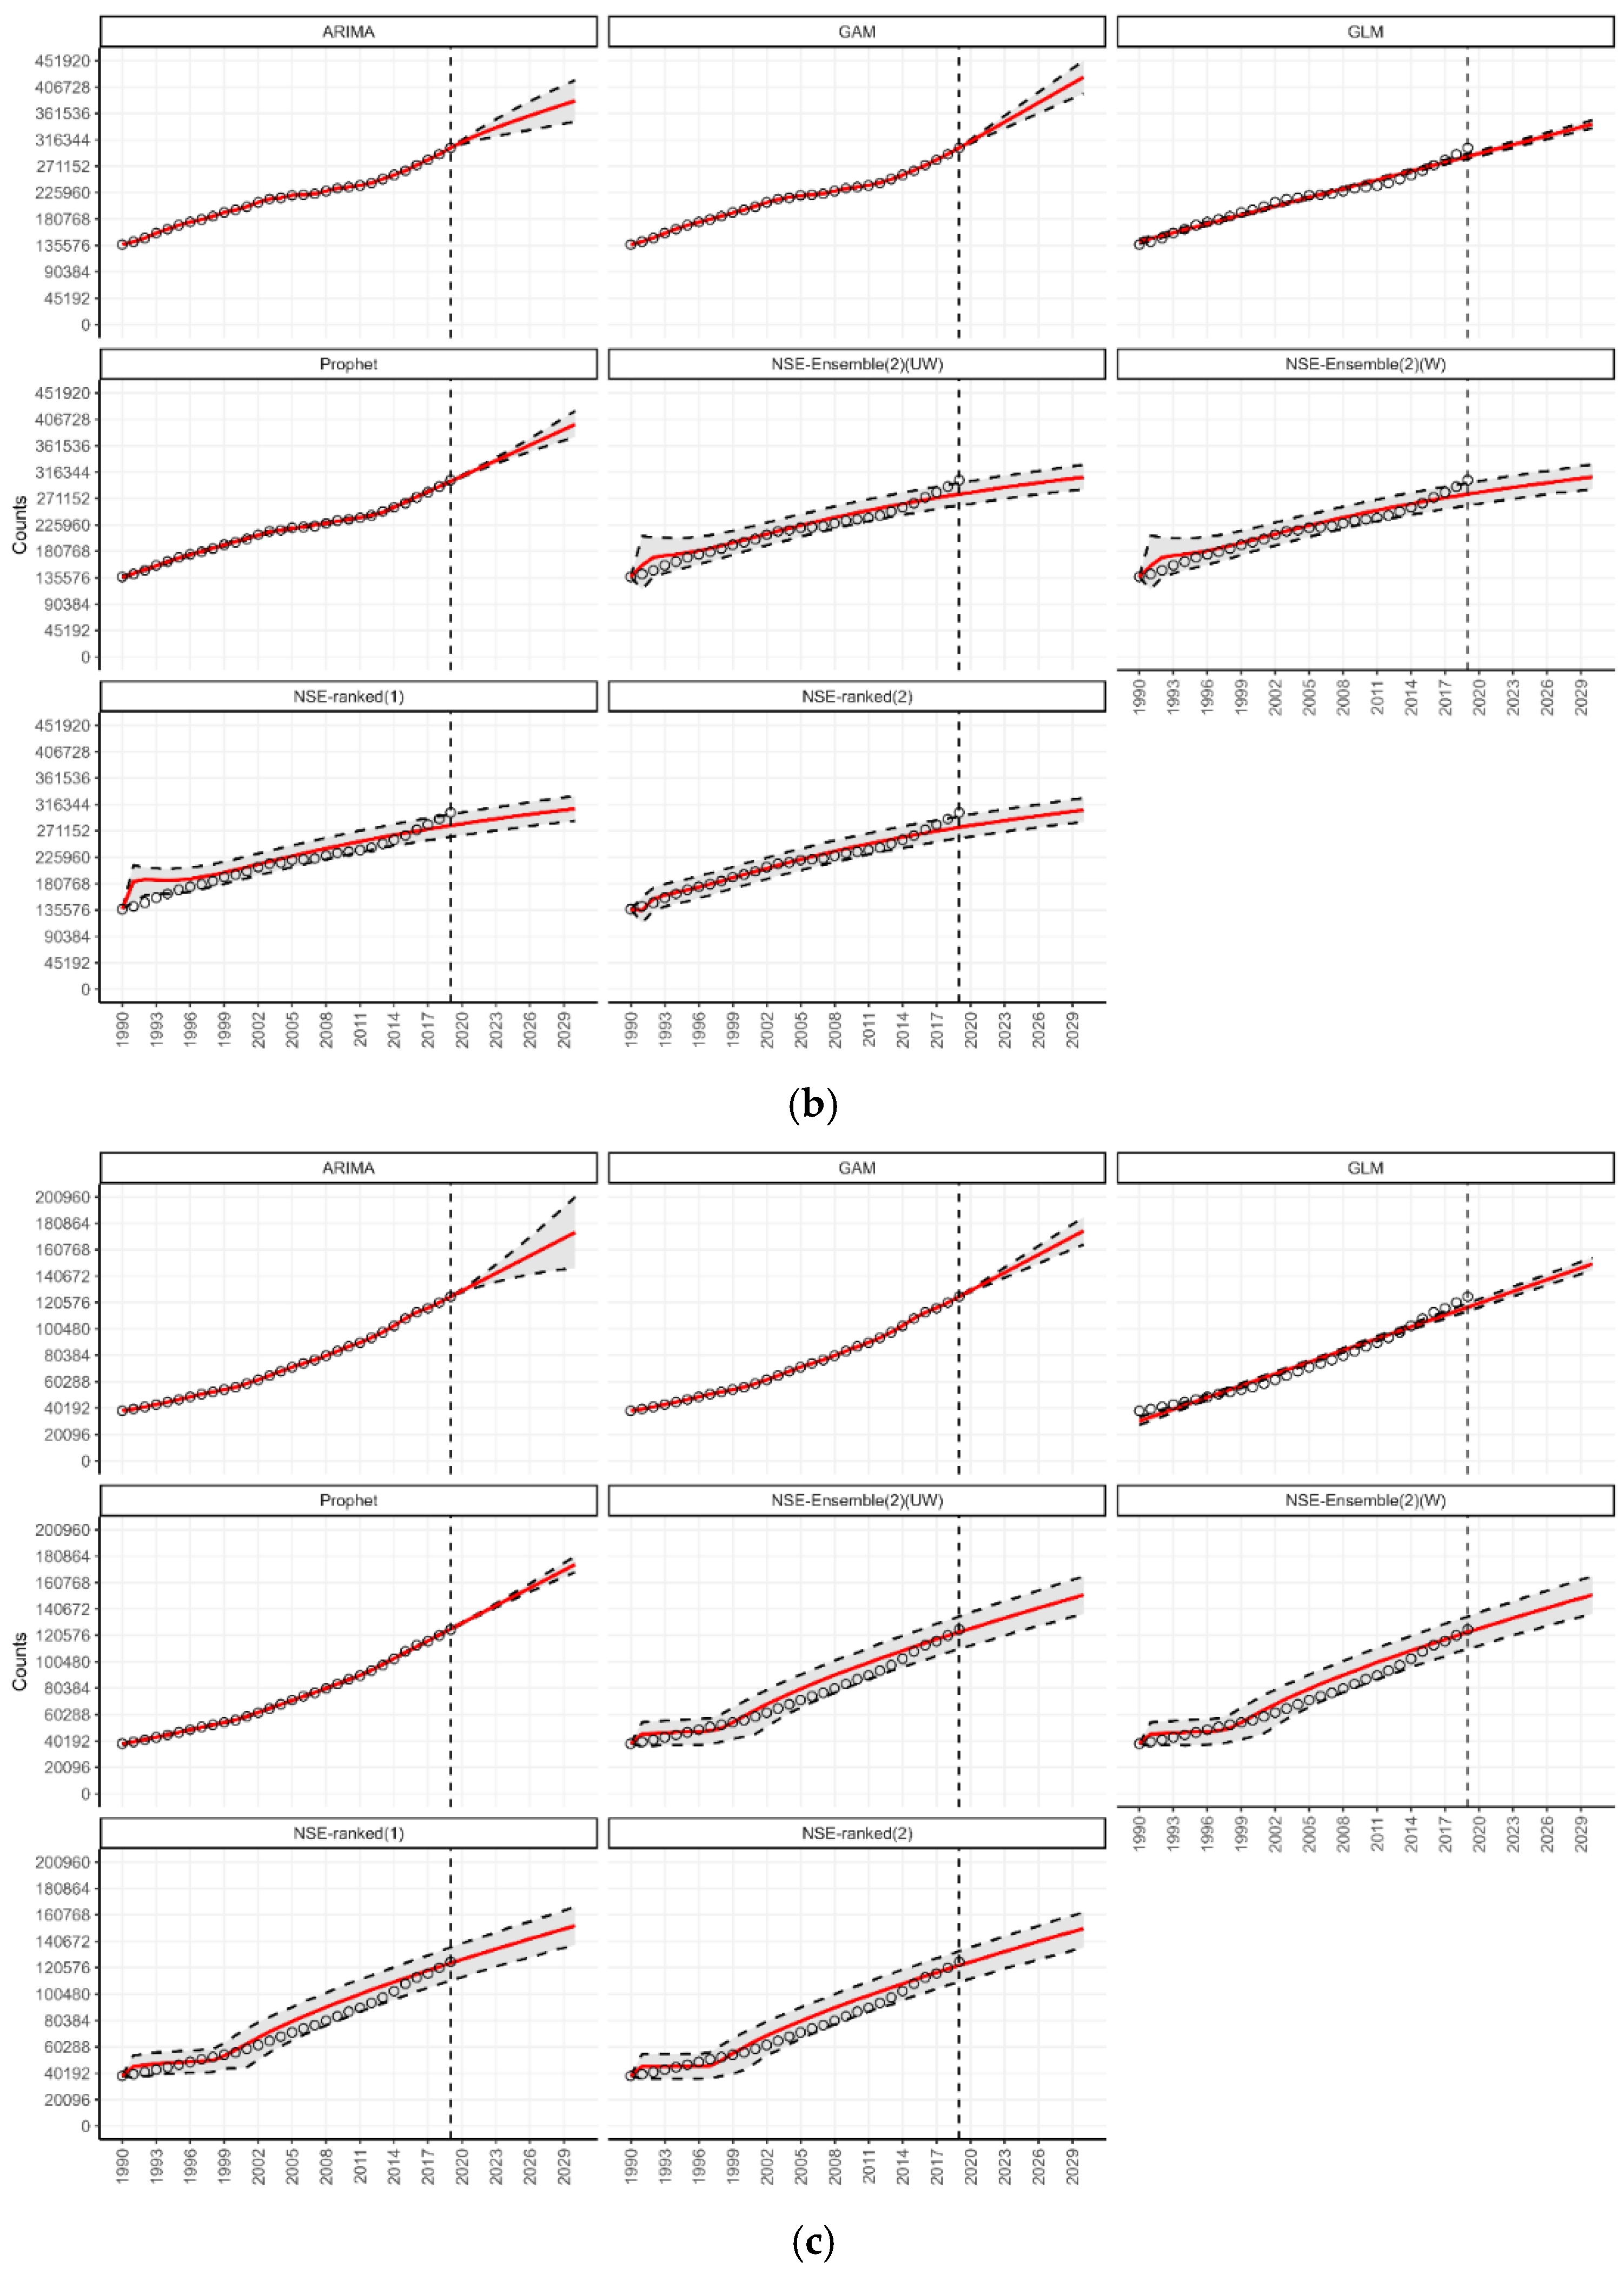
3.3. Forecasting by WHO Regions

Our forecast suggests the number of deaths from diabetes will be highest in the Southeast Asia region, followed by the Americas and Western Pacific regions (Table 1). The percentage of change in the number of deaths in 2030 compared to 2019 would be the highest in the Eastern Mediterranean region, which is consistent across various models (Figure 1). According to our forecasts from the Prophet and GAM models, a total of 655 thousand (95% PI 630.2; 677.8, and 95% PI 586.7; 722.1) deaths could be added globally per year by 2030 in the Southeast Asia region (Table 1). This would be greater than a 35 percent rise in the annual diabetes-related deaths in this region compared to 2019. Similarly, forecasts in the Americas from the GAM model suggest that approx. 424 thousand (95% PI 395.9; 451.9) deaths could be added globally per year by 2030 (Table 1). This would be more than a 40 percent rise in the annual diabetes-related deaths in this age group compared to 2019. The forecasting details for all WHO regions are shown in Figure 4a–f.
Figure 4. (a) Forecasts for the number of deaths from diabetes in the African region from 2020 to 2030. (b) Forecasts for the number of deaths from diabetes in the American region from 2020 to 2030. (c) Forecasts for the number of deaths from diabetes in the Eastern Mediterranean region from 2020 to 2030. (d) Forecasts for the number of deaths from diabetes in the European region from 2020 to 2030. (e) Forecasts for the number of deaths from diabetes in the Southeast Asia region from 2020 to 2030. (f) Forecasts for the number of deaths from diabetes in the Western Pacific region from 2020 to 2030.
Jcm 14 03364 g004aJcm 14 03364 g004bJcm 14 03364 g004cJcm 14 03364 g004d

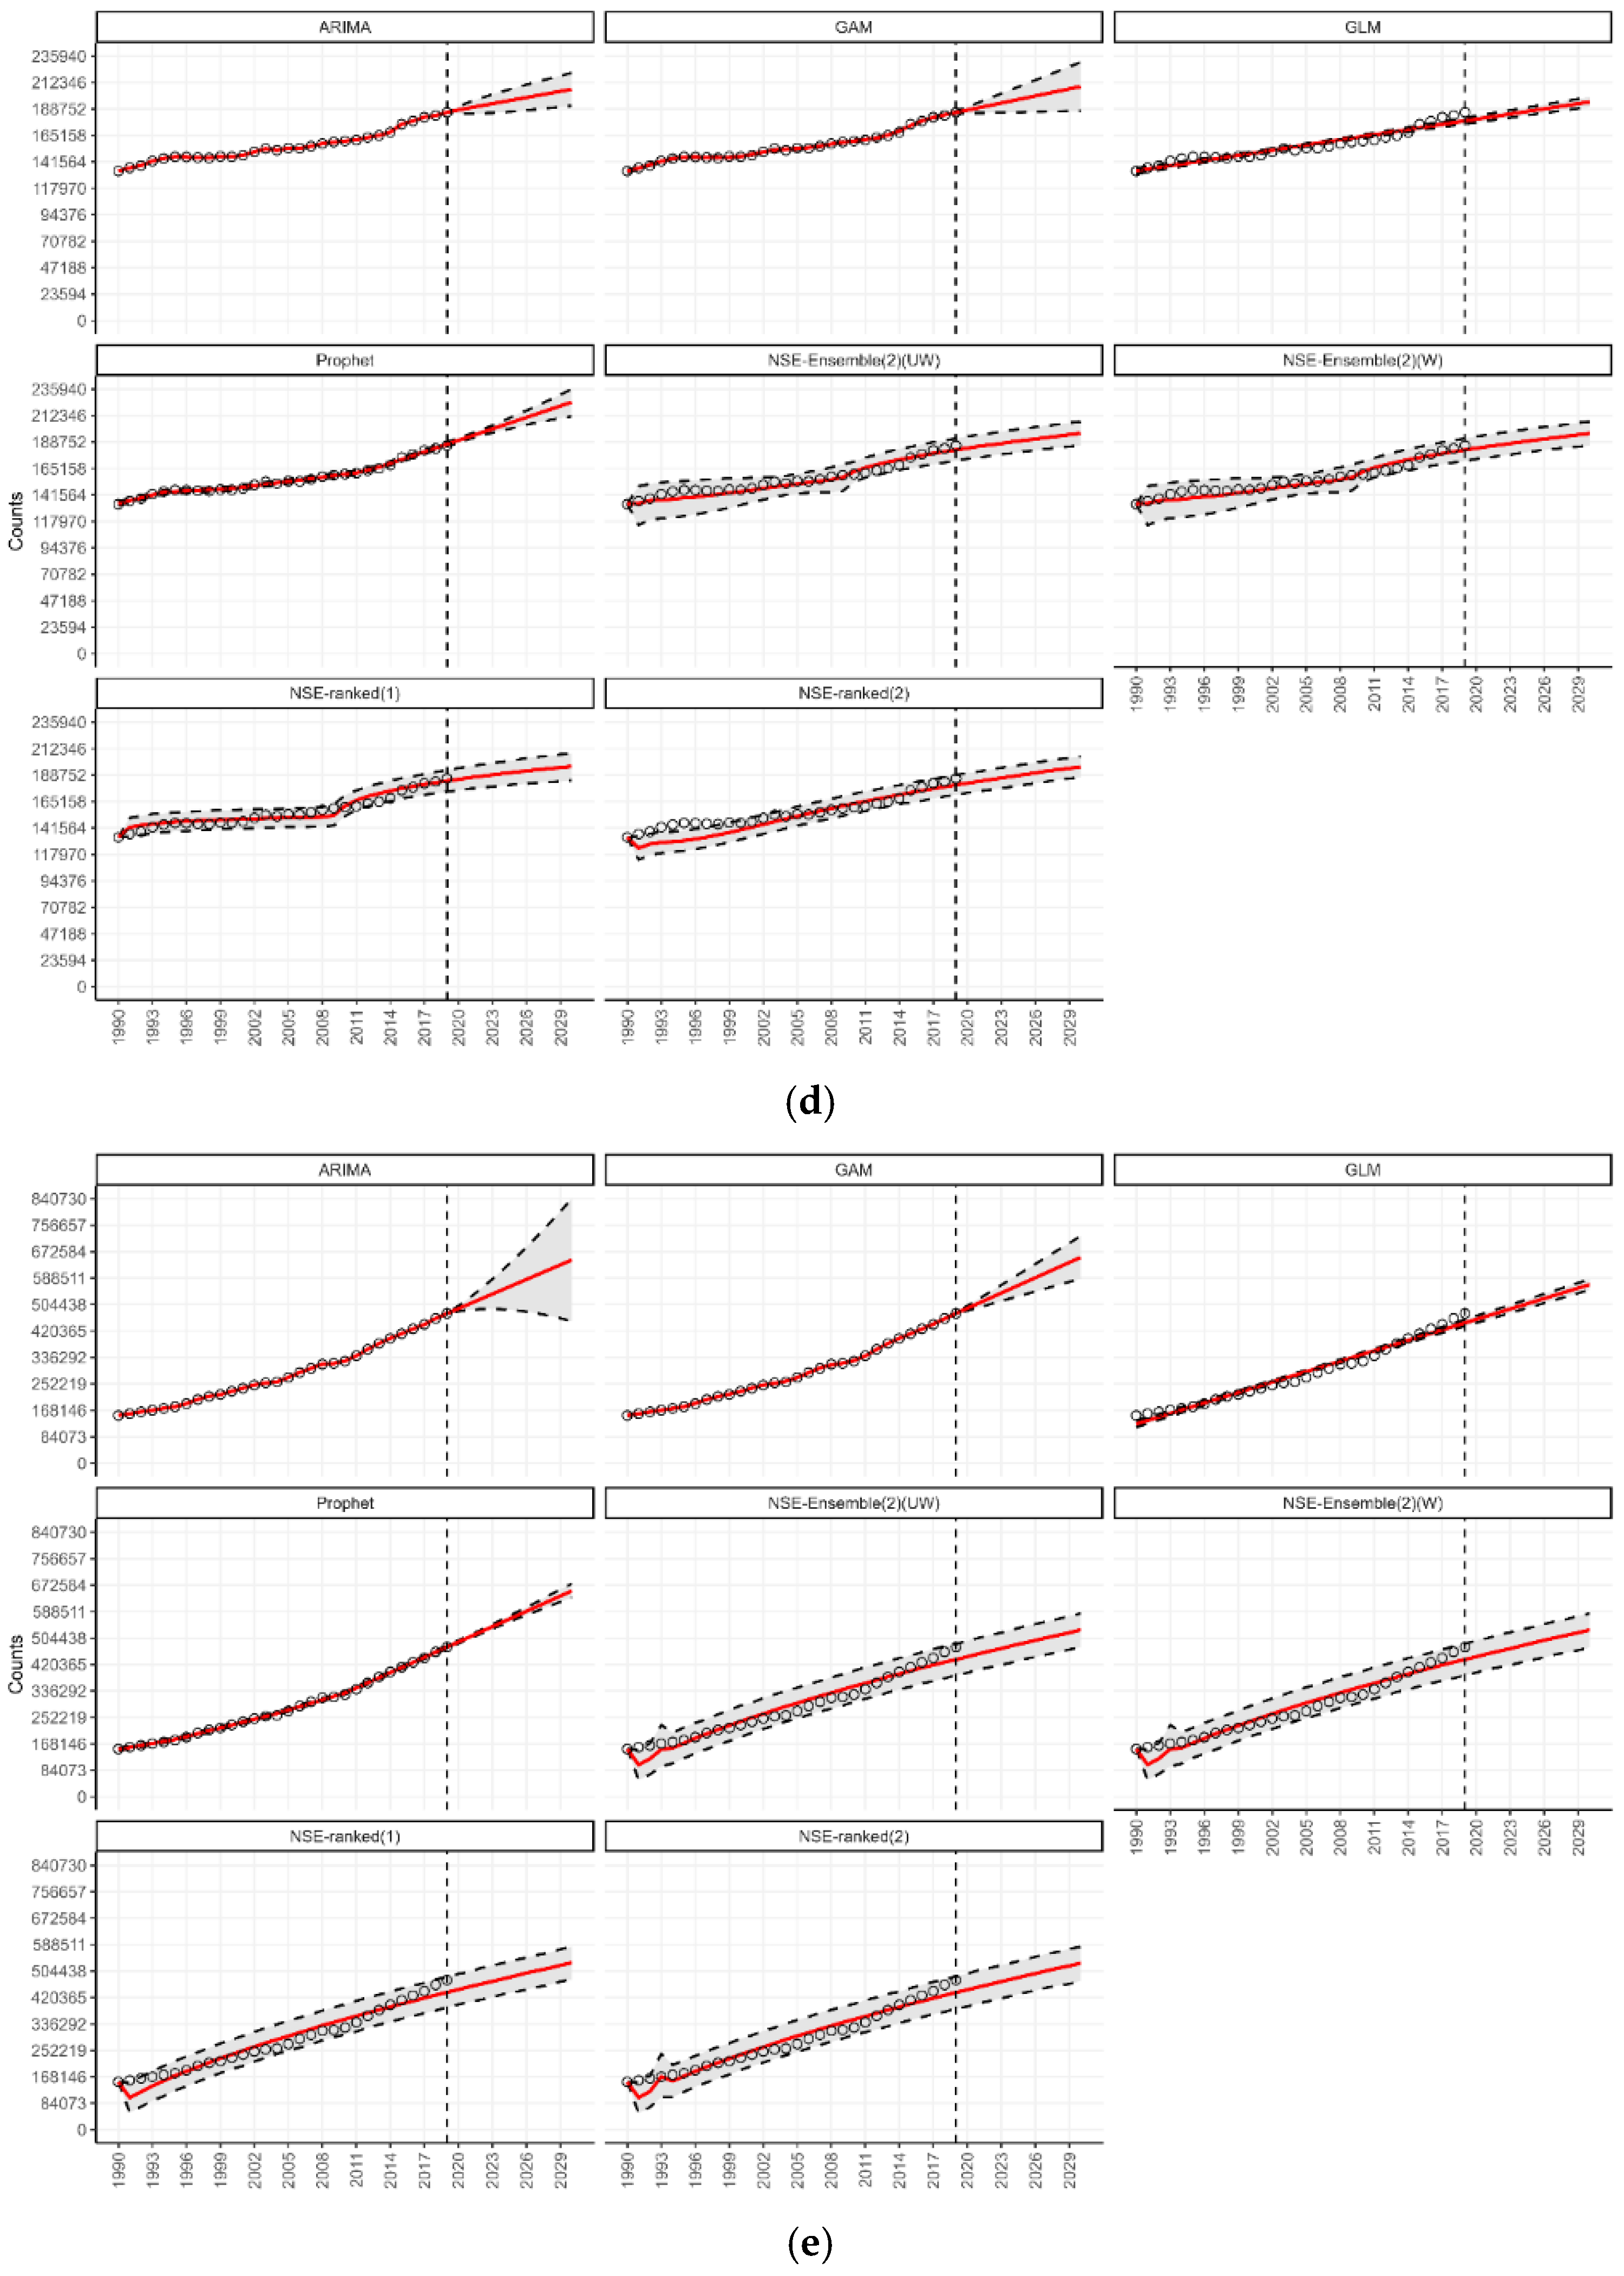
3.4. Forecasting for Countries by World Bank Income Classification

The forecast indicates countries in the World Bank’s low-middle income classification expected to report the highest number of deaths from diabetes (approx. between 763 and 942 thousand, depending upon the model) by 2030, followed by upper-middle and high-income countries (Table 1). According to our forecasts from the Prophet and GAM models, a total of 942 thousand (95% PI 909.6; 973.8, and 95% PI 860.0; 1017.5) deaths could be added globally per year by 2030 in low-middle income countries (Table 1). This would be greater than a 35 percent rise in the annual diabetes-related deaths in these countries compared to 2019. Similarly, forecasts in upper-middle income countries from the GAM model suggest that a total of 768 thousand (95% PI 673.7; 862.7) deaths could be added globally per year by 2030 (Table 1). This would be more than a 50 percent rise in the annual diabetes-related deaths in these countries compared to 2019. The forecasting details of countries in all income groups are shown in Figure 5a–d.
Figure 5. (a) Forecasts for the number of deaths from diabetes in low-income countries from 2020 to 2030. (b) Forecasts for the number of deaths from diabetes in high-income countries from 2020 to 2030. (c) Forecasts for the number of deaths from diabetes in low-middle-income countries from 2020 to 2030. (d) Forecasts for the number of deaths from diabetes in upper-middle-income countries from 2020 to 2030.
Jcm 14 03364 g005aJcm 14 03364 g005b

3.5. Forecasting in the Context of SDG 3.4

The Sustainable Development Goal (SDG) 3.4 intends to reduce the premature mortality (between the ages of 30 and 70) from four noncommunicable diseases, including cancers, cardiovascular diseases, chronic respiratory diseases, and diabetes, by one-third by 2030 compared to 2015 levels. To assess progress toward SDG target 3.4, we compared projected diabetes-related mortality in 2030 with baseline 2015 levels, specifically focusing on premature deaths in working-age populations (15–49 and 50–69 years) rather than the standard age range of 30–70 years for SDG 3.4, due to limitations in the available age group data. By 2030, diabetes-related mortality is projected to rise 23% for ages 15–49 and 51% for ages 50–69 compared to 2015 levels. Between 2015 and 2030, the proportion of all diabetes-related deaths occurring in younger adults (15–49 years) is expected to rise slightly, from 8.3% to 8.6%, while the proportion in middle-aged adults (50–69 years) is projected to increase substantially, from 37.8% to 47.7%. These trends directly contradict SDG 3.4, which targets a one-third reduction in premature mortality from noncommunicable diseases by 2030.

3.6. Summary of Main Findings

Global diabetes-related mortality is projected to rise significantly by 2030, undermining progress toward the Sustainable Development Goal (SDG) 3.4, which aims to reduce premature mortality from noncommunicable diseases by one-third. Type 2 diabetes is the primary driver of the projected mortality burden, although increases in type 1 diabetes-related deaths are also forecasted. Forecasting models consistently predict an upward trend, especially in low- and middle-income countries and among younger adult populations. Specifically, global annual diabetes deaths are forecasted to increase by more than 10% by 2030, reaching approximately 1.63 million deaths (95% Prediction Interval: 1.48–1.91 million). Type 2 diabetes mortality is expected to rise by greater than 30% globally compared to 2019, with some models forecasting an addition of nearly 2 million deaths per year by 2030. Meanwhile, type 1 diabetes mortality may increase by more than 15%, with forecasts indicating an additional 90,000 to 93,000 deaths annually by 2030. The ensemble n-sub-epidemic models (NSE-UW and NSE-W) better captured complex epidemic trajectories by combining multiple model signals. Adults aged 15–49 and 50–69 are projected to experience the most significant increases in diabetes-related mortality, which raises serious concerns for public health systems targeting premature mortality. From an economic and geographic perspective, lower-middle-income countries (LMICs) face the steepest increases, with diabetes mortality projected to rise between 10.4% and 36.3% by 2030. Southeast Asia and the Eastern Mediterranean region show the highest projected increases in diabetes mortality, followed by Sub-Saharan Africa and Oceania. In contrast, high-income countries show smaller increases (~11.6%) than low-income countries (~18.6%), which likely reflect differences in healthcare access, diagnosis, and disease management.

4. Discussion

Researchers have utilized various forecasting models, including ARIMA, GAM, and machine learning-based approaches, to predict trends in diabetes-related mortality [8,12]. However, to our knowledge, this study is the first to integrate multiple forecasting models, including the n-sub-epidemic (NSE) model, providing a comprehensive comparative analysis of different methodologies. This multimodel approach enhances our understanding of diabetes mortality trajectories by capturing diverse trend patterns and model uncertainties.
Among the models tested, ARIMA produced the widest 95% prediction intervals (PI), suggesting higher forecast variability. At the same time, GLM generated the narrowest PIs, indicating more stable but potentially less flexible predictions. The NSE models provided balanced performance, effectively capturing both short-term fluctuations and long-term mortality trends.
Our projections indicate that by 2030, annual global deaths from diabetes will rise to 1.63 million (95% PI: 1.48–1.91 million), representing a 10% increase compared to 2019. This surge is predominantly driven by type 2 diabetes and mortality among individuals aged 50 and older. Particularly concerning is the projected 5% rise in diabetes-related deaths among young adults (15–49 years), which aligns with emerging evidence about high diabetes burden within this demographic [29,30,31]. Research has shown that younger patients with type 2 diabetes experience higher mortality risks compared to older patients, with one study reporting 100–200% increased mortality among patients under 55 years compared to only 30–40% excess risk in those aged 65–74 years [32]. Adolescents with type 2 diabetes have 1.5 times higher short-term mortality than those with type 1 [33]. CDC projections suggest that the number of type 2 diabetes cases among adolescents may rise as much as 700% by the year 2060, even if the incidence remains stable [34], which shows diabetes burden is shifting toward younger populations. This trend poses significant public health and economic challenges, reinforcing concerns that the SDG 3.4 target of reducing premature deaths from noncommunicable diseases including diabetes by one-third will not be met by 2030 [10].
The increasing global burden of diabetes is well documented, with incidence and prevalence rising steadily since 1990 [2,7,35]. Projections suggest that by 2030, the number of people living with diabetes could increase by 25–51% [7,35,36]. A previous ARIMA-based study forecasting diabetes mortality through 2025 estimated that diabetes-related deaths would reach 1.59 million, closely aligning with our findings [2]. These increases are primarily attributed to type 2 diabetes, with metabolic and behavioral risk factors, including obesity, poor diet, smoking, and sedentary lifestyles, as the major contributors.
Disparities in diabetes burden across WHO regions reflect complex interaction between socioeconomic factors, healthcare access, and epidemiological transitions [37]. The greatest concern lies within the Southeast Asia region (SEAR) and the Eastern Mediterranean region (EMR). They expect the highest projected diabetes mortality, followed by Oceania and Sub-Saharan Africa. This aligns with the 2050 projection that North Africa and the Middle East will surpass all other super-regions with diabetes prevalence at 16.8% [3]. The Western Pacific region (WPR) is suffering from an unprecedented increase in diabetes burden due to urban migration and lifestyle alterations [38]. The European region (EUR) does not face the same level of challenge. However, it still suffers from the rising burden of diabetes. The African region (AFR) continues to show a low prevalence of diabetes, but the healthcare systems limitations continue to pose a challenge [39]. The region of the Americas (AMR) displays high-income North America and Latine heterogeneities [40]. In the United States, diabetes prevalence is expected to rise by 54% by 2030, leading to a 38% increase in annual deaths and a 53% escalation in related healthcare costs [11]. Such disparities highlight the urgent need for tailored strategies to strengthen diabetes prevention and care while managing healthcare infrastructure, particularly in areas where the burden is rising rapidly but resources are severely constrained [41].
Similarly, the impact of diabetes differs significantly within various World Bank income regions. Our most worrying projection is for lower-middle-income countries (LMICs), which suggest a 10.4% to 36.3% increase in diabetes mortality by 2030 compared to 2019. This aligns with studies that indicate yearly increase in age-standardized death rates of 1.3% from type 2 diabetes in LMICs [42]. Overall socioeconomic development and diabetes mortality rates show an inverse U-shaped relationship, which indicates middle-income regions are disproportionately burdened [2]. Interestingly, when compared to low-income regions, high-income countries tend to have a higher prevalence of diabetes, but with significantly better disease management outcomes [43]. Our findings align with this, which shows an average percentage of change in mortality between 2019 and 2030 across all models in high-income countries that is lower than low-income countries (11.6% vs. 18.6%). This highlights the gap in undiagnosed cases, and capacities of countries, especially LICs or LMICs, for testing, diagnosing, and treating of diabetes [44,45]. These gaps represent a significant mortality burden with diabetes accounting for 3.4 million deaths in the year 2024 alone, which breaks down to about one death every nine seconds [46]. This suggests need for a global response to enhance prevention and management strategies [47].

4.1. Implications for Public Health and Healthcare Systems

These projections highlight an urgent need for strengthened global diabetes prevention and treatment initiatives. Health policies should focus on expanding diabetes screening programs in LMICs and target prevention programs at younger age groups (15–49), given rising mortality in this cohort. If current trends continue, diabetes-related mortality will not only rise but will place an increasing burden on healthcare systems, economies, and society. According to the International Diabetes Federation, the number of type 2 diabetes cases alone could reach 552 million by 2030. This surge will exacerbate existing challenges, including increased healthcare expenditures, reduced workforce productivity, and higher demands on medical infrastructure. The financial implications of this epidemic are staggering. In the United States, total annual medical and societal costs related to diabetes are projected to exceed 622 billion USD by 2030 [11]. Beyond direct healthcare costs, diabetes is a leading risk factor for cardiovascular diseases, further increasing mortality and healthcare expenditures.

4.2. Limitations

This forecasting analysis has limitations. First, the models used rely on the availability and precision of historical data, which may not accurately represent future scenarios. Any significant shifts in major health policies may impact these forecasts. Second, every forecasting model has some limitations. ARIMA assumes linear relationships and stationarity, which work well for forecasting diabetes mortality in the short term, but they could struggle to capture nonlinear progression patterns within the disease and structural shifts resulting from novel treatments or policy changes. GAMs can model nonlinear relationships, but they can fail to capture complex temporal dependencies in mortality trends, especially with gaps in longitudinal data. While adept with capturing seasonal patterns of diabetes deaths, Prophet’s decomposition approach is poor at handling changes in mortality when driven by new interventions. Though n-sub-epidemic models are theoretically appealing for capturing distinct epidemic waves, they may overfit minor fluctuations in the data, particularly when noise levels are high. However, model selection based on the corrected Akaike information criterion (AICc) helps mitigate this risk by favoring models with lower complexity (e.g., fewer sub-epidemics) rather than higher complexity (e.g., more sub-epidemics). Third, the reliance on historical data up to 2019 does not include the healthcare disruptions caused by the COVID-19 pandemic, including but not limited to delayed diagnoses and interrupted diabetes care. However, these disruptions may have increased diabetes-related mortality [48]. Fourth, there is a possibility of inaccuracies in GBD’s estimates of diabetes mortality, especially in lower-middle-income countries, due to incomplete vital registration systems with significant unrecorded deaths, systematic misclassification of diabetes as a cause of death, underdiagnosed cases due to insufficient diagnostic capacity, overreliance on statistical models, extrapolations in the absence of primary data, and difficulty in attributing mortality in cases with multiple causes [49,50,51]. Five, the progress toward SDG 3.4 was measured using the percentage change in diabetes-related deaths, which does not account for changes in population size or age structure.

5. Conclusions

The projected rise in diabetes mortality presents a critical challenge for public health systems worldwide. Achieving progress toward SDG 3.4, which aims to reduce mortality from diabetes, will require a multifaceted approach, including enhanced preventive strategies, early diagnosis, and improved disease management. Forecasting models, such as those employed in this study, are crucial in guiding policy decisions by providing data-driven insights into future mortality trends. By integrating predictive analytics into public health planning, policymakers and healthcare providers can implement targeted interventions to curb diabetes-related deaths, reduce healthcare burdens, and improve long-term health outcomes.

Supplementary Materials

The following supporting information can be downloaded at: https://www.mdpi.com/article/10.3390/jcm14103364/s1. References [52,53,54,55,56,57,58,59,60,61,62,63,64,65,66,67,68,69,70,71,72,73] are cited in Supplementary Materials.

Author Contributions

K.W.: design, analysis, interpretation, drafting, and editing. A.K.: review, and editing. G.C.: conception, interpretation, review, and editing. All authors have read and agreed to the published version of the manuscript.

Funding

The authors received no funding for this research. They conducted it out of independent academic or professional interest.

Institutional Review Board Statement

This study used secondary, aggregated, and de-identified data. As such, it was determined to be exempt from the Institutional Review Board (IRB) review, in accordance with Georgia State University guidelines and federal regulations.

Informed Consent Statement

Informed consent was not required for this study, as the data were secondary, aggregated, and fully de-identified, with no identifying information on individuals.

Data Availability Statement

The original data presented in the study are publicly available diabetes mortality data from Our World in Data (OWID) through https://ourworldindata.org/data (accessed on 10 April 2025). The original data source is the Institute for Health Metrics and Evaluation, Global Burden of Disease (GBD) 2019.

Acknowledgments

The authors would like to thank Amanda Bleichrodt, Georgia State University, for her valuable support in debugging code and sharing her expertise in R, which greatly contributed to the success of this research.

Conflicts of Interest

The authors declare no conflicts of interest regarding this research. We confirm that no financial or personal relationships influenced the research findings.

References

  1. Saeedi, P.; Petersohn, I.; Salpea, P.; Malanda, B.; Karuranga, S.; Unwin, N.; Colagiuri, S.; Guariguata, L.; Motala, A.A.; Ogurtsova, K.; et al. Global and regional diabetes prevalence estimates for 2019 and projections for 2030 and 2045: Results from the International Diabetes Federation Diabetes Atlas, 9th edition. Diabetes Res. Clin. Pract. 2019, 157, 107843. [Google Scholar] [CrossRef] [PubMed]
  2. Lin, X.; Xu, Y.; Pan, X.; Xu, J.; Ding, Y.; Sun, X.; Song, X.; Ren, Y.; Shan, P.-F. Global, regional, and national burden and trend of diabetes in 195 countries and territories: An analysis from 1990 to 2025. Sci. Rep. 2020, 10, 14790. [Google Scholar] [CrossRef] [PubMed]
  3. Ong, K.L.; Stafford, L.K.; McLaughlin, S.A.; Boyko, E.J.; Vollset, S.E.; Smith, A.E.; Dalton, B.E.; Duprey, J.; Cruz, J.A.; Hagins, H.; et al. Global, regional, and national burden of diabetes from 1990 to 2021, with projections of prevalence to 2050: A systematic analysis for the Global Burden of Disease Study 2021. Lancet 2023, 402, 203–234. [Google Scholar] [CrossRef] [PubMed]
  4. Whiting, D.R.; Guariguata, L.; Weil, C.; Shaw, J. IDF diabetes atlas: Global estimates of the prevalence of diabetes for 2011 and 2030. Diabetes Res. Clin. Pract. 2011, 94, 311–321. [Google Scholar] [CrossRef]
  5. Khan, M.A.B.; Hashim, M.J.; King, J.K.; Govender, R.D.; Mustafa, H.; Al Kaabi, J. Epidemiology of Type 2 Diabetes—Global Burden of Disease and Forecasted Trends. J. Epidemiol. Glob. Health 2020, 10, 107–111. [Google Scholar] [CrossRef]
  6. Harding, J.L.; Pavkov, M.E.; Magliano, D.J.; Shaw, J.E.; Gregg, E.W. Global trends in diabetes complications: A review of current evidence. Diabetologia 2019, 62, 3–16. [Google Scholar] [CrossRef]
  7. Cho, N.H.; Shaw, J.E.; Karuranga, S.; Huang, Y.; Fernandes JDda, R.; Ohlrogge, A.W.; Malanda, B. IDF Diabetes Atlas: Global estimates of diabetes prevalence for 2017 and projections for 2045. Diabetes Res. Clin. Pract. 2018, 138, 271–281. [Google Scholar] [CrossRef]
  8. Sun, J.; Hu, W.; Ye, S.; Deng, D.; Chen, M. The Description and Prediction of Incidence, Prevalence, Mortality, Disability-Adjusted Life Years Cases, and Corresponding Age-Standardized Rates for Global Diabetes. J. Epidemiol. Glob. Health 2023, 13, 566–576. [Google Scholar] [CrossRef]
  9. Rathmann, W.; Giani, G. Global Prevalence of Diabetes: Estimates for the Year 2000 and Projections for 2030: Response to Wild et al. Diabetes Care 2004, 27, 2568–2569. [Google Scholar] [CrossRef]
  10. Watkins, D.A.; Msemburi, W.T.; Pickersgill, S.J.; Kawakatsu, Y.; Gheorghe, A.; Dain, K.; Johansson, K.A.; Said, S.; Renshaw, N.; Tolla, M.T.; et al. NCD Countdown 2030: Efficient pathways and strategic investments to accelerate progress towards the Sustainable Development Goal target 3.4 in low-income and middle-income countries. Lancet 2022, 399, 1266–1278. [Google Scholar] [CrossRef]
  11. Rowley, W.R.; Bezold, C.; Arikan, Y.; Byrne, E.; Krohe, S. Diabetes 2030: Insights from Yesterday, Today, and Future Trends. Popul. Health Manag. 2017, 20, 6–12. [Google Scholar] [CrossRef] [PubMed]
  12. Zhu, D.; Zhou, D.; Li, N.; Han, B. Predicting Diabetes and Estimating Its Economic Burden in China Using Autoregressive Integrated Moving Average Model. Int. J. Public Health 2022, 66, 1604449. [Google Scholar] [CrossRef] [PubMed]
  13. Goal 3 | Department of Economic and Social Affairs. 2024. Available online: https://sdgs.un.org/goals/goal3#targets_and_indicators (accessed on 15 April 2024).
  14. SDG Target 3.4 | Noncommunicable Diseases and Mental Health: By 2030, Reduce by One Third Premature Mortality from Non-Communicable Diseases Through Prevention and Treatment and Promote Mental Health and Well-Being. 2024. Available online: https://www.who.int/data/gho/data/themes/topics/indicator-groups/indicator-group-details/GHO/sdg-target-3.4-noncommunicable-diseases-and-mental-health (accessed on 15 April 2024).
  15. United Nations General Assembly. Resolution Adopted by the General Assembly on 6 July 2017—Work of the Statistical Commission pertaining to the 2030 Agenda for Sustainable Development; No. A/RES/71/313; Seventy-First Session; United Nations General Assembly: New York, NY, USA, 2017; Available online: https://docs.un.org/en/A/RES/71/313 (accessed on 15 April 2024).
  16. Global Burden of Disease Collaborative Network. Global Burden of Disease Study 2019 (GBD 2019); Institute for Health Metrics and Evaluation (IHME): Seattle, WA, USA, 2019; Available online: https://vizhub.healthdata.org/gbd-results/ (accessed on 15 March 2024).
  17. Bleichrodt, A.; Luo, R.; Kirpich, A.; Chowell, G.; Phan, A. A 2024 ARIMA, GAM, GLM, Prophet Forecasting Toolbox–BETA; GitHub: San Francisco, CA, USA, 2024; Available online: https://github.com/bleicham/ARIMA-GLM-GAM-Prophet-Beta (accessed on 25 February 2025).
  18. Box, G.E.P.; Jenkins, G.M.; Reinsel, G.C.; Ljung, G.M. Time Series Analysis: Forecasting and Control, 5th ed.; John Wiley & Sons, Ltd.: Hoboken, NJ, USA, 2015; Available online: https://www.wiley.com/en-us/Time+Series+Analysis%3A+Forecasting+and+Control%2C+5th+Edition-p-9781118675021 (accessed on 25 February 2025).
  19. Hyndman, R.J.; Athanasopoulos, G. Forecasting: Principles and Practice, 3rd ed.; Otexts: Carlton South, Australia, 2021. [Google Scholar]
  20. Wood, S.N. Generalized Additive Models: An Introduction with R, 2nd ed.; Chapman and Hall/CRC: Boca Raton, FL, USA, 2017. [Google Scholar] [CrossRef]
  21. Simpson, G.L. Modelling Palaeoecological Time Series Using Generalised Additive Models. Front. Ecol. Evol. 2018, 6, 149. [Google Scholar] [CrossRef]
  22. Agresti, A. Foundations of Linear and Generalized Linear Models, 1st ed.; Wiley: Hoboken, NJ, USA, 2015. [Google Scholar]
  23. Taylor, S.J.; Letham, B. Forecasting at Scale. Am. Stat. 2018, 72, 37–45. [Google Scholar] [CrossRef]
  24. Facebook Open Source. Prophet: Forecasting at Scale. 2023. Available online: http://facebook.github.io/prophet/ (accessed on 15 April 2024).
  25. Chowell, G.; Luo, R.; Sun, K.; Roosa, K.; Tariq, A.; Viboud, C. Real-time forecasting of epidemic trajectories using computational dynamic ensembles. Epidemics 2020, 30, 100379. [Google Scholar] [CrossRef]
  26. Chowell, G.; Hyman, J.M. (Eds.) Mathematical and Statistical Modeling for Emerging and Re-Emerging Infectious Diseases; Springer: Berlin/Heidelberg, Germany, 2016. [Google Scholar]
  27. Chowell, G.; Dahal, S.; Tariq, A.; Roosa, K.; Hyman, J.M.; Luo, R. An ensemble n-sub-epidemic modeling framework for short-term forecasting epidemic trajectories: Application to the COVID-19 pandemic in the USA. PLoS Comput. Biol. 2022, 18, e1010602. [Google Scholar] [CrossRef]
  28. Bleichrodt, A.; Luo, R.; Kirpich, A.; Chowell, G. Retrospective evaluation of short-term forecast performance of ensemble sub-epidemic frameworks and other time-series models: The 2022–2023 mpox outbreak across multiple geographical scales, July 14th, 2022, through February 26th, 2023. medRxiv 2023. [Google Scholar] [CrossRef]
  29. Endocrinology, T.L.D. Alarming rise in young-onset type 2 diabetes. Lancet Diabetes Endocrinol. 2024, 12, 433. [Google Scholar] [CrossRef]
  30. Xie, J.; Wang, M.; Long, Z.; Ning, H.; Li, J.; Cao, Y.; Liao, Y.; Liu, G.; Wang, F.; Pan, A. Global burden of type 2 diabetes in adolescents and young adults, 1990–2019: Systematic analysis of the Global Burden of Disease Study 2019. BMJ 2022, 379, e072385. [Google Scholar] [CrossRef]
  31. Zhou, Y.; Chen, Y.; Tang, Y.; Zhang, S.; Zhuang, Z.; Ni, Q. Rising tide: The growing global burden and inequalities of early-onset type 2 diabetes among youths aged 15–34 years (1990–2021). Diabetol. Metab. Syndr. 2025, 17, 103. [Google Scholar] [CrossRef]
  32. Salehidoost, R.; Mansouri, A.; Amini, M.; Yamini, S.A.; Aminorroaya, A. Diabetes and all-cause mortality, a 18-year follow-up study. Sci. Rep. 2020, 10, 3183. [Google Scholar] [CrossRef] [PubMed]
  33. Perng, W.; Conway, R.; Mayer-Davis, E.; Dabelea, D. Youth-Onset Type 2 Diabetes: The Epidemiology of an Awakening Epidemic. Diabetes Care 2023, 46, 490–499. [Google Scholar] [CrossRef] [PubMed]
  34. CDC Newsroom. CDC. Future Surge in Diabetes Could Dramatically Impact People Under 20 in U.S. 1 January 2016. Available online: https://archive.cdc.gov/www_cdc_gov/media/releases/2022/p1229-future-diabetes-surge.html (accessed on 15 April 2024).
  35. Saeedi, P.; Salpea, P.; Karuranga, S.; Petersohn, I.; Malanda, B.; Gregg, E.W.; Unwin, N.; Wild, S.H.; Williams, R. Mortality attributable to diabetes in 20–79 years old adults, 2019 estimates: Results from the International Diabetes Federation Diabetes Atlas, 9th edition. Diabetes Res. Clin. Pract. 2020, 162, 108086. [Google Scholar] [CrossRef] [PubMed]
  36. Wild, S.; Roglic, G.; Green, A.; Sicree, R.; King, H. Global prevalence of diabetes: Estimates for the year 2000 and projections for 2030. Diabetes Care 2004, 27, 1047–1053. [Google Scholar] [CrossRef]
  37. Hill-Briggs, F.; Adler, N.E.; Berkowitz, S.A.; Chin, M.H.; Gary-Webb, T.L.; Navas-Acien, A.; Thornton, P.L.; Haire-Joshu, D. Social Determinants of Health and Diabetes: A Scientific Review. Diabetes Care 2021, 44, 258–279. [Google Scholar] [CrossRef]
  38. Cho, N.H. Diabetes burden and prevention in Korea and the Western Pacific Region. Diabetes Res. Clin. Pract. 2014, 106 (Suppl. S2), S282–S287. [Google Scholar] [CrossRef]
  39. Ye, J.; Wu, Y.; Yang, S.; Zhu, D.; Chen, F.; Chen, J.; Ji, X.; Hou, K. The global, regional and national burden of type 2 diabetes mellitus in the past, present and future: A systematic analysis of the Global Burden of Disease Study 2019. Front. Endocrinol. 2023, 14, 1192629. [Google Scholar] [CrossRef]
  40. Bernabe-Ortiz, A.; Carrillo-Larco, R.M. The burden of diabetes in the Americas. Lancet Diabetes Endocrinol. 2022, 10, 613–614. [Google Scholar] [CrossRef]
  41. Redmond, M.L.; Bimali, M.; Ablah, E.; Mayes, P.; Dugan, K. A Geo-Stratified Analysis of Associations Between Socio-Economic Factors and Diabetes Risk. Kans. J. Med. 2022, 15, 175–183. [Google Scholar] [CrossRef]
  42. Liu, J.; Bai, R.; Chai, Z.; Cooper, M.E.; Zimmet, P.Z.; Zhang, L. Low- and middle-income countries demonstrate rapid growth of type 2 diabetes: An analysis based on Global Burden of Disease 1990–2019 data. Diabetologia 2022, 65, 1339–1352. [Google Scholar] [CrossRef]
  43. Dagenais, G.R.; Gerstein, H.C.; Zhang, X.; McQueen, M.; Lear, S.; Lopez-Jaramillo, P.; Mohan, V.; Mony, P.; Gupta, R.; Kutty, V.R.; et al. Variations in Diabetes Prevalence in Low-, Middle-, and High-Income Countries: Results From the Prospective Urban and Rural Epidemiological Study. Diabetes Care 2016, 39, 780–787. [Google Scholar] [CrossRef] [PubMed]
  44. Flood, D.; Seiglie, J.A.; Dunn, M.; Tschida, S.; Theilmann, M.; Marcus, M.E.; Brian, G.; Norov, B.; Mayige, M.T.; Singh Gurung, M.; et al. The state of diabetes treatment coverage in 55 low-income and middle-income countries: A cross-sectional study of nationally representative, individual-level data in 680 102 adults. Lancet Healthy Longev. 2021, 2, e340–e351. [Google Scholar] [CrossRef] [PubMed]
  45. Ogurtsova, K.; Guariguata, L.; Barengo, N.C.; Ruiz, P.L.-D.; Sacre, J.W.; Karuranga, S.; Sun, H.; Boyko, E.J.; Magliano, D.J. IDF diabetes Atlas: Global estimates of undiagnosed diabetes in adults for 2021. Diabetes Res. Clin. Pract. 2022, 183, 109118. [Google Scholar] [CrossRef] [PubMed]
  46. IDF. IDF Diabetes Atlas. 2024. Available online: https://diabetesatlas.org/ (accessed on 4 April 2025).
  47. Paciorek, C.J.; Singleton, R.K.; Pires, A.B.; Stevens, G.A.; Danaei, G.; Lhoste, V.P.; Phelps, N.H.; Heap, R.A.; Jain, L.; Brisis, Y.D.D.; et al. Worldwide trends in diabetes prevalence and treatment from 1990 to 2022: A pooled analysis of 1108 population-representative studies with 141 million participants. Lancet 2024, 404, 2077–2093. [Google Scholar] [CrossRef]
  48. Lv, F.; Gao, X.; Huang, A.H.; Zu, J.; He, X.; Sun, X.; Liu, J.; Gao, N.; Jiao, Y.; Keane, M.G.; et al. Excess diabetes mellitus-related deaths during the COVID-19 pandemic in the United States. eClinicalMedicine 2022, 54, 101671. [Google Scholar] [CrossRef]
  49. Roth, G.A.; Abate, D.; Abate, K.H.; Abay, S.M.; Abbafati, C.; Abbasi, N.; Abbastabar, H.; Abd-Allah, F.; Abdela, J.; Abdelalim, A.; et al. Global, regional, and national age-sex-specific mortality for 282 causes of death in 195 countries and territories, 1980–2017: A systematic analysis for the Global Burden of Disease Study 2017. Lancet 2018, 392, 1736–1788. [Google Scholar] [CrossRef]
  50. Vos, T.; Lim, S.S.; Abbafati, C.; Abbas, K.M.; Abbasi, M.; Abbasifard, M.; Abbasi-Kangevari, M.; Abbastabar, H.; Abd-Allah, F.; Abdelalim, A.; et al. Global burden of 369 diseases and injuries in 204 countries and territories, 1990–2019: A systematic analysis for the Global Burden of Disease Study 2019. Lancet 2020, 396, 1204–1222. [Google Scholar] [CrossRef]
  51. Cousin, E.; Duncan, B.B.; Stein, C.; Ong, K.L.; Vos, T.; Abbafati, C.; Abbasi-Kangevari, M.; Abdelmasseh, M.; Abdoli, A.; Abd-Rabu, R.; et al. Diabetes mortality and trends before 25 years of age: An analysis of the Global Burden of Disease Study 2019. Lancet Diabetes Endocrinol. 2022, 10, 177–192. [Google Scholar] [CrossRef]
  52. Mondal, P.; Shit, L.; Goswami, S. Study of Effectiveness of Time Series Modeling (Arima) in Forecasting Stock Prices. Int. J. Comput. Sci. Eng. Appl. 2014, 4, 13–29. [Google Scholar] [CrossRef]
  53. Dimri, T.; Ahmad, S.; Sharif, M. Time series analysis of climate variables using seasonal ARIMA approach. J. Earth Syst. Sci. 2020, 129, 149. [Google Scholar] [CrossRef]
  54. Tektas, M. Weather Forecasting Using ANFIS and ARIMA MODELS: Case study for İstanbul. Environ. Res. Eng. Manag. 2010, 51, 5–10, ISSN: 1392-1649. [Google Scholar]
  55. Satrio, C.B.A.; Darmawan, W.; Nadia, B.U.; Hanafiah, N. Time series analysis and forecasting of coronavirus disease in Indonesia using ARIMA model and PROPHET. Procedia Comput. Sci. 2021, 179, 524–532. [Google Scholar] [CrossRef]
  56. Bleichrodt, A.; Phan, A.; Luo, R.; Kirpich, A.; Chowell-Puente, G. StatModPredict: A User-Friendly R-Shiny Interface for Fitting and Forecasting with Statistical Models; SSRN Scholarly Paper No. 4849702; Social Science Research Network: Atlanta, GA, USA, 2014. [Google Scholar] [CrossRef]
  57. Long, B.; Tan, F.; Newman, M. Forecasting the Monkeypox Outbreak Using ARIMA, Prophet, NeuralProphet, and LSTM Models in the United States. Forecasting 2023, 5, 127–137. [Google Scholar] [CrossRef]
  58. A ARIMA modelling in, R. In Forecasting: Principles and Practice, 2nd ed.; OTexts: Melbourne, Australia, 2024; Available online: https://otexts.com/fpp2/arima-r.html (accessed on 10 April 2025).
  59. Auto.Arima Function—RDocumentation, Version 8.21.1; DataCamp Inc.: New York, NY, USA, 2024. Available online: https://www.rdocumentation.org/packages/forecast/versions/8.21.1/topics/auto.arima (accessed on 10 April 2025).
  60. Forecast Function—RDocumentation, Version 8.24.0; DataCamp Inc.: New York, NY, USA, 2024. Available online: https://www.rdocumentation.org/packages/forecast/versions/8.4/topics/forecast (accessed on 15 April 2024).
  61. Shafi, A. What is a Generalised Additive Model? Medium. 18 May 2021. Available online: https://towardsdatascience.com/generalised-additive-models-6dfbedf1350a (accessed on 15 April 2024).
  62. Wood, S.N.; Fasiolo, M. A Generalized Fellner-Schall Method for Smoothing Parameter Optimization with Application to Tweedie Location, Scale and Shape Models. Biometrics 2017, 73, 1071–1081. [Google Scholar] [CrossRef]
  63. Predict Function—RDocumentation, Version 3.6.2; DataCamp Inc.: New York, NY, USA, 2024. Available online: https://www.rdocumentation.org/packages/stats/versions/3.6.2/topics/predict (accessed on 15 April 2024).
  64. Ampofo, A.G.; Boateng, E.B. Beyond 2020: Modelling obesity and diabetes prevalence. Diabetes Res. Clin. Pract. 2020, 167, 108362. [Google Scholar] [CrossRef]
  65. Prophet Package—RDocumentation, version 1.0; DataCamp Inc.: New York, NY, USA, 2024; Available online: https://www.rdocumentation.org/packages/prophet/versions/1.0 (accessed on 15 April 2024).
  66. Chowell, G.; Dahal, S.; Bleichrodt, A.; Tariq, A.; Hyman, J.M.; Luo, R. SubEpiPredict: A tutorial-based primer and toolbox for fitting and forecasting growth trajectories using the ensemble n-sub-epidemic modeling framework. Infect. Dis. Model. 2024, 9, 411–436. [Google Scholar] [CrossRef]
  67. Chowell, G.; Hincapie-Palacio, D.; Ospina, J.; Pell, B.; Tariq, A.; Dahal, S.; Moghadas, S.; Smirnova, A.; Simonsen, L.; Viboud, C. Using Phenomenological Models to Characterize Transmissibility and Forecast Patterns and Final Burden of Zika Epidemics. PLoS Curr. 2016, 8. [Google Scholar] [CrossRef]
  68. Pell, B.; Kuang, Y.; Viboud, C.; Chowell, G. Using phenomenological models for forecasting the 2015 Ebola challenge. Epidemics 2018, 22, 62–70. [Google Scholar] [CrossRef]
  69. Roosa, K.; Lee, Y.; Luo, R.; Kirpich, A.; Rothenberg, R.; Hyman, J.M.; Yan, P.; Chowell, G. Real-time forecasts of the COVID-19 epidemic in China from February 5th to February 24th, 2020. Infect. Dis. Model. 2020, 5, 256–263. [Google Scholar] [CrossRef]
  70. Roosa, K.; Lee, Y.; Luo, R.; Kirpich, A.; Rothenberg, R.; Hyman, J.M.; Yan, P.; Chowell, G. Short-term Forecasts of the COVID-19 Epidemic in Guangdong and Zhejiang, China: February 13–23, 2020. J. Clin. Med. 2020, 9, 596. [Google Scholar] [CrossRef]
  71. Hurvich, C.M.; Tsai, C.-L. Regression and time series model selection in small samples. Biometrika 1989, 76, 297–307. [Google Scholar] [CrossRef]
  72. Sugiura, N. Further analysis of the data by Akaike’s information criterion and the finite corrections. Commun. Stat.-Theory Methods 1978, 7, 13–26. [Google Scholar] [CrossRef]
  73. Hastie, T.; Tibshirani, R.; Friedman, J. The Elements of Statistical Learning; Springer: New York, NY, USA, 2009. [Google Scholar] [CrossRef]
Figure 1. Percentage changes in the number of deaths from diabetes from 2019 to 2030 globally by age group, type of diabetes, WHO regions, and World Bank Income classification. The panel shows the relative percentage change from the last year of data used during the model calibration process (2019) to the forecasted median number of deaths from diabetes in 2030. The panel shows results from six different models—ARIMA, GAM, GLM, Prophet, n-sub-epidemic ensemble unweighted (NSE UW), and n-sub-epidemic ensemble weighted (NSE W). Purple tiles indicate forecasted decreases in mortality between 2019 and 2030, and red tiles indicate forecasted increases in mortality during same period. Darker colors indicate a greater percentage change in either direction (i.e., negative or positive). The values within each tile correspond to the relative percentage change in number of deaths from diabetes from 2019 to 2030.
Jcm 14 03364 g001
Table 1. Forecasted median number of deaths (in thousands except type 2) from diabetes in 2030 and associated 95% prediction interval by type of diabetes, age groups, WHO regions, and World Bank income classification.
CategoryARIMAGAMGLMProphetNSE (UW)NSE (W)
Type of diabetes
Type 188.3
(81.9, 94.7)
90.3
(86.0, 94.6)
82.9
(81.4, 84.5)
92.9
(85.6, 100.3)
86.5
(83.6, 89.2)
80.1
(76.9, 83.3)
Type 2 *1.9
(1.8, 2.1)
2.0
(1.9, 2.1)
1.7
(1.6, 1.7)
1.9
(1.8, 2.0)
1.5
(1.3, 1.6)
1.5
(1.3, 1.6)
Age Group
<52.23
(1.82, 2.64)
1.94
(1.53, 2.34)
2.28
(81.33, 84.46)
92.87
(85.6, 100.27)
2.36
(2.2, 2.52)
2.36
(2.2, 2.52)
5–142.42
(1.61, 3.23)
1.96
(1.48, 2.44)
2.55
(2.42, 2.68)
2.6
(2.11, 3.09)
2.46
(2.18, 2.8)
2.46
(2.18, 2.8)
15–49137.5
(121.7, 153.2)
134.5
(122.8, 146.1)
140.4
(137.3, 143.6)
139.6
(130.0, 149.1)
128.1
(124.7, 131.1)
128
(124.7, 131.0)
50–69761.6
(614.4, 908.8)
773.1
(714.5, 831.7)
657
(637.1, 676.9)
777.9
(750.5, 801.5)
646.8
(594, 705.8)
647.7
(593, 706.4)
70+1178.7
(995.7, 1361.8)
1188.4
(1127.9, 1249)
996.9
(981.2, 1012.6)
1120.7
(1067.5, 1177.3)
887.4
(821, 967.8)
886.5
(820.1, 963.8)
WHO Region
AFR209.2
(614.4, 908.8)
205.8
(714.5, 831.7)
205.6
(637.1, 676.9)
212.3
(750.5, 801.5)
186.9
(594, 705.8)
187
(593, 706.4)
AMR383.2
(347.7, 418.7)
423.9
(395.9, 451.9)
343.2
(336.4, 350)
398.2
(377, 422.9)
307.8
(286.9, 329.2)
308
(287.2, 329.3)
EMR174
(147, 201)
175.2
(164.8, 185.5)
149.9
(145.1, 154.7)
174.6
(167.9, 180.9)
151.5
(136.9, 165.3)
151.4
(136.9, 165.4)
EUR206.3
(191.7, 221)
208.8
(187.2, 230.4)
195
(190.7, 199.4)
224.3
(212.5, 236.7)
196.6
(185.7, 207.1)
196.4
(185.7, 207.1)
SEAR 646
(451.4, 840.7)
654.4
(586.7, 722.1)
568
(551.1, 584.9)
654.4
(630.2, 677.8)
530.6
(474.4, 582.4)
530.2
(474.2, 582.3)
WPR357.2
(316.7, 397.7)
394.7
(364.3, 425.2)
329.5
(322.7, 336.3)
378.7
(328.5, 436.6)
292.8
(267.4, 317.4)
292.6
(267, 317.1)
World Bank Income Classification
High-Income 299.7
(614.4, 908.8)
336.9
(714.5, 831.7)
265.7
(637.1, 676.9)
300.2
(750.5, 801.5)
245.7
(594, 705.8)
245.9
(593, 706.4)
Low-Income 127.5
(116.7, 138.2)
128.7
(125.4, 132)
107.9
(105.3, 110.4)
123.5
(119.5, 127.6)
99.2
(89.6, 109.7)
99.2
(89.7, 109.7)
Low-Middle 930.1
(721.3, 1139)
938.8
(860, 1017.5)
828.8
(806.2, 851.3)
941.6
(909.6, 973.8)
765.9
(690.9, 838.3)
766.6
(691.3, 838.2)
Upper-Middle 684.2
(528.8, 839.5)
768.2
(673.7, 862.7)
595
(583, 607)
682.6
(645.8, 722.2)
532.7
(480.2, 585.1)
533.7
(481.4, 584)
* in million; NSE (UW): n-sub-epidemic ensemble unweighted; NSE (W): n-sub-epidemic ensemble weighted; a 95% prediction interval provides a range that is expected to contain the value of a single future observation, with 95% probability, given the model and its assumptions; AFR: African region, AMR: region of the Americas, EMR: Eastern Mediterranean region, EUR: European region, SEAR: Southeast Asia region, WPR: Western Pacific region.
Disclaimer/Publisher’s Note: The statements, opinions and data contained in all publications are solely those of the individual author(s) and contributor(s) and not of MDPI and/or the editor(s). MDPI and/or the editor(s) disclaim responsibility for any injury to people or property resulting from any ideas, methods, instructions or products referred to in the content.

