Predictors of Significant High-Sensitivity C-Reactive Protein Reduction After Use of Rosuvastatin/Amlodipine and Atorvastatin/Amlodipine—Subgroup Analysis in Randomized Controlled Trials †
Abstract
1. Introduction
2. Materials and Methods
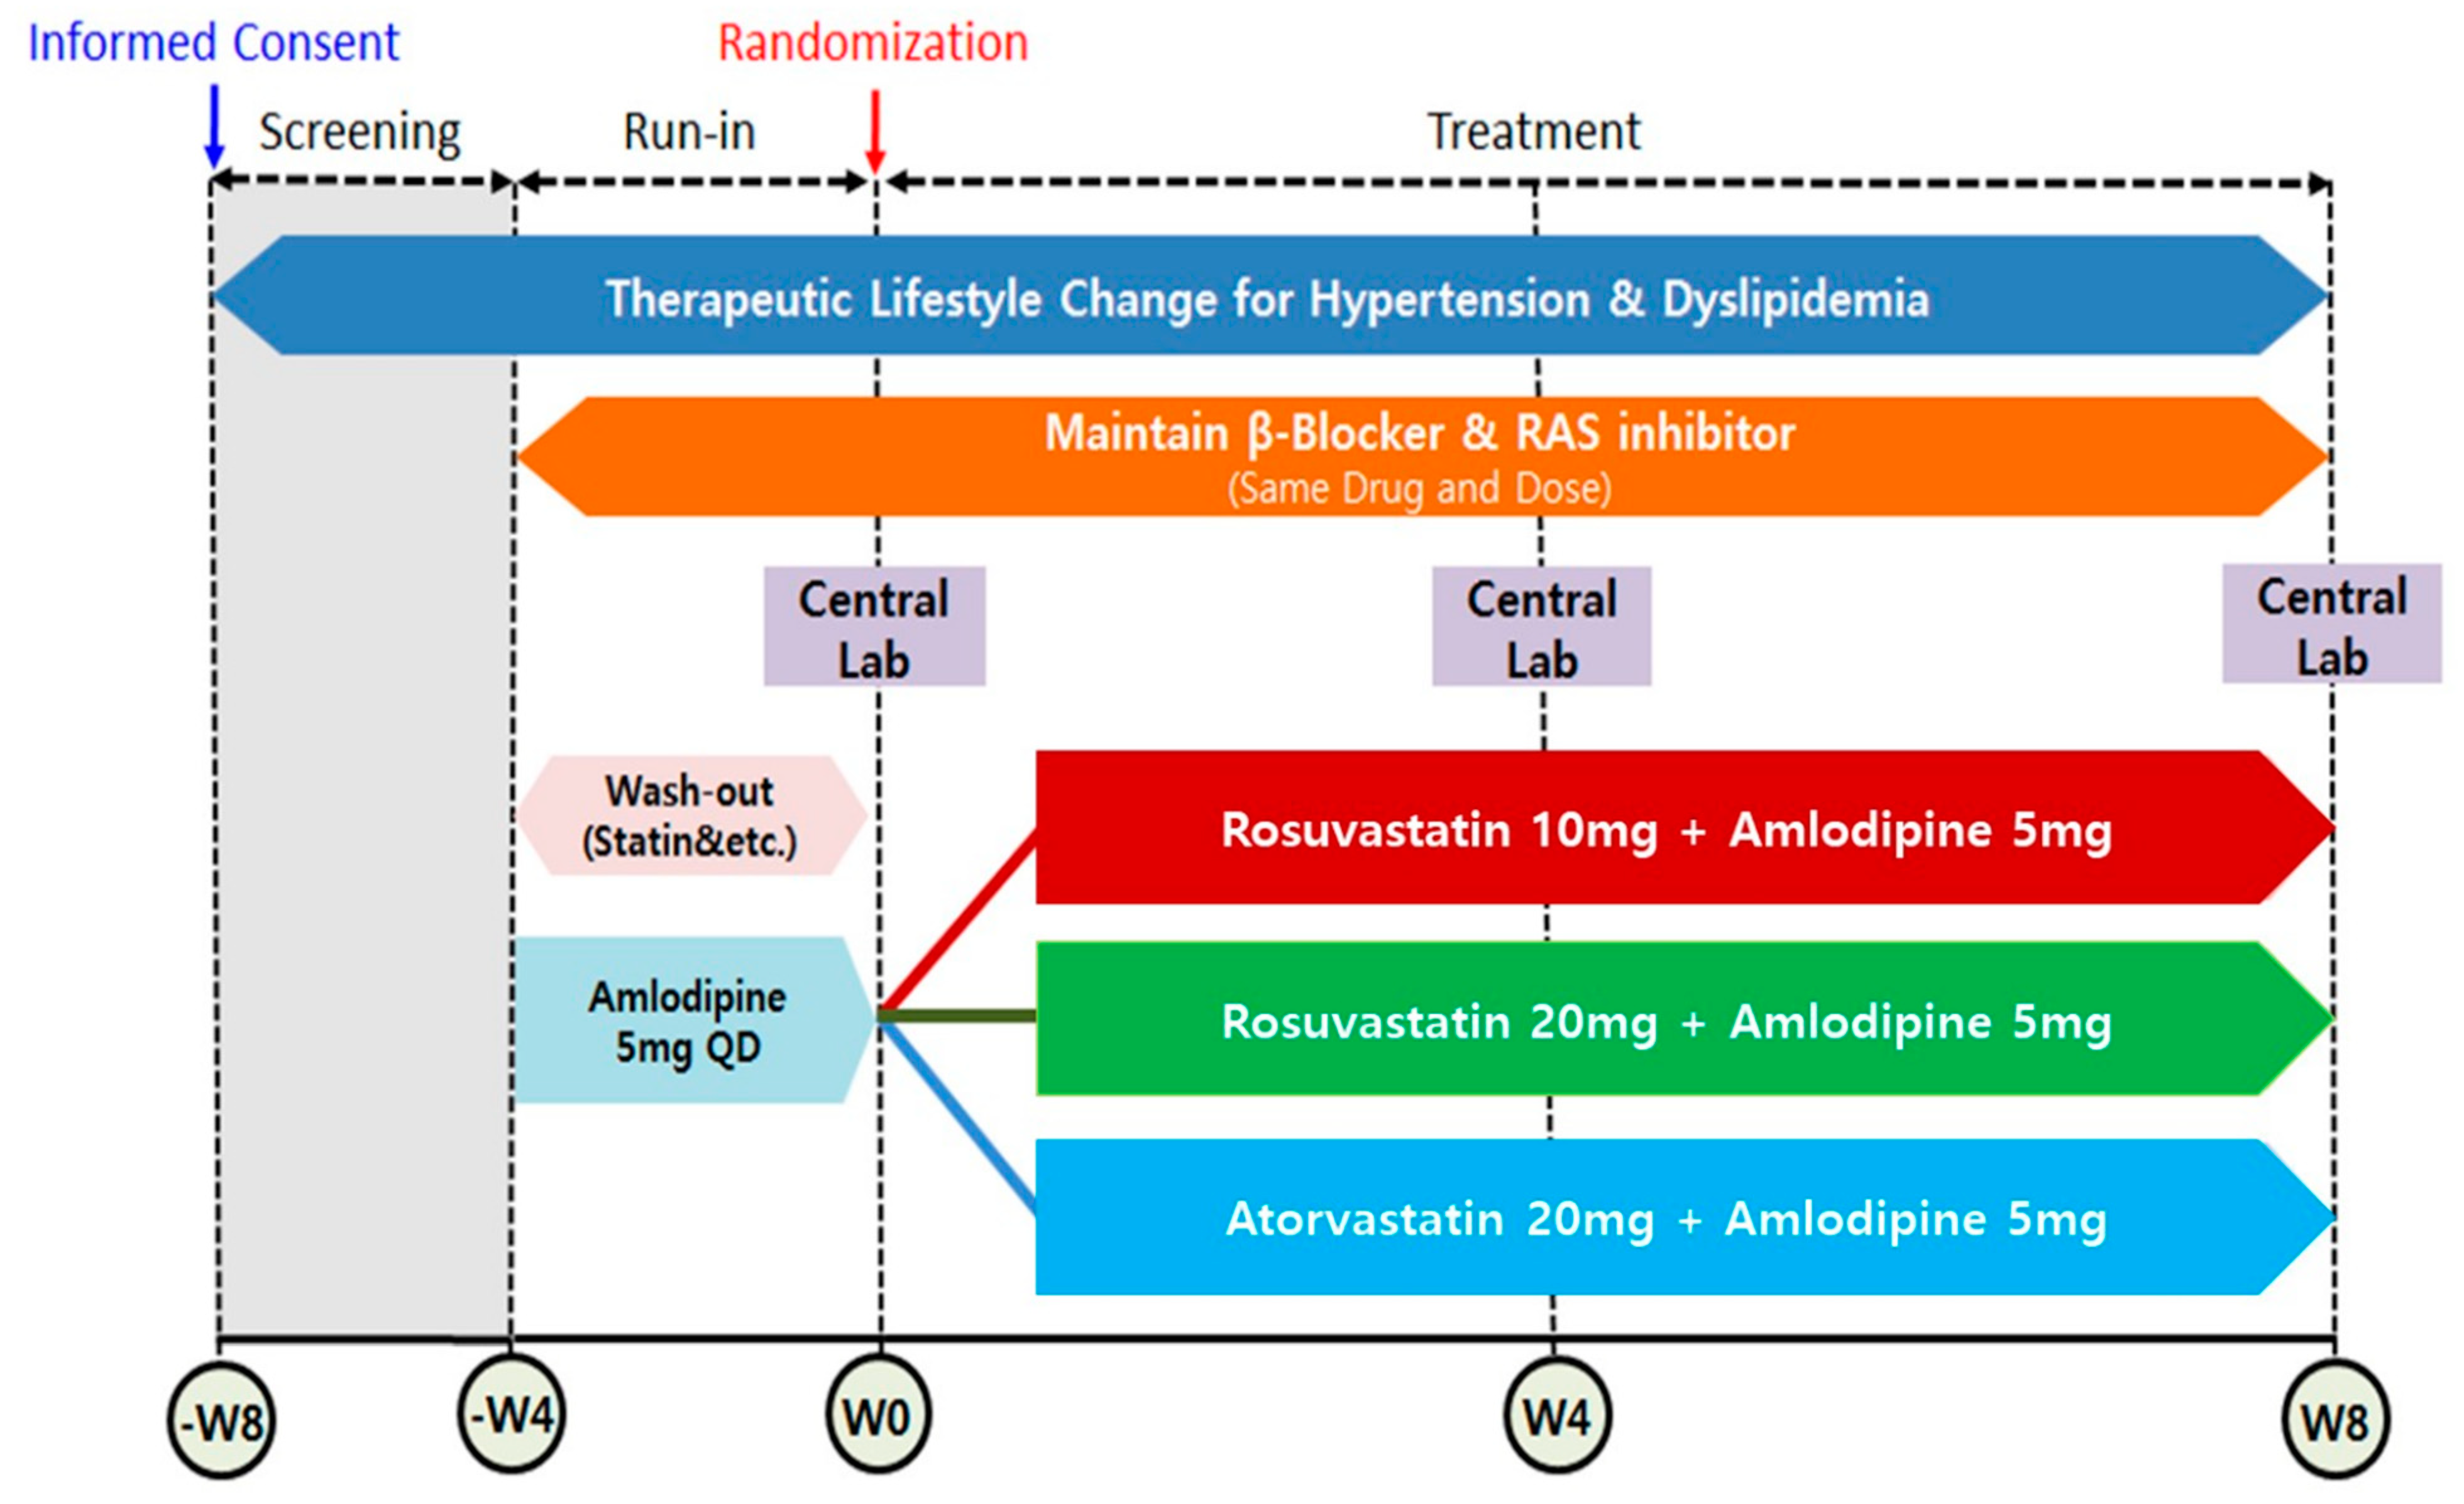
2.1. Study Design and Participants of Study
2.2. Study Population
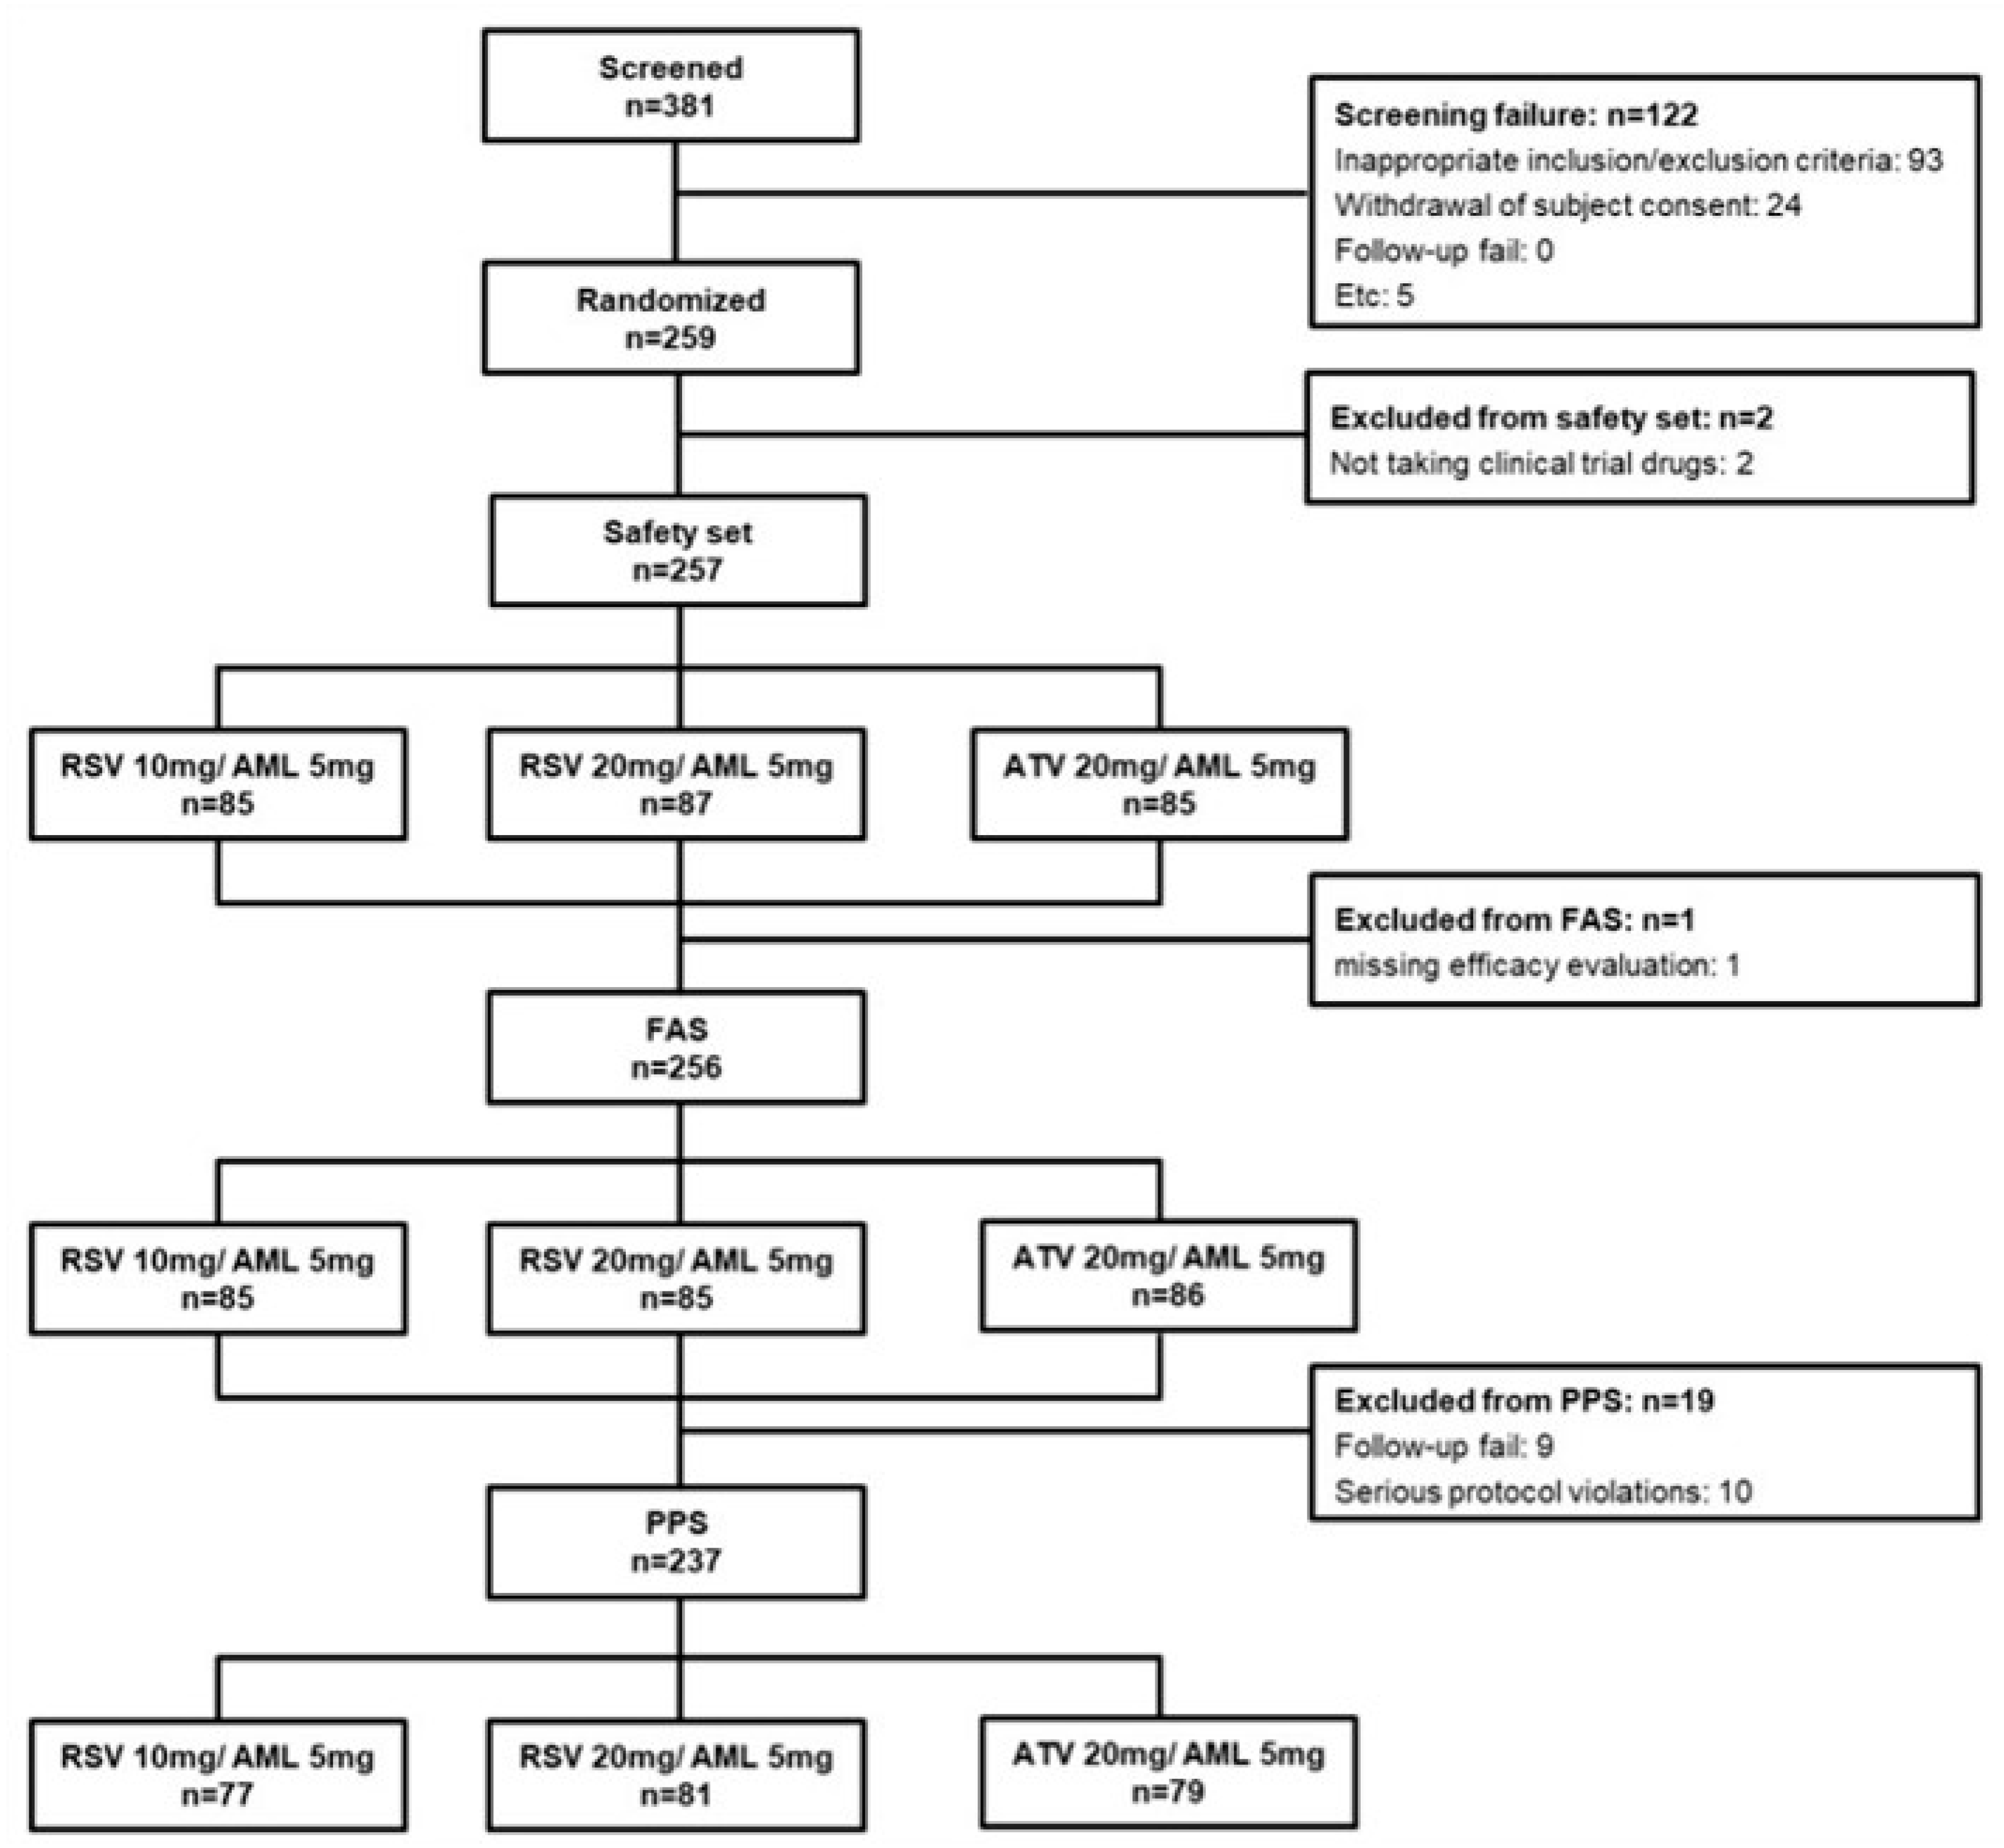
2.3. Calculation of Sample Size and Data Set Analyzed
2.4. Endpoint
2.5. Statistical Analysis
3. Results
3.1. Comparison Between hsCRP Responders and Non-Responders
3.2. Predictors of hsCRP Responders
3.3. Comparison Between Baseline hsCRP < 2 mg/dL and Baseline hsCRP ≥ 2 mg/dL
3.4. Comparison Between ATV 10 mg/AML 5 mg, RSV 10 mg/AML 5 mg, and RSV 20 mg/AML 5 mg
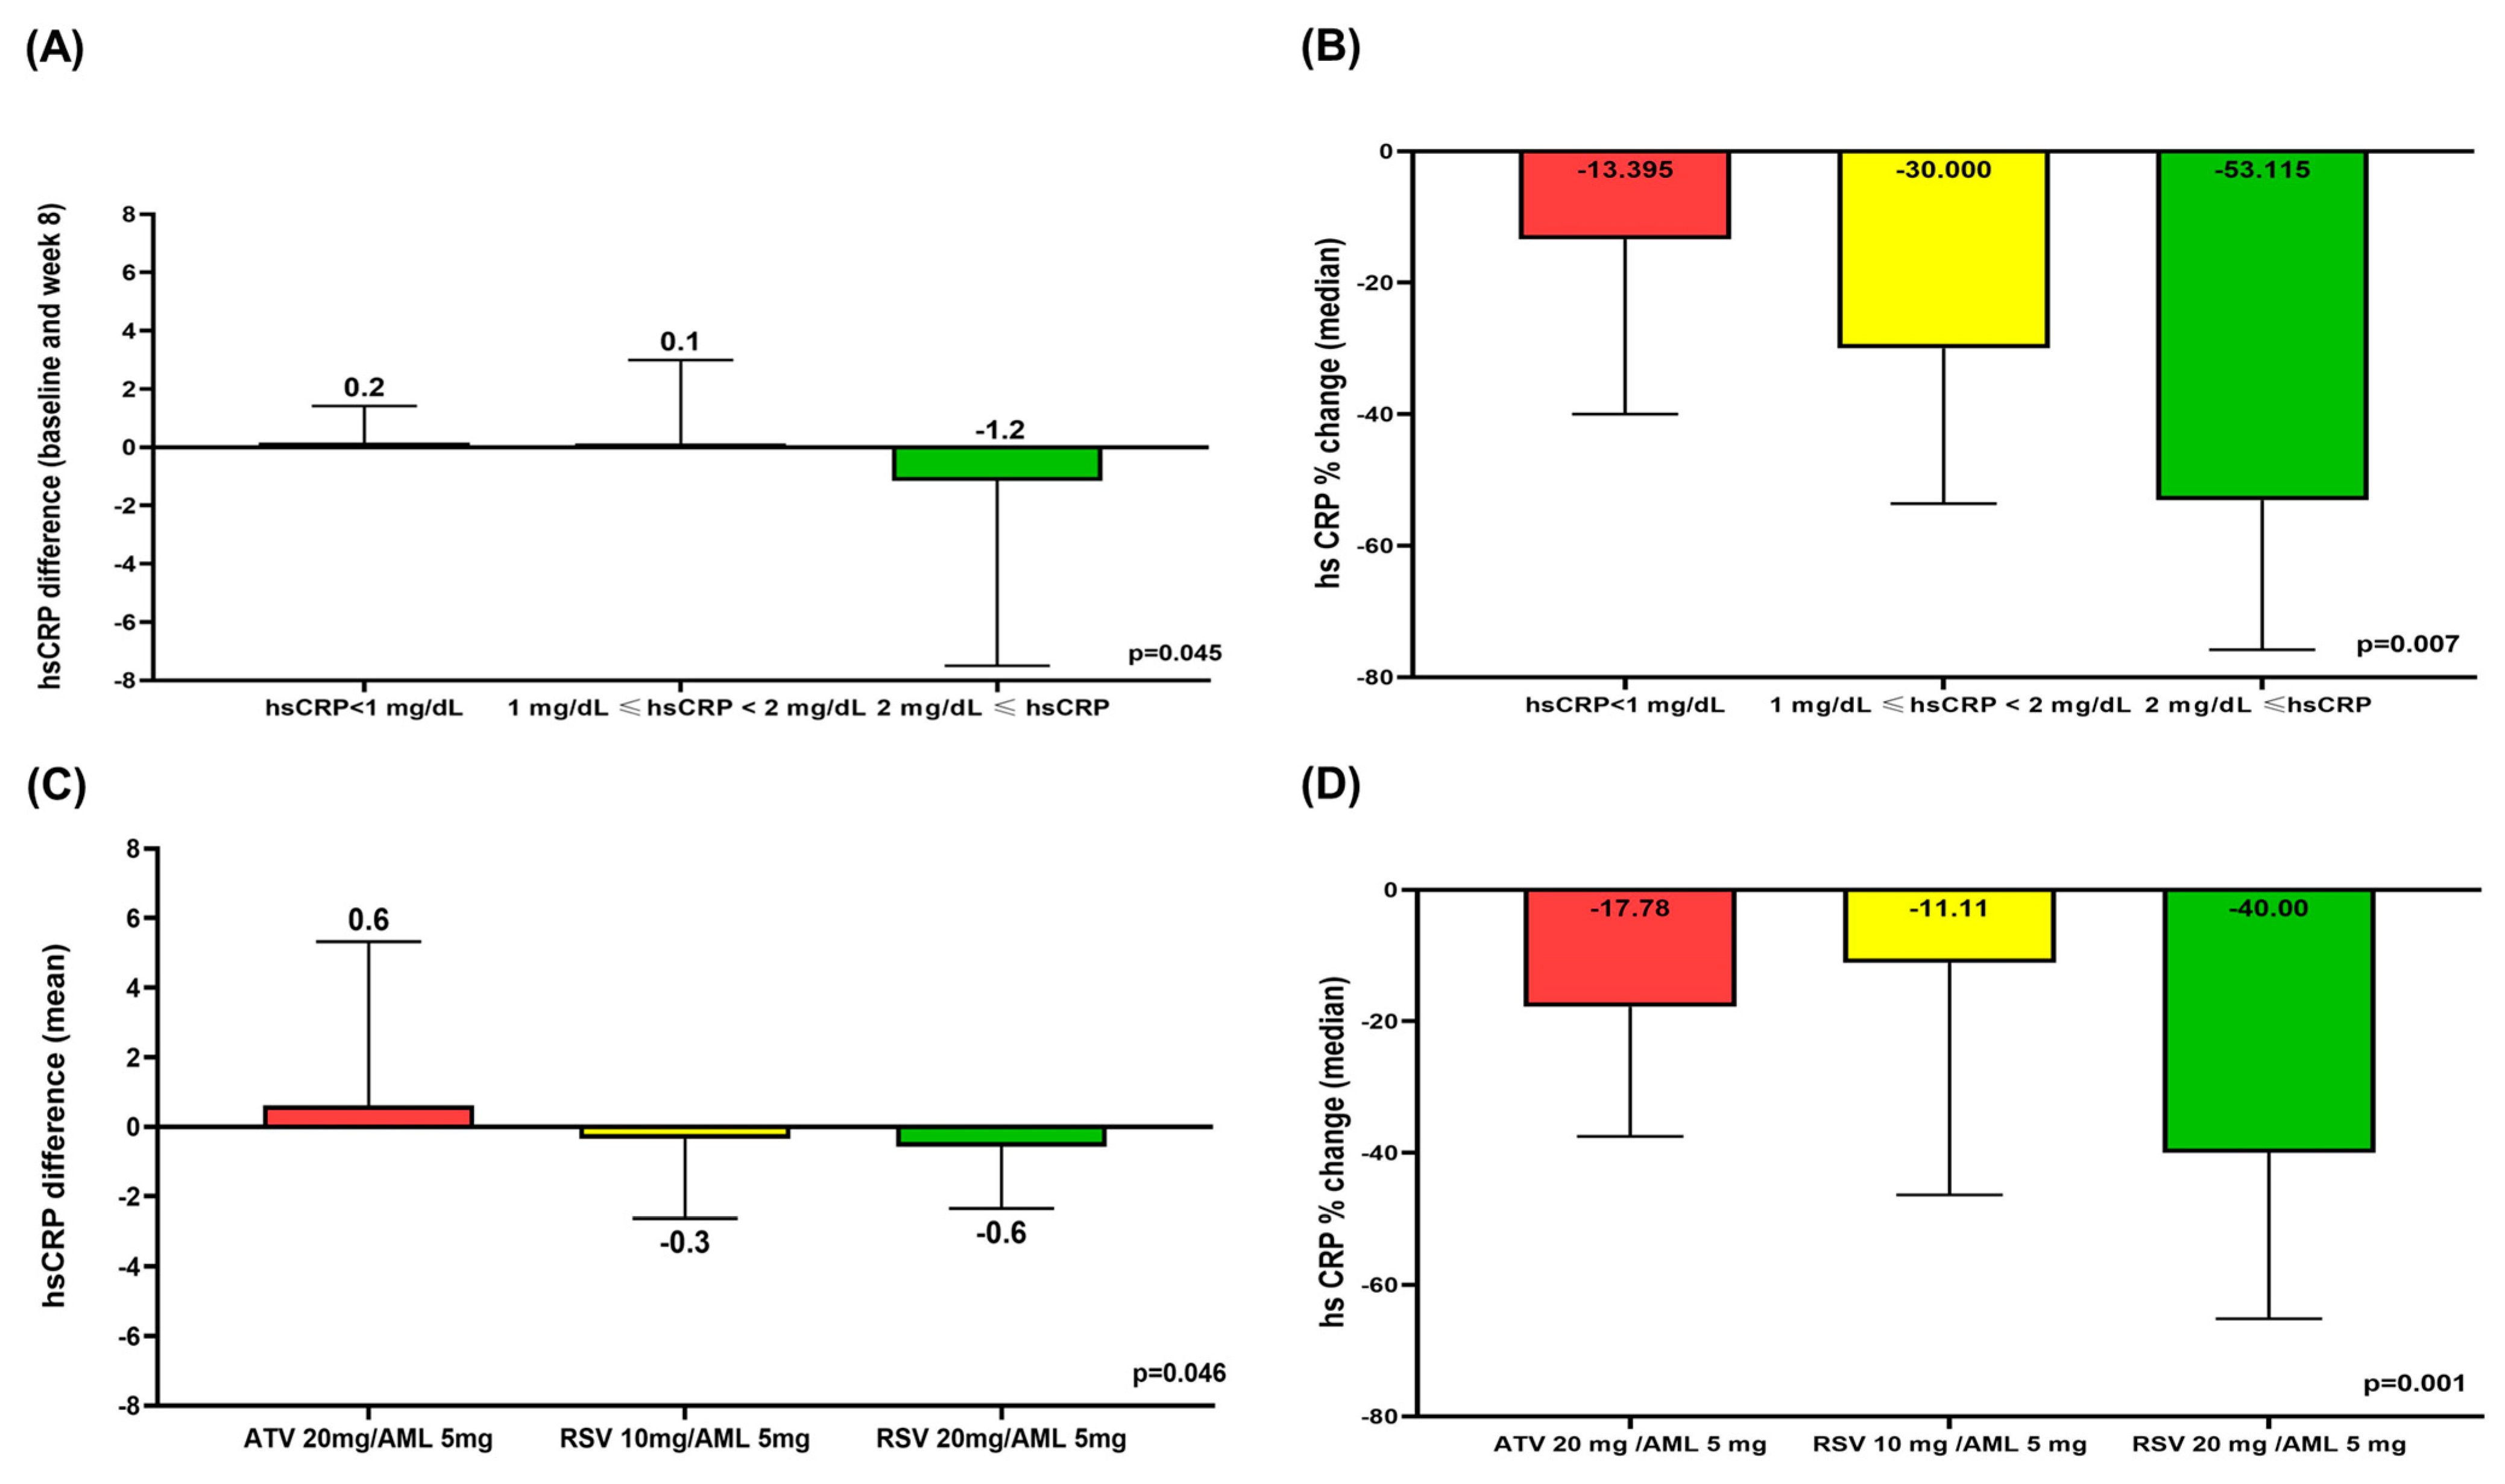
3.5. Comparison of hsCRP Difference and hsCRP % Change According to hsCRP Level and Treatment Group
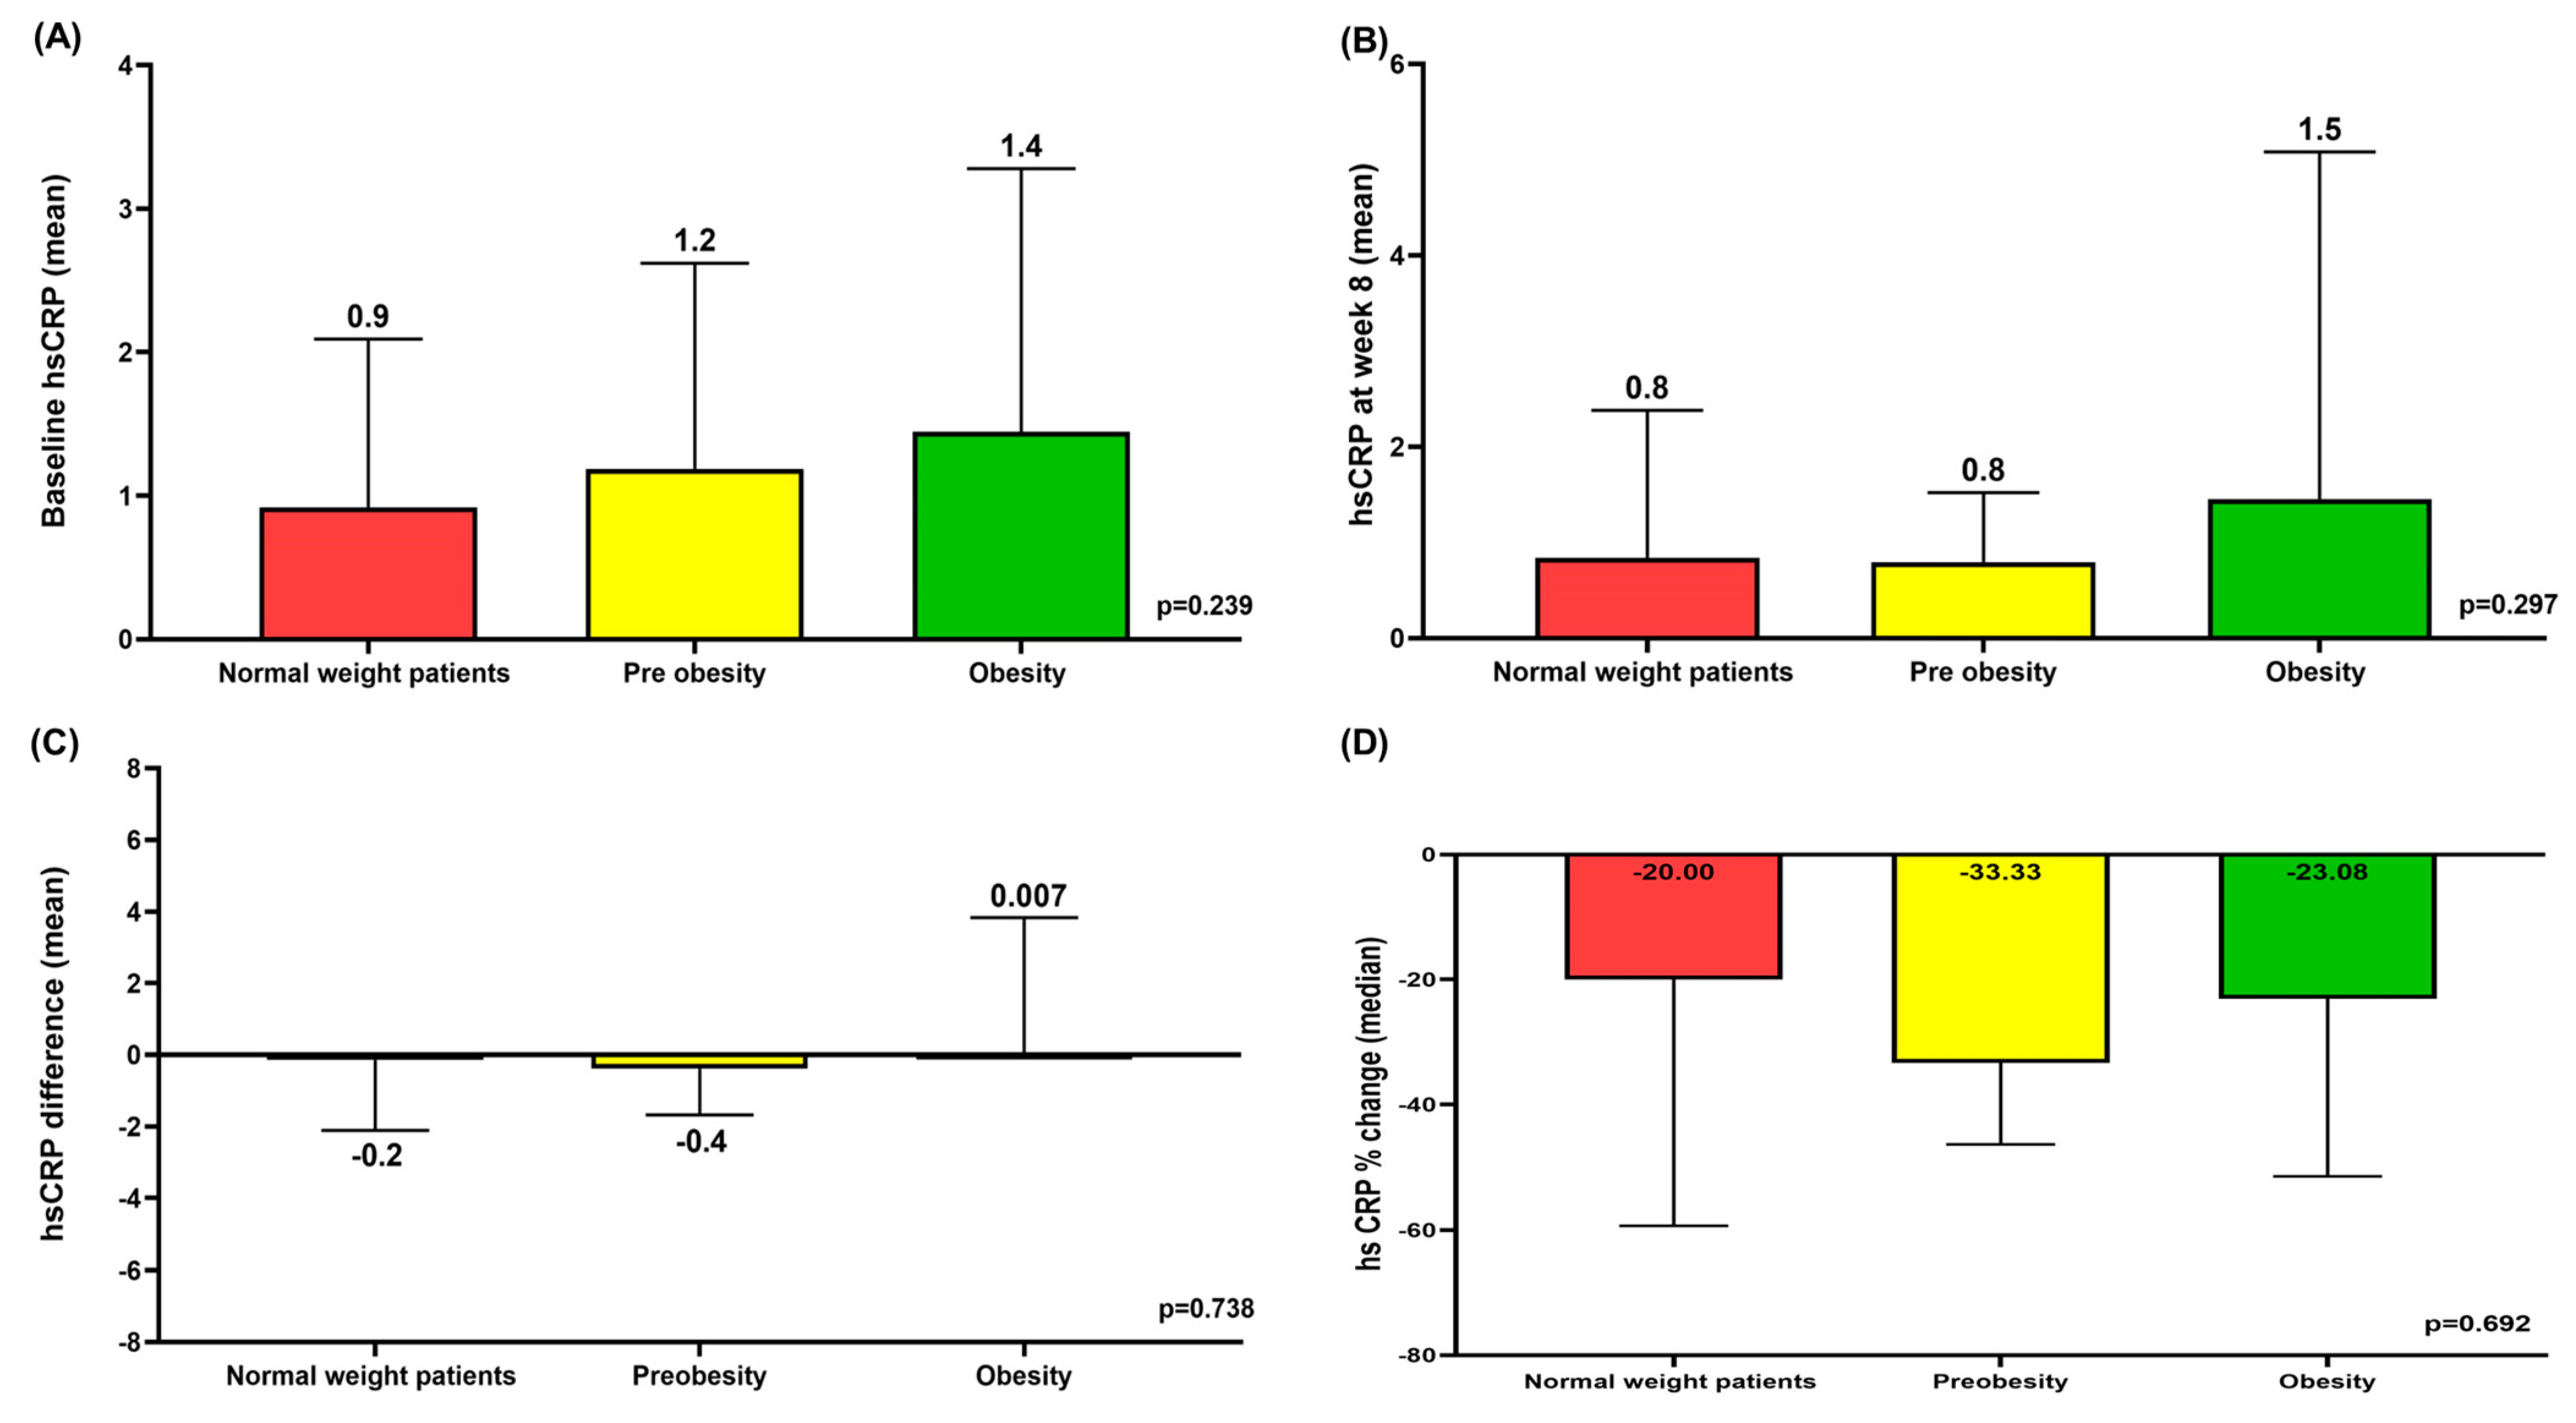
3.6. Mean hsCRP at Baseline and Week 8 According to BMI and Mean hsCRP Differences and Median hsCRP % Change Between Baseline and Week 8 According to BMI
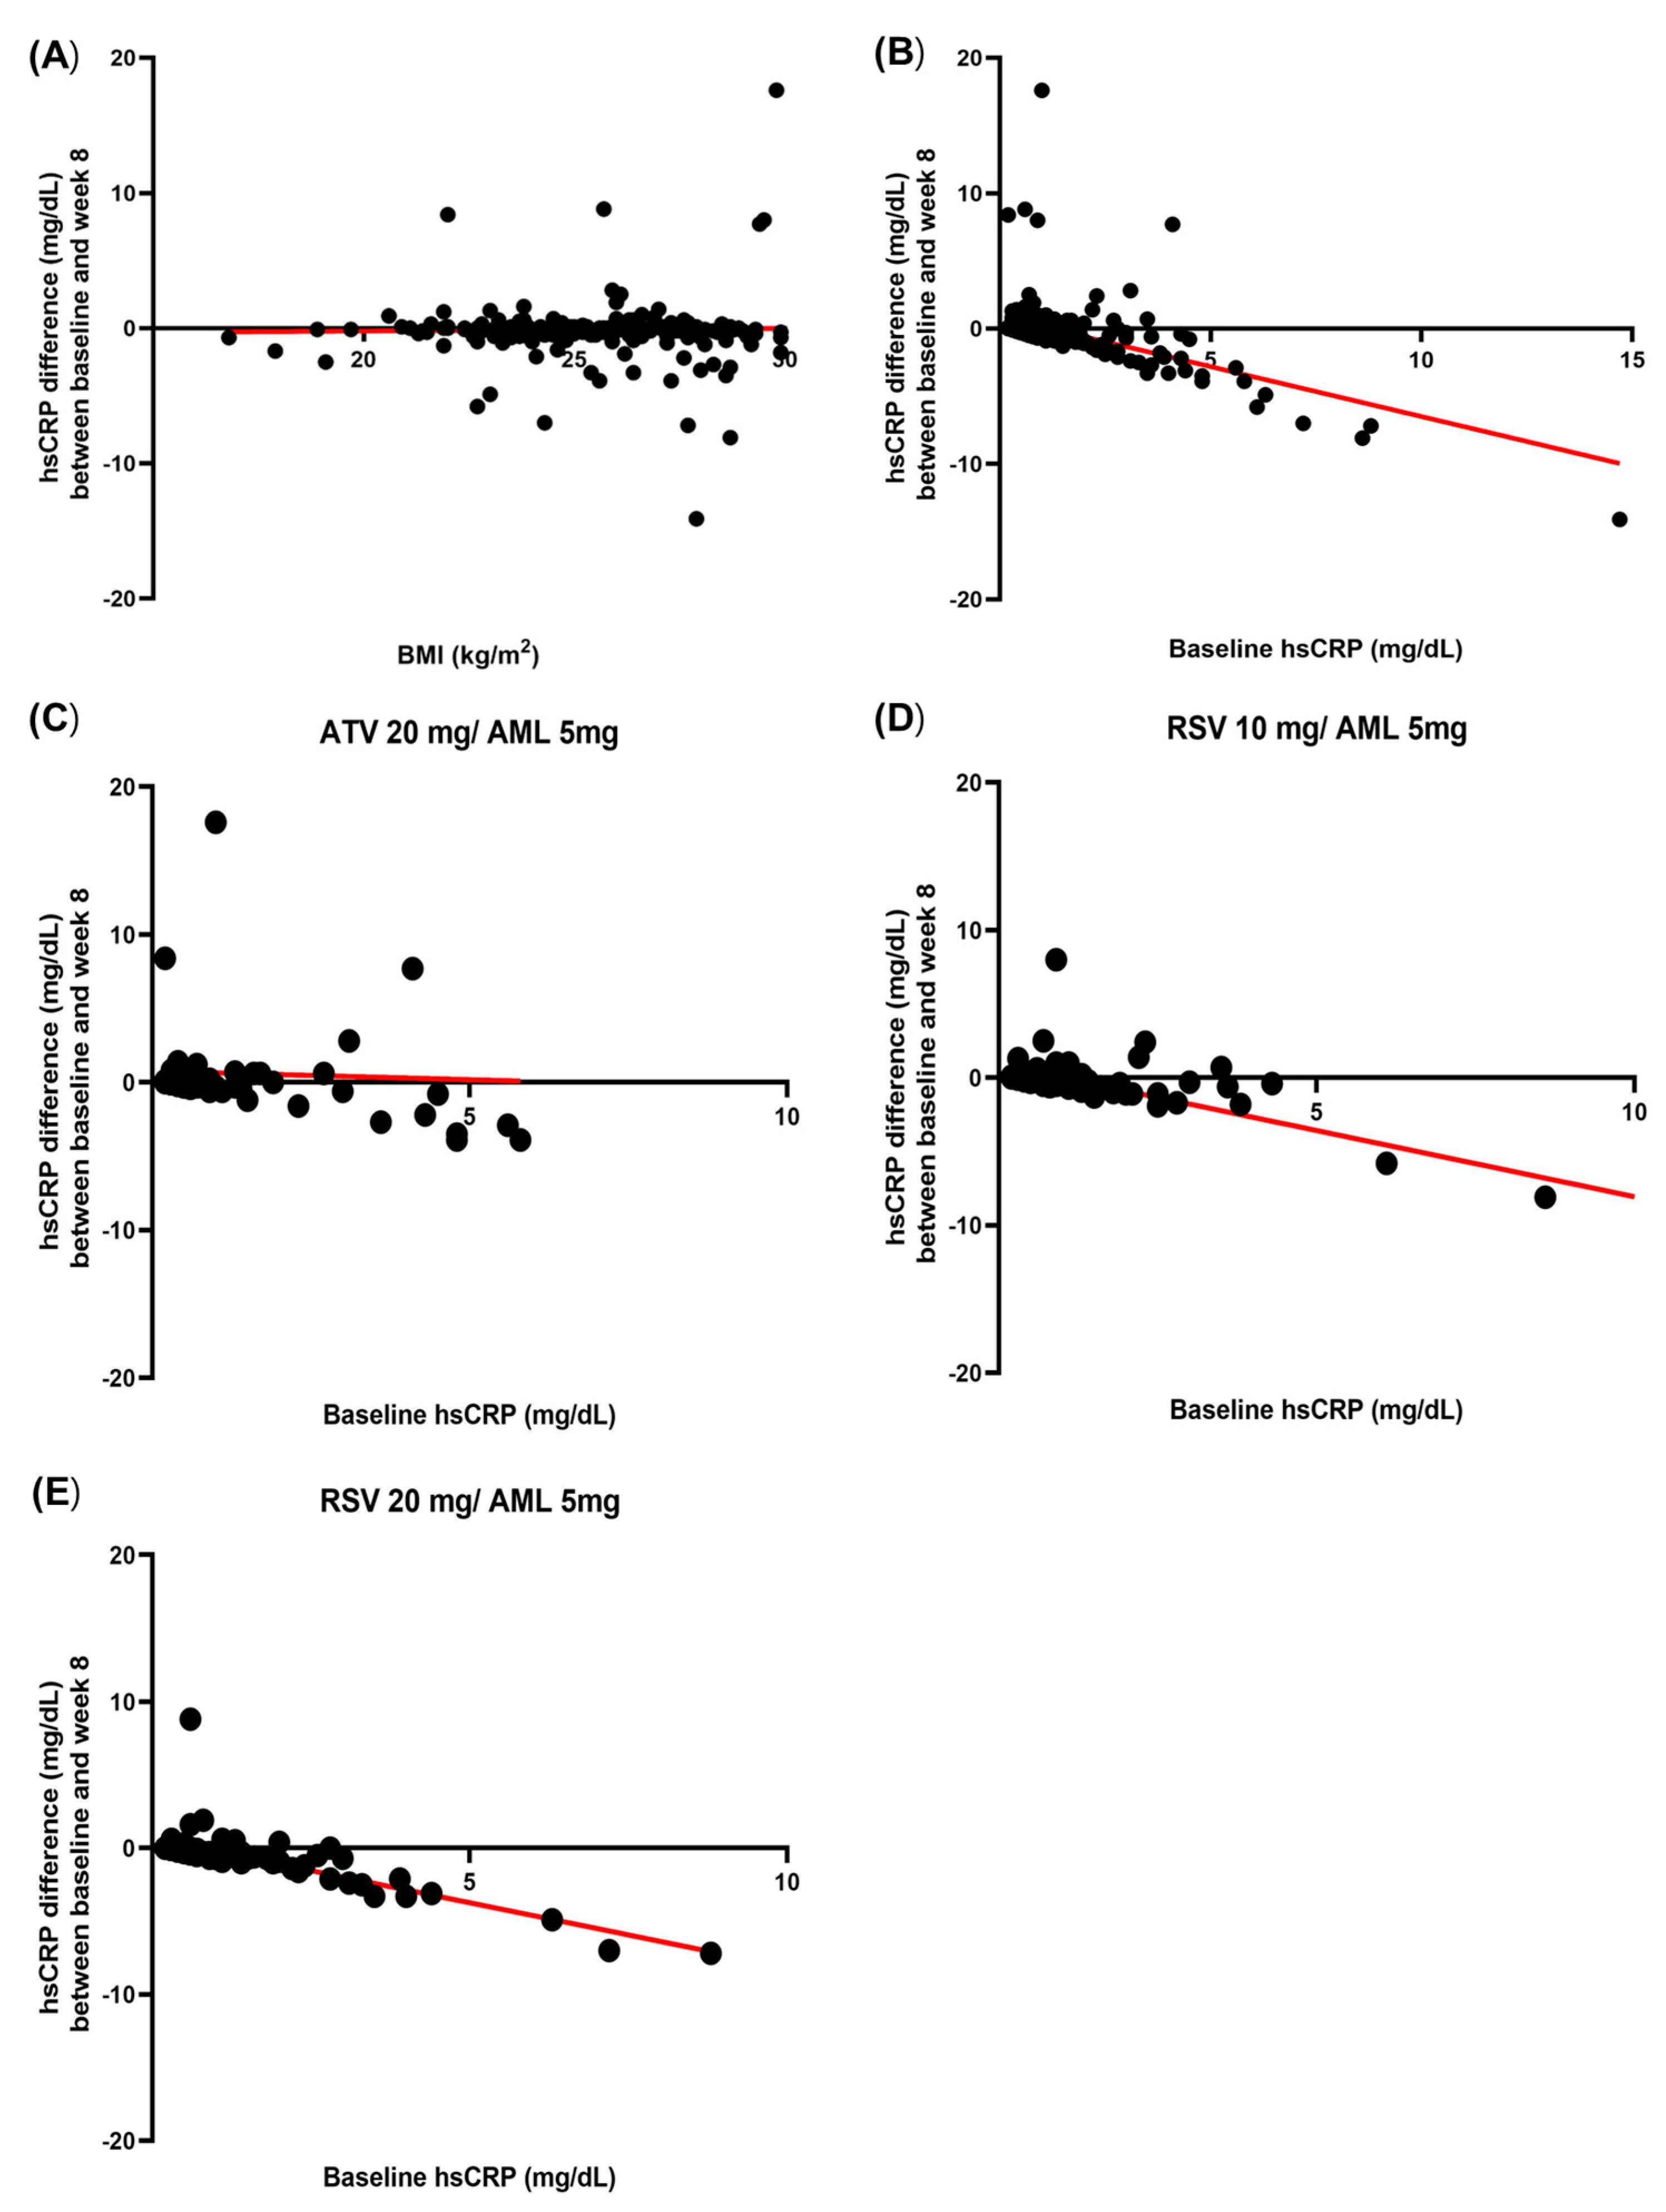
3.7. Correlation Between Baseline hsCRP and hsCRP Difference and Correlation Between Baseline BMI and hsCRP Difference
4. Discussion
5. Conclusions
Author Contributions
Funding
Institutional Review Board Statement
Informed Consent Statement
Data Availability Statement
Conflicts of Interest
References
- Ridker, P.M.; Lei, L.; Louie, M.J.; Haddad, T.; Nicholls, S.J.; Lincoff, A.M.; Libby, P.; Nissen, S.E. Inflammation and Cholesterol as Predictors of Cardiovascular Events Among 13 970 Contemporary High-Risk Patients with Statin Intolerance. Circulation 2024, 149, 28–35. [Google Scholar] [CrossRef] [PubMed]
- Ridker, P.M.; Cannon, C.P.; Morrow, D.; Rifai, N.; Rose, L.M.; McCabe, C.H.; Pfeffer, M.A.; Braunwald, E. C-Reactive Protein Levels and Outcomes after Statin Therapy. New Engl. J. Med. 2005, 352, 20–28. [Google Scholar] [CrossRef] [PubMed]
- Kandelouei, T.; Abbasifard, M.; Imani, D.; Aslani, S.; Razi, B.; Fasihi, M.; Shafiekhani, S.; Mohammadi, K.; Jamialahmadi, T.; Reiner, Ž.; et al. Effect of Statins on Serum level of hs-CRP and CRP in Patients with Cardiovascular Diseases: A Systematic Review and Meta-Analysis of Randomized Controlled Trials. Mediat. Inflamm. 2022, 2022, 8732360. [Google Scholar] [CrossRef]
- Albert, M.A.; Danielson, E.; Rifai, N.; Ridker, P.M.; Prince Investigators. Effect of Statin Therapy on C-Reactive Protein LevelsThe Pravastatin Inflammation/CRP Evaluation (PRINCE): A Randomized Trial and Cohort Study. JAMA 2001, 286, 64–70. [Google Scholar] [CrossRef]
- Ridker, P.M.; Danielson, E.; Fonseca, F.A.H.; Genest, J.; Gotto, A.M.; Kastelein, J.J.P.; Koenig, W.; Libby, P.; Lorenzatti, A.J.; MacFadyen, J.G.; et al. Rosuvastatin to Prevent Vascular Events in Men and Women with Elevated C-Reactive Protein. N. Engl. J. Med. 2008, 359, 2195–2207. [Google Scholar] [CrossRef] [PubMed]
- Kim-Mitsuyama, S.; Soejima, H.; Yasuda, O.; Node, K.; Jinnouchi, H.; Yamamoto, E.; Sekigami, T.; Ogawa, H.; Matsui, K. Reduction in hsCRP levels is associated with decreased incidence of cardiovascular events in Japanese hypertensive women but not in men. Sci. Rep. 2020, 10, 17040. [Google Scholar] [CrossRef]
- Visser, M.; Bouter, L.M.; McQuillan, G.M.; Wener, M.H.; Harris, T.B. Elevated C-reactive protein levels in overweight and obese adults. JAMA 1999, 282, 2131–2135. [Google Scholar] [CrossRef]
- Aronson, D.; Bartha, P.; Zinder, O.; Kerner, A.; Markiewicz, W.; Avizohar, O.; Brook, G.J.; Levy, Y. Obesity is the major determinant of elevated C-reactive protein in subjects with the metabolic syndrome. Int. J. Obes. 2004, 28, 674–679. [Google Scholar] [CrossRef]
- Park, H.S.; Park, J.Y.; Yu, R. Relationship of obesity and visceral adiposity with serum concentrations of CRP, TNF-α and IL-6. Diabetes Res. Clin. Pract. 2005, 69, 29–35. [Google Scholar] [CrossRef]
- Jung, H.W.; Kim, C.Y.; Hong, S.P.; Bae, H.J.; Choi, J.Y.; Ryu, J.K.; Lee, J.B.; Lee, K.H.; Han, K.R.; Yang, D.H.; et al. Randomized, multicenter, parallel, open, phase 4 study to compare the efficacy and safety of rosuvastatin/amlodipine polypill versus atorvastatin/amlodipine polypill in hypertension patient with dyslipidemia. J. Clin. Hypertens. 2023, 25, 828–844. [Google Scholar] [CrossRef]
- Kim, K.K.; Haam, J.H.; Kim, B.T.; Kim, E.M.; Park, J.H.; Rhee, S.Y.; Jeon, E.; Kang, E.; Nam, G.E.; Koo, H.Y.; et al. Evaluation and Treatment of Obesity and Its Comorbidities: 2022 Update of Clinical Practice Guidelines for Obesity by the Korean Society for the Study of Obesity. J. Obes. Metab. Syndr. 2023, 32, 1–24. [Google Scholar] [CrossRef] [PubMed]
- Mora, S.; Ridker, P.M. Justification for the Use of Statins in Primary Prevention: An Intervention Trial Evaluating Rosuvastatin (JUPITER)--can C-reactive protein be used to target statin therapy in primary prevention? Am. J. Cardiol. 2006, 97, 33a–41a. [Google Scholar] [CrossRef] [PubMed]
- Sever, P.S.; Poulter, N.R.; Chang, C.L.; Hingorani, A.; Thom, S.A.; Hughes, A.D.; Welsh, P.; Sattar, N. Evaluation of C-reactive protein prior to and on-treatment as a predictor of benefit from atorvastatin: Observations from the Anglo-Scandinavian Cardiac Outcomes Trial. Eur. Heart J. 2012, 33, 486–494. [Google Scholar] [CrossRef] [PubMed]
- Xie, S.; Galimberti, F.; Olmastroni, E.; Luscher, T.F.; Carugo, S.; Catapano, A.L.; Casula, M. Effect of lipid-lowering therapies on C-reactive protein levels: A comprehensive meta-analysis of randomized controlled trials. Cardiovasc. Res. 2024, 120, 333–344. [Google Scholar] [CrossRef]
- Horiuchi, Y.; Hirayama, S.; Soda, S.; Seino, U.; Kon, M.; Ueno, T.; Idei, M.; Hanyu, O.; Tsuda, T.; Ohmura, H.; et al. Statin therapy reduces inflammatory markers in hypercholesterolemic patients with high baseline levels. J. Atheroscler. Thromb. 2010, 17, 722–729. [Google Scholar] [CrossRef]
- Khan, S.U.; Khan, M.U.; Riaz, H.; Raggi, P.; Valavoor, S.; Khan, M.Z.; Kołodziejczak, M.; Khan, M.S.; Krupica, T.; Alkhouli, M.; et al. Meta-analysis of the Relation of Body Mass Index to Cardiovascular Outcomes in Patients Receiving Intensive Low-Density Lipoprotein Cholesterol Lowering Therapy. Am. J. Cardiol. 2020, 125, 727–734. [Google Scholar] [CrossRef]
- Sandfort, V.; Lai, S.; Ahlman, M.A.; Mallek, M.; Liu, S.; Sibley, C.T.; Turkbey, E.B.; Lima, J.A.C.; Bluemke, D.A. Obesity Is Associated with Progression of Atherosclerosis During Statin Treatment. J. Am. Heart Assoc. 2016, 5, e003621. [Google Scholar] [CrossRef]
- Asher, J.; Houston, M. Statins and C-reactive protein levels. J. Clin. Hypertens. 2007, 9, 622–628. [Google Scholar] [CrossRef]
- Ma, Q.; Zhou, Y.; Zhai, G.; Gao, F.; Zhang, L.; Wang, J.; Yang, Q.; Cheng, W. Meta-Analysis Comparing Rosuvastatin and Atorvastatin in Reducing Concentration of C-Reactive Protein in Patients with Hyperlipidemia. Angiology 2016, 67, 526–535. [Google Scholar] [CrossRef]
- Xue, Z.; Ye, M.; Jiang, H.; Li, D.; Hong, X.; Chen, Z.; Li, Y.; Zhou, B.; Zhang, W.; Wang, M. The Effect of Different Statin-Based Lipid-Lowering Strategies on C-Reactive Protein Levels in Patients with Stable Coronary Artery Disease. Clin. Cardiol. 2024, 47, e24301. [Google Scholar] [CrossRef]
- Ray, K.K.; Cannon, C.P.; Cairns, R.; Morrow, D.A.; Rifai, N.; Kirtane, A.J.; McCabe, C.H.; Skene, A.M.; Gibson, C.M.; Ridker, P.M.; et al. Relationship between uncontrolled risk factors and C-reactive protein levels in patients receiving standard or intensive statin therapy for acute coronary syndromes in the PROVE IT-TIMI 22 trial. J. Am. Coll. Cardiol. 2005, 46, 1417–1424. [Google Scholar] [CrossRef] [PubMed]
- Zamani, B.; Saatlo, B.B.; Naghavi-Behzad, M.; Taqizadeh-Jahed, M.; Alikhah, H.; Abbasnezhad, M. Effects of high versus low-dose atorvastatin on high sensitive C-reactive protein in acute coronary syndrome. Niger. Med. J. 2014, 55, 490–494. [Google Scholar] [PubMed]
- DeGoma, E.M.; French, B.; Dunbar, R.L.; Allison, M.A.; Mohler, E.R., 3rd; Budoff, M.J. Intraindividual variability of C-reactive protein: The Multi-Ethnic Study of Atherosclerosis. Atherosclerosis 2012, 224, 274–279. [Google Scholar] [CrossRef] [PubMed]
- Landry, A.; Docherty, P.; Ouellette, S.; Cartier, L.J. Causes and outcomes of markedly elevated C-reactive protein levels. Can. Fam. Physician 2017, 63, e316–e323. [Google Scholar]
| Risk Group Classification | LDL-C (mg/dL) | |
|---|---|---|
| Group I | No major cardiovascular risk factors other than hypertension or dyslipidemia | 160–250 |
| ||
| Group II |
| 130~250 |
| Group III |
| 100~250 |
| Non-Responder (n = 151) | Responder (n = 86) | p-Value | |
|---|---|---|---|
| Total patients, n | 151 | 86 | |
| Sex | 0.618 | ||
| Male, n (%) | 97 (64.2) | 58 (67.4) | |
| Female, n (%) | 54 (35.8) | 28 (32.6) | |
| Age, years | 62.25 ± 10.22 | 63.56 ± 10.57 | 0.347 |
| BMI, kg/m2 | 26.40 ± 3.56 | 26.46 ± 3.55 | 0.897 |
| eGFR, mL/min/1.73 m2 | 89.32 ± 17.96 | 86.47 ± 18.99 | 0.251 |
| Obesity, n (%) | 95 (62.9) | 58 (67.4) | 0.483 |
| Hypertension medication, n (%) | 136 (90.1) | 75 (87.2) | 0.499 |
| Duration of hypertension, years | 9.49 ± 7.14 | 8.32 ± 6.85 | 0.222 |
| Dyslipidemia medication, n (%) | 88 (58.3) | 55 (64.0) | 0.390 |
| Duration of dyslipidemia, years | 6.28 ± 5.20 | 5.90 ± 5.76 | 0.606 |
| Diabetes mellitus, n (%) | 47 (31.1) | 36 (41.9) | 0.096 |
| Smoking a month ago, n (%) | 32 (21.2) | 23 (26.7) | 0.330 |
| Drinking a month ago, n (%) | 72 (47.7) | 40 (46.5) | 0.862 |
| Myocardial infarction, n (%) | 19 (12.6) | 10 (11.6) | 0.829 |
| Angina, n (%) | 36 (23.8) | 28 (32.6) | 0.146 |
| Coronary revascularization, n (%) | 23 (15.2) | 11 (12.8) | 0.606 |
| PAD, AAA, symptomatic carotid disease, n (%) | 9 (6.0) | 6 (7.0) | 0.757 |
| FRS | 10.78 ± 7.01 | 12.88 ± 8.42 | 0.041 |
| FRS, n (%) | 0.044 | ||
| <10%, n (%) | 69 (45.7) | 31 (36.0) | |
| 10~20%, n (%) | 72 (47.7) | 41 (47.7) | |
| >20%, n (%) | 10 (6.6) | 14 (16.3) | |
| Family history of premature CAD, n (%) | 13 (8.6) | 5 (5.8) | 0.435 |
| Categories of risk | 0.419 | ||
| Group I, n (%) | 27 (17.9) | 11 (12.8) | |
| Group II, n (%) | 22 (14.6) | 10 (11.6) | |
| Group III, n (%) | 102 (67.5) | 65 (75.6) | |
| Medication | 0.001 | ||
| RSV 10 mg/AML 5 mg, n (%) | 60 (39.7) | 19 (22.1) | |
| ATV 20 mg/AML 5 mg, n (%) | 52 (34.4) | 25 (29.1) | |
| RSV 20 mg/AML 5 mg, n (%) | 39 (25.8) | 42 (48.8) | |
| LDL-C, baseline, mg/dL | 157.19 ± 29.47 | 149.33 ± 29.80 | 0.050 |
| LDL-C, 8 weeks, mg/dL | 84.45 ± 26.60 | 71.65 ± 23.69 | <0.0001 |
| LDL-C, 8 weeks, % changes | −45.56 ± 16.49 | −52.12 ± 12.96 | 0.002 |
| Total cholesterol, baseline, mg/dL | 222.94 ± 32.12 | 213.45 ± 30.95 | 0.028 |
| Total cholesterol, 8 weeks, mg/dL | 149.91 ± 31.33 | 139.18 ± 25.69 | 0.007 |
| HDL-C, baseline | 46.70 ± 11.91 | 47.60 ± 11.15 | 0.567 |
| HDL-C, 8 weeks | 50.86 ± 12.34 | 51.94 ± 12.40 | 0.521 |
| Triglyceride, baseline | 192.31 ± 180.22 | 164.08 ± 78.12 | 0.169 |
| Triglyceride, 8 weeks | 129.14 ± 56.33 | 132.79 ± 52.58 | 0.624 |
| Apo A-1, baseline | 143.38 ± 23.35 | 143.58 ± 22.83 | 0.948 |
| Apo A-1, 8 weeks | 149.80 ± 25.45 | 155.01 ± 25.33 | 0.130 |
| Apo B, baseline | 135.59 ± 22.78 | 132.19 ± 22.33 | 0.268 |
| Apo B, 8 weeks | 83.03 ± 22.01 | 75.33 ± 19.43 | 0.007 |
| Lipoprotein (a), baseline | 38.71 ± 46.96 | 46.28 ± 67.86 | 0.313 |
| Lipoprotein (a), 8 weeks % changes | 43.58 ± 56.42 | 51.00 ± 79.29 | 0.404 |
| hsCRP, baseline | 0.89 ± 0.87 | 2.08 ± 2.35 | <0.0001 |
| hsCRP, 8 weeks | 1.58 ± 3.69 | 0.59 ± 0.51 | 0.015 |
| hsCRP, 8 weeks % changes | 88.37 ± 413.28 | −61.51 ± 15.06 | 0.001 |
| FBG, baseline | 114.78 ± 22.77 | 118.55 ± 25.18 | 0.239 |
| FBG, 8 weeks | 116.33 ± 24.04 | 119.52 ± 26.20 | 0.343 |
| HbA1c, baseline | 6.09 ± 0.69 | 6.20 ± 0.74 | 0.231 |
| HbA1c, 8 weeks | 6.11 ± 0.75 | 6.31 ± 0.98 | 0.083 |
| Variance | Univariate Analysis | Multivariate Analysis | ||||
|---|---|---|---|---|---|---|
| HR | 95% CI | p | HR | 95% CI | p | |
| Age | 1.013 | 0.987–1.039 | 0.346 | |||
| Male | 1.153 | 0.658–2.020 | 0.618 | |||
| Diabetes mellitus | 1.593 | 0.919–2.761 | 0.097 | |||
| Obesity | 1.221 | 0.698–2.135 | 0.484 | |||
| Pre-obesity | 0.817 | 0.426–1.567 | 0.542 | |||
| Normal body weight | 0.908 | 0.415–1.986 | 0.809 | |||
| Baseline hsCRP ≥ 2 mg/dL | 4.520 | 2.285–8.940 | <0.0001 | 4.291 | 2.108–8.738 | <0.0001 |
| LDL-C at baseline | 0.991 | 0.982–1.000 | 0.052 | |||
| HDL-C at baseline | 1.007 | 0.984–1.030 | 0.565 | |||
| Systolic BP at baseline | 0.988 | 0.977–1.019 | 0.843 | |||
| Previous hypertension medication | 0.752 | 0.329–1.720 | 0.752 | |||
| RSV 20 mg/AML 5 mg | 2.741 | 1.569–4.790 | <0.0001 | 2.873 | 1.592–5.185 | <0.0001 |
| FRS > 20% | 2.742 | 1.160–6.477 | 0.021 | 2.375 | 0.936–6.025 | 0.069 |
| Smoking a month ago | 1.358 | 0.733–2.515 | 0.331 | |||
| Drinking a month ago | 0.954 | 0.561–1.622 | 0.862 | |||
| eGFR | 0.991 | 0.977–1.006 | 0.251 | |||
| Family history of premature CAD | 0.655 | 0.225–1.905 | 0.438 | |||
| History of Myocardial infarction | 0.914 | 0.404–2.067 | 0.829 | |||
| PAD, AAA, symptomatic carotid disease | 1.183 | 0.406–3.445 | 0.758 | |||
| Coronary revascularization | 0.816 | 0.377–1.768 | 0.607 | |||
| Baseline hsCRP < 2 mg/dL n = 191 | Baseline hsCRP ≥ 2 mg/dL n = 46 | p-Value | ATV 10 mg/AML 5 mg, RSV 10 mg/AML 5 mg n = 156 | RSV 20 mg/AML 5 mg n = 81 | p-Value | |
|---|---|---|---|---|---|---|
| Sex | 0.508 | 0.768 | ||||
| Male, n (%) | 123 (64.4) | 32 (69.6) | 101 (64.7) | 54 (66.7) | ||
| Female, n (%) | 68 (35.6) | 14 (30.4) | 55 (35.3) | 27 (33.3) | ||
| Age, years | 62.99 ± 10.27 | 61.63 ± 10.70 | 0.423 | 62.77 ± 10.64 | 62.64 ± 9.81 | 0.925 |
| BMI, kg/m2 | 26.20 ± 3.49 | 27.37 ± 3.66 | 0.044 | 26.43 ± 3.59 | 26.42 ± 3.48 | 0.987 |
| eGFR, mL/min/1.73 m2 | 88.55 ± 17.78 | 87.15 ± 20.71 | 0.642 | 88.82 ± 19.27 | 87.25 ± 16.51 | 0.536 |
| Obesity (BMI ≥ 25 kg/m2) | 123 (64.4) | 32 (69.6) | 0.508 | 104 (66.7) | 49 (60.5) | 0.346 |
| Hypertension medication, n (%) | 172 (90.1) | 39 (84.8) | 0.305 | 139 (89.1) | 72 (88.9) | 0.960 |
| Duration of hypertension, years | 9.46 ± 6.87 | 7.43 ± 7.59 | 0.080 | 9.38 ± 7.13 | 8.45 ± 6.87 | 0.337 |
| Dyslipidemia medication, n (%) | 118 (61.8) | 25 (54.3) | 0.355 | 91 (58.3) | 52 (64.2) | 0.381 |
| Duration of dyslipidemia, years | 6.47 ± 5.27 | 4.78 ± 5.79 | 0.056 | 6.33 ± 5.23 | 5.77 ± 5.72 | 0.449 |
| Diabetes mellitus, n (%) | 68 (35.6) | 15 (32.6) | 0.702 | 60 (38.5) | 23 (28.4) | 0.123 |
| Smoking a month ago, n (%) | 41 (21.5) | 14 (30.4) | 0.196 | 37 (23.7) | 18 (22.2) | 0.796 |
| Drinking a month ago, n (%) | 88 (46.1) | 24 (52.2) | 0.457 | 76 (48.7) | 36 (44.4) | 0.532 |
| Myocardial infarction, n (%) | 27 (14.1) | 2 (4.3) | 0.069 | 20 (12.8) | 9 (11.1) | 0.703 |
| Angina, n (%) | 53 (27.7) | 11 (23.9) | 0.599 | 41 (26.3) | 23 (28.4) | 0.728 |
| Coronary revascularization, n (%) | 31 (16.2) | 3 (6.5) | 0.092 | 23 (14.7) | 11 (13.6) | 0.809 |
| PAD, AAA, symptomatic carotid disease, n (%) | 13 (6.8) | 2 (4.3) | 0.539 | 7 (4.5) | 8 (9.9) | 0.106 |
| FRS, % | 11.03 ± 7.25 | 13.67 ± 8.68 | 0.034 | 11.53 ± 7.86 | 11.58 ± 7.12 | 0.958 |
| FRS | 0.055 | 0.802 | ||||
| <10%, n (%) | 84 (44.0) | 16 (34.8) | 68 (43.6) | 32 (39.5) | ||
| 10~20%, n (%) | 92 (48.2) | 21 (45.7) | 72 (46.2) | 41 (50.6) | ||
| >20%, n (%) | 15 (7.9) | 9 (19.6) | 16 (10.3) | 8 (9.9) | ||
| Family history of premature CAD, n (%) | 14 (7.3) | 4 (8.7) | 0.754 | |||
| Categories of risk | 0.690 | 0.255 | ||||
| Group I, n (%) | 29 (15.2) | 9 (19.6) | 25 (16.0) | 13 (16.0) | ||
| Group II, n (%) | 27 (14.1) | 5 (10.9) | 17 (10.9) | 15 (18.5) | ||
| Group III, n (%) | 135 (70.7) | 32 (69.6) | 114 (73.1) | 53 (65.4) | ||
| Medication | 0.654 | |||||
| AML/RSV 10, n (%) | 66 (34.6) | 13 (28.3) | ||||
| AML/ATV 20, n (%) | 62 (32.5) | 15 (32.6) | ||||
| AML/RSV 20 n (%) | 63 (33.0) | 18 (39.1) | ||||
| SBP at baseline, mmHg | 131.80 ± 12.33 | 132.40 ± 14.67 | 0.773 | 132.17 ± 13.21 | 131.42 ± 11.99 | 0.669 |
| SBP at 8 weeks, mmHg | 131.29 ± 14.16 | 133.56 ± 13.43 | 0.326 | 132.60 ± 13.88 | 130.06 ± 14.23 | 0.186 |
| LDL-C, baseline, mg/dL | 154.34 ± 29.62 | 154.34 ± 30.73 | 1.000 | 153.42 ± 30.79 | 156.11 ± 27.79 | 0.512 |
| LDL-C, 8 weeks, mg/dL | 80.11 ± 27.21 | 78.54 ± 22.16 | 0.716 | 83.37 ± 26.28 | 72.93 ± 24.98 | 0.004 |
| LDL-C, 8 weeks % changes | −47.82 ± 15.92 | −48.44 ± 14.32 | 0.809 | −45.32 ± 15.35 | −52.99 ± 14.91 | <0.0001 |
| Total cholesterol, baseline, mg/dL | 219.44 ± 32.21 | 219.71 ± 31.29 | 0.959 | 218.83 ± 32.65 | 220.77 ± 30.76 | 0.658 |
| Total cholesterol, 8 weeks, mg/dL | 145.69 ± 30.95 | 147.36 ± 24.71 | 0.733 | 148.57 ± 30.76 | 141.11 ± 27.39 | 0.068 |
| HDL-C, baseline, mg/dL | 46.96 ± 11.42 | 47.30 ± 12.58 | 0.859 | 46.64 ± 11.83 | 47.77 ± 11.26 | 0.477 |
| HDL-C, 8 weeks, mg/dL | 50.84 ± 11.62 | 52.95 ± 15.05 | 0.300 | 50.68 ± 11.91 | 52.35 ± 13.17 | 0.324 |
| Triglyceride, baseline, mg/dL | 184.06 ± 163.79 | 173.76 ± 86.07 | 0.680 | 189.88 ± 179.47 | 167.01 ± 71.94 | 0.272 |
| Triglyceride, 8 weeks, mg/dL | 129.76 ± 56.43 | 133.36 ± 48.59 | 0.691 | 131.17 ± 53.99 | 129.11 ± 56.97 | 0.785 |
| Apo A-1, baseline, mg/dL | 143.39 ± 22.73 | 143.69 ± 24.90 | 0.938 | 143.34 ± 23.50 | 143.66 ± 22.48 | 0.921 |
| Apo A-1, 8 weeks, mg/dL | 150.42 ± 24.10 | 156.97 ± 30.26 | 0.118 | 150.86 ± 25.46 | 153.30 ± 25.60 | 0.486 |
| Apo B, baseline, mg/dL | 134.00 ± 22.76 | 135.82 ± 22.78 | 0.626 | 133.55 ± 22.86 | 135.91 ± 22.25 | 0.449 |
| Apo B, 8 weeks, mg/dL | 80.17 ± 22.44 | 80.49 ± 16.56 | 0.928 | 82.42 ± 21.43 | 76.03 ± 20.82 | 0.029 |
| Lipoprotein(a), baseline, mg/dL | 39.91 ± 52.51 | 47.88 ± 66.50 | 0.383 | 37.99 ± 46.84 | 48.15 ± 68.88 | 0.182 |
| Lipoprotein(a), 8 weeks, mg/dL | 45.64 ± 62.81 | 48.91 ± 76.72 | 0.762 | 42.68 ± 57.20 | 53.20 ± 79.19 | 0.242 |
| hsCRP, baseline, mg/dL | 0.69 ± 0.41 | 3.94 ± 2.31 | <0.0001 | 1.28 ± 1.74 | 1.40 ± 1.55 | 0.606 |
| hsCRP, 8 weeks, mg/dL | 0.84 ± 1.74 | 2.79 ± 5.58 | <0.0001 | 1.42 ± 3.58 | 0.83 ± 1.15 | 0.149 |
| hsCRP, 8 weeks % changes | 43.47 ± 358.56 | −5.42 ± 228.74 | 0.379 | 54.55 ± 394.60 | −5.61 ± 178.27 | 0.194 |
| hsCRP responder, n (%) | 56 (29.3) | 30 (65.2) | <0.0001 | 44 (28.2) | 42 (51.9) | <0.0001 |
| FBG, baseline, mg/dL | 116.15 ± 24.30 | 116.15 ± 21.25 | 0.999 | 117.36 ± 21.62 | 113.85 ± 27.22 | 0.281 |
| FBG, 8 weeks, mg/dL | 116.72 ± 23.61 | 120.67 ± 29.48 | 0.334 | 118.87 ± 24.93 | 114.82 ± 24.59 | 0.235 |
| HbA1c, baseline, % | 6.10 ± 0.70 | 6.25 ± 0.72 | 0.213 | 6.18 ± 0.67 | 6.03 ± 0.76 | 0.129 |
| HbA1c, 8 weeks, % | 6.16 ± 0.84 | 6.30 ± 0.87 | 0.312 | 6.22 ± 0.75 | 6.11 ± 1.00 | 0.347 |
Disclaimer/Publisher’s Note: The statements, opinions and data contained in all publications are solely those of the individual author(s) and contributor(s) and not of MDPI and/or the editor(s). MDPI and/or the editor(s) disclaim responsibility for any injury to people or property resulting from any ideas, methods, instructions or products referred to in the content. |
© 2025 by the authors. Licensee MDPI, Basel, Switzerland. This article is an open access article distributed under the terms and conditions of the Creative Commons Attribution (CC BY) license (https://creativecommons.org/licenses/by/4.0/).
Share and Cite
Park, C.M.; Jung, H.W. Predictors of Significant High-Sensitivity C-Reactive Protein Reduction After Use of Rosuvastatin/Amlodipine and Atorvastatin/Amlodipine—Subgroup Analysis in Randomized Controlled Trials. J. Clin. Med. 2025, 14, 3363. https://doi.org/10.3390/jcm14103363
Park CM, Jung HW. Predictors of Significant High-Sensitivity C-Reactive Protein Reduction After Use of Rosuvastatin/Amlodipine and Atorvastatin/Amlodipine—Subgroup Analysis in Randomized Controlled Trials. Journal of Clinical Medicine. 2025; 14(10):3363. https://doi.org/10.3390/jcm14103363
Chicago/Turabian StylePark, Chun Muk, and Hae Won Jung. 2025. "Predictors of Significant High-Sensitivity C-Reactive Protein Reduction After Use of Rosuvastatin/Amlodipine and Atorvastatin/Amlodipine—Subgroup Analysis in Randomized Controlled Trials" Journal of Clinical Medicine 14, no. 10: 3363. https://doi.org/10.3390/jcm14103363
APA StylePark, C. M., & Jung, H. W. (2025). Predictors of Significant High-Sensitivity C-Reactive Protein Reduction After Use of Rosuvastatin/Amlodipine and Atorvastatin/Amlodipine—Subgroup Analysis in Randomized Controlled Trials. Journal of Clinical Medicine, 14(10), 3363. https://doi.org/10.3390/jcm14103363


