Systematic Review

A Meta-Analysis of the Global Prevalence of Temporomandibular Disorders

by
Grzegorz Zieliński
1,*,
Beata Pająk-Zielińska
2 and
Michał Ginszt
3
1
Department of Sports Medicine, Medical University of Lublin, 20-093 Lublin, Poland
2
Interdisciplinary Scientific Group of Sports Medicine, Department of Sports Medicine, Medical University of Lublin, 20-093 Lublin, Poland
3
Department of Rehabilitation and Physiotherapy, Medical University of Lublin, 20-093 Lublin, Poland
*
Author to whom correspondence should be addressed.
J. Clin. Med. 2024, 13(5), 1365; https://doi.org/10.3390/jcm13051365
Submission received: 1 February 2024 / Revised: 22 February 2024 / Accepted: 25 February 2024 / Published: 28 February 2024

Abstract

:
Background: This meta-analysis aims to evaluate the proportion of people with TMDs in different studies, considering factors such as geographical region, patient age, and sample size. Methods: The search yielded 6984 articles on the incidence of TMDs. Finally, 74 studies with 172,239 subjects and 35,259 with TMDs were selected for final analysis. Analyses were performed using the R statistical language. Results: The incidence of TMDs in the world population was 34%. The age group 18–60 years is the most exposed to TMDs. From the data presented, we observed that for each continent, the female group was 9% to 56% larger than the male group. The highest female-to-male ratio (F:M) was reported in South America (1.56), whereas the lowest F:M ratio was reported in Europe (1.09), suggesting an almost equal distribution of males and females. Conclusions: This suggests that geographical location may play a role in the results of the studies. The prevalence of TMDs was significantly higher in South America (47%) compared to Asia (33%) and Europe (29%). Larger epidemiological studies of TMDs in African and Australian populations are recommended. In conclusion, both visual and statistical assessments suggest that the results of our meta-analysis are robust and unlikely to be significantly affected by publication bias. This suggests that geographical location may play a role in the prevalence of TMDs.

Graphical Abstract

1. Introduction

Temporomandibular disorders (TMDs) is the term used to describe pain and dysfunction in the chewing muscles and temporomandibular joint (TMJ). TMDs are the most common oral and facial pain condition [1]. In addition, TMD signs and symptoms include a restricted range of motion and TMJ noises [2]. However, chronic pain is the main reason why patients with TMDs seek treatment [1]. Patients with TMDs are more likely to experience tinnitus [3] and sleep quality problems [4], and there are bidirectional associations between TMDs and depressive and anxiety disorders [5]. It has been estimated that treating TMDs costs $4 billion worldwide [6]. The most common treatments for TMDs include physiotherapy, occlusal splint therapy, and pharmacological treatment [7].
The etiology of TMDs is multifactorial. The main factors include biomechanical, neuromuscular, biopsychosocial, and biological factors: occlusal overload and parafunctions (e.g., bruxism) belong to the first group, biopsychosocial factors causing TMDs are stress, anxiety, or depression, and biological factors include, for example, increased levels of estrogen hormones [8].
For the diagnosis of TMDs, current studies use the Diagnostic Criteria for TMD (DC/TMD) developed in 2014 [9], the Diagnostic Criteria for Temporomandibular Disorders (RDC/TMD) developed in 1992 [10], the Fonseca Anamnestic Index (FAI) developed in 1994 [11], and the Short-Form Fonseca Anamnestic Index (SFAI) developed in 2018 [12], among others, including the Helkimo Indexes developed in 1974 [13], the Krogh-Poulsen criteria, the TMJ Scale, the Craniomandibular Index, and the Criteria of the American Academy of Orofacial Pain [14]. A large proportion of current epidemiological studies are based on the adaptation of any of the above protocols for example [15,16,17,18]. The examination procedure and diagnosis with the best statistical properties are currently DC/TMD and RDC/TMD [10,15]. Some of the questionnaires have similar accuracy. For example, the FAI and the SFAI have shown higher accuracy than the DC/TMD [19,20]. Compared with the RDC, the FAI showed high sensitivity and low specificity [21].
In the last five years, there has been one meta-analysis of the prevalence of TMDs in the global population [22], one meta-analysis of the prevalence of TMDs in children [23], and two meta-analyses of the prevalence in the Brazilian [24] and Chinese [25] populations. The meta-analyses of the global and Brazilian populations were based on the prevalence of TMDs based on RDC/TMD and DC/TMD [22,23,24]. As shown above, FAI and SFAI can effectively screen for TMDs [19,20,21]. Therefore, we believe that the exclusion of studies based on the exclusion of screening methods other than RDC/TMD or DC/TMD may have significantly influenced the results of these meta-analyses [22,23,24].
Due to the observed use of different tools and methods to study the prevalence of TMDs, a Total Quality Score (TQS) developed by Giannakopoulos et al. was used to assess the quality of prevalence studies [14]. This tool can be further used to assess the quality of scientific articles on prevalence studies. The quality assessment of prevalence studies consists of three main criteria: sampling, measurement, and analysis. Each criterion is addressed. Based on the information obtained from each article, the points assigned to each main criterion are summarised as a Total Quality Score (TQS). Finally, according to the TQS, the quality of the included articles was divided into four levels: 0–4 (poor); 5–9 (fair); 10–14 (good); and 15–19 (outstanding) [14]. According to Giannakopoulos et al., the TQS for ICC(2,1) ranged from 0.94 to 1.00, indicating almost perfect agreement between researchers [14]. The abovementioned tool has been used in meta-analyses [25,26,27].
Given the above information, it was decided to conduct the present meta-analysis considering the TQS score and publications with good and outstanding results. The present meta-analysis aims to evaluate the proportion of individuals with TMDs across various studies, considering geographical region, patient age, and sample size. To the best of our knowledge, there has been no meta-analysis on the prevalence of TMDs according to geographical region.

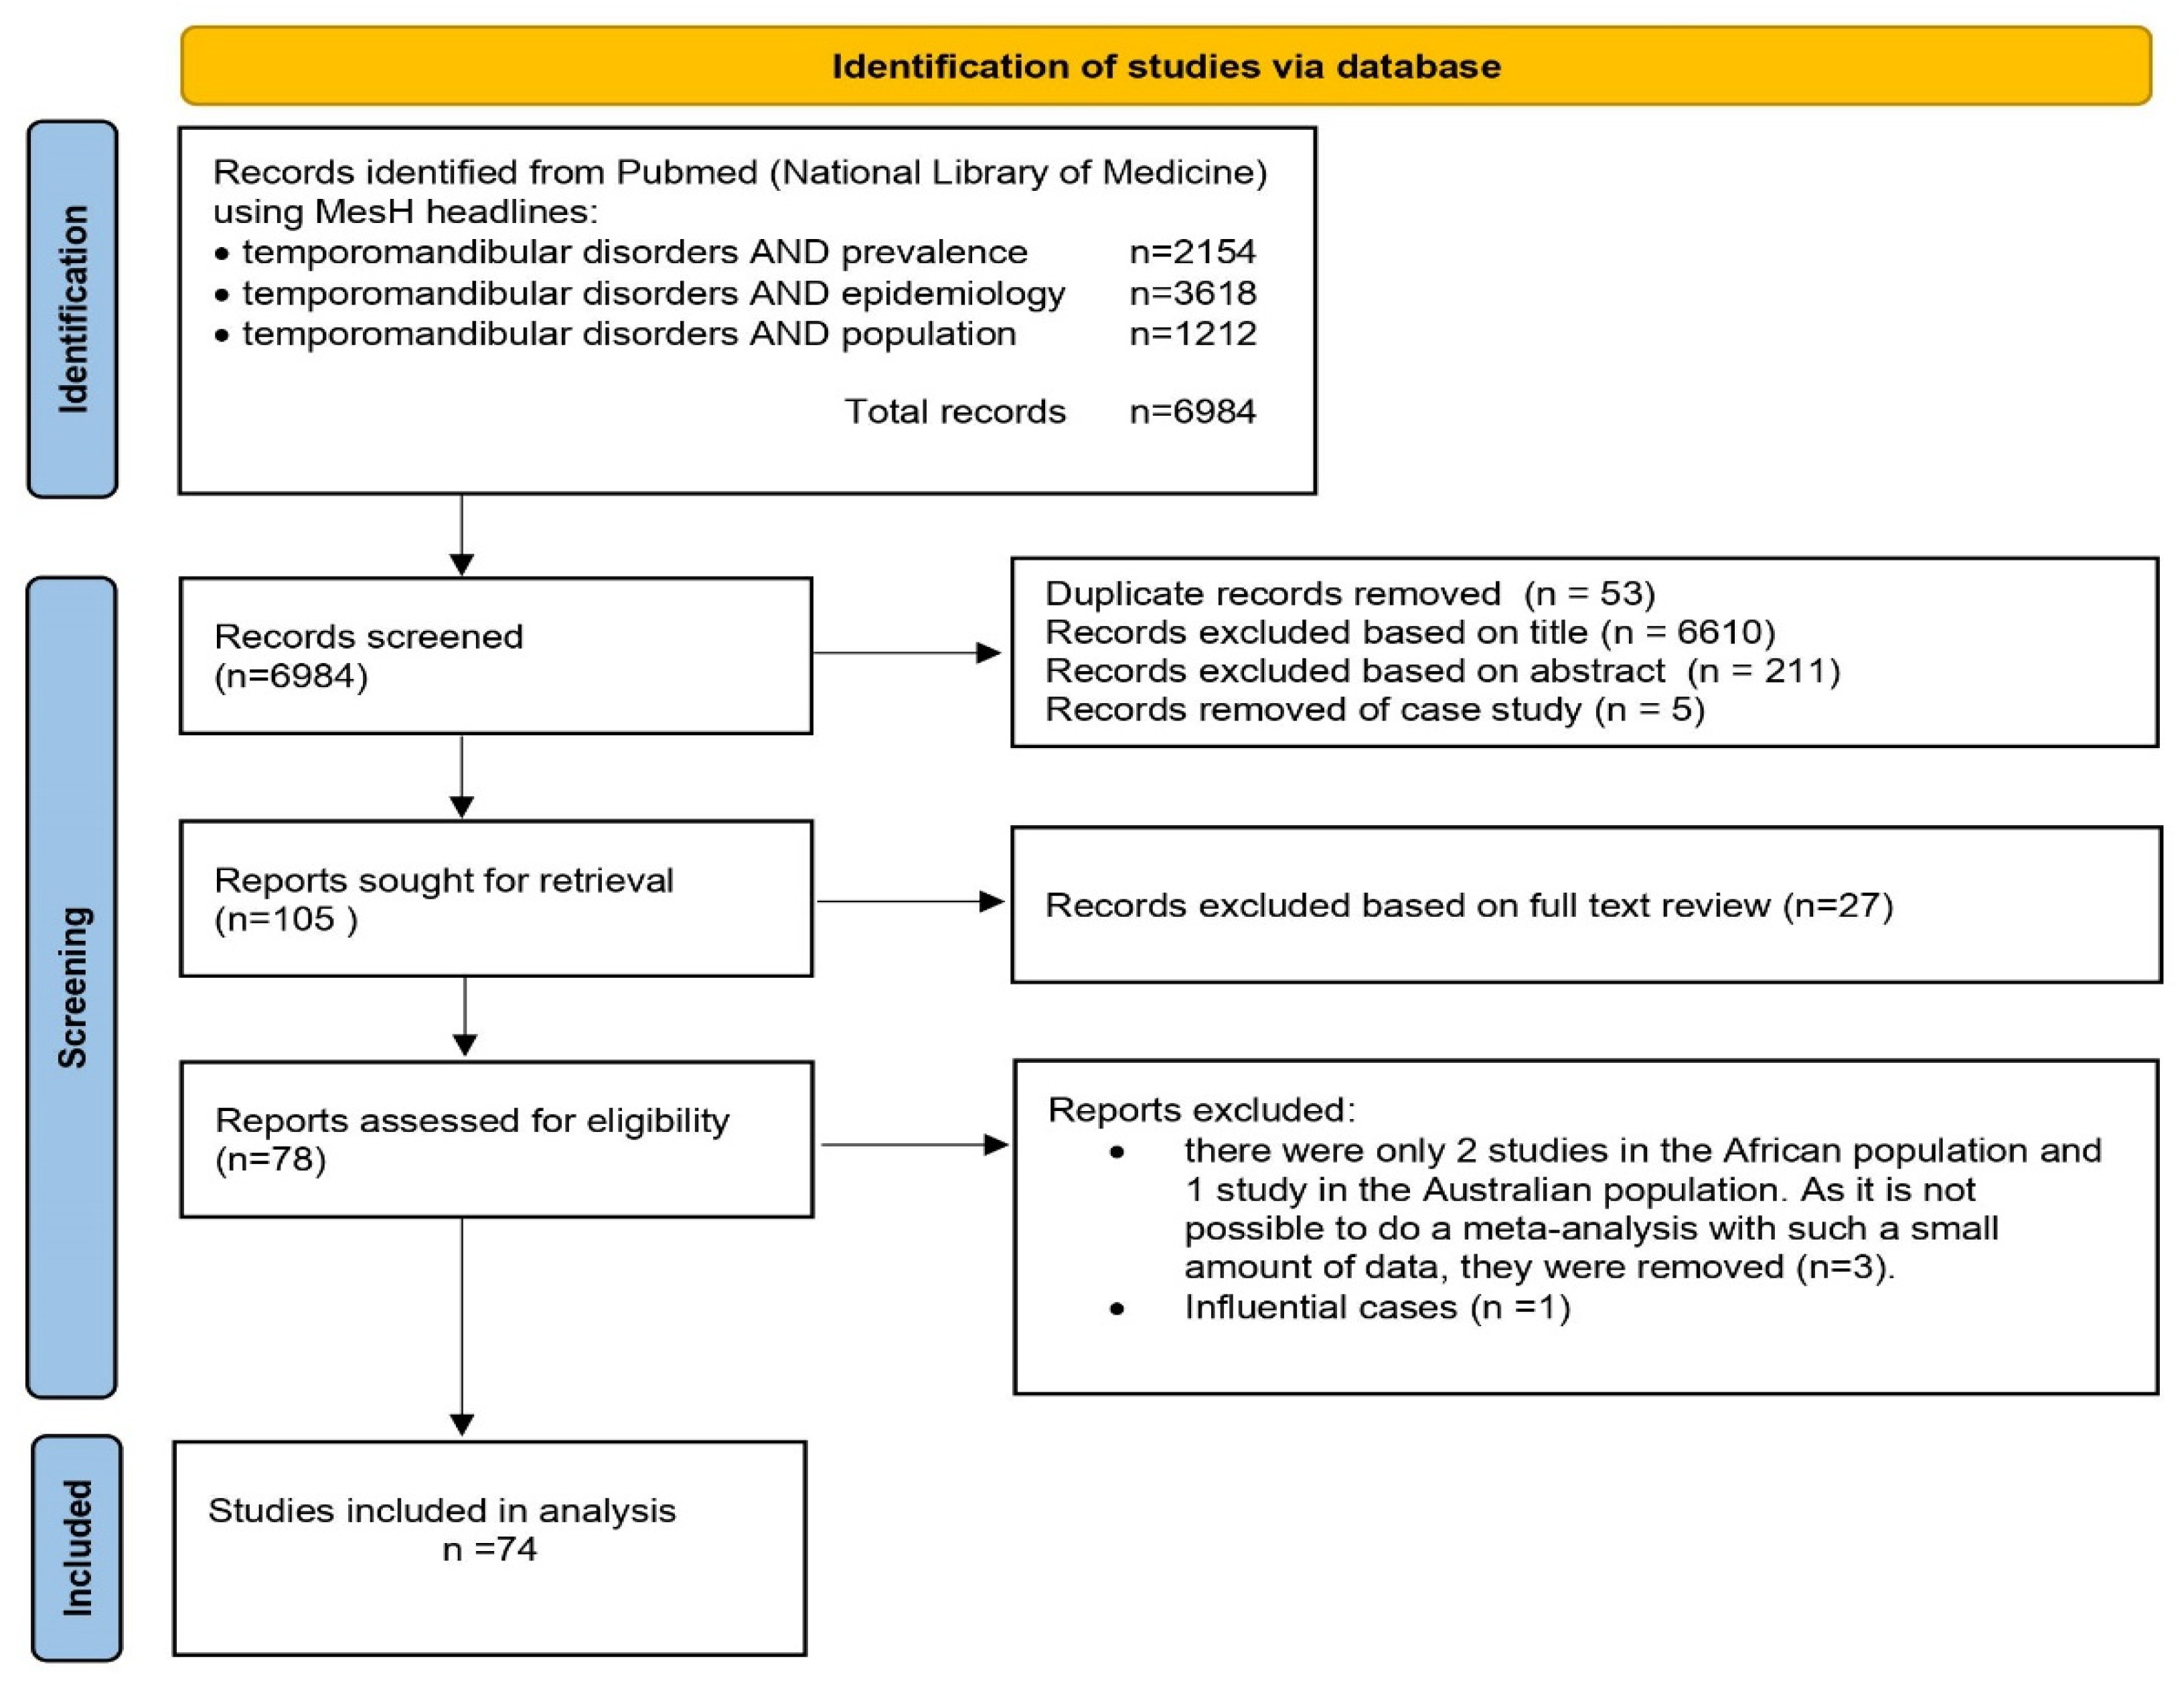
2. Materials and Methods

We conducted a systematic search and review of TMD prevalence based on articles conducted from 1 January 1994 to 1 December 2022. The starting date was chosen because it was two years after introducing the RDC/TMD questionnaire [10] (which could have allowed for standardised research on TMDs). Additionally, it is the date of the introduction of the second standardised FAI protocol [11]. This systematic review is following the PRISMA guidelines, but was not registered.
We searched PubMed (National Library of Medicine) [28,29,30,31] from 9 January to 11 June 2023 for publications using MeSH (Medical Subject Heading) terms: temporomandibular disorders AND prevalence, temporomandibular disorders AND epidemiology, temporomandibular disorders AND population. Based on the work of Valesan et al., no restrictions on age, gender, or language of publication were applied. Both painful and non-painful TMDs were accepted [22].
The review was carried out by two independent reviewers (G.Z. and B.P.-Z.), who first evaluated the titles of the papers, then the abstracts, and finally the full papers. Any disputes that arose were evaluated by M.G. A summary of the PICO [32,33] standards (population, intervention, comparison, outcome), including inclusion and exclusion criteria, is found in Table 1.
The search yielded 6984 articles on the incidence of TMDs. Each publication’s titles and abstract were reviewed, and articles that were population-based studies were included. Studies were excluded if they were case studies or involved animal studies. In this step, 78 studies were evaluated according to TQS. The study rated the good and outstanding groups based on the TQS assessed (Supplementary Material S1).
During the penultimate step of the evaluation of the 78 studies, it was noted that only 2 studies were from the African population [34,35], and 1 study was from the Australian population [36]. Because single studies for Australia and Africa were found, conducting a meta-analysis for these continents was impossible. One influential case [37] was identified during data pre-processing, and study [38] was removed from further analysis (Supplementary Material S5). Finally, 74 studies (Figure 1, Supplementary Material S2) were included, which analysed 80 populations (studies that analysed more than one population: Khan et al. analysis of TMDs incidence in Europe, North America, and South America [16], Wu et al. European and Asian populations [39], Hongxing et al. European and Asian populations [40], and De Stefano et al. European and South American populations [41]). In order to determine the age of onset of TMDs in each continent, an age classification was made as follows: “up to 18 yrs. (years)”, “18–60 yrs.” and “60+ yrs.” [42]. In addition, a study by Yekkalam and Wänman on the Swedish population was divided into two age groups (“18–60 yrs.” and “60+ yrs.”) for meta-analysis [43].

2.1. Characteristics of the Sample

Based on an earlier meta-analysis, we set the minimum sample size at 11,500 subjects [22]. The meta-analysis aimed to pool results from k = 80 studies, comprising a total of 172,239 subjects and 35,259 with TMDs as a dichotomous dependent variable. The TMD metric represented the number of individuals with TMD occurrence relative to the total number of individuals in each study (a proportion meta-analysis without a control group).
The studies are classified based on several factors:
  • Geographical region: studies were categorized by the continent where the research was conducted, including Asia, Europe, South America, and North America;
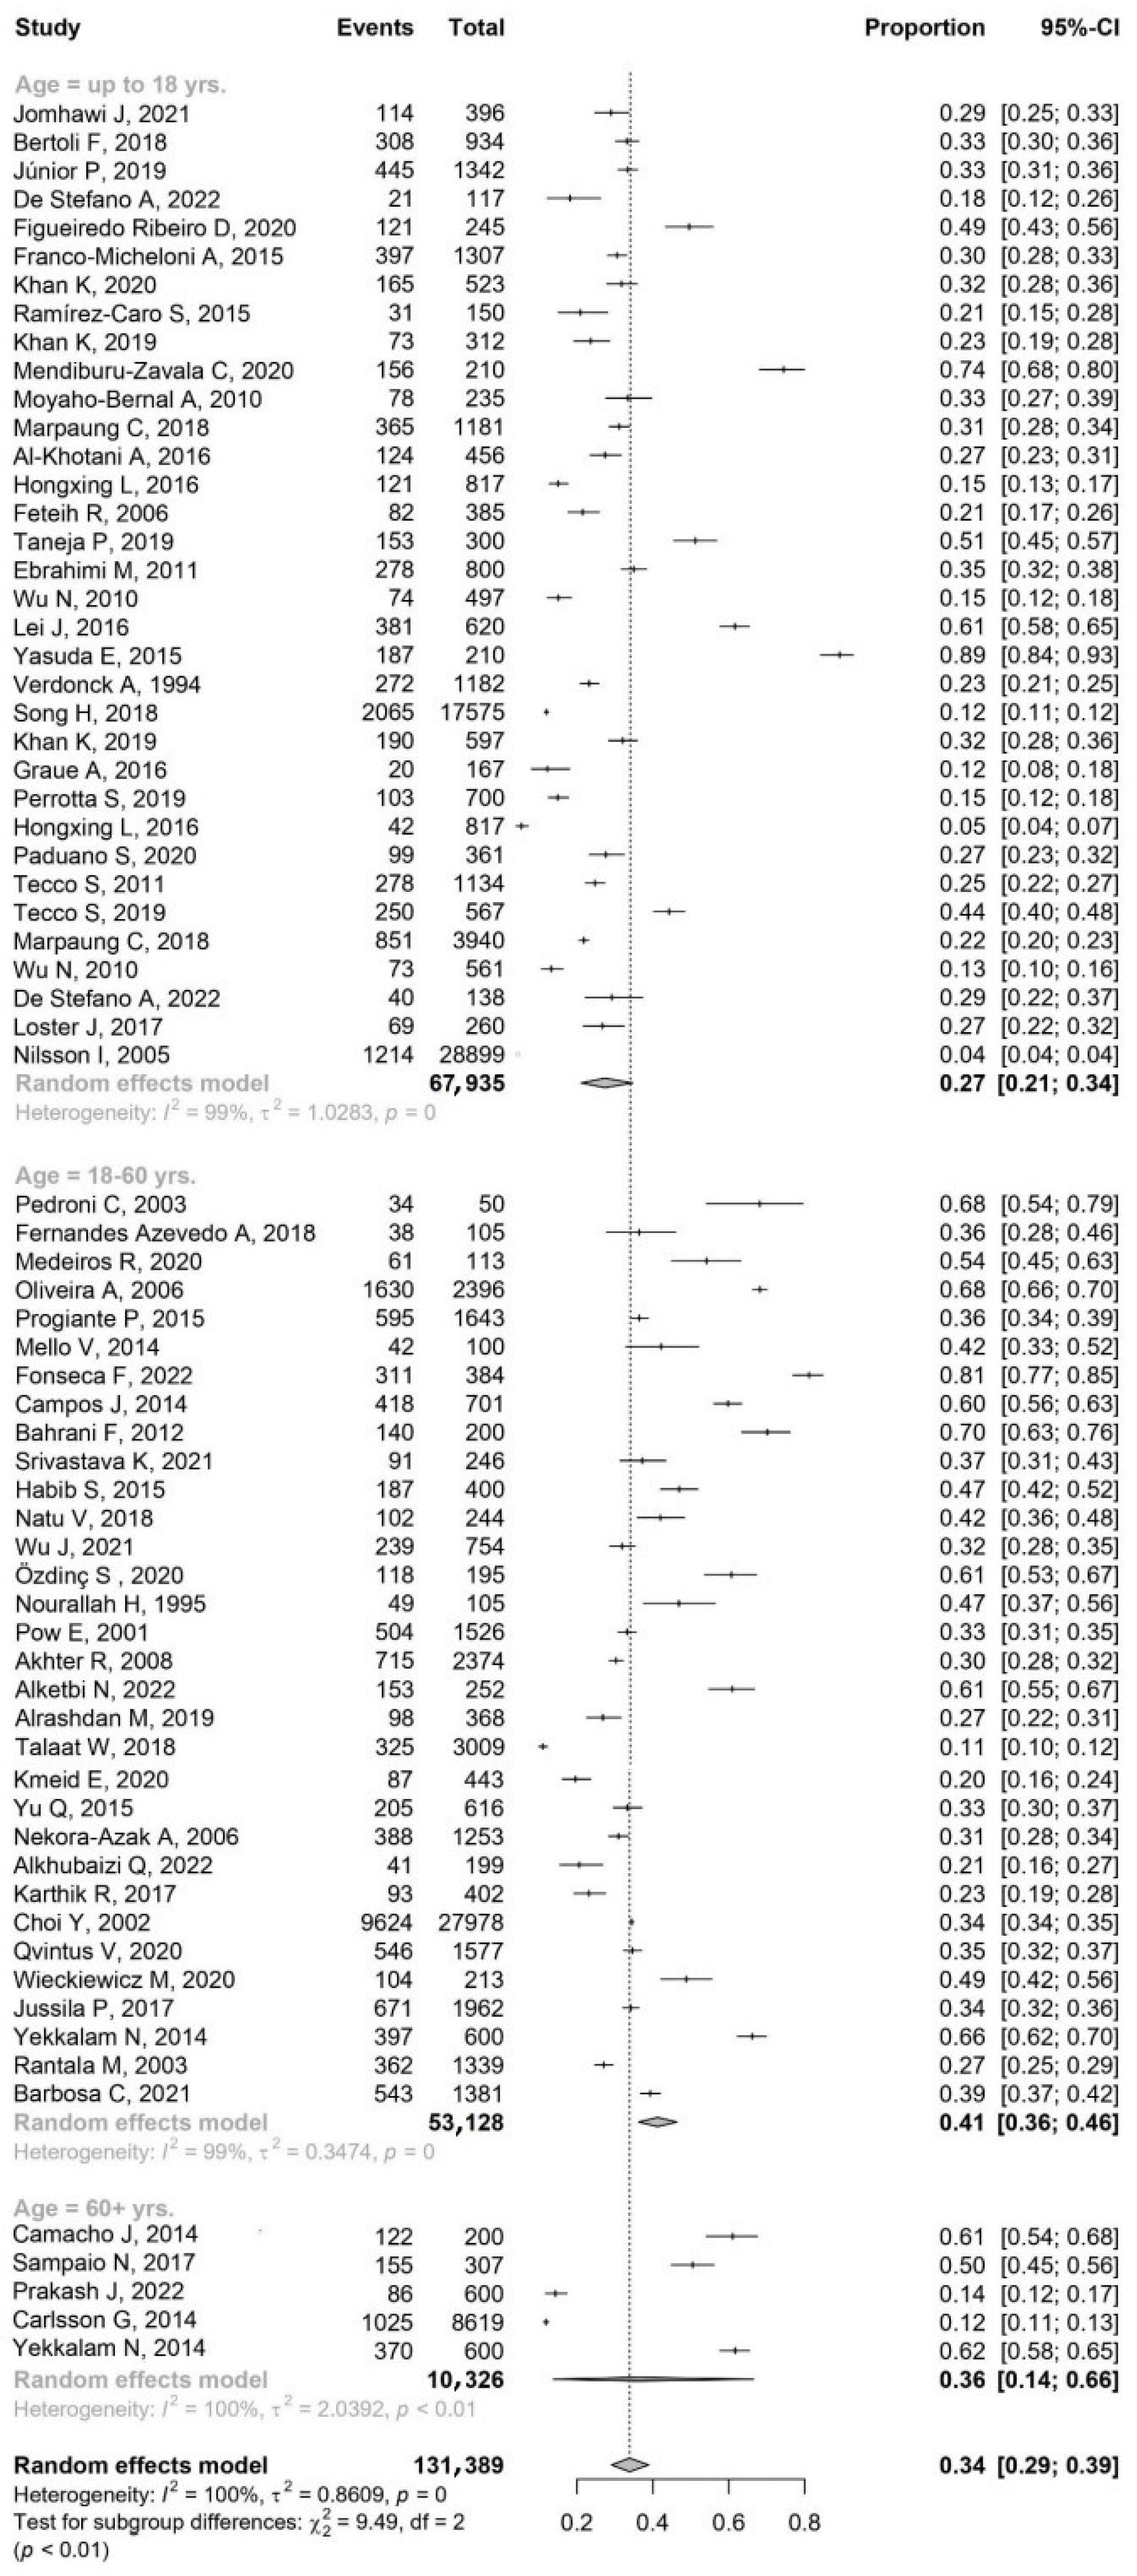
  • Age group: patient age is categorized into three distinct groups—younger patients (up to 18 yrs.), young and middle-aged patients (18–60 yrs.), older patients (over 60 yrs.);
  • Sample size: includes the overall size of the sample and the gender distribution within the sample (number of males and females).

2.2. Statistical Analysis

2.2.1. Significance Level

The significance level of the statistical tests in this analysis was set at α = 0.05.

2.2.2. Effect Size Estimation

Each study’s proportion of TMDs was computed as the ratio of MDR occurrences to the sample size. Given the non-normal distribution of these proportions, they were transformed into log ratios or log odds. The corresponding sample variance was then estimated for each study. A random effects model was applied to calculate the logit proportion across all studies, with heterogeneity (τ2) evaluated using the DerSimonian–Laird estimator [44,45], and its confidence interval was determined using the Jackson method [46].

2.2.3. Identifying Outliers and Influential Cases

Outliers were detected by ‘studentizing’ the residuals from the random effects model. Any absolute residual with a z-score exceeding 2.0 was classified as an outlier in this scenario.
To assess the influence of these outliers, we employed visual diagnostic techniques, specifically the leave-one-out method [37]. This process entailed examining each case in isolation, using metrics such as the externally standardized residual, DFFITS value, Cook’s distance, and covariance ratio. Additionally, we evaluated the leave-one-out amount of (residual) heterogeneity, the leave-one-out test statistic for (residual) heterogeneity, and DFBETAS values.

2.2.4. Subgroup Analysis

For a more granular understanding of heterogeneity, we conducted a subgroup analysis. Studies were stratified based on one or more factors under investigation. The procedure involved computing aggregate proportions and their corresponding 95% confidence intervals for each subgroup using a random effects model. Both within-study and between-study variances were estimated in this process. The inverse variance method [47] was applied to establish the weight of individual studies.
Heterogeneity within subgroups was assessed using the I2 statistic, the Q statistic, τ2, and τ. The I2 statistic and Q statistic were used to evaluate the percentage of total variation across studies due to heterogeneity rather than chance. The τ2 and τ values, representing the estimated between-study variance and standard deviation, respectively, provided further measures of heterogeneity within each subgroup. The Q statistic was also utilized to test for significant differences in effect size across the defined subgroups.
The results of the subgroup analysis were also visualized in the form of a forest plot.

2.2.5. Publication Bias

Publication bias was evaluated using a comprehensive, multi-step approach to provide a thorough and robust assessment. First, we constructed a funnel plot based on a random effects model. This graphical representation provided an intuitive way to visually assess publication bias.
Next, we used the ‘trim and fill’ method, an iterative procedure developed by Duval and Tweedie [48,49], to adjust for potential publication bias in our meta-analysis. This method seeks to identify and ‘fill’ any gaps in the funnel plot, which represent potentially missing studies due to publication bias. The imputed studies were used to recalculate a corrected pooled-effect size, providing an estimate of the effect size that might have been observed in the absence of publication bias.
Following the graphical assessment, we statistically evaluated funnel plot asymmetry using Egger’s regression test [50]. This test uses a linear regression model with the study effect sizes as the response variable and their standard errors as the predictor.
Finally, we performed the rank correlation test established by Begg and Mazumdar [51] to investigate whether there was a correlation between the effect sizes (or outcomes) and their corresponding sample variances.

2.2.6. Statistical Environment

Analyses were conducted using the R statistical language (version 4.1.1; R Core Team, 2021) on Windows 10 Pro 64 bit (build 19045), using the packages meta (version 6.0.0; [52]), weightr (version 2.0.2; [53]), report (version 0.5.7; [54]), metasens (version 1.5.0; [55]), metafor (version 3.8.1; [56]), ggplot2 (version 3.4.0; [57]), readxl (version 1.3.1; [58]), dplyr (version 1.1.2; [59]), dmetar (version 0.0.9000; [60]), and scales (version 1.2.1; [61]).

3. Results

The heterogeneity analysis of the subgroups reveals some patterns. Asia and South America display moderate between-study variance, as indicated by their τ2 values. On the other hand, Europe and North America demonstrate considerably higher between-study variance. The Q values for Europe and Asia were particularly high, underscoring the fact that the observed effect sizes within these continents deviate significantly from what could be attributed to sampling error alone. This suggested a substantial degree of variation in the studies within these regions. Moreover, the I2 values for all continents were strikingly high, nearing 100%. This indicated that almost all the variability in the effect sizes across the studies within each continent stemmed from true heterogeneity, i.e., real differences in effect size, as opposed to chance variations.
A test for subgroup differences, Q(3) = 10.54, yields a p = 0.015, denoting statistically significant differences between the continents. This suggests that geographical location might play a role in the outcome of the studies. Upon further analysis of confidence intervals, it becomes evident that the prevalence of TMDs was significantly higher in South America compared to Asia and Europe. However, no significant differences were observed among the other groups (Figure 2).
The data (Figure 3) suggested that the age group of 18–60 years has the highest proportion of TMDs, followed by the 60+ years group, and then the group up to 18 years. However, due to the large confidence interval in the 60+ years group, it was unclear if the true proportion might actually be higher or lower than the other groups.
The difference in the proportion of TMDs cases among the age groups could be influenced by the high heterogeneity within each group. The highest heterogeneity is observed in the 60+ years group, which could explain the wide confidence interval and the uncertainty around the proportion of TMDs in this age group. While the number of studies might influence the heterogeneity to some extent, it did not appear to be the primary determinant. The relatively lower heterogeneity in the 18–60 years group could contribute to a more consistent and higher proportion of TMDs observed in this group across different studies. For the group up to 18 years, the high heterogeneity might reflect the diversity of factors influencing TMDs in this young population, thus impacting the observed proportion.
A test for subgroup differences, represented as Q(2) = 9.49, p = 0.009, signified a statistically significant variation among different age brackets. This finding implied a potential influence of age on the study outcomes. On delving deeper into the confidence intervals, it becomes clear that TMDs were notably more prevalent in patients aged between 18–60 years compared to those aged 18 years and below. This marked difference underscores the potential influence of age on TMDs prevalence. However, the analysis does not indicate any significant differences when comparing other age groups (Figure 3 and Figure 4).

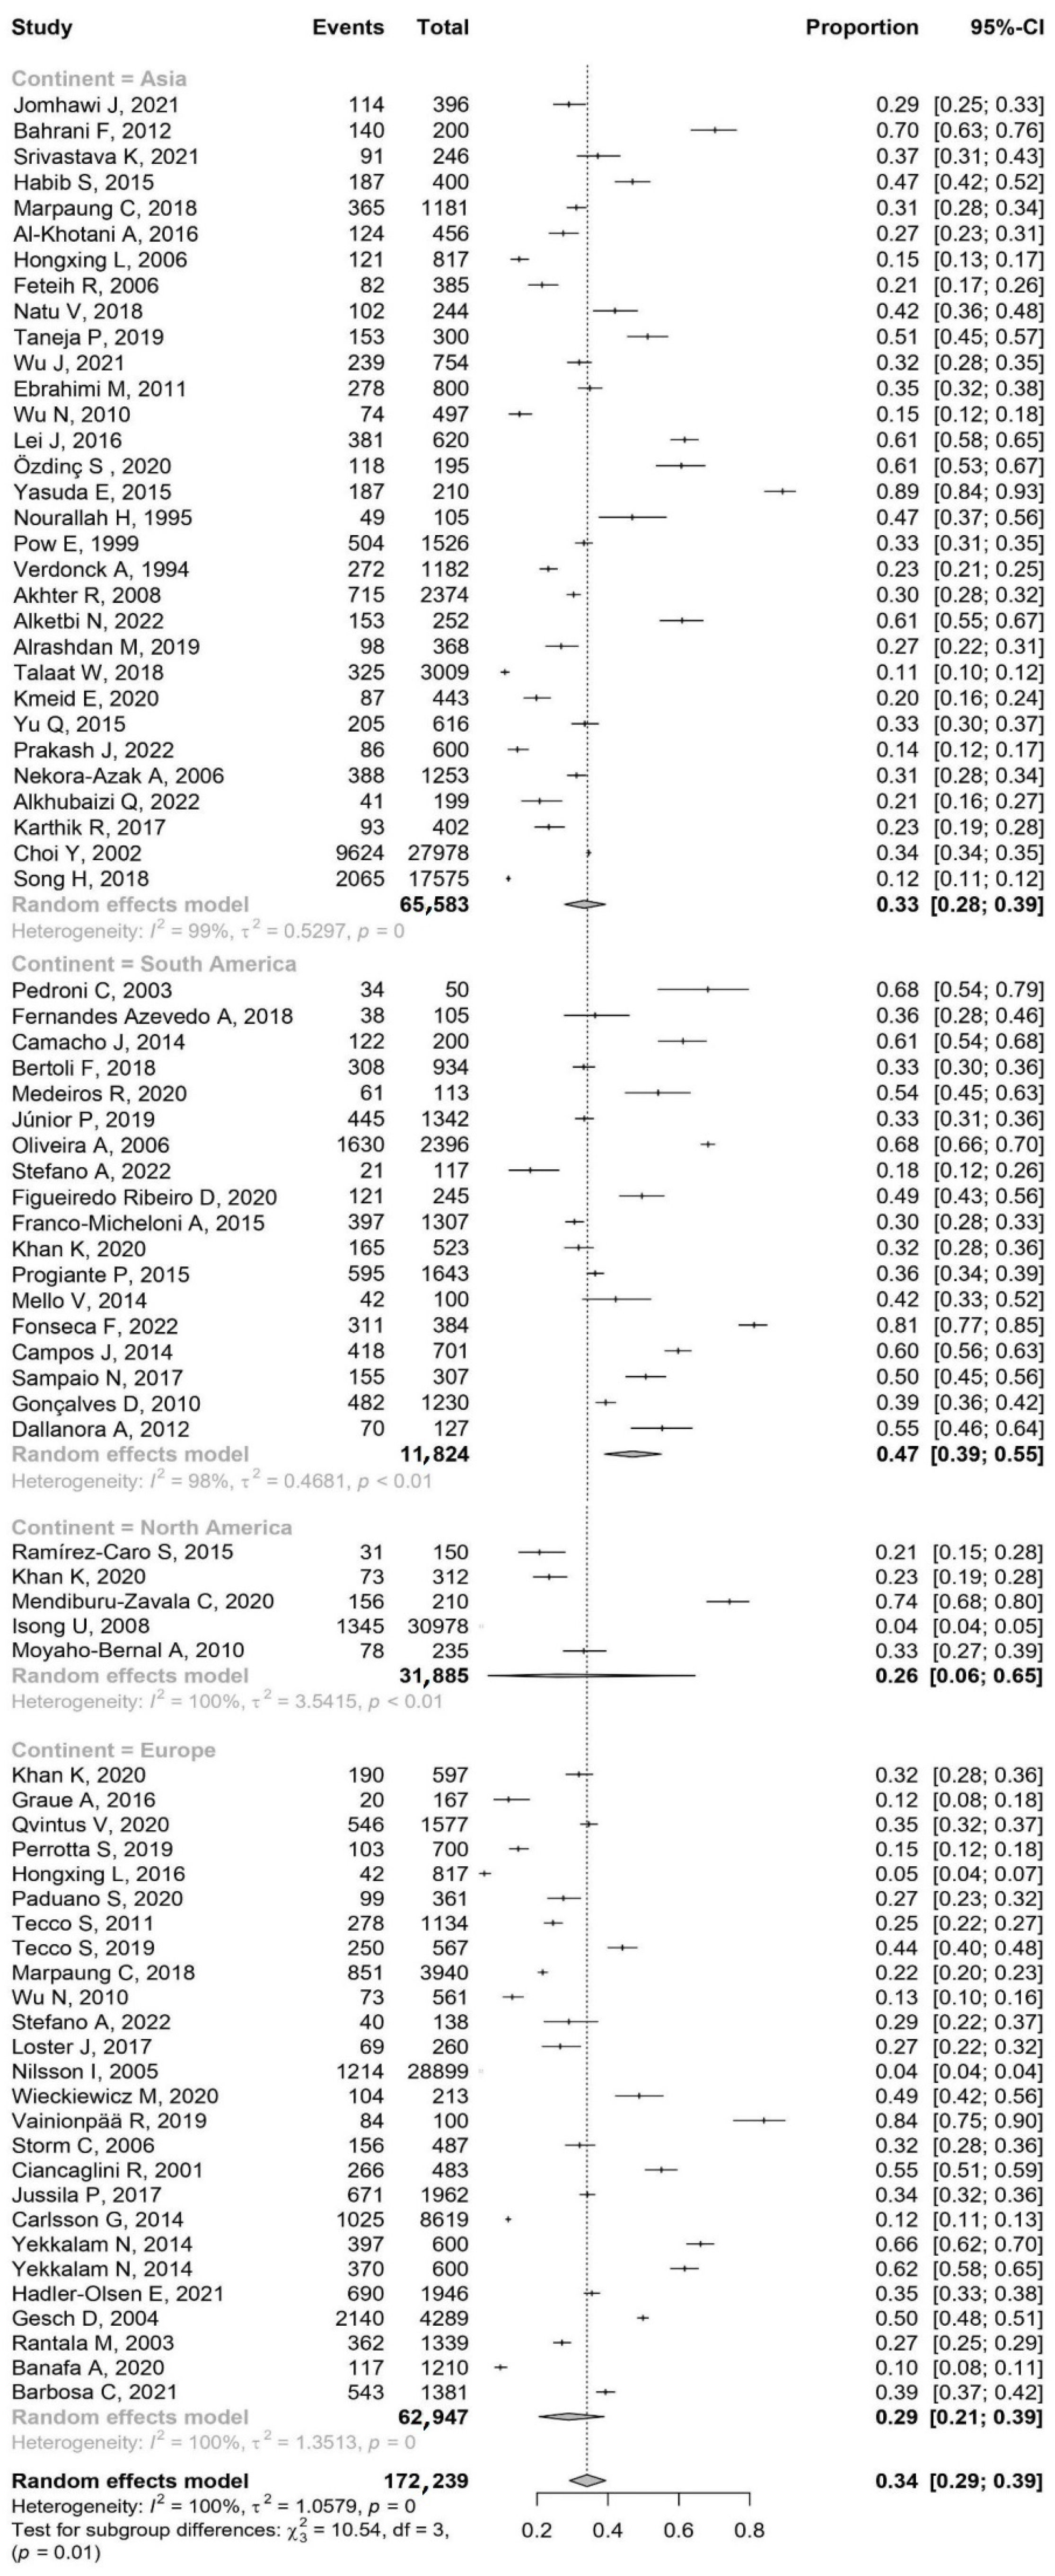
3.1. The Prevalence of TMDs by Continent and Age

3.1.1. Asia

The test for subgroup differences using a random effects model yielded a Q(2) = 2.79 between groups. The p-value for the between-group differences was 0.2483, indicating that the differences in TMDs diagnosis proportions across the age groups were not statistically significant.
The age group 18–60 showed a proportion of TMDs diagnoses close to and slightly higher than the overall mean sample proportion. The age group up to 18 also demonstrated a similar trend but with a slightly lower proportion. In contrast, the age group of 60 and above exhibited a significantly lower proportion of TMDs diagnoses than the mean sample proportion (Figure 4 and Supplementary Material S4).

3.1.2. South America

The test for subgroup differences using a random effects model yielded a Q(2) = 22.89, p < 0.001. This indicated that the differences in TMDs diagnosis proportions across the age groups were statistically significant. The proportions of TMDs diagnoses in the 18–60 yrs. and 60+ age yrs. groups were significantly higher than in the age group up to 18 years. The 18–60 age group also showed the highest variability across studies. These findings suggest that age may be an important factor influencing the prevalence of TMDs diagnoses, with more variability observed in the middle-aged group (Figure 4 and Supplementary Material S4).

3.1.3. North America

The proportion of TMDs diagnoses in the “Up to 18 years” subgroup was slightly higher than the mean sample proportion. However, the confidence interval for this age group was wider than that of the mean sample proportion, indicating a high degree of uncertainty around the estimate. This is reflected in the high τ2 value, which suggested considerable heterogeneity in the results of the individual studies within this age group (Figure 4 and Supplementary Material S4).

3.1.4. Europe

Comparing these to the mean sample proportion (0.34 with a 95% CI [0.29, 0.39]), we note: that the “up to 18” age group had a lower TMDs diagnoses proportion than the mean; the “18–60” age group had a higher TMDs diagnoses proportion than the mean; the “60+” age group, despite its lower TMDs diagnoses proportion, exhibited substantial heterogeneity.
The test for subgroup differences using a random effects model yielded a Q(2) = 8.31 with a p-value of 0.016. This indicated that the differences in TMDs diagnosis proportions across the age groups were statistically significant. Based on the confidence intervals, there was a significantly lower proportion of TMDs in the up to 18 years compared with 18–60 yrs. (Figure 4 and Supplementary Material S4).

3.1.5. Prevalence of TMDs Female-to-Male Ratio (F:M)

From the data presented, we observed that for each continent, the size of the female group was larger than the male group by an average of 9% to 56%. The highest F:M was reported in South America (1.56). Conversely, Europe reported the lowest F:M (1.09), suggesting a near-equal distribution of males and females. However, the Kruskal–Wallis test, a non-parametric method used to compare two or more independent samples of equal or different sample sizes, yielded a p-value of 0.286.
An extended description of the results is available in the Supplementary Material S3.

4. Discussion

The present meta-analysis aims to evaluate the proportion of individuals with TMDs across various studies, considering geographical region, patient age, and sample size. The incidence of TMDs in the world population was 34% (Asia—33%, South America—47%, North America—26%, Europe—29%). The sheer number of TMDs incidences in the population underlines the importance of this disease entity. It represents an important economic and social problem. Further research into its diagnosis and therapy is important.
As for the age distribution, in the group “up to 18 yrs.”—27%, “18–60 yrs.”—41% and in the group “60+ yrs.”—36%. According to the meta-analysis by Valesan et al., it was approximately 31% for adults/elderly and 11% for children/adolescents [22]. Our meta-analysis’s results were similar to Valesan et al.’s observations. According to the meta-analysis by Minervini et al., the prevalence of TMDs in children and adolescents (subjects evaluated aged 8–19 years) varies between 20% and 60% [23]. In our area, up to the age of 18 years, the average prevalence of TMDs was 27% (Asia—32%, South America—33%, North America—37%, Europe 18%). The average prevalence of TMDs and the results for Asia, South America, and North America fall within the range defined by Minervini et al. [23]. The meta-analysis by Melo et al. aimed to assess the prevalence of TMDs in the Brazilian population. They found that the prevalence of TMDs was 33.6% [24]. Our analysis was 47%, but other South American countries were included. The meta-analysis by Xie et al. showed that the prevalence of TMDs in Chinese students was approximately 29.1% [25]. The age group of students is the group over 18 years old. In our study, it was the 18–60 yrs. group and their results for Asia were 35%. Considering that the 18–60 yrs. group includes not only students but also working people, this result can be considered similar to the work of Xie et al. The results we obtained, which are consistent with the above meta-analyses, may suggest the effectiveness of TQS in trial evaluation.
A result that is particularly noteworthy is the prevalence of TMDs in South America, at 47% (“up to 18 yrs.”—33%, “18–60 yrs.”—56%, “60+ yrs.”—56%). This result raises further research questions about the relationship of TMDs to either geographic region, cultural or anthropometric features. To date, the evidence has been unclear that cultural, geographic, socioeconomic, and gender factors contribute to the impact of altered masticatory function [62]. Our results demonstrate that the geographic factor is important in the occurrence of TMDs. We observed a higher prevalence of TMDs in women. This confirms previous scientific studies and the results of meta-analyses [22,23,24,25].
The higher prevalence of TMDs in South America may be related to sociodemographic [63], and psychosocial [8,64] factors. The prevalence of TMDs has also been associated with genetic factors [65]. However, further research is needed to find a factor directly related to the observed higher prevalence of TMDs in South America.
Warren and Fried suggest that the sex and age distribution of TMDs suggests a possible link between its pathogenesis and the female hormonal axis [66]. A study by Jedynak et al. suggests that extended female endocrine dysfunction may be associated with TMDs [67]. The observations in this meta-analysis associated with a higher prevalence of TMDs in women may be related to endocrine function. However, further research is needed.
A limitation of the present meta-analysis is that there is no breakdown of the types of TMDs (including joint pain, disc displacement, and osteoarthritis). This is because not every research method and study itself defines this division. This is the problem of epidemiological research on TMDs. This problem may be due to the different research tools, which, despite the high results obtained in the TQS, should be standardized in future studies with one specific tool. The second limitation is that our meta-analyses do not distinguish between painful and non-painful forms of the dysfunction. This means that we cannot speculate about the need and method for treatment. The third limitation is the lack of analysis of the incidence of TMDs in Africa and Australia. The lack of research in this area makes conducting a broader data analysis and objective conclusions impossible. Therefore, future studies should focus on the incidence in these two continents.

5. Conclusions

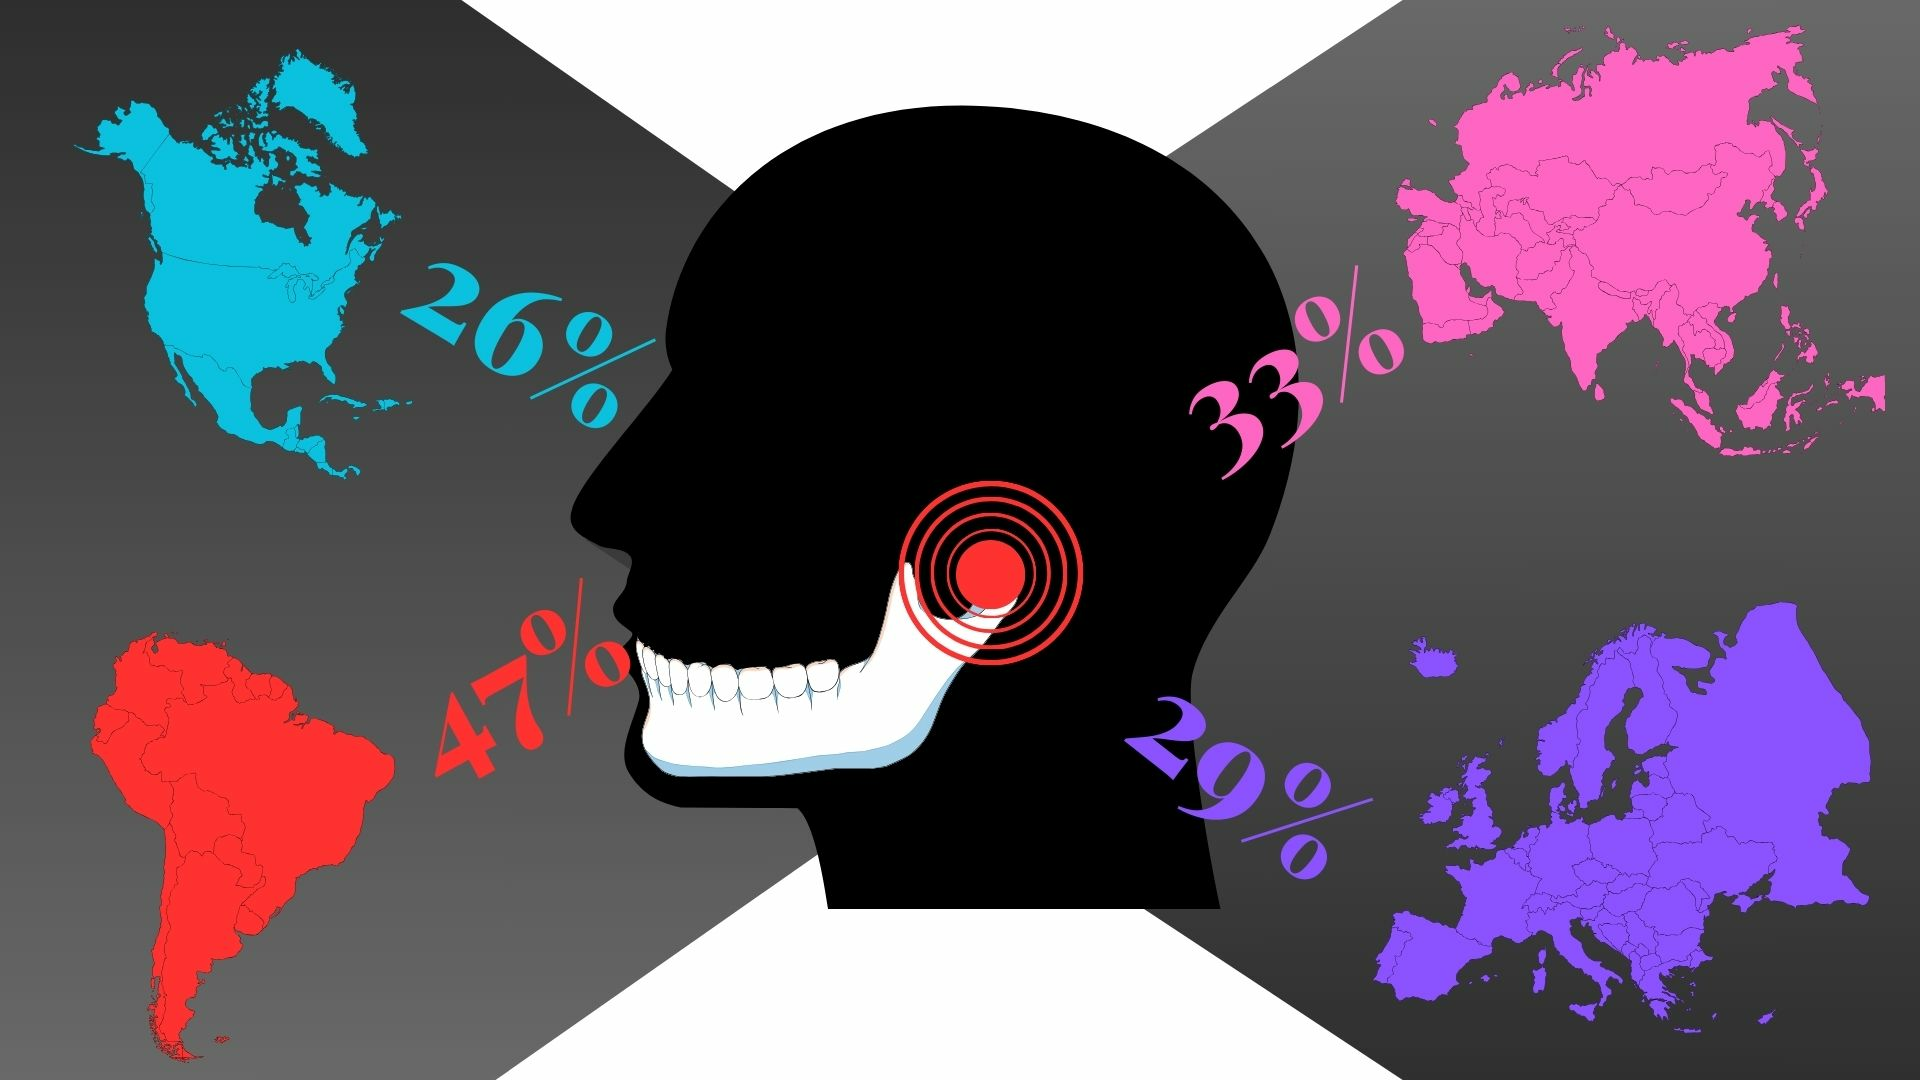
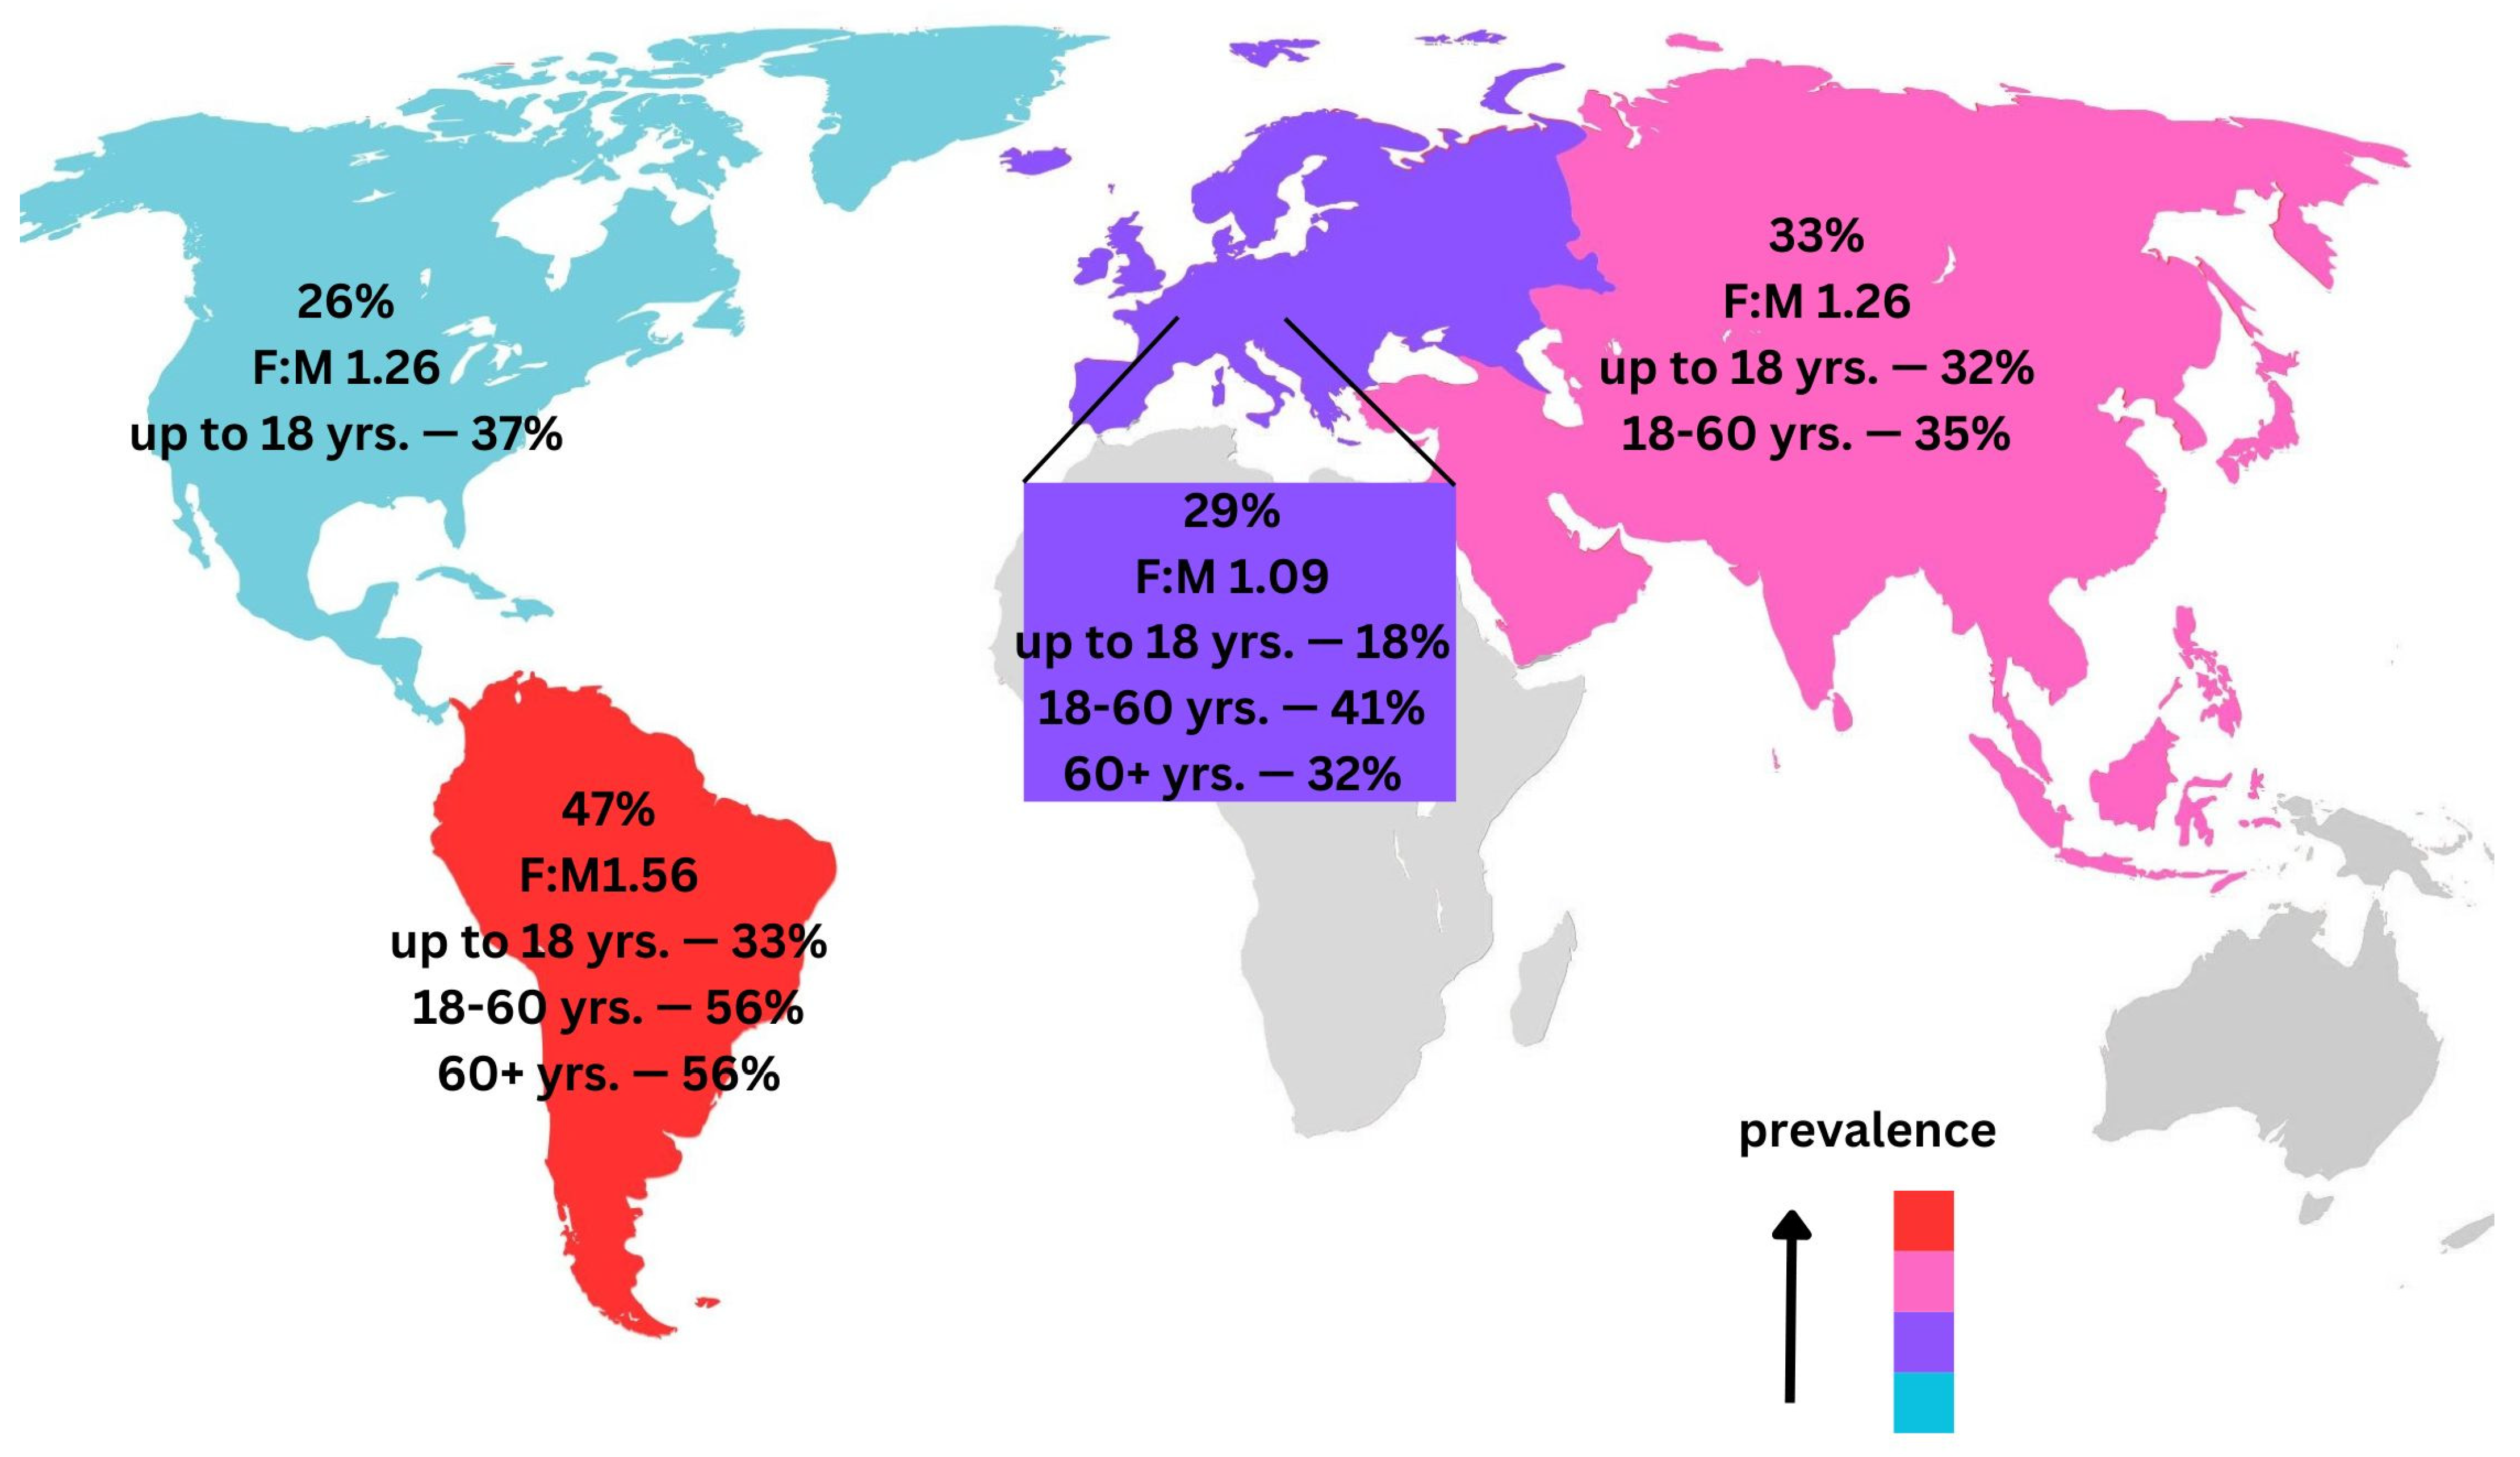
  • This study suggests that geographical location may play a role in the epidemiology of TMDs. The prevalence of TMDs was significantly higher in South America (47%) compared to Asia (33%) and Europe (29%).
  • This study suggests a higher incidence of TMDs in females compared to males in these age groups compared to the 18–60 age group.
  • From the data presented, the female group was, on average, 9% to 56% larger than the male group in each continent. The highest female-to-male ratio was reported in South America (1.56), whereas the lowest F:M was reported in Europe (1.09), suggesting an almost equal distribution of males and females.
  • Larger epidemiological studies of TMDs in African and Australian populations are recommended.
  • In conclusion, both visual and statistical assessments suggest that the results of our meta-analysis are robust and unlikely to be significantly affected by publication bias.

Supplementary Materials

The following supporting information can be downloaded at: https://www.mdpi.com/article/10.3390/jcm13051365/s1, Supplementary Material S1: Total Quality Score result of the analysed papers; Supplementary Material S2: List of 74 studies included the meta-analysis; Supplementary Material S3: An extended description of the materials and methods, results; Supplementary Material S4: The meta-analysis results by forest plot; Supplementary Material S5: Rejected studies from the meta-analysis.

Author Contributions

Conceptualization, G.Z.; methodology, G.Z.; formal analysis, G.Z.; investigation, G.Z. and B.P.-Z.; data curation, G.Z.; writing—original draft preparation, G.Z.; writing—review and editing, G.Z., B.P.-Z. and M.G.; visualization, G.Z.; supervision, M.G.; project administration, G.Z.; funding acquisition, G.Z. All authors have read and agreed to the published version of the manuscript.

Funding

This research received no external funding.

Institutional Review Board Statement

Not applicable.

Informed Consent Statement

Not applicable.

Data Availability Statement

Not applicable.

Conflicts of Interest

The authors declare no conflicts of interest.

References

  1. List, T.; Jensen, R.H. Temporomandibular Disorders: Old Ideas and New Concepts. Cephalalgia Int. J. Headache 2017, 37, 692–704. [Google Scholar] [CrossRef]
  2. Maini, K.; Dua, A. Temporomandibular Syndrome. In StatPearls; StatPearls Publishing: Treasure Island, FL, USA, 2023. [Google Scholar]
  3. Manfredini, D. Tinnitus in Temporomandibular Disorders Patients: Any Clinical Implications from Research Findings? Evid. Based Dent. 2019, 20, 30–31. [Google Scholar] [CrossRef]
  4. Al-Jewair, T.; Shibeika, D.; Ohrbach, R. Temporomandibular Disorders and Their Association with Sleep Disorders in Adults: A Systematic Review. J. Oral Facial Pain Headache 2021, 35, 41–53. [Google Scholar] [CrossRef]
  5. Liou, Y.-J.; Bai, Y.-M.; Tsai, S.-J.; Chen, T.-J.; Chen, M.-H.; Lo, W.-L. Bidirectional Associations of Temporomandibular Joint Disorders with Major Depressive and Anxiety Disorders. J. Evid.-Based Dent. Pract. 2023, 23, 101860. [Google Scholar] [CrossRef]
  6. Matheus, H.R.; Özdemir, Ş.D.; Guastaldi, F.P.S. Stem Cell-Based Therapies for Temporomandibular Joint Osteoarthritis and Regeneration of Cartilage/Osteochondral Defects: A Systematic Review of Preclinical Experiments. Osteoarthr. Cartil. 2022, 30, 1174–1185. [Google Scholar] [CrossRef]
  7. Garstka, A.A.; Kozowska, L.; Kijak, K.; Brzózka, M.; Gronwald, H.; Skomro, P.; Lietz-Kijak, D. Accurate Diagnosis and Treatment of Painful Temporomandibular Disorders: A Literature Review Supplemented by Own Clinical Experience. Pain Res. Manag. 2023, 2023, 1002235. [Google Scholar] [CrossRef] [PubMed]
  8. Chisnoiu, A.M.; Picos, A.M.; Popa, S.; Chisnoiu, P.D.; Lascu, L.; Picos, A.; Chisnoiu, R. Factors Involved in the Etiology of Temporomandibular Disorders—A Literature Review. Clujul Med. 2015, 88, 473–478. [Google Scholar] [CrossRef]
  9. Schiffman, E.; Ohrbach, R.; Truelove, E.; Look, J.; Anderson, G.; Goulet, J.-P.; List, T.; Svensson, P.; Gonzalez, Y.; Lobbezoo, F.; et al. Diagnostic Criteria for Temporomandibular Disorders (DC/TMD) for Clinical and Research Applications: Recommendations of the International RDC/TMD Consortium Network* and Orofacial Pain Special Interest Group†. J. Oral Facial Pain Headache 2014, 28, 6–27. [Google Scholar] [CrossRef] [PubMed]
  10. Dworkin, S.F.; LeResche, L. Research Diagnostic Criteria for Temporomandibular Disorders: Review, Criteria, Examinations and Specifications, Critique. J. Craniomandib. Disord. Facial Oral Pain 1992, 6, 301–355. [Google Scholar]
  11. Fonseca, D.M.d.; Bonfante, G.; do Valle, A.L.; Freitas, S.F.T. de Diagnóstico pela anamnese da disfunção craniomandibular. RGO Porto Alegre 1994, 42, 23–28. [Google Scholar]
  12. Pires, P.F.; de Castro, E.M.; Pelai, E.B.; de Arruda, A.B.C.; Rodrigues-Bigaton, D. Analysis of the Accuracy and Reliability of the Short-Form Fonseca Anamnestic Index in the Diagnosis of Myogenous Temporomandibular Disorder in Women. Braz. J. Phys. Ther. 2018, 22, 276–282. [Google Scholar] [CrossRef]
  13. Helkimo, M. Studies on Function and Dysfunction of the Masticatory System. II. Index for Anamnestic and Clinical Dysfunction and Occlusal State. Sven. Tandlak. Tidskr. Swed. Dent. J. 1974, 67, 101–121. [Google Scholar]
  14. Giannakopoulos, N.N.; Rammelsberg, P.; Eberhard, L.; Schmitter, M. A New Instrument for Assessing the Quality of Studies on Prevalence. Clin. Oral Investig. 2012, 16, 781–788. [Google Scholar] [CrossRef]
  15. Figueiredo Ribeiro, D.C.; Ferreira Gradella, C.M.; Franco Rocha Rodrigues, L.L.; Abanto, J.; Oliveira, L.B. The Impact of Temporomandibular Disorders on the Oral Health-Related Quality of Life of Brazilian Children: A Cross-Sectional Study. J. Dent. Child. Chic. Ill 2020, 87, 103–109. [Google Scholar]
  16. Khan, K.; Muller-Bolla, M.; Anacleto Teixeira Junior, O.; Gornitsky, M.; Guimarães, A.S.; Velly, A.M. Comorbid Conditions Associated with Painful Temporomandibular Disorders in Adolescents from Brazil, Canada and France: A Cross-Sectional Study. J. Oral Rehabil. 2020, 47, 417–424. [Google Scholar] [CrossRef] [PubMed]
  17. Marpaung, C.; van Selms, M.K.A.; Lobbezoo, F. Prevalence and Risk Indicators of Pain-Related Temporomandibular Disorders among Indonesian Children and Adolescents. Community Dent. Oral Epidemiol. 2018, 46, 400–406. [Google Scholar] [CrossRef] [PubMed]
  18. Perrotta, S.; Bucci, R.; Simeon, V.; Martina, S.; Michelotti, A.; Valletta, R. Prevalence of Malocclusion, Oral Parafunctions and Temporomandibular Disorder-Pain in Italian Schoolchildren: An Epidemiological Study. J. Oral Rehabil. 2019, 46, 611–616. [Google Scholar] [CrossRef] [PubMed]
  19. Yap, A.U.; Zhang, M.-J.; Lei, J.; Fu, K.-Y. Diagnostic Accuracy of the Short-Form Fonseca Anamnestic Index in Relation to the Diagnostic Criteria for Temporomandibular Disorders. J. Prosthet. Dent. 2022, 128, 977–983. [Google Scholar] [CrossRef] [PubMed]
  20. Yap, A.U.; Zhang, M.J.; Lei, J.; Fu, K.-Y. Accuracy of the Fonseca Anamnestic Index for Identifying Pain-Related and/or Intra-Articular Temporomandibular Disorders. Cranio J. Craniomandib. Pract. 2021, 14, 1–8. [Google Scholar] [CrossRef] [PubMed]
  21. Stasiak, G.; Maracci, L.M.; de Oliveira Chami, V.; Pereira, D.D.; Tomazoni, F.; Bernardon Silva, T.; Ferrazzo, V.; Marquezan, M. TMD Diagnosis: Sensitivity and Specificity of the Fonseca Anamnestic Index. Cranio J. Craniomandib. Pract. 2023, 41, 199–203. [Google Scholar] [CrossRef]
  22. Valesan, L.F.; Da-Cas, C.D.; Réus, J.C.; Denardin, A.C.S.; Garanhani, R.R.; Bonotto, D.; Januzzi, E.; de Souza, B.D.M. Prevalence of Temporomandibular Joint Disorders: A Systematic Review and Meta-Analysis. Clin. Oral Investig. 2021, 25, 441–453. [Google Scholar] [CrossRef]
  23. Minervini, G.; Franco, R.; Marrapodi, M.M.; Fiorillo, L.; Cervino, G.; Cicciù, M. Prevalence of Temporomandibular Disorders in Children and Adolescents Evaluated with Diagnostic Criteria for Temporomandibular Disorders: A Systematic Review with Meta-Analysis. J. Oral Rehabil. 2023, 50, 522–530. [Google Scholar] [CrossRef]
  24. Melo, V.; Monteiro, L.; Orge, C.; Sales, M.; Melo, J.; Rodrigues, B.; Melo, A. Prevalence of Temporomandibular Disorders in the Brazilian Population: A Systematic Review and Meta-Analysis. Cranio J. Craniomandib. Pract. 2023, 13, 1–8. [Google Scholar] [CrossRef] [PubMed]
  25. Xie, C.; Lin, M.; Yang, H.; Ren, A. Prevalence of Temporomandibular Disorders and Its Clinical Signs in Chinese Students, 1979–2017: A Systematic Review and Meta-Analysis. Oral Dis. 2019, 25, 1697–1706. [Google Scholar] [CrossRef] [PubMed]
  26. Fawcett, E.J.; Power, H.; Fawcett, J.M. Women Are at Greater Risk of OCD Than Men: A Meta-Analytic Review of OCD Prevalence Worldwide. J. Clin. Psychiatry 2020, 81, 19r13085. [Google Scholar] [CrossRef] [PubMed]
  27. Alene, K.A.; Wagaw, Z.A.; Clements, A.C.A. Mapping Tuberculosis Prevalence in Ethiopia: Protocol for a Geospatial Meta-Analysis. BMJ OPEN 2020, 10, e034704. [Google Scholar] [CrossRef] [PubMed]
  28. Booth, A. Over 85% of Included Studies in Systematic Reviews Are on MEDLINE. J. Clin. Epidemiol. 2016, 79, 165–166. [Google Scholar] [CrossRef] [PubMed]
  29. Halladay, C.W.; Trikalinos, T.A.; Schmid, I.T.; Schmid, C.H.; Dahabreh, I.J. Using Data Sources beyond PubMed Has a Modest Impact on the Results of Systematic Reviews of Therapeutic Interventions. J. Clin. Epidemiol. 2015, 68, 1076–1084. [Google Scholar] [CrossRef] [PubMed]
  30. Holden, B.A.; Fricke, T.R.; Wilson, D.A.; Jong, M.; Naidoo, K.S.; Sankaridurg, P.; Wong, T.Y.; Naduvilath, T.J.; Resnikoff, S. Global Prevalence of Myopia and High Myopia and Temporal Trends from 2000 through 2050. Ophthalmology 2016, 123, 1036–1042. [Google Scholar] [CrossRef]
  31. Rice, D.B.; Kloda, L.A.; Levis, B.; Qi, B.; Kingsland, E.; Thombs, B.D. Are MEDLINE Searches Sufficient for Systematic Reviews and Meta-Analyses of the Diagnostic Accuracy of Depression Screening Tools? A Review of Meta-Analyses. J. Psychosom. Res. 2016, 87, 7–13. [Google Scholar] [CrossRef]
  32. Brown, D. A Review of the PubMed PICO Tool: Using Evidence-Based Practice in Health Education. Health Promot. Pract. 2020, 21, 496–498. [Google Scholar] [CrossRef] [PubMed]
  33. Stone, P.W. Popping the (PICO) Question in Research and Evidence-Based Practice. Appl. Nurs. Res. 2002, 15, 197–198. [Google Scholar] [CrossRef]
  34. Adegbiji, W.A.; Olajide, G.T.; Agbesanwa, A.T.; Banjo, O.O. Otological Manifestation of Temporomandibular Joint Disorder in Ekiti, a Sub-Saharan African Country. J. Int. Med. Res. 2021, 49, 300060521996517. [Google Scholar] [CrossRef]
  35. Friedman Rubin, P.; Erez, A.; Peretz, B.; Birenboim-Wilensky, R.; Winocur, E. Prevalence of Bruxism and Temporomandibular Disorders among Orphans in Southeast Uganda: A Gender and Age Comparison. CRANIO® 2018, 36, 243–249. [Google Scholar] [CrossRef]
  36. Lung, J.; Bell, L.; Heslop, M.; Cuming, S.; Ariyawardana, A. Prevalence of Temporomandibular Disorders among a Cohort of University Undergraduates in Australia. J. Investig. Clin. Dent. 2018, 9, e12341. [Google Scholar] [CrossRef]
  37. Viechtbauer, W.; Cheung, M.W.-L. Outlier and Influence Diagnostics for Meta-Analysis. Res. Synth. Methods 2010, 1, 112–125. [Google Scholar] [CrossRef]
  38. Zwiri, A.M.A.; Al-Omiri, M.K. Prevalence of Temporomandibular Joint Disorder among North Saudi University Students. CRANIO® 2016, 34, 176–181. [Google Scholar] [CrossRef]
  39. Marpaung, C.; Lobbezoo, F.; van Selms, M.K.A. Temporomandibular Disorders among Dutch Adolescents: Prevalence and Biological, Psychological, and Social Risk Indicators. Pain Res. Manag. 2018, 2018, e5053709. [Google Scholar] [CrossRef]
  40. Hongxing, L.; Astrøm, A.N.; List, T.; Nilsson, I.-M.; Johansson, A. Prevalence of Temporomandibular Disorder Pain in Chinese Adolescents Compared to an Age-Matched Swedish Population. J. Oral Rehabil. 2016, 43, 241–248. [Google Scholar] [CrossRef]
  41. De Stefano, A.A.; Guercio-Mónaco, E.; Uzcátegui, A.; Boboc, A.M.; Barbato, E.; Galluccio, G. Temporomandibular Disorders in Venezuelan and Italian Adolescents. CRANIO® 2022, 40, 517–523. [Google Scholar] [CrossRef] [PubMed]
  42. Guarda-Nardini, L.; Piccotti, F.; Mogno, G.; Favero, L.; Manfredini, D. Age-Related Differences in Temporomandibular Disorder Diagnoses. Cranio J. Craniomandib. Pract. 2012, 30, 103–109. [Google Scholar] [CrossRef]
  43. Yekkalam, N.; Wänman, A. Prevalence of Signs and Symptoms Indicative of Temporomandibular Disorders and Headaches in 35-, 50-, 65- and 75-Year-Olds Living in Västerbotten, Sweden. Acta Odontol. Scand. 2014, 72, 458–465. [Google Scholar] [CrossRef]
  44. DerSimonian, R.; Laird, N. Meta-Analysis in Clinical Trials. Control. Clin. Trials 1986, 7, 177–188. [Google Scholar] [CrossRef] [PubMed]
  45. Raudenbush, S.W. Analyzing Effect Sizes: Random-Effects Models. In The handbook of Research Synthesis and Meta-Analysis, 2nd ed.; Russell Sage Foundation: New York, NY, USA, 2009; pp. 295–315. ISBN 978-0-87154-163-5. [Google Scholar]
  46. Jackson, D. Confidence Intervals for the between-Study Variance in Random Effects Meta-Analysis Using Generalised Cochran Heterogeneity Statistics. Res. Synth. Methods 2013, 4, 220–229. [Google Scholar] [CrossRef] [PubMed]
  47. Higgins, J.P.T.; Thompson, S.G. Quantifying Heterogeneity in a Meta-analysis. Stat. Med. 2002, 21, 1539–1558. [Google Scholar] [CrossRef]
  48. Duval, S.; Tweedie, R. Trim and Fill: A Simple Funnel-Plot–Based Method of Testing and Adjusting for Publication Bias in Meta-Analysis. Biometrics 2000, 56, 455–463. [Google Scholar] [CrossRef]
  49. Duval, S.; Tweedie, R. A Nonparametric “Trim and Fill” Method of Accounting for Publication Bias in Meta-Analysis. J. Am. Stat. Assoc. 2000, 95, 89–98. [Google Scholar] [CrossRef]
  50. Egger, M.; Smith, G.D.; Schneider, M.; Minder, C. Bias in Meta-Analysis Detected by a Simple, Graphical Test. BMJ 1997, 315, 629–634. [Google Scholar] [CrossRef]
  51. Begg, C.B.; Mazumdar, M. Operating Characteristics of a Rank Correlation Test for Publication Bias. Biometrics 1994, 50, 1088. [Google Scholar] [CrossRef]
  52. Balduzzi, S.; Rücker, G.; Schwarzer, G. How to Perform a Meta-Analysis with R: A Practical Tutorial. Evid. Based Ment. Health 2019, 22, 153–160. [Google Scholar] [CrossRef]
  53. Coburn, K.; Vevea, J. Weightr: Estimating Weight-Function Models for Publication Bias. R Package Version 2.0.2. Available online: https://CRAN.R-project.org/package=weightr (accessed on 28 August 2023).
  54. Makowski, D.; Lüdecke, D.; Patil, I.; Thériault, R.; Ben-Shachar, M.; Wiernik, B. Automated Results Reporting as a Practical Tool to Improve Reproducibility and Methodological Best Practices Adoption. Available online: https://easystats.github.io/report/ (accessed on 16 November 2023).
  55. Schwarzer, G.; Carpenter, J.R.; Rücker, G. Metasens: Statistical Methods for Sensitivity Analysis in Meta-Analysis. 2023. Available online: https://CRAN.R-project.org/package=metasens (accessed on 28 August 2023).
  56. Viechtbauer, W. Conducting Meta-Analyses in R with the Metafor Package. J. Stat. Softw. 2010, 36, 1–48. [Google Scholar] [CrossRef]
  57. Wickham, H. Ggplot2: Elegant Graphics for Data Analysis, 2nd ed.; Springer International Publishing: Cham, Switzerland, 2016; ISBN 978-3-319-24277-4. [Google Scholar]
  58. Wickham, H.; Bryan, J. Posit, PBC (Copyright holder of all R. code and all C. code without explicit copyright; code), M.K. (Author of included R.; code), K.V. (Author of included libxls; code), C.L. (Author of included libxls; code), B.C. (Author of included libxls; code), D.H. (Author of included libxls; code), E.M. (Author of included libxls Readxl: Read Excel Files 2023. Available online: https://CRAN.R-project.org/package=readxl (accessed on 5 September 2023).
  59. Wickham, H.; François, R.; Henry, L.; Müller, K.; Vaughan, D.; Software, P. PBC Dplyr: A Grammar of Data Manipulation 2023. Available online: https://CRAN.R-project.org/package=dplyr (accessed on 5 September 2023).
  60. Harrer, M.; Cuijpers, P.; Furukawa, T.; Ebert, D. Dmetar: Companion r Package for the Guide ‘Doing Meta-Analysis in r’ (R Package Version 0.0.9000). Available online: https://dmetar.protectlab.org/ (accessed on 16 November 2023).
  61. Wickham, H.; Seidel, D. RStudio Scales: Scale Functions for Visualization 2022. Available online: https://CRAN.R-project.org/package=scales (accessed on 5 September 2023).
  62. National Academies of Sciences, Engineering, and Medicine; Health and Medicine Division; Board on Health Care Services; Board on Health Sciences Policy; Committee on Temporomandibular Disorders (TMDs): From Research Discoveries to Clinical Treatment; Yost, O.; Liverman, C.T.; English, R.; Mackey, S.; Bond, E.C. Definitions and Scope: What Are TMDs? In Temporomandibular Disorders: Priorities for Research and Care; National Academies Press (US): Washington, DC, USA, 2020. [Google Scholar]
  63. Carapinha, I.H.A.; Canales, G.D.l.T.; Poluha, R.L.; Câmara-Souza, M.B.; Christidis, N.; Ernberg, M.; de Almeida, A.M.; Manso, A.C.G.d.M. Sociodemographic Profile: A Forgotten Factor in Temporomandibular Disorders? A Scoping Review. J. Pain Res. 2024, 17, 393–414. [Google Scholar] [CrossRef]
  64. Durham, J.; Steele, J.; Moufti, M.A.; Wassell, R.; Robinson, P.; Exley, C. Temporomandibular Disorder Patients’ Journey through Care. Community Dent. Oral Epidemiol. 2011, 39, 532–541. [Google Scholar] [CrossRef] [PubMed]
  65. Melis, M.; Di Giosia, M. The Role of Genetic Factors in the Etiology of Temporomandibular Disorders: A Review. CRANIO® 2016, 34, 43–51. [Google Scholar] [CrossRef]
  66. Warren, M.P.; Fried, J.L. Temporomandibular Disorders and Hormones in Women. Cells Tissues Organs 2001, 169, 187–192. [Google Scholar] [CrossRef]
  67. Jedynak, B.; Jaworska-Zaremba, M.; Grzechocińska, B.; Chmurska, M.; Janicka, J.; Kostrzewa-Janicka, J. TMD in Females with Menstrual Disorders. Int. J. Environ. Res. Public Health 2021, 18, 7263. [Google Scholar] [CrossRef]
Figure 1. PRISMA flow diagram.
Jcm 13 01365 g001
Figure 2. The results by forest plot prevalence of TMDs by continent (Supplementary Materials S2 and S3).
Jcm 13 01365 g002
Figure 3. The results by forest plot prevalence of TMDs by age (Supplementary Materials S2 and S3).
Jcm 13 01365 g003
Figure 4. Prevalence of TMDs by continent, age, and female-to-male ratio (F:M).
Jcm 13 01365 g004
Table 1. PICO Summary of Inclusion and Exclusion Criteria.
InclusionExclusion
Patient
Adult and pediatric population
Intervention
Screening for TMDs
Outcome
Information in the study on: epidemiology, prevalence, TMD population.
Research rated as good and outstanding by TQS.
Research rated as poor and fair by TQS.
Comparison
TMDs vs. Subject health
Study Design
Studies to assess occurrence of TMDs in populations.
The criterion for continents is at least 2 studies with a total of more than 500 participants.
Narrative Review
Systematic Articles
Meta-analysis
Opinions
Case reports or series patients
Animal or biomechanical studies
Publications in a language other than English
Post-conference abstracts
TMDs—Temporomandibular disorders; TQS—Total Quality Score.
Disclaimer/Publisher’s Note: The statements, opinions and data contained in all publications are solely those of the individual author(s) and contributor(s) and not of MDPI and/or the editor(s). MDPI and/or the editor(s) disclaim responsibility for any injury to people or property resulting from any ideas, methods, instructions or products referred to in the content.

