


Persistence of Diffusion Capacity Impairment and Its Relationship with Dyspnea 12 Months after Hospitalization for COVID-19
 , ,
, ,  and
and
Abstract
1. Introduction
2. Materials and Methods
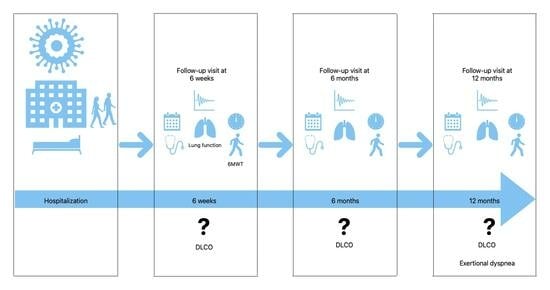
2.1. Study Design and Participants
2.2. Routine Follow-Up
2.3. Outcomes
2.4. Statistical Analysis
3. Results
3.1. Study Participants
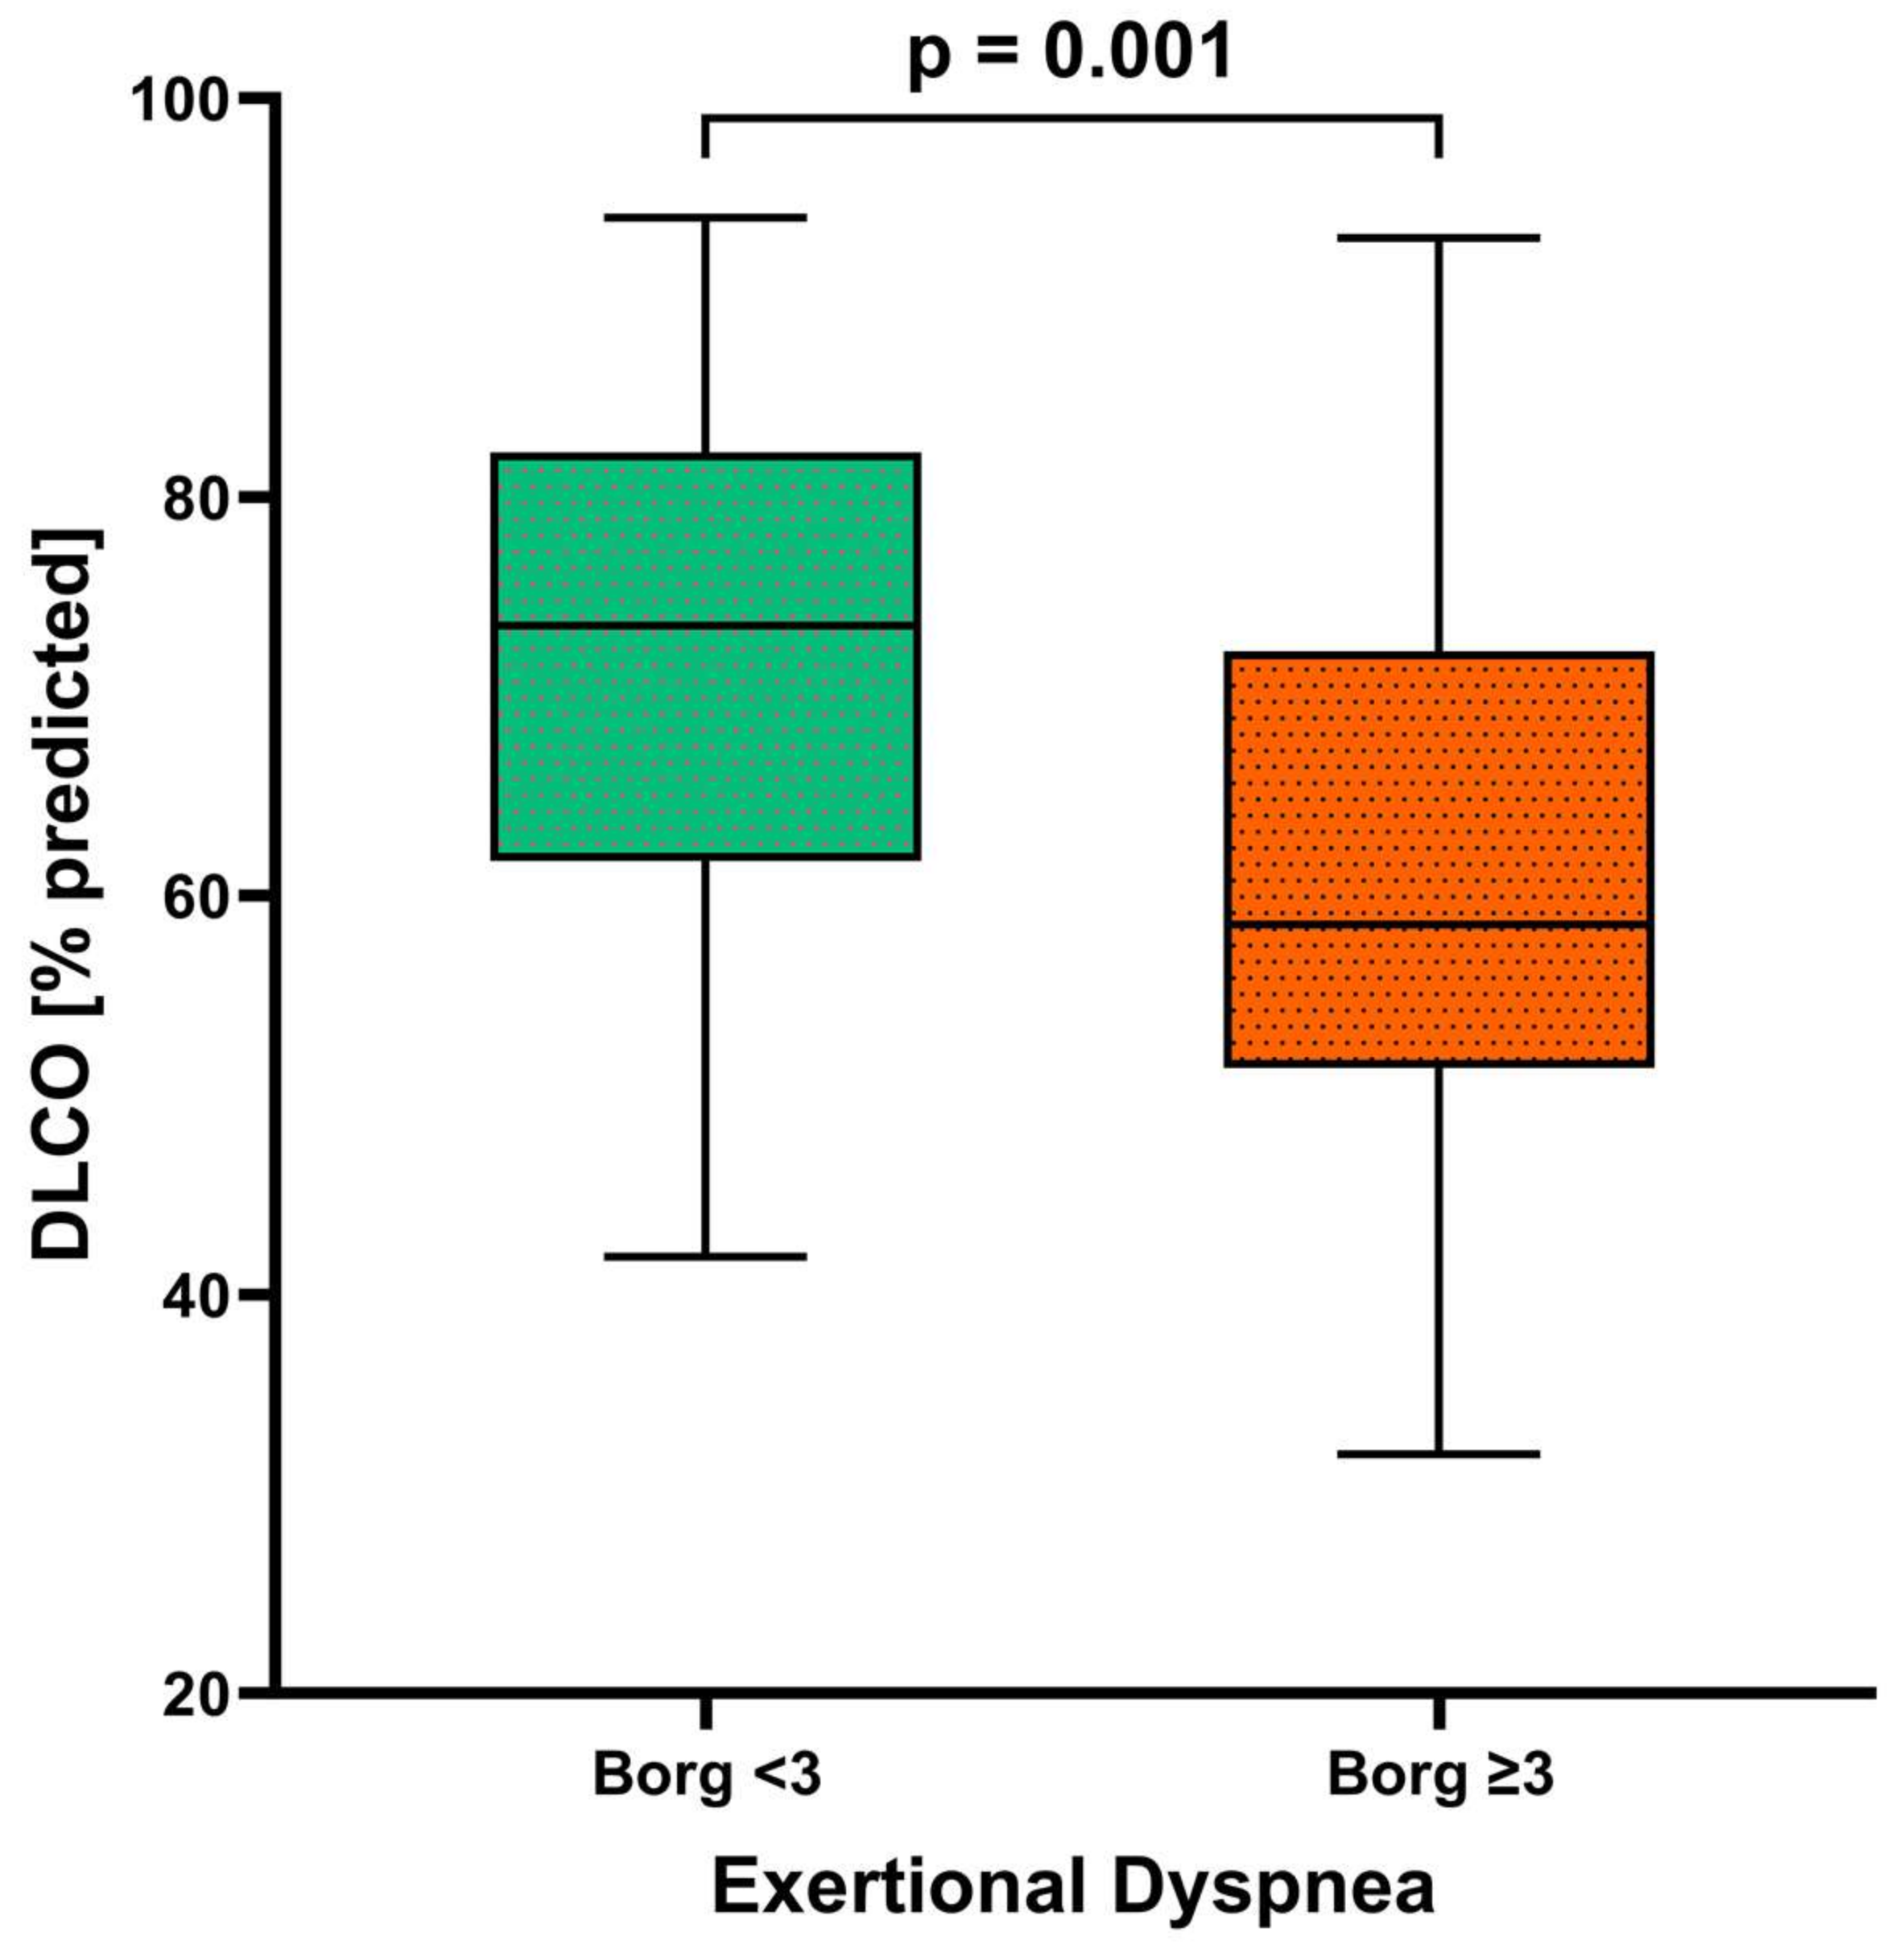
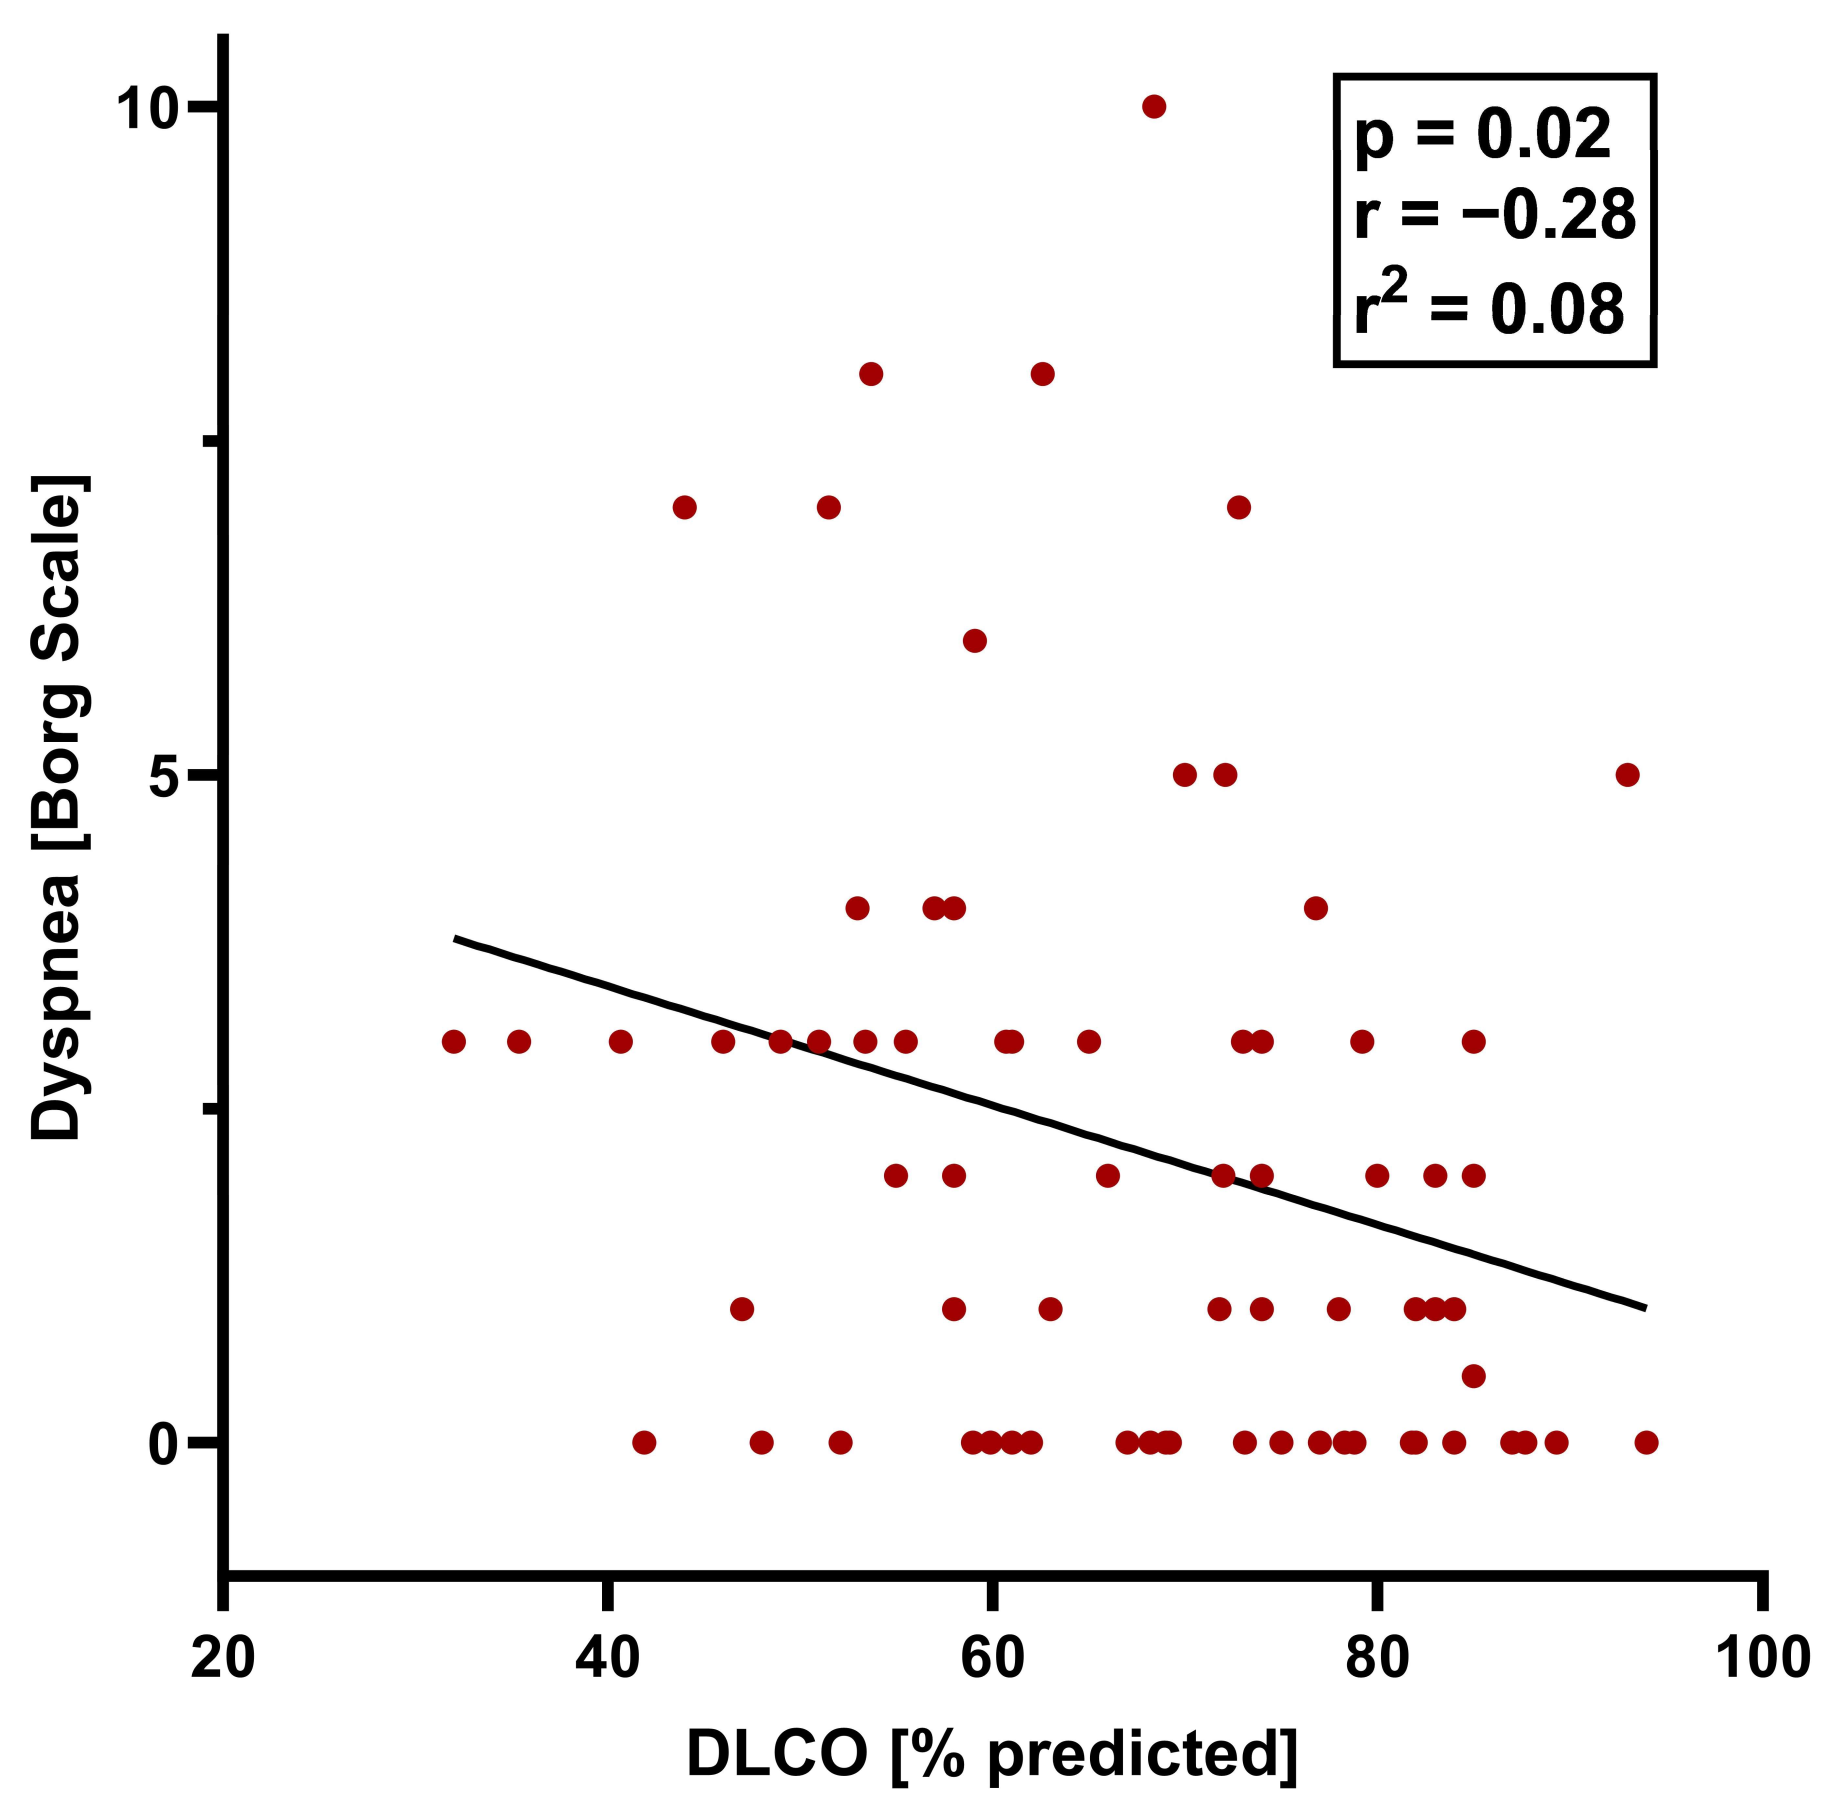
3.2. Comparisons between Individuals with and Those without Dyspnea
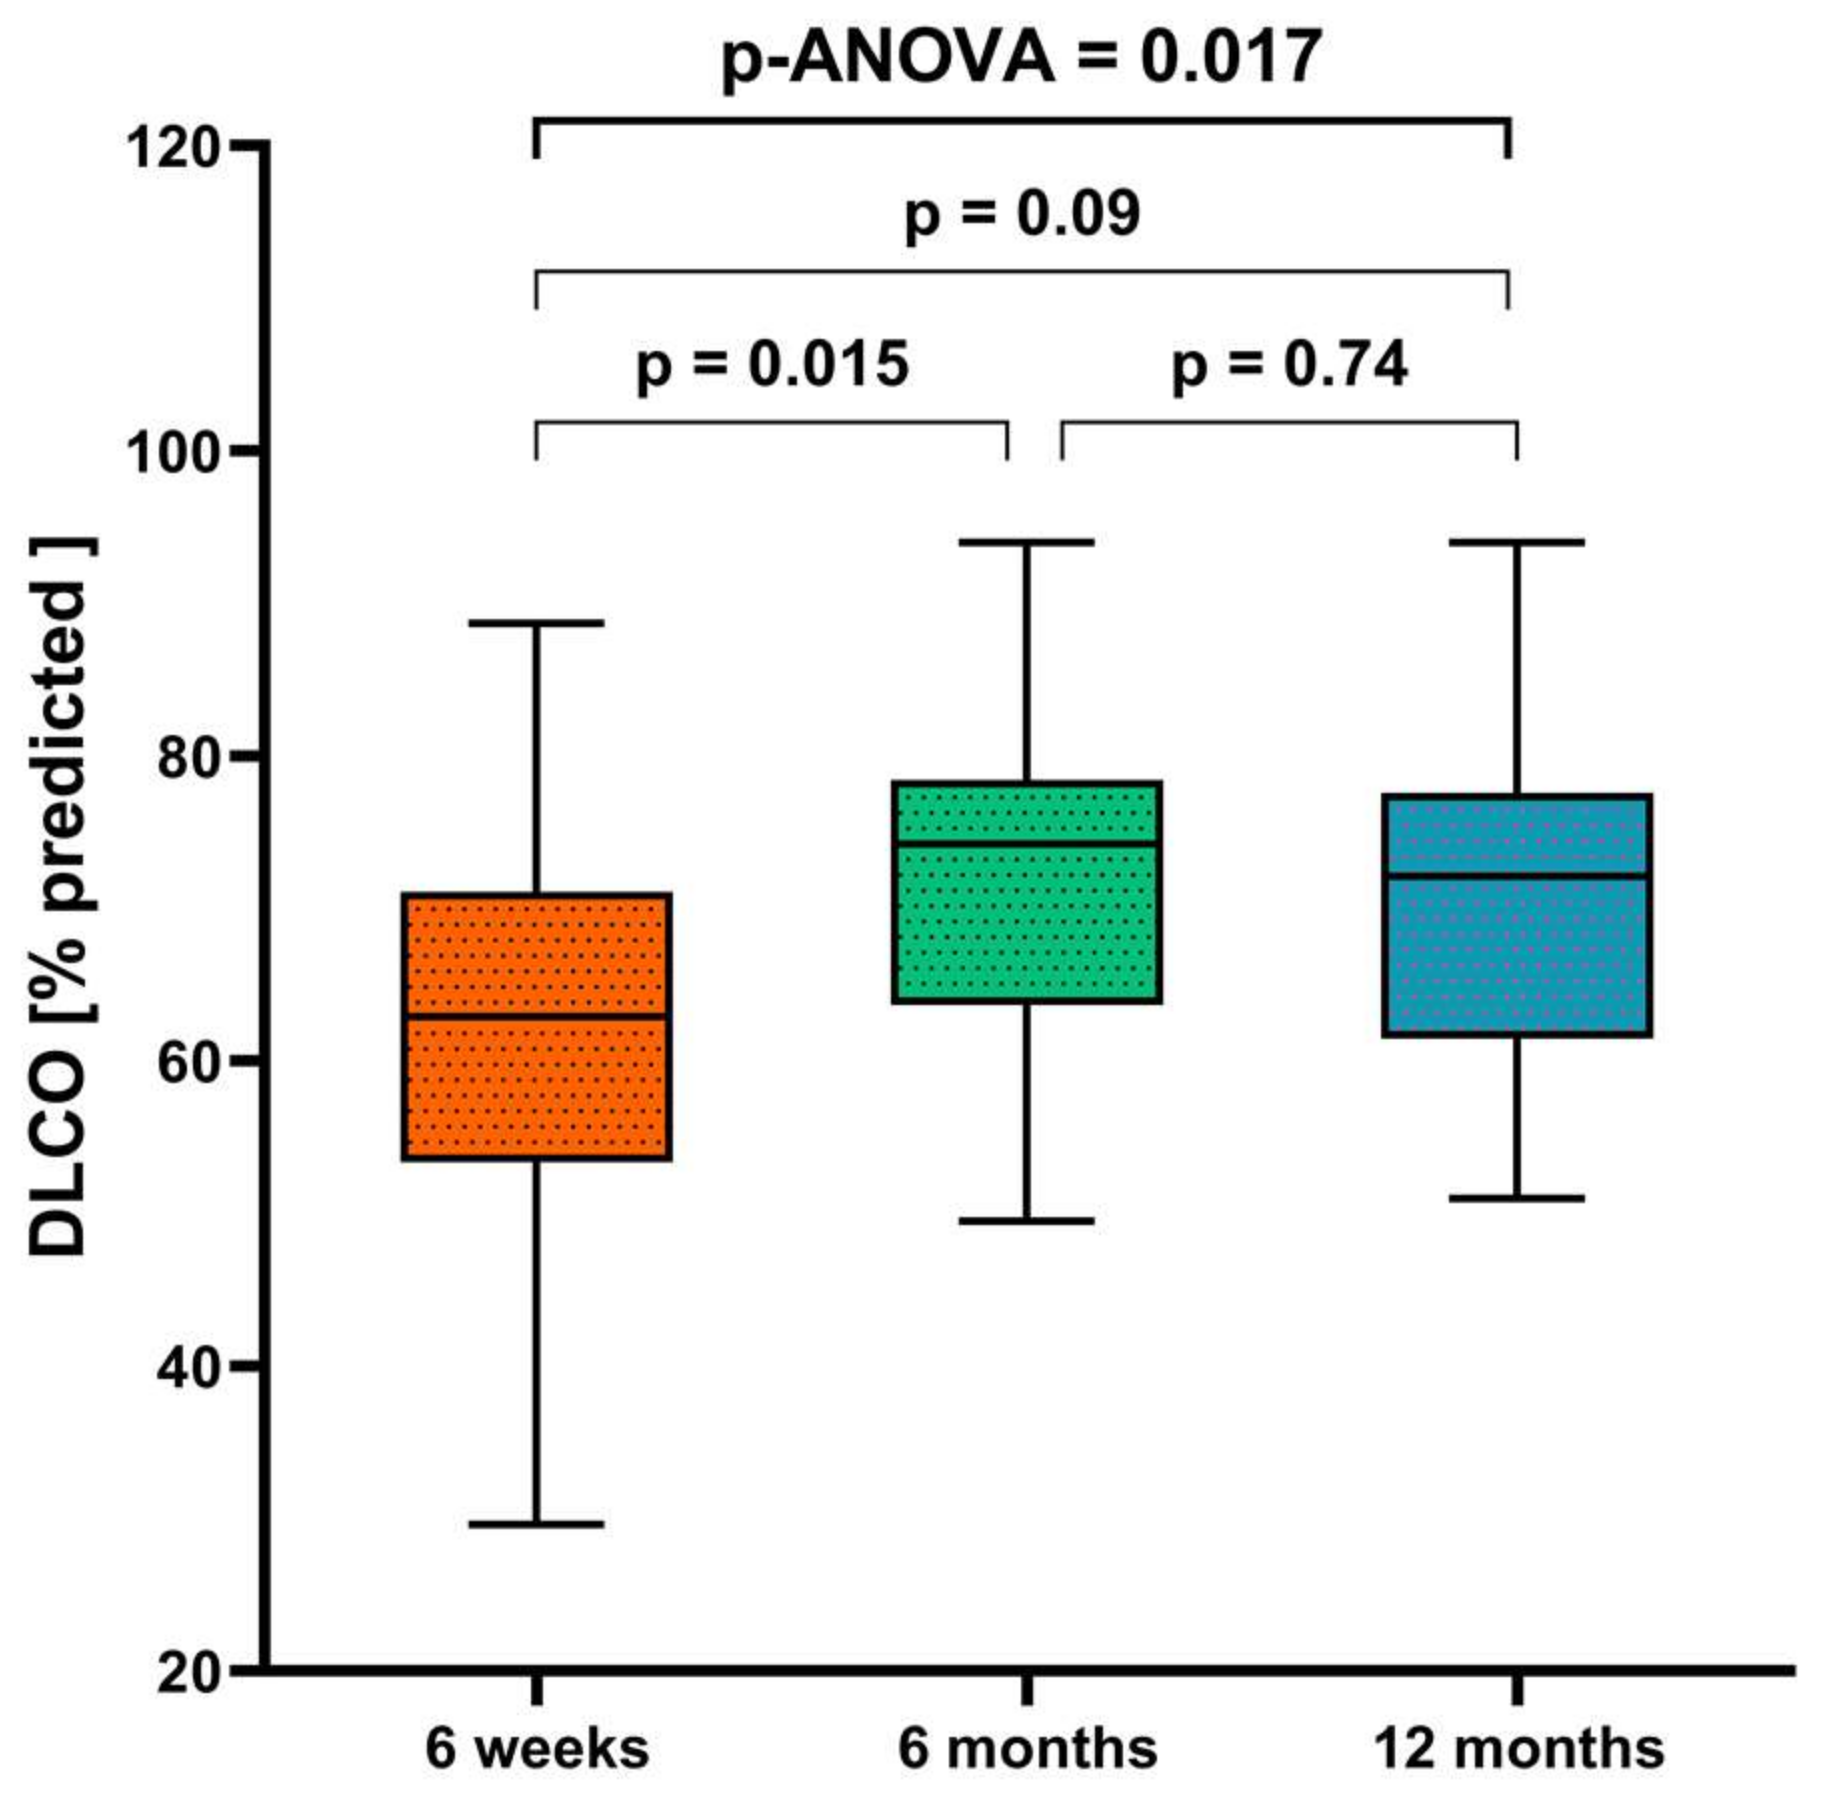
3.3. Changes in Lung Function and Diffusion Capacity over Time
4. Discussion
5. Conclusions
Author Contributions
Funding
Institutional Review Board Statement
Informed Consent Statement
Data Availability Statement
Acknowledgments
Conflicts of Interest
References
- Daher, A.; Balfanz, P.; Cornelissen, C.; Müller, A.; Bergs, I.; Marx, N.; Müller-Wieland, D.; Hartmann, B.; Dreher, M.; Müller, T. Follow up of patients with severe coronavirus disease 2019 (COVID-19): Pulmonary and extrapulmonary disease sequelae. Respir. Med. 2020, 174, 106197. [Google Scholar] [CrossRef] [PubMed]
- PHOSP-COVID Collaborative Group. Clinical characteristics with inflammation profiling of long COVID and association with 1-year recovery following hospitalisation in the UK: A prospective observational study. Lancet Respir. Med. 2022, 10, 761–775. [Google Scholar] [CrossRef] [PubMed]
- Spruit, M.A.; Holland, A.E.; Singh, S.J.; Tonia, T.; Wilson, K.C.; Troosters, T. COVID-19: Interim Guidance on Rehabilitation in the Hospital and Post-Hospital Phase from a European Respiratory Society- and American Thoracic Society-coordinated International Task Force. Eur. Respir. J. 2020, 56, 2002197. [Google Scholar] [CrossRef] [PubMed]
- Sudre, C.H.; Murray, B.; Varsavsky, T.; Graham, M.S.; Penfold, R.S.; Bowyer, R.C.; Pujol, J.C.; Klaser, K.; Antonelli, M.; Canas, L.S.; et al. Attributes and predictors of long COVID. Nat. Med. 2021, 27, 626–631. [Google Scholar] [CrossRef]
- Santus, P.; Flor, N.; Saad, M.; Pini, S.; Franceschi, E.; Airoldi, A.; Gaboardi, P.; Ippolito, S.; Rizzi, M.; Radovanovic, D. Trends over Time of Lung Function and Radiological Abnormalities in COVID-19 Pneumonia: A Prospective, Observational, Cohort Study. J. Clin. Med. 2021, 10, 1021. [Google Scholar] [CrossRef] [PubMed]
- Rinaldo, R.F.; Mondoni, M.; Baccelli, A.; Marchetti, F.; Re, B.; Degrassi, M.; Parazzini, E.M.; Guazzi, M.; Di Marco, F.; Centanni, S. SARS-CoV-2 infection sequelae on exercise response: Persistent or reversible? A 2-year perspective. ERJ Open Res. 2023, 9, 00234-2023. [Google Scholar] [CrossRef]
- Freund, O.; Breslavsky, A.; Givoli-Vilensky, R.; Zacks, N.; Gershman, E.; Melloul, A.; Wand, O.; Bilenko, N.; Bar-Shai, A. Assessment of a close respiratory follow-up schedule at 3 and 6 months after acute COVID-19 and its related investigations. Respir. Med. 2023, 217, 107367. [Google Scholar] [CrossRef]
- Guler, S.A.; Ebner, L.; Aubry-Beigelman, C.; Bridevaux, P.-O.; Brutsche, M.; Clarenbach, C.; Garzoni, C.; Geiser, T.K.; Lenoir, A.; Mancinetti, M.; et al. Pulmonary function and radiological features 4 months after COVID-19: First results from the national prospective observational Swiss COVID-19 lung study. Eur. Respir. J. 2021, 57, 2003690. [Google Scholar] [CrossRef]
- Shah, A.S.; Ryu, M.H.; Hague, C.J.; Murphy, D.T.; Johnston, J.C.; Ryerson, C.J.; Carlsten, C.; Wong, A.W. Changes in pulmonary function and patient-reported outcomes during COVID-19 recovery: A longitudinal, prospective cohort study. ERJ Open Res. 2021, 7, 00243-2021. [Google Scholar] [CrossRef]
- Wu, X.; Liu, X.; Zhou, Y.; Yu, H.; Li, R.; Zhan, Q.; Ni, F.; Fang, S.; Lu, Y.; Ding, X.; et al. 3-month, 6-month, 9-month, and 12-month respiratory outcomes in patients following COVID-19-related hospitalisation: A prospective study. Lancet Respir. Med. 2021, 9, 747–754. [Google Scholar] [CrossRef]
- COVID-19 Treatment Guidelines Panel. Coronavirus Disease 2019 (COVID-19) Treatment Guidelines. National Institutes of Health. Available online: https://www.covid19treatmentguidelines.nhi.gov/ (accessed on 23 January 2024).
- Schulze-Hagen, M.; Hübel, C.; Meier-Schroers, M.; Yüksel, C.; Sander, A.; Sähn, M.; Kleines, M.; Isfort, P.; Cornelissen, C.; Lemmen, S.; et al. Low-Dose Chest CT for the Diagnosis of COVID-19—A Systematic, Prospective Comparison With PCR. Dtsch. Ärzteblatt Int. 2020, 117, 389–395. [Google Scholar] [CrossRef]
- Borg, G. Psychophysical scaling with applications in physical work and the perception of exertion. Scand. J. Work Environ. Health 1990, 16 (Suppl. S1), 55–58. [Google Scholar] [CrossRef]
- Laveneziana, P.; Albuquerque, A.; Aliverti, A.; Babb, T.; Barreiro, E.; Dres, M.; Dubé, B.-P.; Fauroux, B.; Gea, J.; Guenette, J.A.; et al. ERS statement on respiratory muscle testing at rest and during exercise. Eur. Respir. J. 2019, 53, 1801214. [Google Scholar] [CrossRef] [PubMed]
- Quanjer, P.H.; Stanojevic, S.; Cole, T.J.; Baur, X.; Hall, G.L.; Culver, B.H.; Enright, P.L.; Hankinson, J.L.; Ip, M.S.M.; Zheng, J.; et al. Multi-ethnic reference values for spirometry for the 3–95-yr age range: The global lung function 2012 equations. Eur. Respir. J. 2012, 40, 1324–1343. [Google Scholar] [CrossRef] [PubMed]
- Agarwala, P.; Salzman, S.H. Six-Minute Walk Test: Clinical Role, Technique, Coding and Reimbursement. Chest 2020, 157, 603–611. [Google Scholar] [CrossRef] [PubMed]
- Available online: https://gli-calculator.ersnet.org (accessed on 23 January 2024).
- ARDS Definition of Task Force; Ranieri, V.M.; Rubenfeld, G.D.; Thompson, B.T.; Ferguson, N.D.; Caldwell, E.; Fan, E.; Camporota, L.; Slutsky, A.S. Acute respiratory distress syndrome: The Berlin Definition. JAMA 2012, 307, 2526–2533. [Google Scholar] [CrossRef] [PubMed]
- Ackermann, M.; Verleden, S.E.; Kuehnel, M.; Haverich, A.; Welte, T.; Laenger, F.; Vanstapel, A.; Werlein, C.; Stark, H.; Tzankov, A.; et al. Pulmonary Vascular Endothelialitis, Thrombosis, and Angiogenesis in COVID-19. N. Engl. J. Med. 2020, 383, 120–128. [Google Scholar] [CrossRef] [PubMed]
- Hanidziar, D.; Robson, S.C. Hyperoxia and modulation of pulmonary vascular and immune responses in COVID-19. Am. J. Physiol. Lung Cell. Mol. Physiol. 2021, 320, L12–L16. [Google Scholar] [CrossRef] [PubMed]
- Huang, Y.; Tan, C.; Wu, J.; Chen, M.; Wang, Z.; Luo, L.; Zhou, X.; Liu, X.; Huang, X.; Yuan, S.; et al. Impact of coronavirus disease 2019 on pulmonary function in early convalescence phase. Respir. Res. 2020, 21, 163. [Google Scholar] [CrossRef]
- Ngai, J.C.; Ko, F.W.; Ng, S.S.; To, K.; Tong, M.; Hui, D.S. The long-term impact of severe acute respiratory syndrome on pulmonary function, exercise capacity and health status. Respirology 2010, 15, 543–550. [Google Scholar] [CrossRef]
- Patel, B.V.; Arachchillage, D.J.; Ridge, C.A.; Bianchi, P.; Doyle, J.F.; Garfield, B.; Ledot, S.; Morgan, C.; Passariello, M.; Price, S.; et al. Pulmonary Angiopathy in Severe COVID-19: Physiologic, Imaging, and Hematologic Observations. Am. J. Respir. Crit. Care Med. 2020, 202, 690–699. [Google Scholar] [CrossRef]
- Steinbeis, F.; Thibeault, C.; Doellinger, F.; Ring, R.M.; Mittermaier, M.; Ruwwe-Glösenkamp, C.; Alius, F.; Knape, P.; Meyer, H.-J.; Lippert, L.J.; et al. Severity of respiratory failure and computed chest tomography in acute COVID-19 correlates with pulmonary function and respiratory symptoms after infection with SARS-CoV-2: An observational longitudinal study over 12 months. Respir. Med. 2021, 191, 106709. [Google Scholar] [CrossRef] [PubMed]
- Thomas, N.; Gurvich, C.; Kulkarni, J. Sex Differences and COVID-19. Adv. Exp. Med. Biol. 2021, 1327, 79–91. [Google Scholar] [CrossRef] [PubMed]
- Chanana, N.; Palmo, T.; Sharma, K.; Kumar, R.; Graham, B.B.; Pasha, Q. Sex-derived attributes contributing to SARS-CoV-2 mortality. Am. J. Physiol. Endocrinol. Metab. 2020, 319, E562–E567. [Google Scholar] [CrossRef] [PubMed]

| All Participants | Dyspnea | No Dyspnea | Dyspnea vs. No Dyspnea | ||||||||||
|---|---|---|---|---|---|---|---|---|---|---|---|---|---|
| Overall (n = 72) | Females (n = 22) | Males (n = 50) | p_mw-Value | Overall (n = 30) | Females (n = 12) | Males (n = 18) | p_D mw-Value | Overall (n = 42) | Females (n = 10) | Males (n = 32) | p_NDmw-Value | p-Value | |
| Characteristics | |||||||||||||
| Age, years | 59.8 ± 13.5 | 60.1 ± 11.1 | 59.3 ± 14.4 | 0.67 | 62.0 ± 16.0 | 62.3 ± 10.8 | 61.8 ± 19.0 | 0.95 | 58.2 ± 11.2 | 59.1 ± 11.7 | 57.9 ± 11.2 | 0.77 | 0.24 |
| Height, m | 1.73 ± 0.1 | 1.64 ± 0.5 | 1.77 ± 0.1 | <0.001 | 1.69 ± 0.1 | 1.62 ± 0 | 1.74 ± 0.1 | <0.001 | 1.76 ± 0.1 | 1.67 ± 0.1 | 1.79 ± 0.1 | <0.001 | 0.001 |
| Body weight, kg | 88.4 ± 15.6 | 82.8 ± 18.2 | 90.9 ± 13.8 | 0.041 | 89.8 ± 19.1 | 83.2 ± 19 | 94.2 ± 18.4 | 0.12 | 89.8 ± 19.1 | 83.2 ± 19.0 | 94.2 ± 18.4 | 0.15 | 0.53 |
| BMI, kg/m2 | 29.5 ± 5.2 | 31.7 ± 7.1 | 28.8 ± 4.0 | 0.17 | 31.2 ± 5.7 | 31.7 ± 7.3 | 30.9 ± 4.6 | 0.71 | 28.3 ± 4.4 | 29.6 ± 7.1 | 27.8 ± 3.2 | 0.28 | 0.016 |
| Comorbidities, n (%) | |||||||||||||
| Any | 68 (94) | 19 (86) | 49 (98) | 0.048 | 28 (93) | 10 (83) | 18 (100) | 0.08 | 40 (95) | 9 (90) | 31 (97) | 0.39 | 0.73 |
| Arterial hypertension | 42 (58) | 15 (68) | 27 (54) | 0.27 | 21 (70) | 10 (83) | 11 (61) | 0.21 | 21 (50) | 5 (50) | 16 (50) | 1 | 0.09 |
| Respiratory disease | 20 (28) | 7 (32) | 13 (26) | 0.62 | 15 (50) | 5 (42) | 10 (56) | 0.47 | 5 (12) | 2 (20) | 3 (9) | 0.38 | <0.001 |
| Obstructive sleep apnea | 6 (8) | 2 (9) | 4 (8) | 0.88 | 4 (13) | 0 | 4 (22) | 0.08 | 2 (5) | 2 (20) | 0 | 0.009 | 0.2 |
| Asthma | 10 (14) | 3 (14) | 7 (14) | 0.66 | 6 (20) | 2 (17) | 4 (22) | 0.87 | 4 (10) | 1 (10) | 3 (9) | 1 | 0.11 |
| Other pulmonary diseases | 6 (8) | 3 (14) | 3 (6) | 0.29 | 6 (20) | 3 (25) | 3 (17) | 0.59 | 0 | 0 | 0 | 0.002 | |
| Critical disease | 21 (29) | 6 (27) | 15 (30) | 0.82 | 8 (27) | 2 (17) | 6 (33) | 0.33 | 13 (31) | 4 (40) | 9 (28) | 0.49 | 0.7 |
| Severe disease | 51 (71) | 16 (73) | 35 (70) | 0.82 | 22 (73) | 12 (67) | 10 (83) | 0.33 | 29 (69) | 6 (60) | 23 (72) | 0.49 | 0.7 |
| Obesity (BMI ≥ 30 kg/m2) | 27 (38) | 10 (45) | 17 (34) | 0.36 | 17 (57) | 7 (58) | 10 (56) | 0.89 | 10 (24) | 3 (30) | 7 (22) | 0.61 | 0.004 |
| Overweight (BMI ≥ 25 to <30 kg/m2) | 32 (44) | 6 (27) | 26 (52) | 0.05 | 9 (30) | 2 (17) | 7 (39) | 0.21 | 23 (55) | 4 (40) | 19 (59) | 0.29 | 0.038 |
| Diabetes mellitus | 19 (26) | 4 (18) | 15 (30) | 0.30 | 10 (33) | 3 (25) | 7 (39) | 0.45 | 9 (21) | 1 (10) | 8 (25) | 0.33 | 0.27 |
| Heart disease | 16 (22) | 4 (18) | 12 (24) | 0.59 | 7 (23) | 2 (17) | 5 (28) | 0.5 | 9 (21) | 2 (20) | 7 (22) | 0.9 | 0.85 |
| Coronary heart disease | 11 (15) | 1 (5) | 10 (20) | 0.1 | 5 (17) | 0 | 5 (28) | 0.047 | 6 (14) | 1 (10) | 5 (16) | 0.67 | 0.77 |
| Atrial fibrillation | 9 (13) | 2 (9) | 7 (14) | 0.57 | 4 (13) | 1 (8) | 3 (17) | 0.53 | 5 (12) | 1 (10) | 4 (13) | 0.84 | 0.86 |
| Chronic kidney disease | 12 (17) | 5 (23) | 7 (14) | 0.37 | 8 (27) | 4 (33) | 4 (22) | 0.52 | 4 (10 | 1 (10) | 3 (9) | 0.96 | 0.06 |
| Cancer | 11 (15) | 5 (23) | 6 (12) | 0.25 | 5 (17) | 3 (25) | 2 (11) | 0.33 | 6 (14) | 2 (20) | 4 (13) | 0.57 | 0.79 |
| Ex-smoker | 18 (25) | 3 (14) | 15 (31) | 0.13 | 9 (31) | 3 (25) | 6 (35) | 0.57 | 9 (21) | 0 | 9 (28) | 0.06 | 0.37 |
| Current smoker | 1 (10) | 0 | 1 (2) | 0.51 | 1 (3) | 0 | 1 (6) | 0.41 | 0 | 0 | 0 | 0.23 | |
| Cerebral arterial occlusive disease | 2 (3) | 0 | 2 (4) | 0.35 | 1 (3) | 0 | 1 (6) | 0.42 | 1 (2) | 0 | 1 (3) | 0.58 | 0.81 |
| Peripheral arterial occlusive disease | 2 (3) | 0 | 1 (2) | 0.35 | 2 (7) | 0 | 2 (11) | 0.25 | 0 | 0 | 0 | 0.09 | |
| Medical treatment | |||||||||||||
| Steroids | 70 (100) | 22 (100) | 49 (100) | 30 (100) | 12 (100) | 18 (100) | 42 (100) | 10 (100) | 32 (100) | ||||
| Antivirals | 5 (7) | 1 (5) | 4 (8) | 0.60 | 1 (3) | 0 | 1 (6) | 0.42 | 4 (10) | 1 (10) | 3 (9) | 1 | 0.32 |
| Monoclonal antibodies | 2 (3) | 2 (9) | 0 | 0.031 | 0 | 0 | 0 | 2 (5) | 2 (20) | 0 | 0.009 | 0.23 | |
| Cytokine adsorption | 1 (1) | 0 | 1 (2) | 0.51 | 1 (3) | 0 | 1 (6) | 0.42 | 0 | 0 | 0 | 0.24 | |
| Lung function | |||||||||||||
| TLC, L | 6.4 ± 1.6 | 5.2 ± 0.8 | 6.9 ± 1.6 | <0.001 | 5.7 ± 1.3 | 5.0 ± 0.9 | 6.2 ± 1.3 | 0.009 | 6.9 ± 1.7 | 5.5 ± 0.7 | 7.3 ± 1.7 | 0.003 | 0.003 |
| TLC, % predicted | 99.3 ± 17.5 | 103.4 ± 14.0 | 97.3 ± 18.8 | 0.19 | 96.2 ± 16.6 | 101.8 ± 16.8 | 92.5 ± 15.8 | 0.13 | 101.4 ± 17.9 | 105.3 ± 10.1 | 100.2 ± 19.7 | 0.45 | 0.21 |
| VC, L | 3.7 ± 1.1 | 2.8 ± 0.5 | 4.1 ± 1.0 | <0.001 | 3.2 ± 0.9 | 2.6 ± 0.6 | 3.5 ± 1.0 | 0.007 | 4.1 ± 1.0 | 3.0 ± 0.3 | 4.4 ± 0.9 | <0.001 | <0.001 |
| VC, % predicted | 92.8 ± 15.5 | 96.6 ± 13.7 | 91.2 ± 16.1 | 0.17 | 89.4 ± 17.8 | 94.8 ± 16.7 | 85.8 ± 18.1 | 0.18 | 95.4 ± 13.2 | 98.9 ± 9.3 | 94.3 ± 14.2 | 0.34 | 0.11 |
| VC < LLN, n (%) | 23 (32) | 6 (27) | 17 (34) | 0.58 | 13 (43) | 4 (33) | 9 (50) | 0.38 | 10 (24) | 2 (20) | 8 (25) | 0.75 | 0.08 |
| VC < 70%, n (%) | 7 (10) | 1 (5) | 6 (12) | 0.33 | 5 (17) | 1 (8) | 4 (22) | 0.33 | 2 (5) | 0 | 2 (6) | 0.43 | 0.1 |
| RV, L | 2.8 ± 1.1 | 2.3 ± 0.6 | 3.0 ± 1.2 | 0.017 | 2.6 ± 0.6 | 2.4 ± 0.5 | 2.7 ± 0.6 | 0.13 | 2.9 ± 1.4 | 2.2 ± 0.8 | 3.2 ± 1.5 | 0.06 | 0.18 |
| RV, % predicted | 117.7 ± 33.4 | 121.6 ± 27.0 | 116.0 ± 36.0 | 0.52 | 114.7 ± 27.7 | 123.3 ± 24.7 | 109.0 ± 27.1 | 0.16 | 119.9 ± 37.6 | 119.6 ± 30.7 | 120.0 ± 39.0 | 0.98 | 0.52 |
| RV/TLC ratio, % predicted | 112.0 ± 19.8 | 116.0 ± 13.3 | 110.2 ± 22.0 | 0.26 | 117.9 ± 20.7 | 118.7 ± 13.8 | 117.4 ± 24.7 | 0.87 | 107.7 ± 18.2 | 112.8 ± 12.6 | 106.1 ± 19.6 | 0.32 | 0.030 |
| FEV1, L | 2.9 ± 0.8 | 2.2 ± 0.5 | 3.1 ± 0.8 | <0.001 | 2.4 ± 0.8 | 2.0 ± 0.5 | 2.7 ± 0.9 | 0.021 | 3.1 ± 0.7 | 2.4 ± 0.3 | 3.4 ± 0.6 | <0.001 | <0.001 |
| FEV1, % predicted | 90.3 ± 16.1 | 90.5 ± 15.4 | 89.7 ± 16.6 | 0.85 | 85.5 ± 19.4 | 88.2 ± 19.6 | 83.8 ± 19.6 | 0.55 | 93.2 ± 12.7 | 93.4 ± 8.5 | 93.1 ± 13.8 | 0.96 | 0.047 |
| FEV1/FVC ratio, % | 80.1 ± 6.7 | 80.9 ± 6.0 | 80.8 ± 7.1 | 0.94 | 81.1 ± 8.2 | 81.4 ± 7.7 | 80.8 ± 8.8 | 0.85 | 80.6 ± 5.5 | 80.3 ± 3.5 | 80.8 ± 6.1 | 0.83 | 0.8 |
| FEV1 < 70% predicted, n (%) | 3 (4) | 1 (5) | 2 (4) | 0.92 | 2 (7) | 1 (8) | 1 (6) | 0.78 | 1 (2) | 0 | 1 (3) | 0.58 | 0.38 |
| Reff, kPa/(L/s) | 0.3 ± 0.1 | 0.3 ± 0.1 | 0.2 ± 0.1 | 0.05 | 0.3 ± 0.1 | 0.3 ± 0.1 | 0.3 ± 0.1 | 0.38 | 0.2 ± 0.1 | 0.3 ± 0.1 | 0.2 ± 0.1 | 0.16 | 0.031 |
| Reff, % predicted | 82.8 ± 29.5 | 93.0 ± 28.7 | 78.2 ± 29.1 | 0.05 | 91.7 ± 31.3 | 97.8 ± 27.5 | 87.5 ± 33.8 | 0.39 | 76.4 ± 26.8 | 87.2 ± 30.4 | 73.0 ± 25.1 | 0.15 | 0.030 |
| DLCO, mmol/(min*kPa) | 6.1 ± 1.8 | 5.0 ± 1.2 | 6.6 ± 1.8 | <0.001 | 5.1 ± 1.6 | 4.4 ± 1.1 | 5.6 ± 1.8 | 0.06 | 6.9 ± 1.6 | 5.7 ± 1.0 | 7.2 ± 1.6 | 0.006 | <0.001 |
| DLCO, % predicted | 66.9 ± 14.4 | 64.4 ± 11.7 | 68.0 ± 15.5 | 0.34 | 60.2 ± 14.3 | 59.1 ± 11.3 | 61.0 ± 16.3 | 0.73 | 71.6 ± 12.7 | 70.7 ± 9.2 | 71.9 ± 13.7 | 0.8 | 0.001 |
| z-score | 0–2.01 | 0–1.97 | 0–2.02 | 0.89 | 0–2.60 | 0–2.55 | 0–2.64 | 0.73 | 0–1.58 | 0–1.29 | 0–1.67 | 0.31 | <0.001 |
| DLCO < LLN, n (%) | 41 (57) | 14 (64) | 27 (54) | 0.45 | 23 (77) | 10 (83) | 13 (72) | 0.5 | 18 (43) | 4 (40) | 14 (44) | 0.84 | 0.004 |
| DLCO < 80% predicted, n (%) | 56 (78) | 21 (95) | 35 (70) | 0.016 | 28 (93) | 12 (100) | 16 (89) | 0.25 | 28 (67) | 9 (90) | 19 (59) | 0.08 | 0.007 |
| DLCO/VA ratio, mmol/(min*kPa*L) | 1.2 ± 0.2 | 1.2 ± 0.2 | 1.2 ± 0.2 | 0.89 | 1.2 ± 0.2 | 1.2 ± 0.2 | 1.2 ± 0.3 | 0.84 | 1.3 ± 0.2 | 1.3 ± 0.2 | 1.3 ± 0.2 | 0.6 | 0.035 |
| DLCO/VA ratio, % predicted | 85.2 ± 13.1 | 79.7 ± 11.0 | 87.6 ± 13.3 | 0.018 | 81.0 ± 12.8 | 76.5 ± 11.1 | 83.9 ± 13.3 | 0.12 | 88.2 ± 12.6 | 83.6 ± 10.0 | 89.7 ± 13.1 | 0.19 | 0.019 |
| DLCO z-score | 0–1.00 | 0–0.95 | 0–1.02 | 0.76 | 0–1.35 | 0–1.31 | 0–1.38 | 0.84 | 0–0.75 | 0–0.52 | 0–0.82 | 0.34 | 0.006 |
| DLCO/VA ratio < LLN, n (%) | 23 (32) | 6 (27) | 17 (34) | 0.58 | 14 (47) | 5 (42) | 9 (50) | 0.67 | 9 (21) | 1 (10) | 8 (25) | 0.33 | 0.023 |
| DLCO/VA ratio < 80% predicted, n (%) | 28 (38) | 9 (41) | 19 (38) | 0.82 | 16 (53) | 6 (50) | 10 (56) | 0.78 | 12 (29) | 3 (30) | 9 (28) | 0.91 | 0.034 |
| Alveolar volume, L | 5.0 ± 1.2 | 4.1 ± 0.6 | 5.4 ± 1.1 | <0.001 | 4.5 ± 1.1 | 3.8 ± 0.6 | 4.9 ± 1.1 | 0.006 | 5.4 ± 1.0 | 4.4 ± 0.4 | 5.8 ± 1.0 | <0.001 | <0.001 |
| 6 min walk distance, m | 473.6 ± 96.6 | 456.37 ± 74.0 | 481.1 ± 104.7 | 0.36 | 443.6 ± 116.3 | 439.6 ± 81.6 | 446.4 ± 138.6 | 0.9 | 489.7 ± 81.2 | 471.5 ± 67.0 | 495.6 ± 85.4 | 0.42 | 0.07 |
| SpO2 after exercise, % | 96.0 ± 2.2 | 96.5 ± 2.1 | 95.8 ± 2.3 | 0.29 | 95.3 ± 2.7 | 95.9 ± 2.8 | 94.9 ± 2.7 | 0.39 | 96.4 ± 1.9 | 97.0 ± 1.3 | 96.2 ± 2.0 | 0.25 | 0.05 |
| Borg scale score | |||||||||||||
| Before exercise | 0.9 ± 1.5 | 1.2 ± 2.0 | 0.8 ± 1.3 | 0.29 | 1.9 ± 1.9 | 2.1 ± 2.3 | 1.8 ± 1.6 | 0.65 | 0.2 ± 0.5 | 0.1 ± 0.2 | 0.2 ± 0.5 | 0.43 | <0.001 |
| After exercise | 2.2 ± 2.4 | 3.2 ± 2.5 | 1.8 ± 2.2 | 0.018 | 4.4 ± 2.0 | 4.9 ± 1.9 | 4.1 ± 2.0 | 0.28 | 0.6 ± 0.8 | 1.1 ± 0.9 | 0.5 ± 0.7 | 0.022 | <0.001 |
| Pulmonary rehabilitation after hospital discharge, n (%) | 8 (11) | 2 (10) | 6 (12) | 0.77 | 5 (17) | 1 (9) | 4 (22) | 0.38 | 3 (7) | 1 (10) | 2 (6) | 0.7 | 0.19 |
| Time after Discharge (n = 25) | ||||
|---|---|---|---|---|
| 6 Weeks | 6 Months | 12 Months | p Value * | |
| TLC, L | 5.58 ± 1.01 | 6.04 ± 0.93 | 6.03 ± 1.08 | 0.21 |
| TLC, % predicted | 89.51 ± 11.61 | 97.41 ± 11.64 | 98.03 ± 16.33 | 0.049 § |
| VC, L | 3.42 ± 0.72 | 3.57 ± 0.73 | 3.48 ± 0.75 | 0.78 |
| VC, % predicted | 90.33 ± 12.24 | 95.16 ± 14.01 | 93.87 ± 14.72 | 0.42 |
| VC < LLN, n (%) | 11 (44) | 6 (24) | 7 (28) | 0.29 |
| RV, L | 2.12 ± 0.52 | 2.48 ± 0.52 | 2.54 ± 0.73 | 0.06 |
| RV, % predicted | 97.28 ± 19.86 | 111.72 ± 21.91 | 114.94 ± 32.89 | 0.039 § |
| RV/TLC ratio | 38.64 ± 6.4 | 41.14 ± 6.71 | 41.82 ± 9.67 | 0.32 |
| RV/TLC ratio, % predicted | 101.42 ± 12.73 | 108.54 ± 22.67 | 109.59 ± 28.26 | 0.37 |
| FEV1, L | 2.66 ± 0.57 | 2.75 ± 0.57 | 2.71 ± 0.62 | 0.86 |
| FEV1, % predicted | 90.34 ± 12.22 | 95.01 ± 16.88 | 93.3 ± 16.22 | 0.55 |
| FEV1/FVC ratio, % | 80.66 ± 7.66 | 80.86 ± 5.68 | 80.51 ± 4.86 | 0.98 |
| Reff, kPa/(L/s) | 0.28 ± 0.11 | 0.28 ± 0.1 | 0.28 ± 0.08 | 0.94 |
| Reff, % predicted | 92.17 ± 35.27 | 92.21 ± 34.27 | 94.74 ± 25.46 | 0.95 |
| DLCO, mmol/(min*kPa) | 5.64 ± 1.68 | 6.45 ± 1.49 | 6.16 ± 1.41 | 0.17 |
| DLCO, % predicted | 63.13 ± 13.49 | 72.80 ± 11.1 | 70.3 ± 11.13 | 0.016 ⧺ |
| DLCO < LLN, n (%) | 18 (72) | 10 (40) | 12 (48) | 0.06 |
| DLCO < 80%, n (%) | 22 (88) | 20 (80) | 23 (92) | 0.46 |
| DLCO/VA, mmol/(min*kPa*L) | 1.19 ± 0.3 | 1.31 ± 0.24 | 1.28 ± 0.24 | 0.25 |
| DLCO/VA, % predicted | 83.01 ± 17.58 | 91.57 ± 12.19 | 90.32 ± 13.41 | 0.09 |
| DLCO/VA ratio < LLN, n (%) | 25 (100) | 25 (100) | 25 (100) | 0.15 |
| Borg score before exercise | 0.69 ± 1.37 | 0.84 ± 1.12 | 0.66 ± 1.53 | 0.87 |
| Borg score after exercise | 1.94 ± 2.42 | 2.36 ± 1.98 | 1.83 ± 2.29 | 0.69 |
Disclaimer/Publisher’s Note: The statements, opinions and data contained in all publications are solely those of the individual author(s) and contributor(s) and not of MDPI and/or the editor(s). MDPI and/or the editor(s) disclaim responsibility for any injury to people or property resulting from any ideas, methods, instructions or products referred to in the content. |
© 2024 by the authors. Licensee MDPI, Basel, Switzerland. This article is an open access article distributed under the terms and conditions of the Creative Commons Attribution (CC BY) license (https://creativecommons.org/licenses/by/4.0/).
Share and Cite
Kang, A.; Regmi, B.; Cornelissen, C.; Smith, J.; Daher, A.; Dreher, M.; Spiesshoefer, J. Persistence of Diffusion Capacity Impairment and Its Relationship with Dyspnea 12 Months after Hospitalization for COVID-19. J. Clin. Med. 2024, 13, 1234. https://doi.org/10.3390/jcm13051234
Kang A, Regmi B, Cornelissen C, Smith J, Daher A, Dreher M, Spiesshoefer J. Persistence of Diffusion Capacity Impairment and Its Relationship with Dyspnea 12 Months after Hospitalization for COVID-19. Journal of Clinical Medicine. 2024; 13(5):1234. https://doi.org/10.3390/jcm13051234
Chicago/Turabian StyleKang, Alice, Binaya Regmi, Christian Cornelissen, Judith Smith, Ayham Daher, Michael Dreher, and Jens Spiesshoefer. 2024. "Persistence of Diffusion Capacity Impairment and Its Relationship with Dyspnea 12 Months after Hospitalization for COVID-19" Journal of Clinical Medicine 13, no. 5: 1234. https://doi.org/10.3390/jcm13051234
APA StyleKang, A., Regmi, B., Cornelissen, C., Smith, J., Daher, A., Dreher, M., & Spiesshoefer, J. (2024). Persistence of Diffusion Capacity Impairment and Its Relationship with Dyspnea 12 Months after Hospitalization for COVID-19. Journal of Clinical Medicine, 13(5), 1234. https://doi.org/10.3390/jcm13051234