

Subclinical Detection of Hydroxychloroquine-Induced Retinopathy in Patients with Systemic Lupus Erythematous Using Multifocal Electroretinography and Optical Coherence Tomography

Abstract
1. Introduction
2. Materials and Methods
2.1. Patients
2.2. Thickness of Ganglion Cell Complex (GCC) Using Swept-Source OCT
2.3. Multifocal Electroretinogram
2.4. Statistical Analysis
3. Results
3.1. Baseline Characteristics
3.2. Thickness of Macular GCC in SS-OCT
3.3. Parameters of mfERG Metrics
4. Discussion
Author Contributions
Funding
Institutional Review Board Statement
Informed Consent Statement
Data Availability Statement
Conflicts of Interest
References
- Willis, R.; Seif, A.M.; McGwin, G., Jr.; Martinez-Martinez, L.A.; González, E.B.; Dang, N.; Papalardo, E.; Liu, J.; Vilá, L.M.; Reveille, J.D.; et al. Effect of hydroxychloroquine treatment on pro-inflammatory cytokines and disease activity in SLE patients: Data from LUMINA (LXXV), a multiethnic US cohort. Lupus 2012, 21, 830–835. [Google Scholar] [CrossRef] [PubMed]
- Marmor, M.F.; Kellner, U.; Lai, T.Y.; Melles, R.B.; Mieler, W.F. American Academy of Ophthalmology. Recommendations on Screening for Chloroquine and Hydroxychloroquine Retinopathy (2016 Revision). Ophthalmology 2016, 123, 1386–1394. [Google Scholar] [CrossRef] [PubMed]
- Marmor, M.F.; Kellner, U.; Lai, T.Y.; Lyons, J.S.; Mieler, W.F.; American Academy of Ophthalmology. Revised recommendations on screening for chloroquine and hydroxychloroquine retinopathy. Ophthalmology 2011, 118, 415–422. [Google Scholar] [CrossRef] [PubMed]
- Melles, R.B.; Marmor, M.F. The risk of toxic retinopathy in patients on long-term hydroxychloroquine therapy. JAMA Ophthalmol. 2014, 132, 1453–1460. [Google Scholar] [CrossRef]
- Marmor, M.F.; Hu, J. Effect of disease stage on progression of hydroxychloroquine retinopathy. JAMA Ophthalmol. 2014, 132, 1105–1112. [Google Scholar] [CrossRef]
- Kellner, S.; Weinitz, S.; Farmand, G.; Kellner, U. Cystoid macular oedema and epiretinal membrane formation during progression of chloroquine retinopathy after drug cessation. Br. J. Ophthalmol. 2014, 98, 200–206. [Google Scholar] [CrossRef]
- Wetterholm, D.H.; Winter, F.C. Histopathology of chloroquine retinal toxicity. Arch. Ophthalmol. 1964, 71, 82–87. [Google Scholar] [CrossRef]
- Bernstein, H.N.; Ginsberg, J. The pathology of chloroquine retinopathy. Arch. Ophthalmol. 1964, 71, 238–245. [Google Scholar] [CrossRef]
- Rosenthal, A.R.; Kolb, H.; Bergsma, D.; Huxsoll, D.; Hopkins, J.L. Chloroquine retinopathy in the rhesus monkey. Investig. Ophthalmol. Vis. Sci. 1978, 17, 1158–1175. [Google Scholar]
- Tsang, A.C.; Ahmadi Pirshahid, S.; Virgili, G.; Gottlieb, C.C.; Hamilton, J.; Coupland, S.G. Hydroxychloroquine and chloroquine retinopathy: A systematic review evaluating the multifocal electroretinogram as a screening test. Ophthalmology 2015, 122, 1239–1251.e4. [Google Scholar] [CrossRef]
- Trenkic Božinovic, M.S.; Stankovic Babic, G.; Petrovic, M.; Karadžic, J.; Šarenac Vulovic, T.; Trenkic, M. Role of optical coherence tomography in the early detection of macular thinning in rheumatoid arthritis patients with chloroquine retinopathy. J. Res. Med. Sci. 2019, 24, 55. [Google Scholar] [CrossRef] [PubMed]
- Turgut, B.; Turkcuoglu, P.; Serdar Koca, S.; Aydemir, O. Detection of the regression on hydroxychloroquine retinopathy in optical coherence tomography. Clin. Rheumatol. 2009, 28, 607–609. [Google Scholar] [CrossRef] [PubMed]
- Aydın Kurna, S.; Kanar, H.S.; Garlı, M.; Çakır, N. Evaluation of the role of spectral-domain optical coherence tomography in the early detection of macular and ganglion cell complex thickness changes in patients with rheumatologic diseases taking hydroxychloroquine. Photodiagnosis Photodyn. Ther. 2022, 38, 102741. [Google Scholar] [CrossRef] [PubMed]
- Hoffmann, M.B.; Bach, M.; Kondo, M.; Li, S.; Walker, S.; Holopigian, K.; Viswanathan, S.; Robson, A.G. ISCEV standard for clinical multifocal electroretinography (mfERG) (2021 update). Doc. Ophthalmol. 2021, 142, 5–16. [Google Scholar] [CrossRef]
- Ozawa, H.; Ueno, S.; Ohno-Tanaka, A.; Sakai, T.; Hashiguchi, M.; Shimizu, M.; Fujinami, K.; Ahn, S.J.; Kondo, M.; Browning, D.J.; et al. Ocular findings in Japanese patients with hydroxychloroquine retinopathy developing within 3 years of treatment. Jpn. J. Ophthalmol. 2021, 65, 472–481. [Google Scholar] [CrossRef]
- Kim, J.; Jeong, H.C.; Kwon, H.Y.; Kim, Y.H.; Ahn, S.J. Demographic and clinical characteristics associated with screening practices for hydroxychloroquine retinopathy. Sci. Rep. 2024, 14, 974. [Google Scholar] [CrossRef]
- Payne, J.F.; Hubbard, G.B., 3rd; Aaberg, T.M., Sr.; Yan, J. Clinical characteristics of hydroxychloroquine retinopathy. Br. J. Ophthalmol. 2011, 95, 245–250. [Google Scholar] [CrossRef]
- Michaelides, M.; Stover, N.B.; Francis, P.J.; Weleber, R.G. Retinal toxicity associated with hydroxychloroquine and chloroquine: Risk factors, screening, and progression despite cessation of therapy. Arch. Ophthalmol. 2011, 129, 30–39. [Google Scholar] [CrossRef]
- Kellner, U.; Kellner, S.; Weinitz, S. Chloroquine retinopathy: Lipofuscin- and melanin-related fundus autofluorescence, optical coherence tomography and multifocal electroretinography. Doc. Ophthalmol. 2008, 116, 119–127. [Google Scholar] [CrossRef]
- Kellner, S.; Weinitz, S.; Kellner, U. Spectral domain optical coherence tomography detects early stages of chloroquine retinopathy similar to multifocal electroretinography, fundus autofluorescence and near-infrared autofluorescence. Br. J. Ophthalmol. 2009, 93, 1444–1447. [Google Scholar] [CrossRef]
- Mahon, G.J.; Anderson, H.R.; Gardiner, T.A.; McFarlane, S.; Archer, D.B.; Stitt, A.W. Chloroquine causes lysosomal dysfunction in neural retina and RPE: Implications for retinopathy. Curr. Eye Res. 2004, 28, 277–284. [Google Scholar] [CrossRef] [PubMed]
- Borrelli, E.; Battista, M.; Cascavilla, M.L.; Viganò, C.; Borghesan, F.; Nicolini, N.; Clemente, L.; Sacconi, R.; Barresi, C.; Marchese, A.; et al. Impact of structural changes on multifocal electroretinography in patients with use of hydroxychloroquine. Investig. Ophthalmol. Vis. Sci. 2021, 62, 28. [Google Scholar] [CrossRef] [PubMed]
- Tsang, A.C.; Ahmadi, S.; Hamilton, J.; Gao, J.; Virgili, G.; Coupland, S.G.; Gottlieb, C.C. The diagnostic utility of multifocal electroretinography in detecting chloroquine and hydroxychloroquine retinal toxicity. Am. J. Ophthalmol. 2019, 206, 132–139. [Google Scholar] [CrossRef] [PubMed]
- Adam, M.K.; Covert, D.J.; Stepien, K.E.; Han, D.P. Quantitative assessment of the 103-hexagon multifocal electroretinogram in detection of hydroxychloroquine retinal toxicity. Br. J. Ophthalmol. 2012, 96, 723–729. [Google Scholar] [CrossRef]
- Browning, D.J.; Lee, C. Relative sensitivity and specificity of 10-2 visual fields, multifocal electroretinography, and spectral domain optical coherence tomography in detecting hydroxychloroquine and chloroquine retinopathy. Clin. Ophthalmol. 2014, 8, 1389–1399. [Google Scholar] [CrossRef]


| Characteristics | Group 1 | Group 1A | Group 1B | Group 2 |
|---|---|---|---|---|
| All Patients with HCQ Use | Patients with HCQ Use <5 Years | Patients with HCQ Use >5 Years | Controls | |
| Eyes enrolled (patients) | 38 (76 eyes) | 19 (38 eyes) | 19 (38 eyes) | 18 (36 eyes) |
| Age (years) | 49.7 ± 14.4 | 49.4 ± 14.8 | 49.9 ± 12.4 | 46.9 ± 16.7 |
| Gender | ||||
| Male | 1 | 1 | 0 | 1 |
| Female | 37 | 18 | 19 | 17 |
| BCVA (logMAR) | 0.08 ± 0.07 | 0.07 ± 0.06 | 0.09 ± 0.10 | 0.08 ± 0.06 |
| Duration of HCQ therapy | 8.60 ± 6.09 | 4.05 ± 1.14 | 13.42 ± 5.48 |
| Macular Ganglion Cell Complex (μm) | Group 1A | Group 1B | Group 2 | p Values |
|---|---|---|---|---|
| Patients with HCQ Use <5 Years | Patients with HCQ Use >5 Years | Controls | ||
| Superior temporal | 69.2 ± 7.16 | 68.6 ± 6.5 | 70.1 ± 6.68 | 0.186 |
| Superior | 68.8 ± 4.77 | 69.1 ± 5.71 | 70.3 ± 6.44 | 0.934 |
| Superiornasal | 74.1 ± 6.74 | 74.7 ± 5.68 | 73.9 ± 7.11 | 0.828 |
| Inferiortemporal | 71.1 ± 5.29 | 71.6 ± 7.33 | 71.0 ± 8.18 | 0.712 |
| Inferior | 65.2 ± 4.49 | 63.6 ± 10.2 | 67.3 ± 5.8 | 0.972 |
| Inferior nasal | 69.4 ± 6.84 | 67.5 ± 10.9 | 67.1 ± 12.8 | 0.751 |
| Average | 69.7 ± 4.76 | 69.5 ± 6.58 | 70.3 ± 8.29 | 0.527 |
| ERG Values (nV/deg2) | Group 1A | Group 1B | Group 2 | p Values |
|---|---|---|---|---|
| Patients with HCQ Use <5 Years | Patients with HCQ Use >5 Years | Controls | ||
| Ring | ||||
| R1 | 132.0 ± 35.8 | 125.0 ±39.9 | 139.0 ± 29.8 | 0.366 |
| R2 | 53.0 ± 13.7 | 52.4 ± 14.0 | 55.6 ± 16.4 | 0.853 |
| R3 | 30.9 ± 8.06 | 33.1 ± 9.15 | 30.0 ± 7.36 | 0.404 |
| R4 | 22.5 ± 4.38 | 23.6 ± 5.89 | 21.9 ± 5.62 | 0.688 |
| R5 | 20.4 ± 3.55 | 21.9 ± 4.97 | 20.6 ± 6.56 | 0.253 |
| Quadrants | ||||
| 1 | 24.1 ± 4.43 | 25.9 ± 6.36 | 25.1 ± 7.54 | 0.602 |
| 2 | 24.0 ± 5.08 | 25.4 ± 5.68 | 24.6 ± 5.33 | 0.407 |
| 3 | 24.3 ± 5.86 | 26.1 ± 7.06 | 25.2 ± 6.9 | 0.452 |
| 4 | 25.6 ± 5.66 | 26.8 ± 7.59 | 22.9 ± 8.01 | 0.221 |
| Average | 24.2 ± 3.59 | 25.9 ± 5.82 | 24.2 ± 6.75 | 0.47 |
| ERG Values (ms) | Group 1A | Group 1B | Group 2 | p Values |
|---|---|---|---|---|
| Patients with HCQ Use <5 Years | Patients with HCQ Use >5 Years | Controls | ||
| Ring | ||||
| R1 | 40.5 ± 3.12 | 39.2 ± 2.97 | 39.1 ± 3.57 | 0.206 |
| R2 | 35.4 ± 3.1 | 35.3 ± 1.9 | 35.8 ± 3.68 | 0.811 |
| R3 | 33.9 ± 1.4 | 33.9 ± 1.67 | 35.0 ± 3.63 | 0.386 |
| R4 | 36.0 ± 4.4 | 34.8 ± 1.48 | 36.4 ± 4.7 | 0.776 |
| R5 | 36.3 ± 1.86 | 36.1 ± 1.53 | 39.3 ± 6.11 | 0.488 |
| Quadrants | ||||
| 1 | 34.8 ± 1.46 | 34.9 ± 1.5 | 36.0 ± 4.76 | 0.961 |
| 2 | 38.1 ± 4.06 | 37.1 ± 2.72 | 39.5 ± 5.76 | 0.657 |
| 3 | 37.5 ± 4.12 | 36.8 ± 2.79 | 37.9 ± 5.12 | 0.842 |
| 4 | 34.6 ± 1.36 | 34.7 ± 1.81 | 36.2 ± 4.77 | 0.769 |
| Average | 36.5 ± 4.42 | 35.5 ± 1.38 | 35.5 ± 1.54 | 0.988 |
| ERG Values (nV/deg2) | Group 1A | Group 1B | Group 2 | p Values |
|---|---|---|---|---|
| Patients with HCQ Use <5 Years | Patients with HCQ Use >5 Years | Controls | ||
| R1/R1 | 1 | 1 | 1 | |
| R1/R2 | 2.67 ± 1.01 | 3.27 ± 3.98 | 2.69 ± 0.86 | 0.759 |
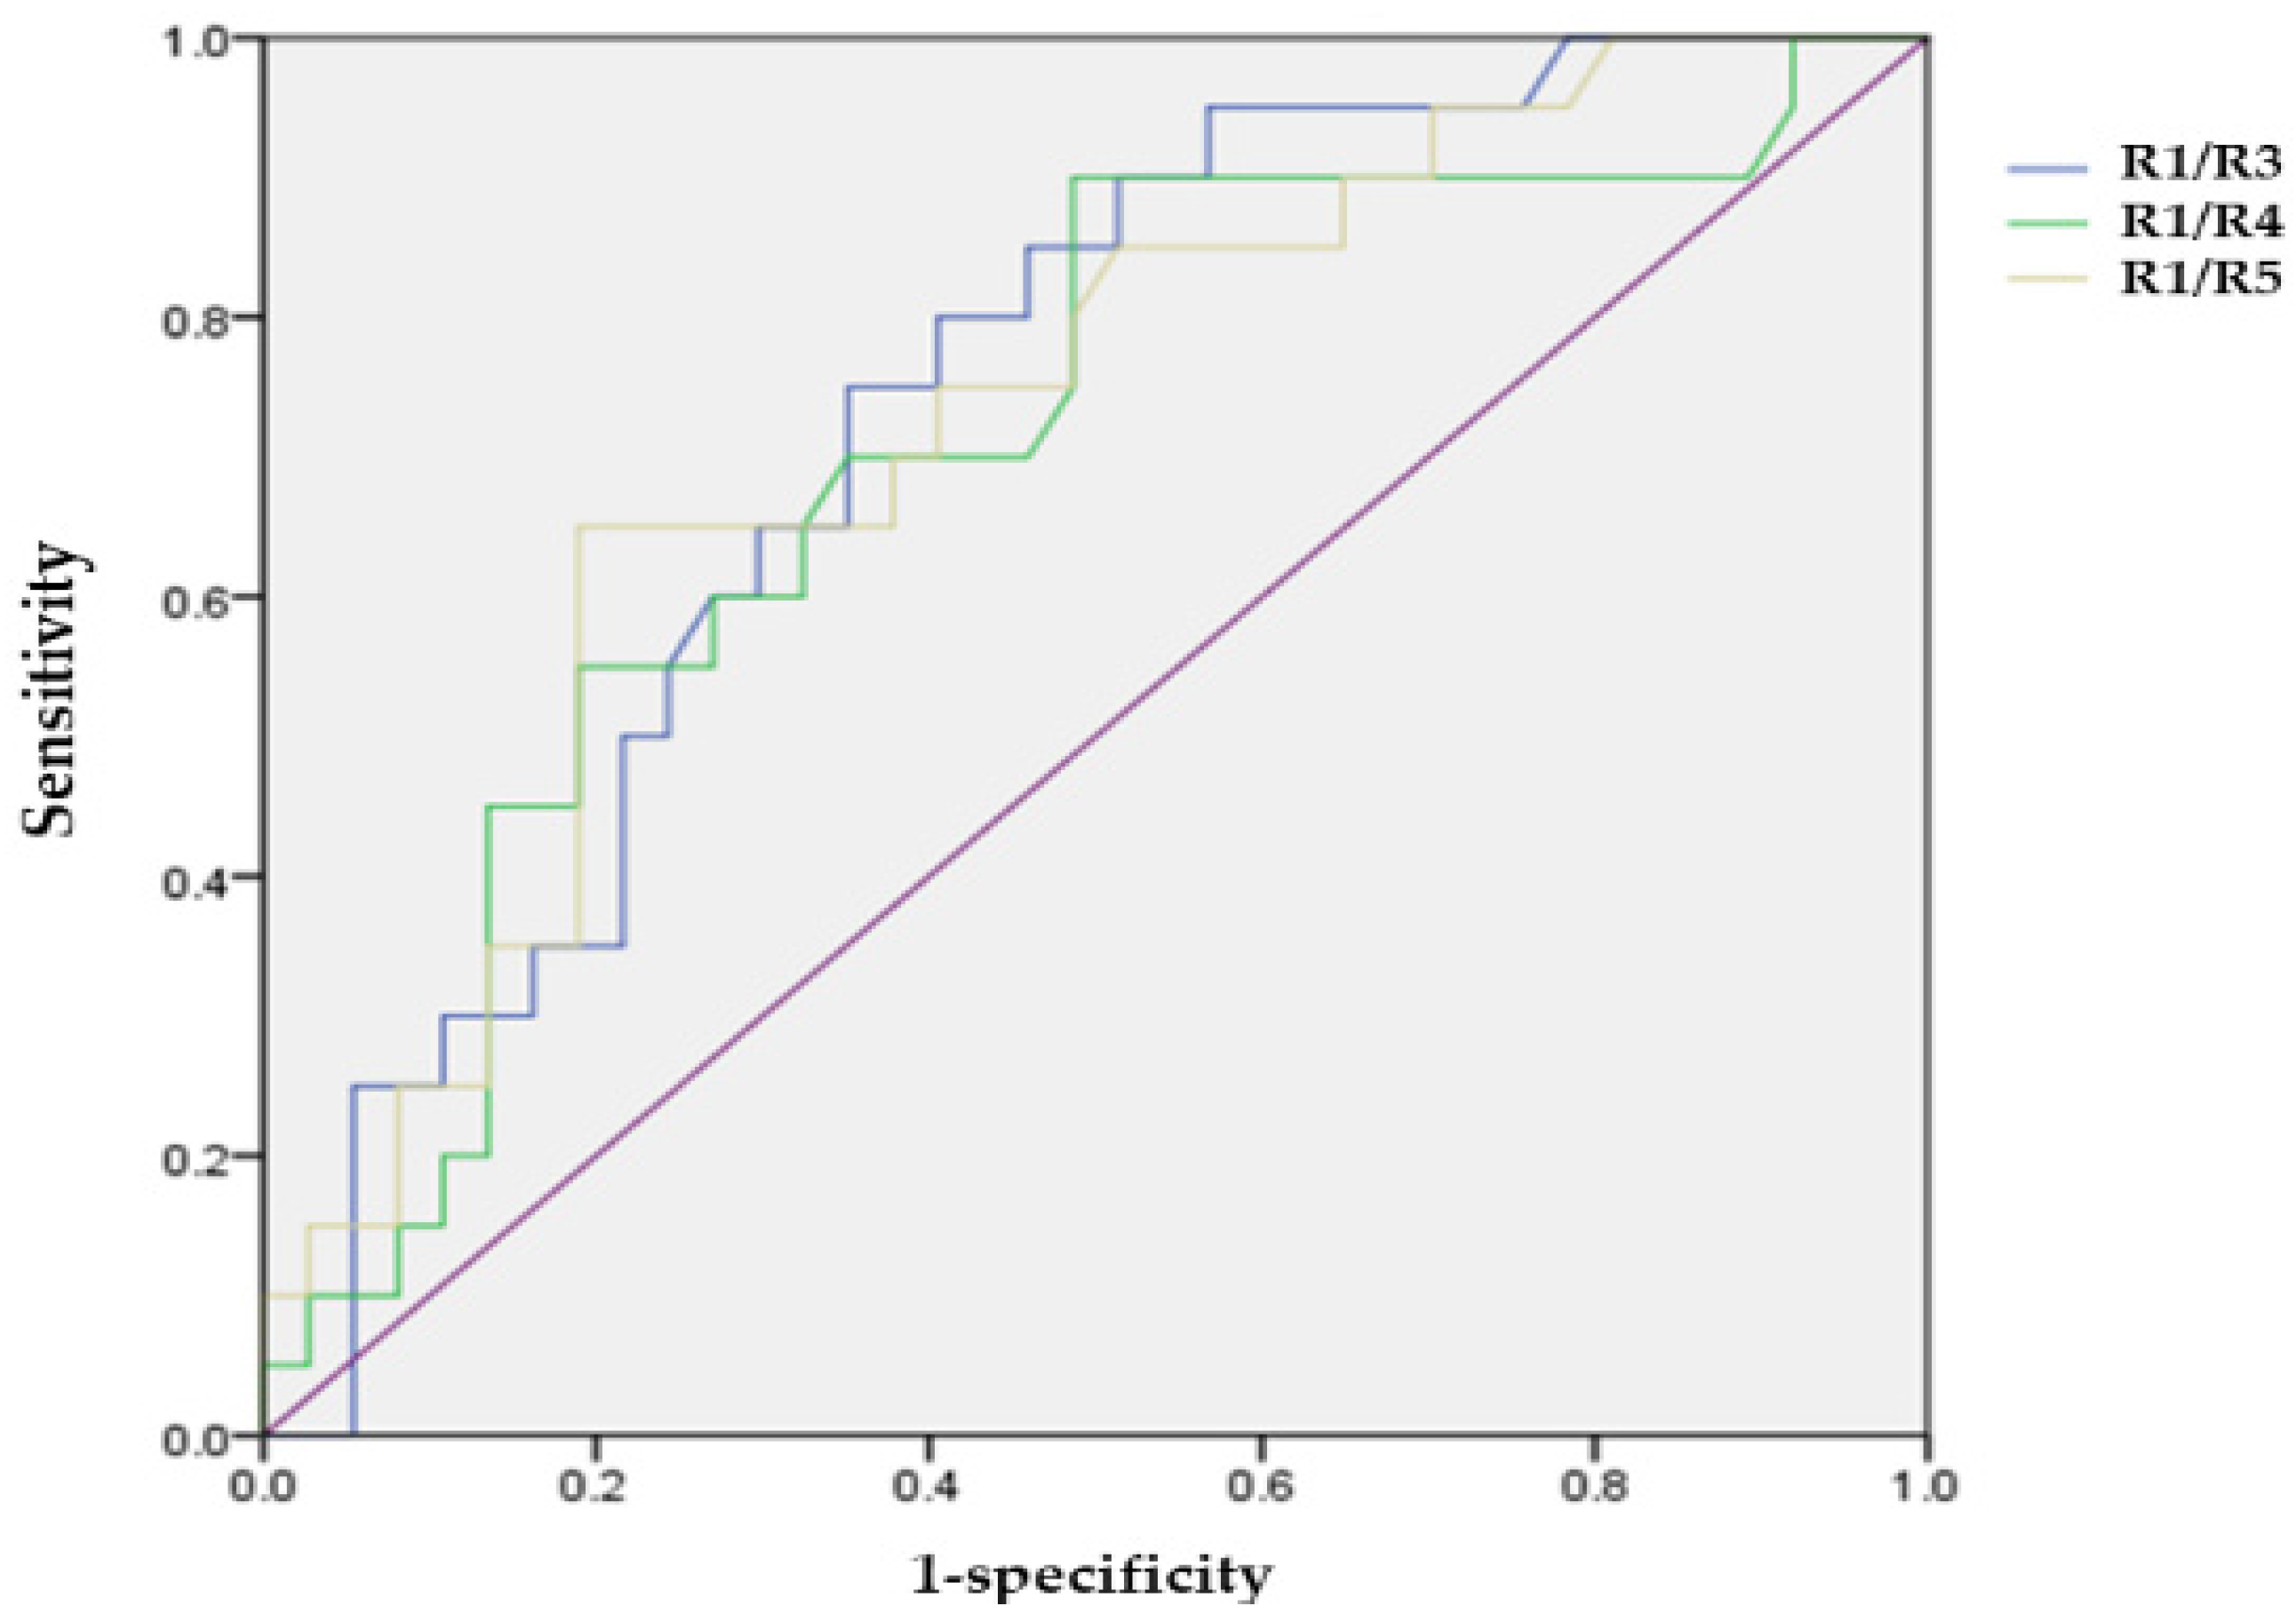
| R1/R3 | 4.58 ± 1.71 | 4.43 ± 3.41 | 4.74 ± 1.32 | 0.018 * |
| R1/R4 | 6.06 ± 1.73 | 5.57 ± 2.03 | 6.71 ± 2.03 | 0.029 * |
| R1/R5 | 6.61 ± 1.90 | 6.1 ± 2.57 | 7.6 ± 3.21 | 0.029 * |
Disclaimer/Publisher’s Note: The statements, opinions and data contained in all publications are solely those of the individual author(s) and contributor(s) and not of MDPI and/or the editor(s). MDPI and/or the editor(s) disclaim responsibility for any injury to people or property resulting from any ideas, methods, instructions or products referred to in the content. |
© 2024 by the authors. Licensee MDPI, Basel, Switzerland. This article is an open access article distributed under the terms and conditions of the Creative Commons Attribution (CC BY) license (https://creativecommons.org/licenses/by/4.0/).
Share and Cite
Jung, S.H.; Park, Y.-H.; Park, Y.G. Subclinical Detection of Hydroxychloroquine-Induced Retinopathy in Patients with Systemic Lupus Erythematous Using Multifocal Electroretinography and Optical Coherence Tomography. J. Clin. Med. 2024, 13, 7663. https://doi.org/10.3390/jcm13247663
Jung SH, Park Y-H, Park YG. Subclinical Detection of Hydroxychloroquine-Induced Retinopathy in Patients with Systemic Lupus Erythematous Using Multifocal Electroretinography and Optical Coherence Tomography. Journal of Clinical Medicine. 2024; 13(24):7663. https://doi.org/10.3390/jcm13247663
Chicago/Turabian StyleJung, Suk Hoon, Young-Hoon Park, and Young Gun Park. 2024. "Subclinical Detection of Hydroxychloroquine-Induced Retinopathy in Patients with Systemic Lupus Erythematous Using Multifocal Electroretinography and Optical Coherence Tomography" Journal of Clinical Medicine 13, no. 24: 7663. https://doi.org/10.3390/jcm13247663
APA StyleJung, S. H., Park, Y.-H., & Park, Y. G. (2024). Subclinical Detection of Hydroxychloroquine-Induced Retinopathy in Patients with Systemic Lupus Erythematous Using Multifocal Electroretinography and Optical Coherence Tomography. Journal of Clinical Medicine, 13(24), 7663. https://doi.org/10.3390/jcm13247663