Clinical Validation of Respiratory Rate Estimation Using Acoustic Signals from a Wearable Device

 , , and
Abstract
1. Introduction
2. Materials and Methods
2.1. Study Design and Setting
- A prospective observational study was conducted at Imperial College London by continuously collecting data for up to one hour from healthy volunteers. The study approval was granted by an institutional review board: Local Ethics Committee of Imperial College London (ICREC ref.: 18IC4358).
- A retrospective validation was carried out using previously collected data [22] from patients that had been referred for diagnosis of obstructive sleep apnea (OSA) (Trial registration number: NCT03544086).
2.2. Patient and Public Involvement
2.3. Eligibility Criteria
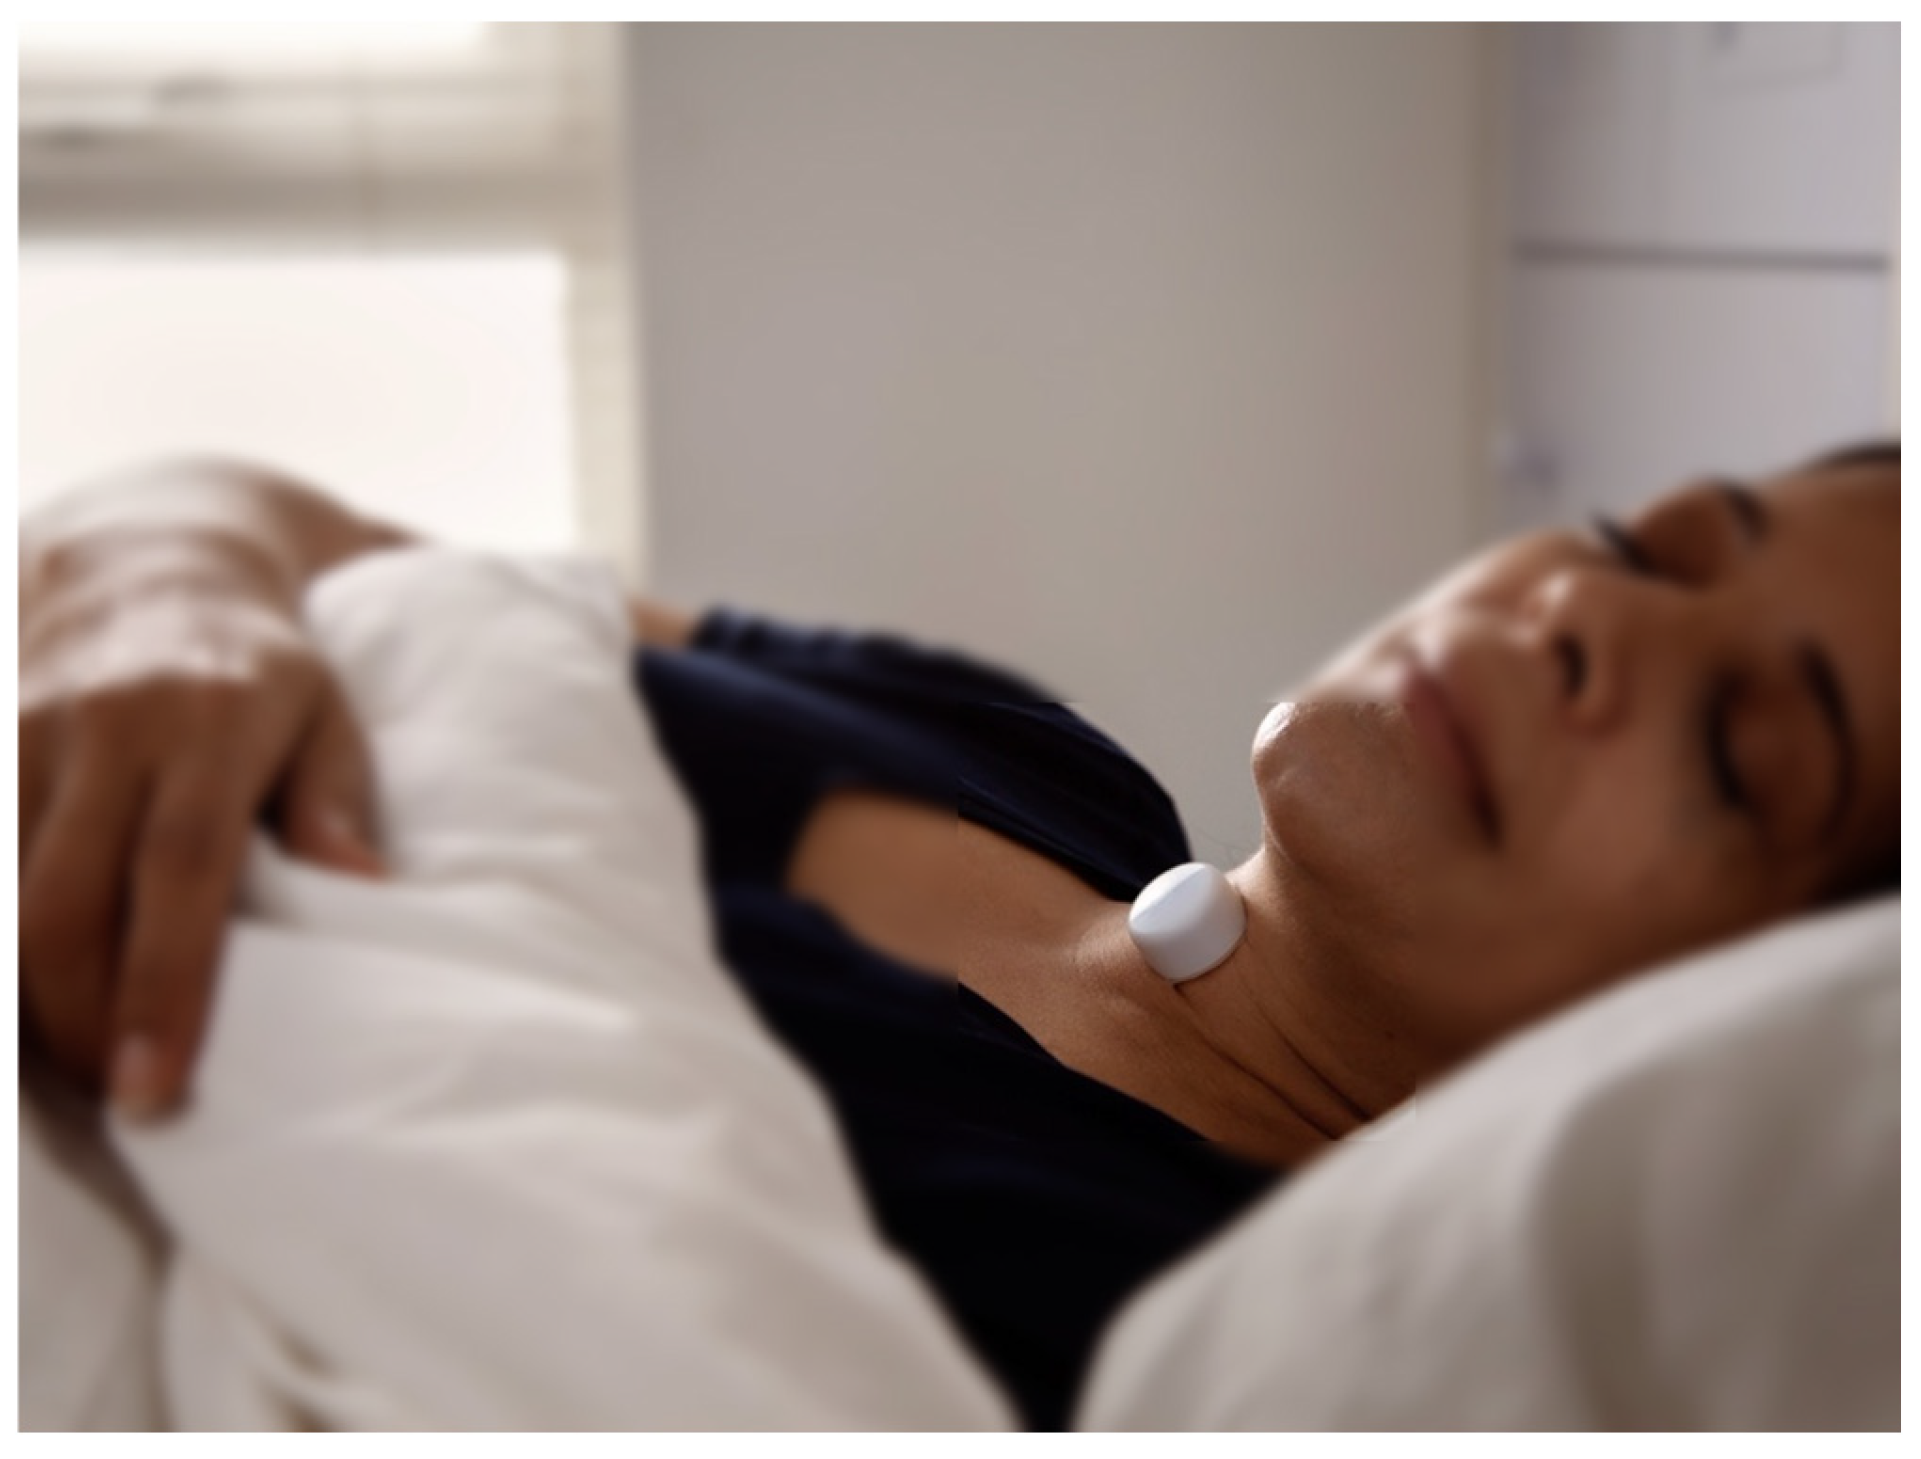
2.4. Description of Test Device: AcuPebble RE100
2.5. Description of Reference Device (Prospective Study): Capnostream™35
2.6. Description of Reference Device (Retrospective Validation): Embletta MPR Sleep System
2.7. Prospective Study Data Collection
- Guided Breathing: In this phase, subjects followed a visual metronome to obtain paired measurements at a pre-defined rate. This phase represented a no-artifact condition.
- With Artifacts: In this phase, the subjects would no longer follow the visual metronome. They breathed normally while artificial noise was applied through speakers, or performed tasks to mimic some possible physiological artifacts during sleep, such as coughing, groaning, and head movements.
2.7.1. Guided Breathing
2.7.2. With Artifacts
2.8. Sample Size
2.9. Statistical Analysis
3. Results
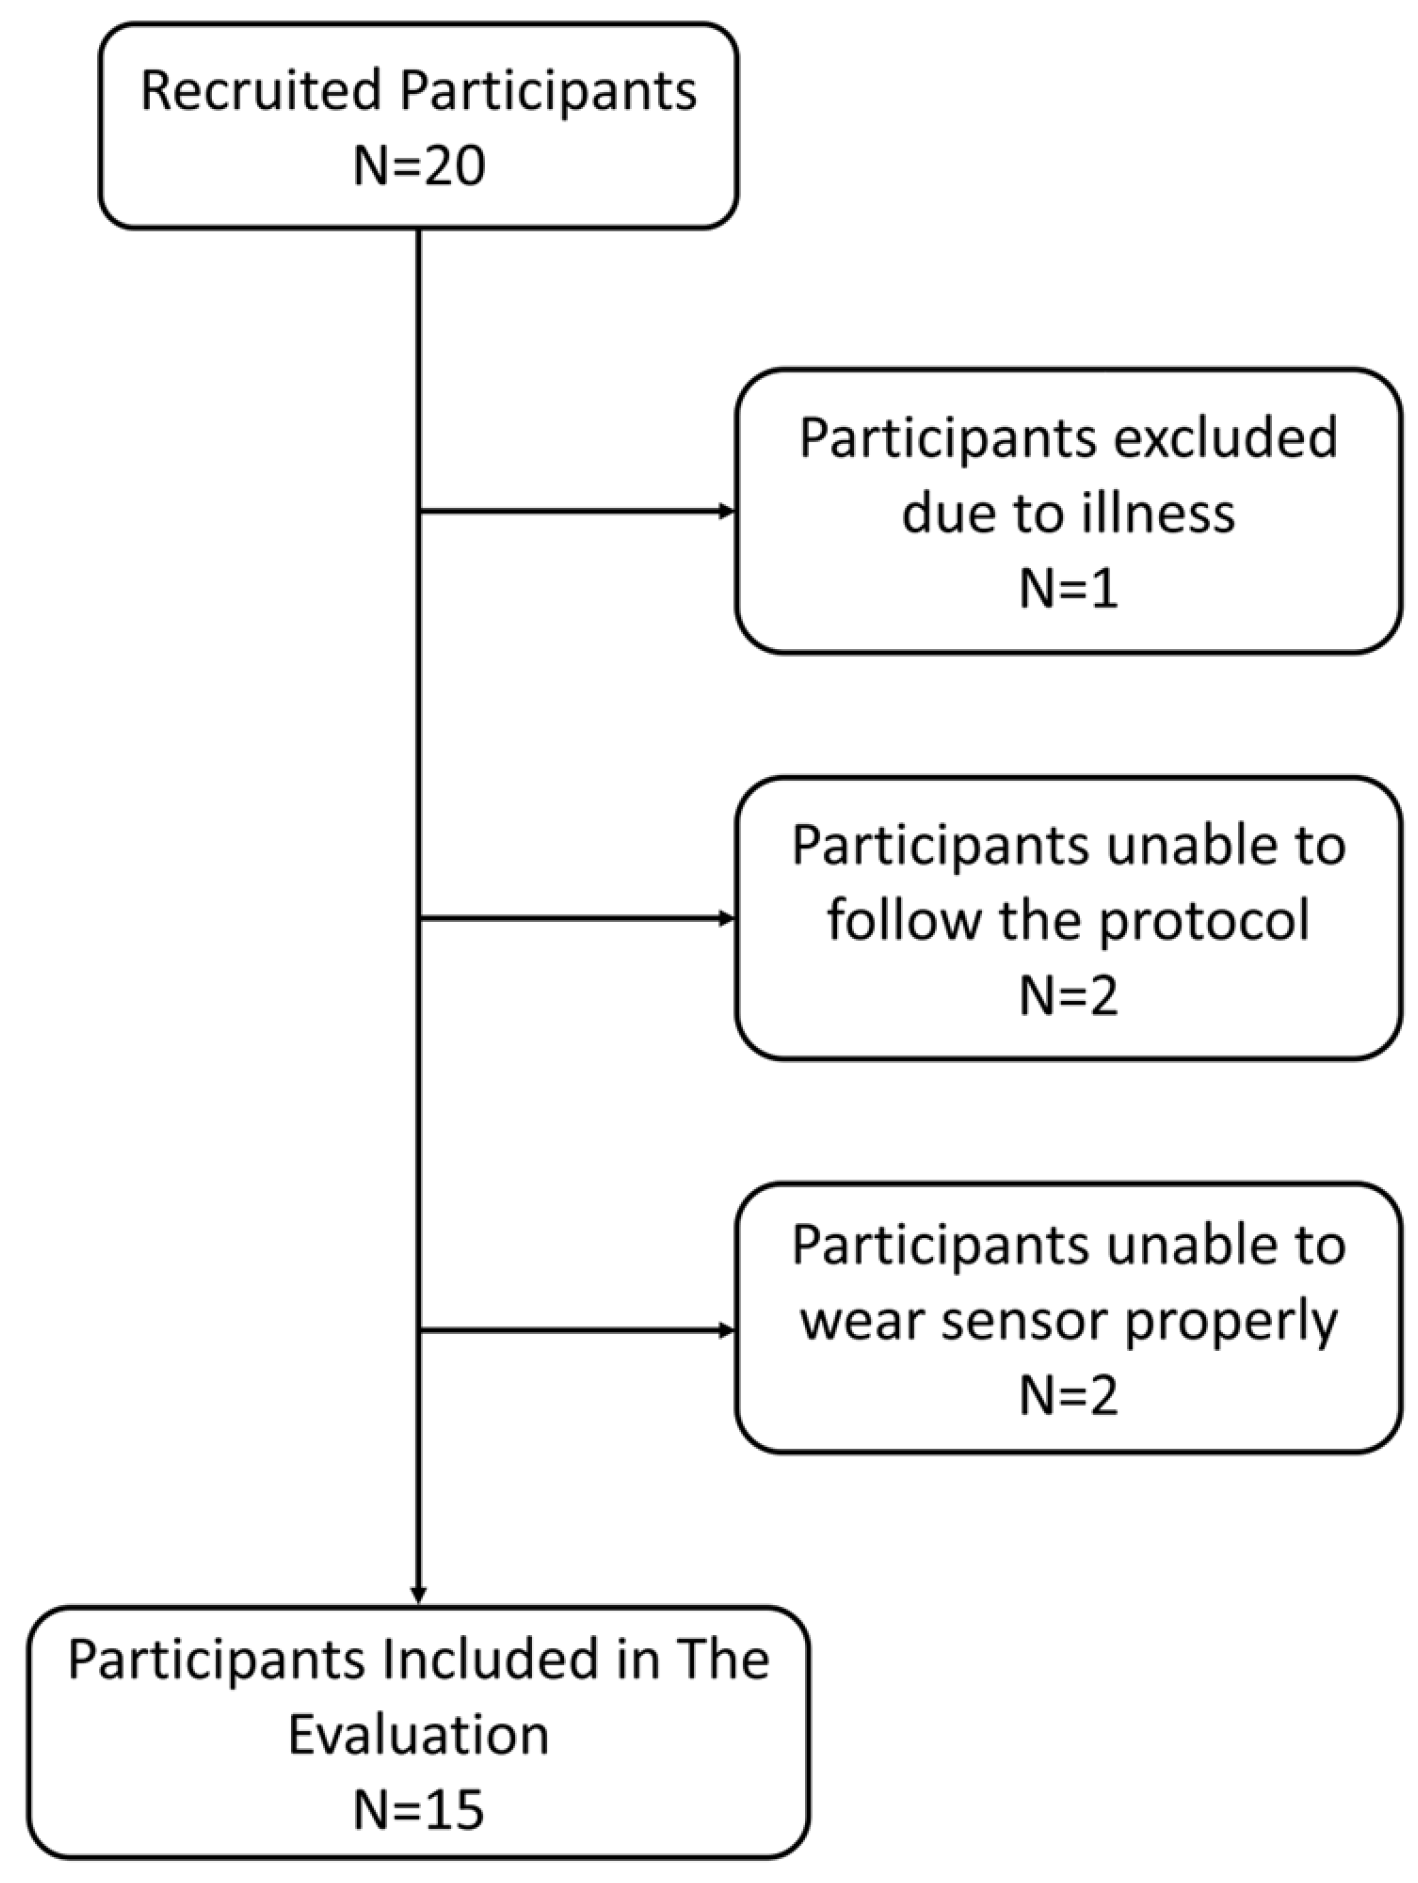
3.1. Participants
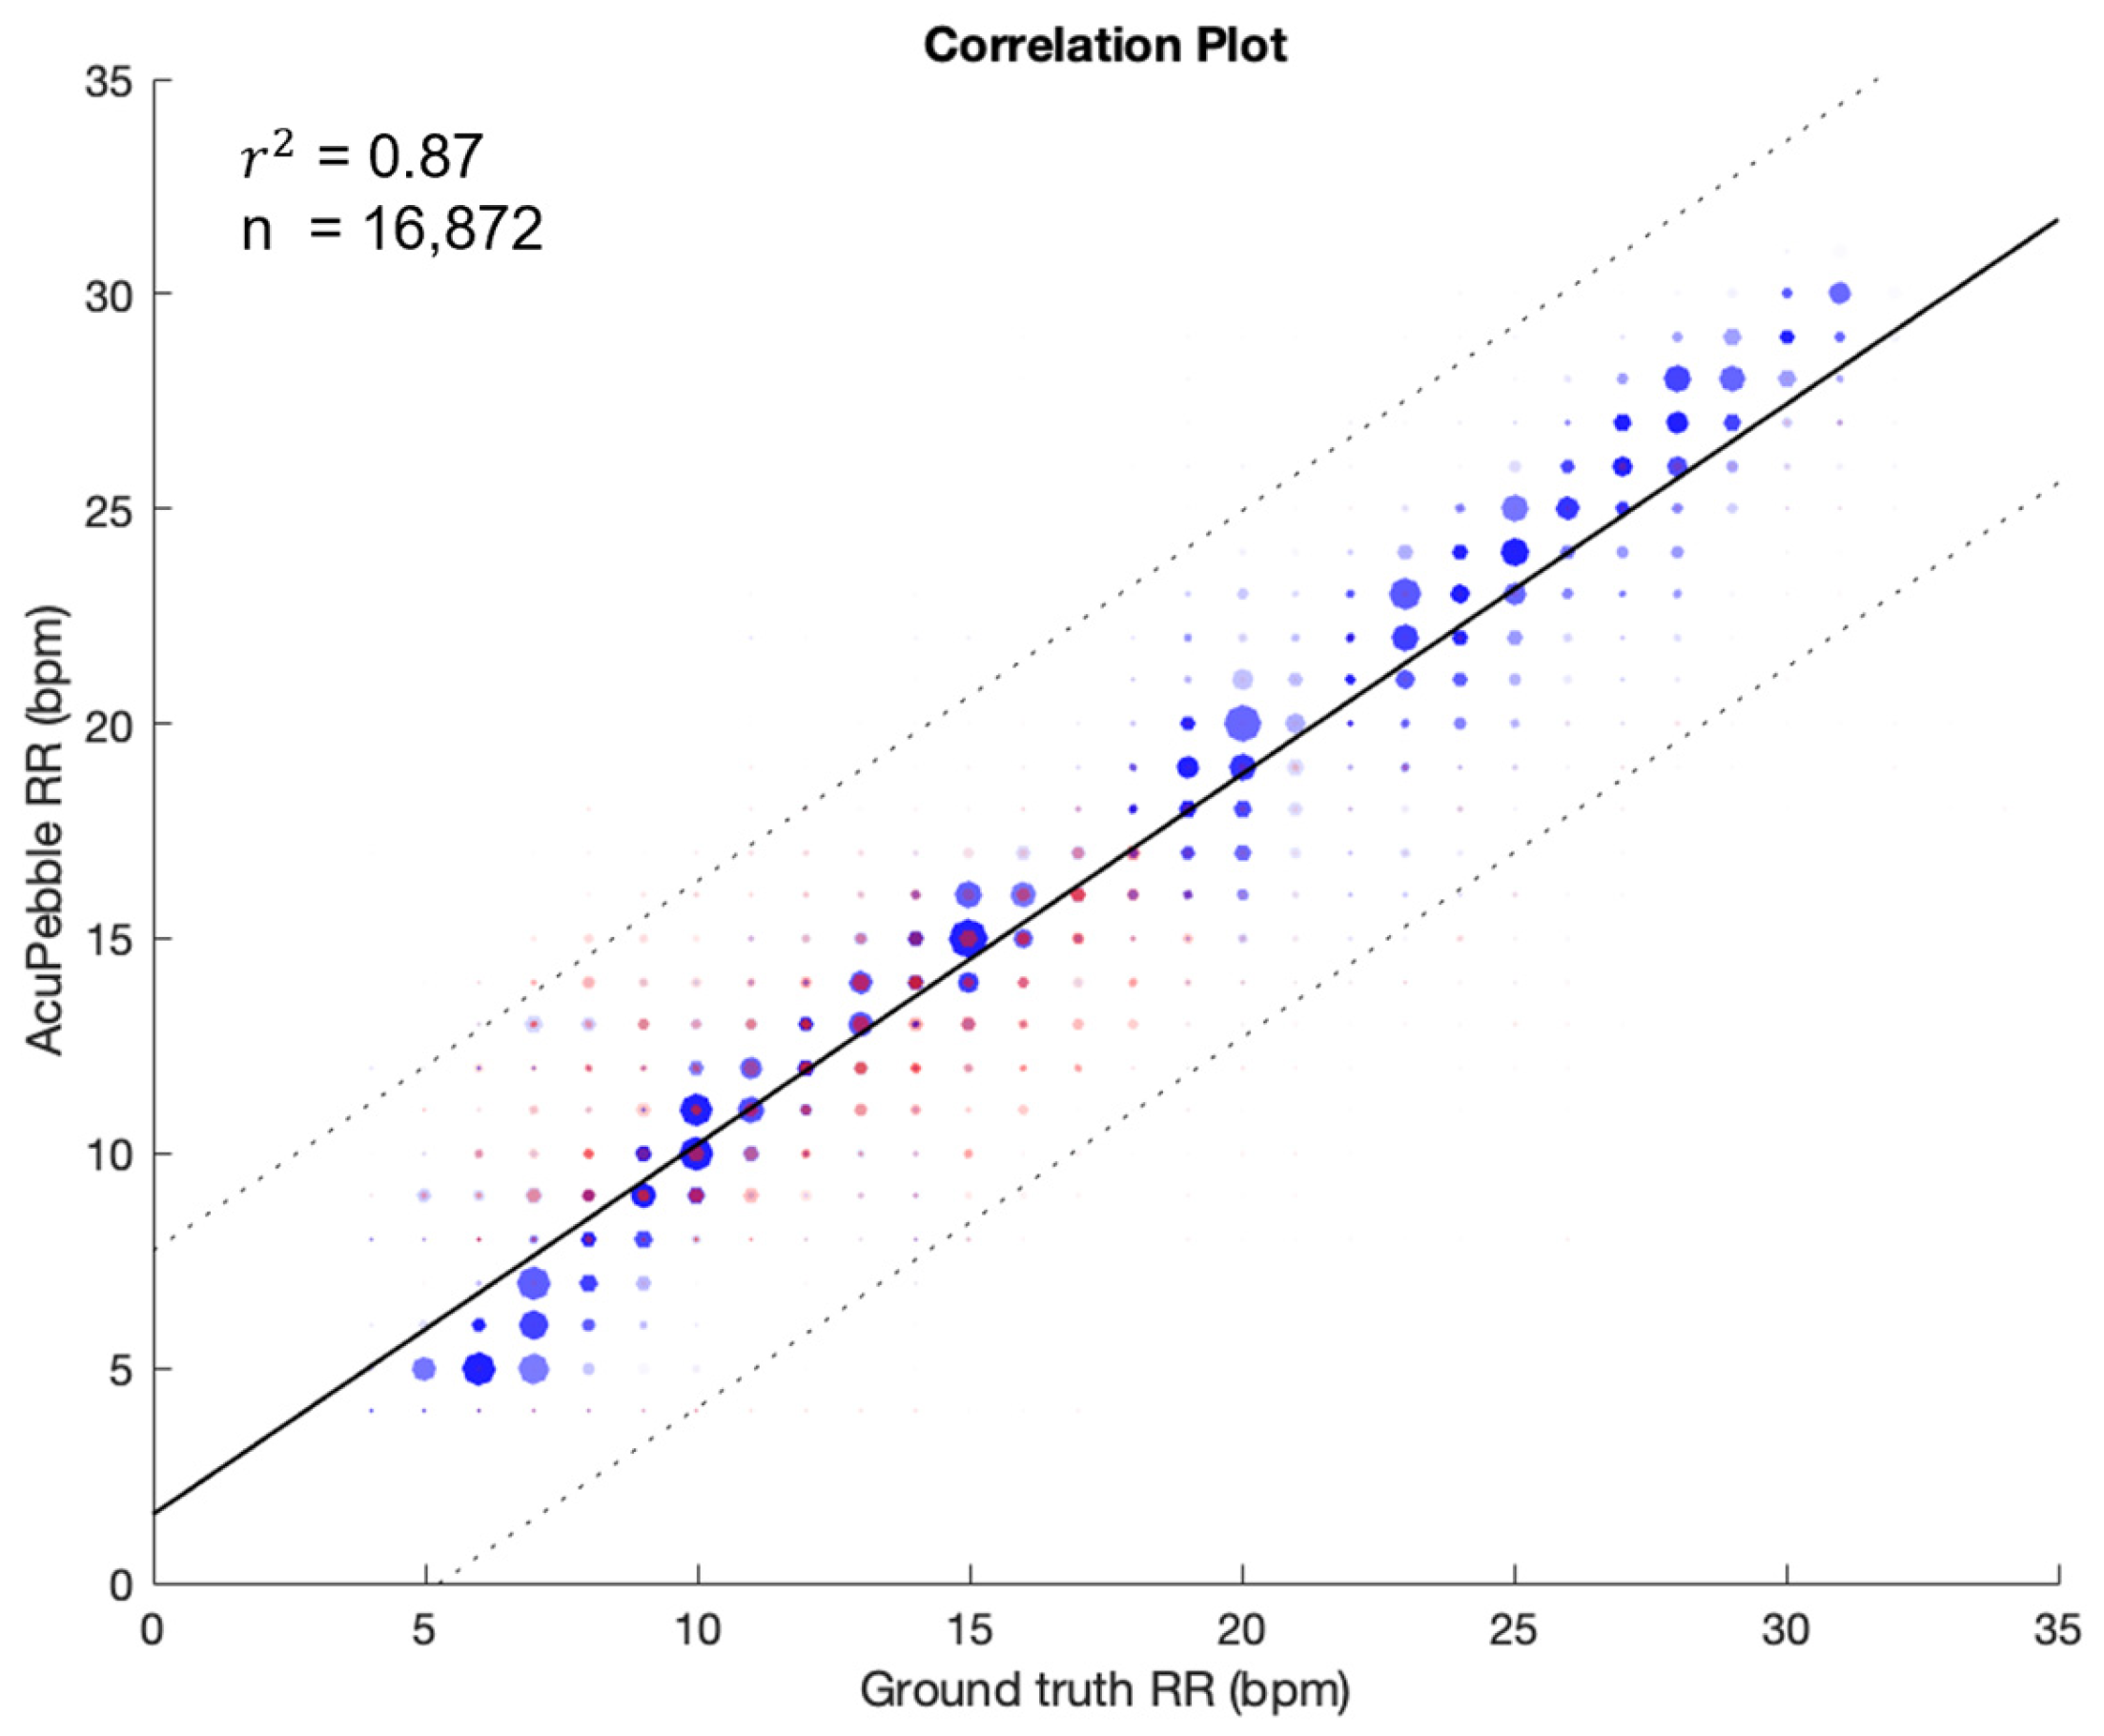
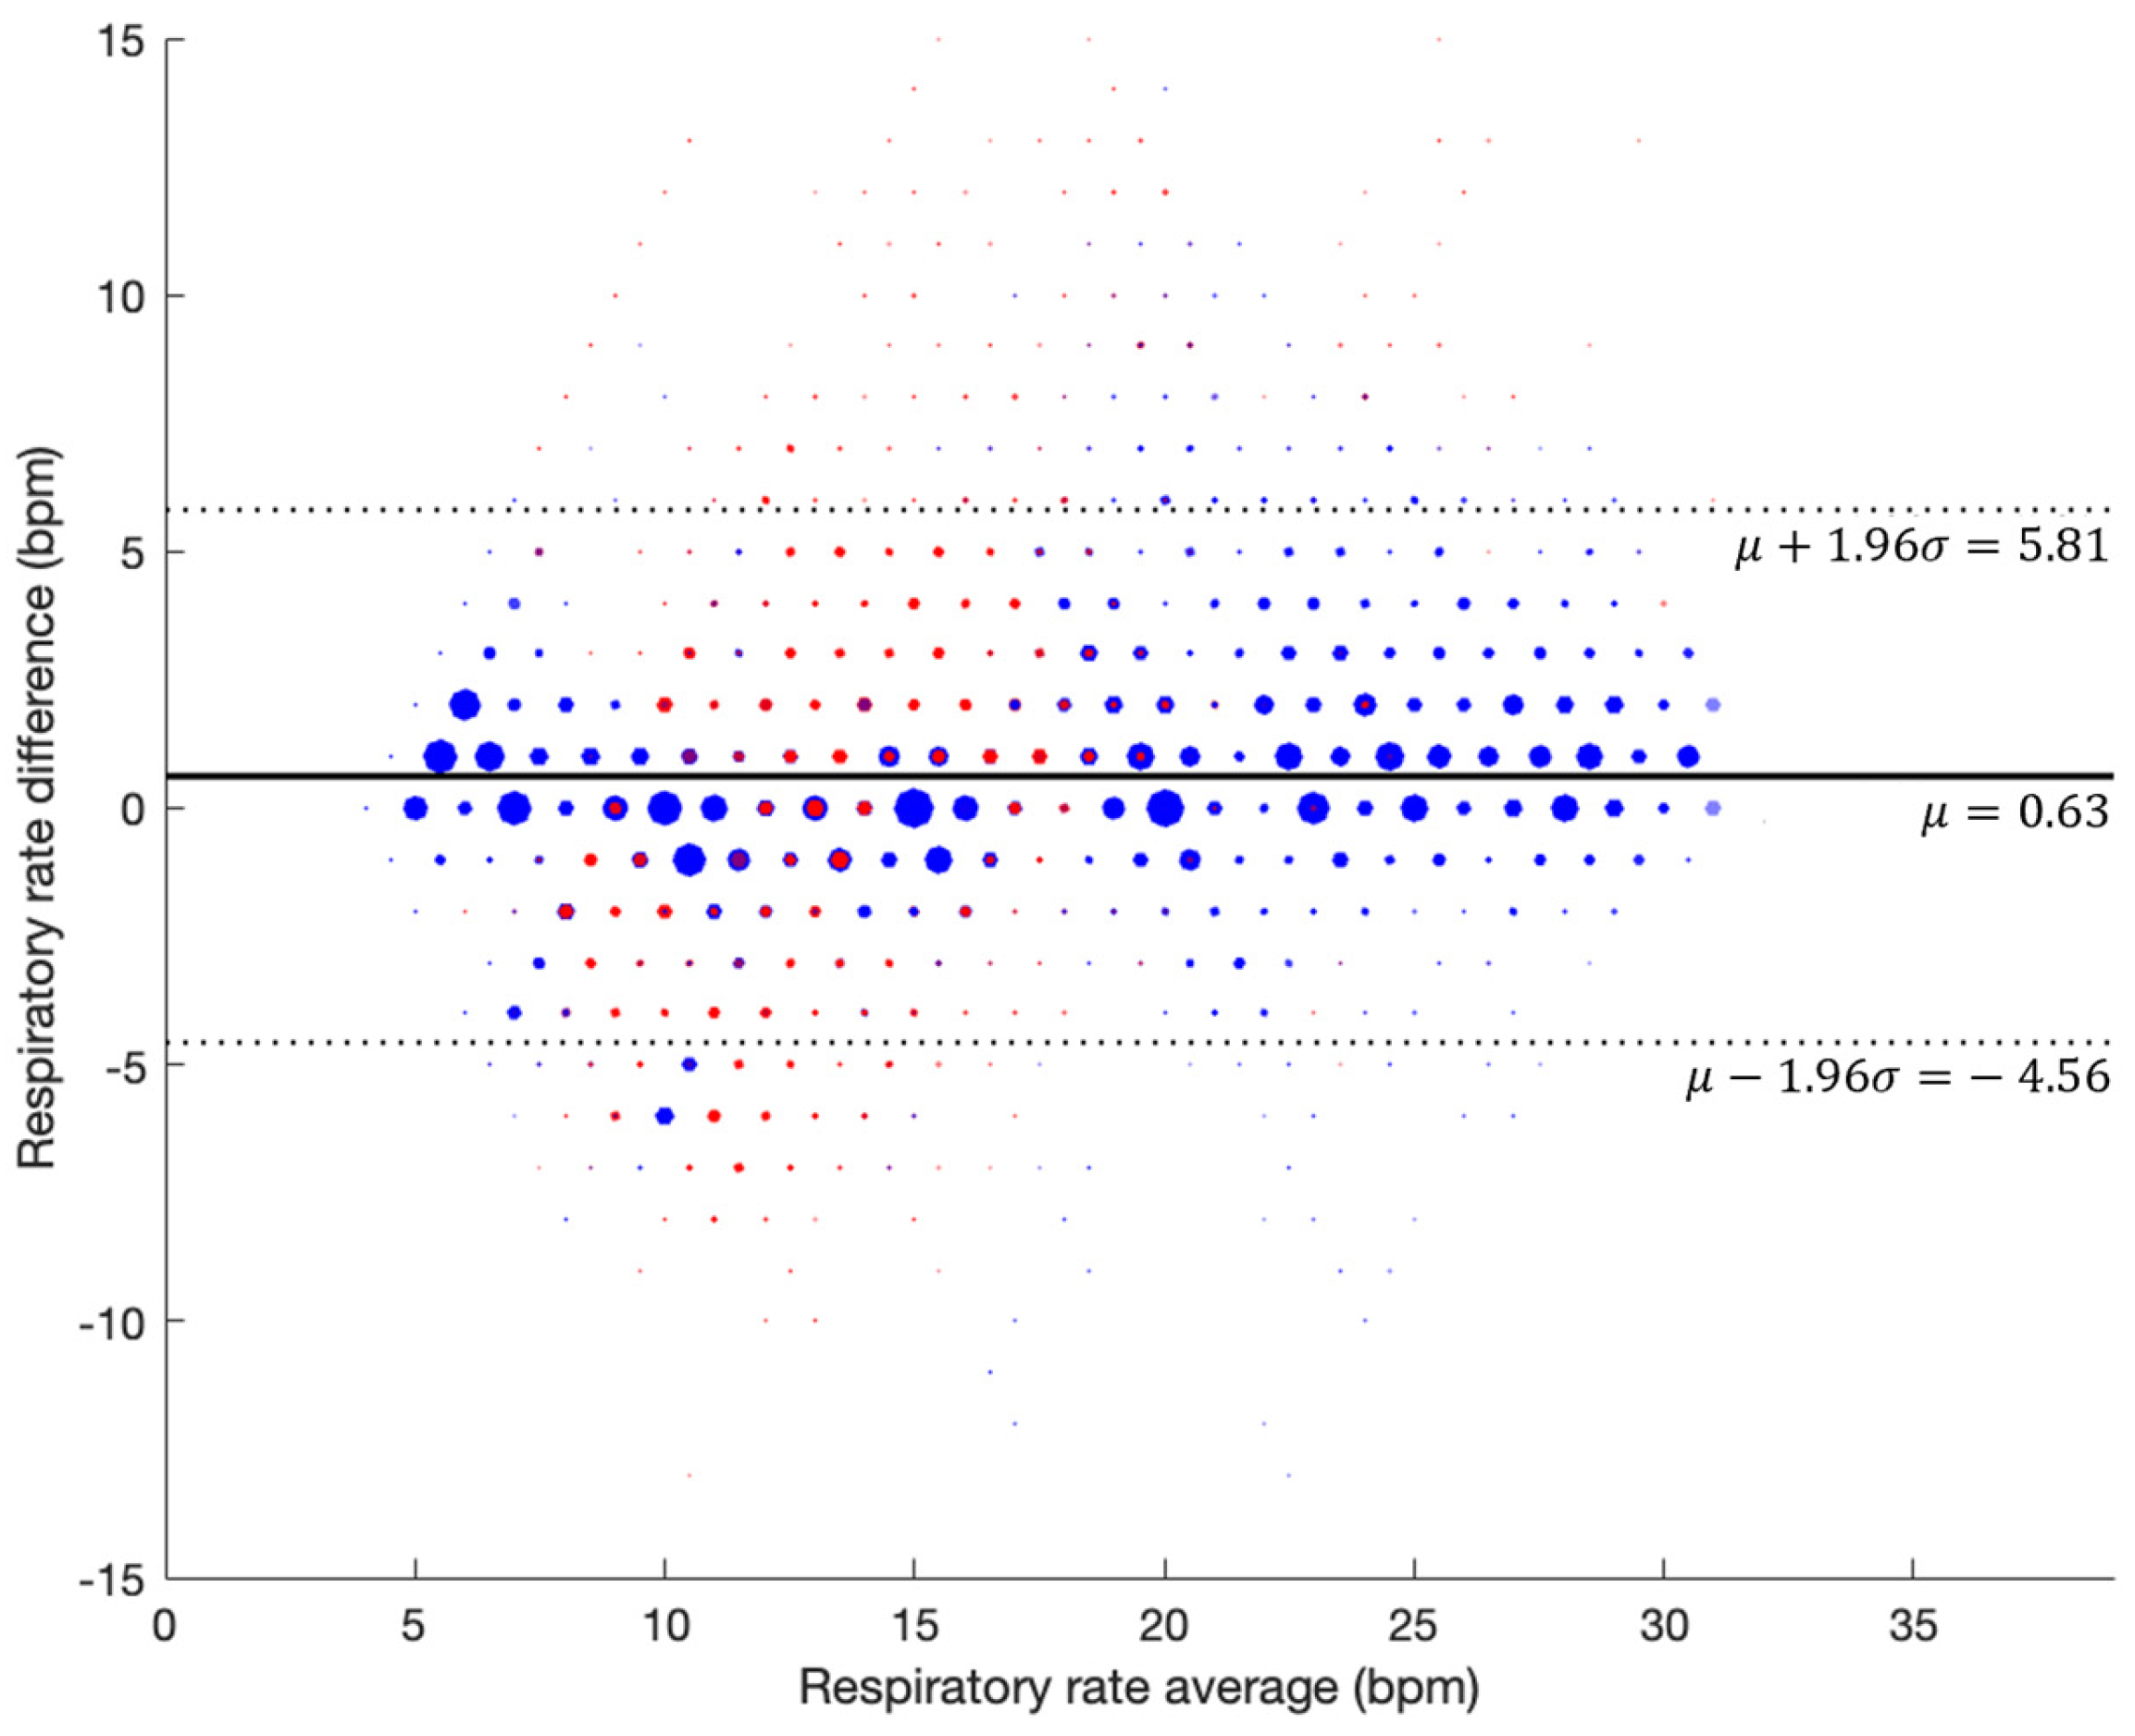
3.2. Respiratory Rate Accuracy in Controlled Experiment (Prospective Study)
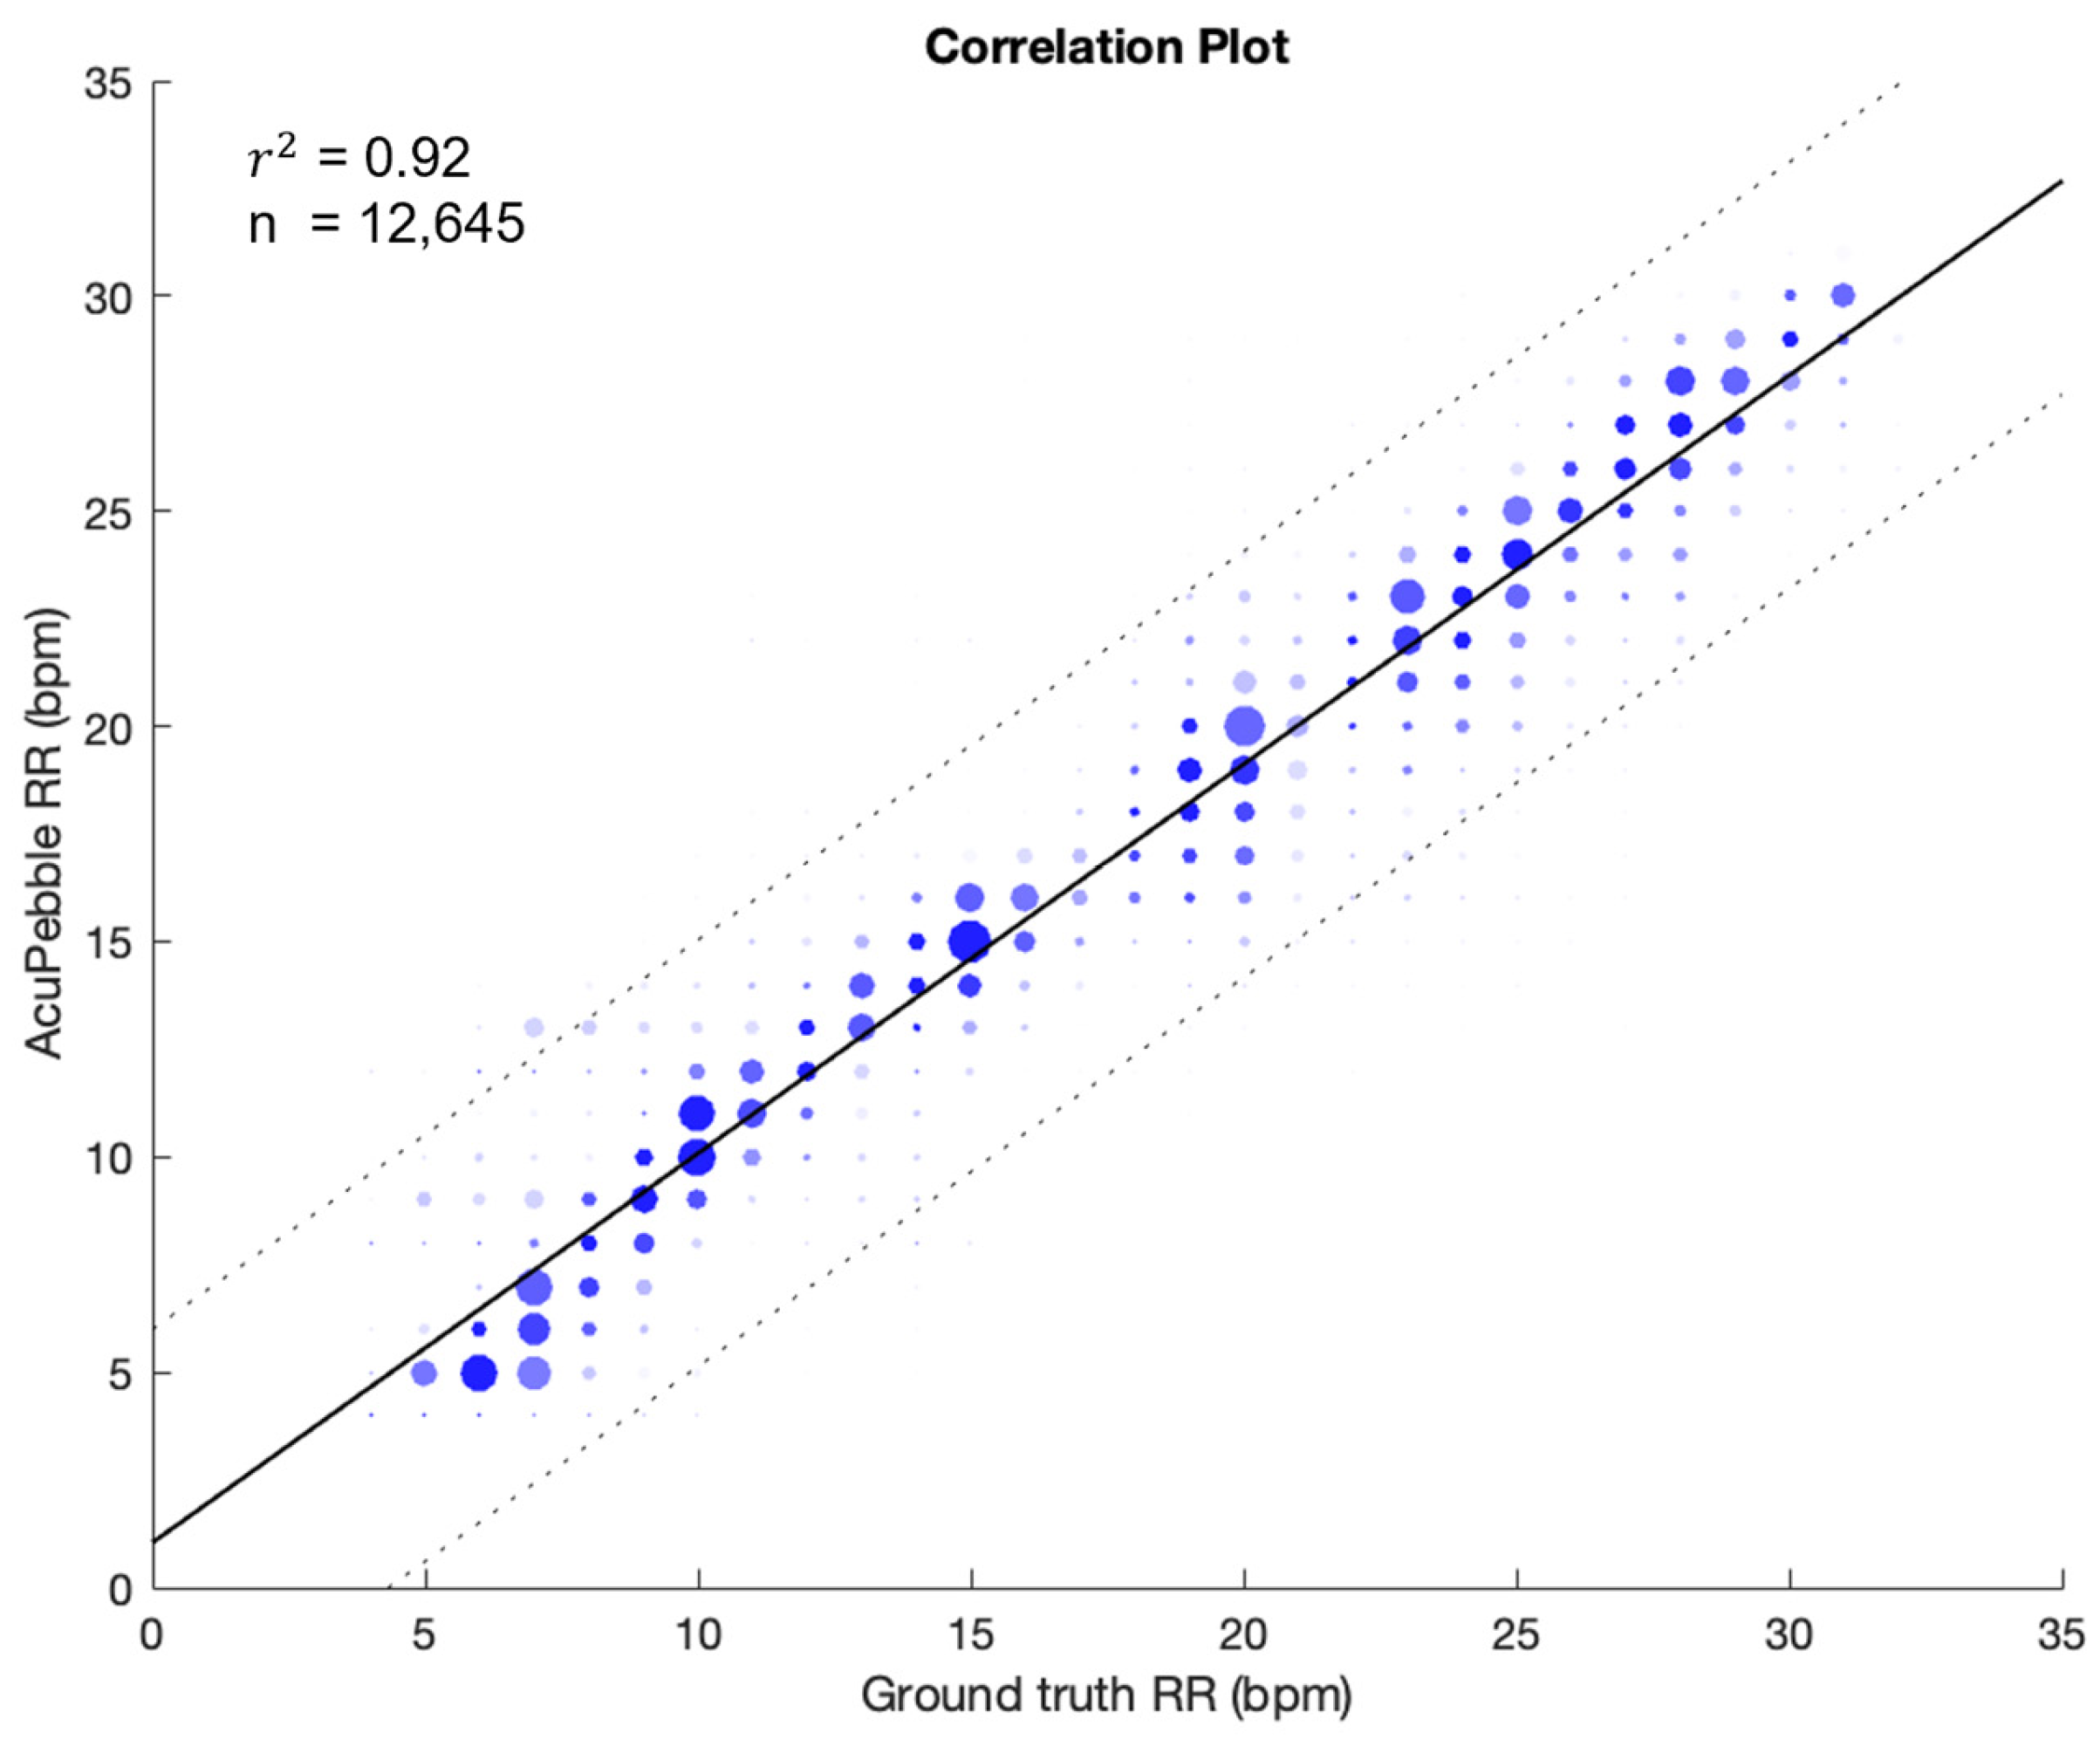
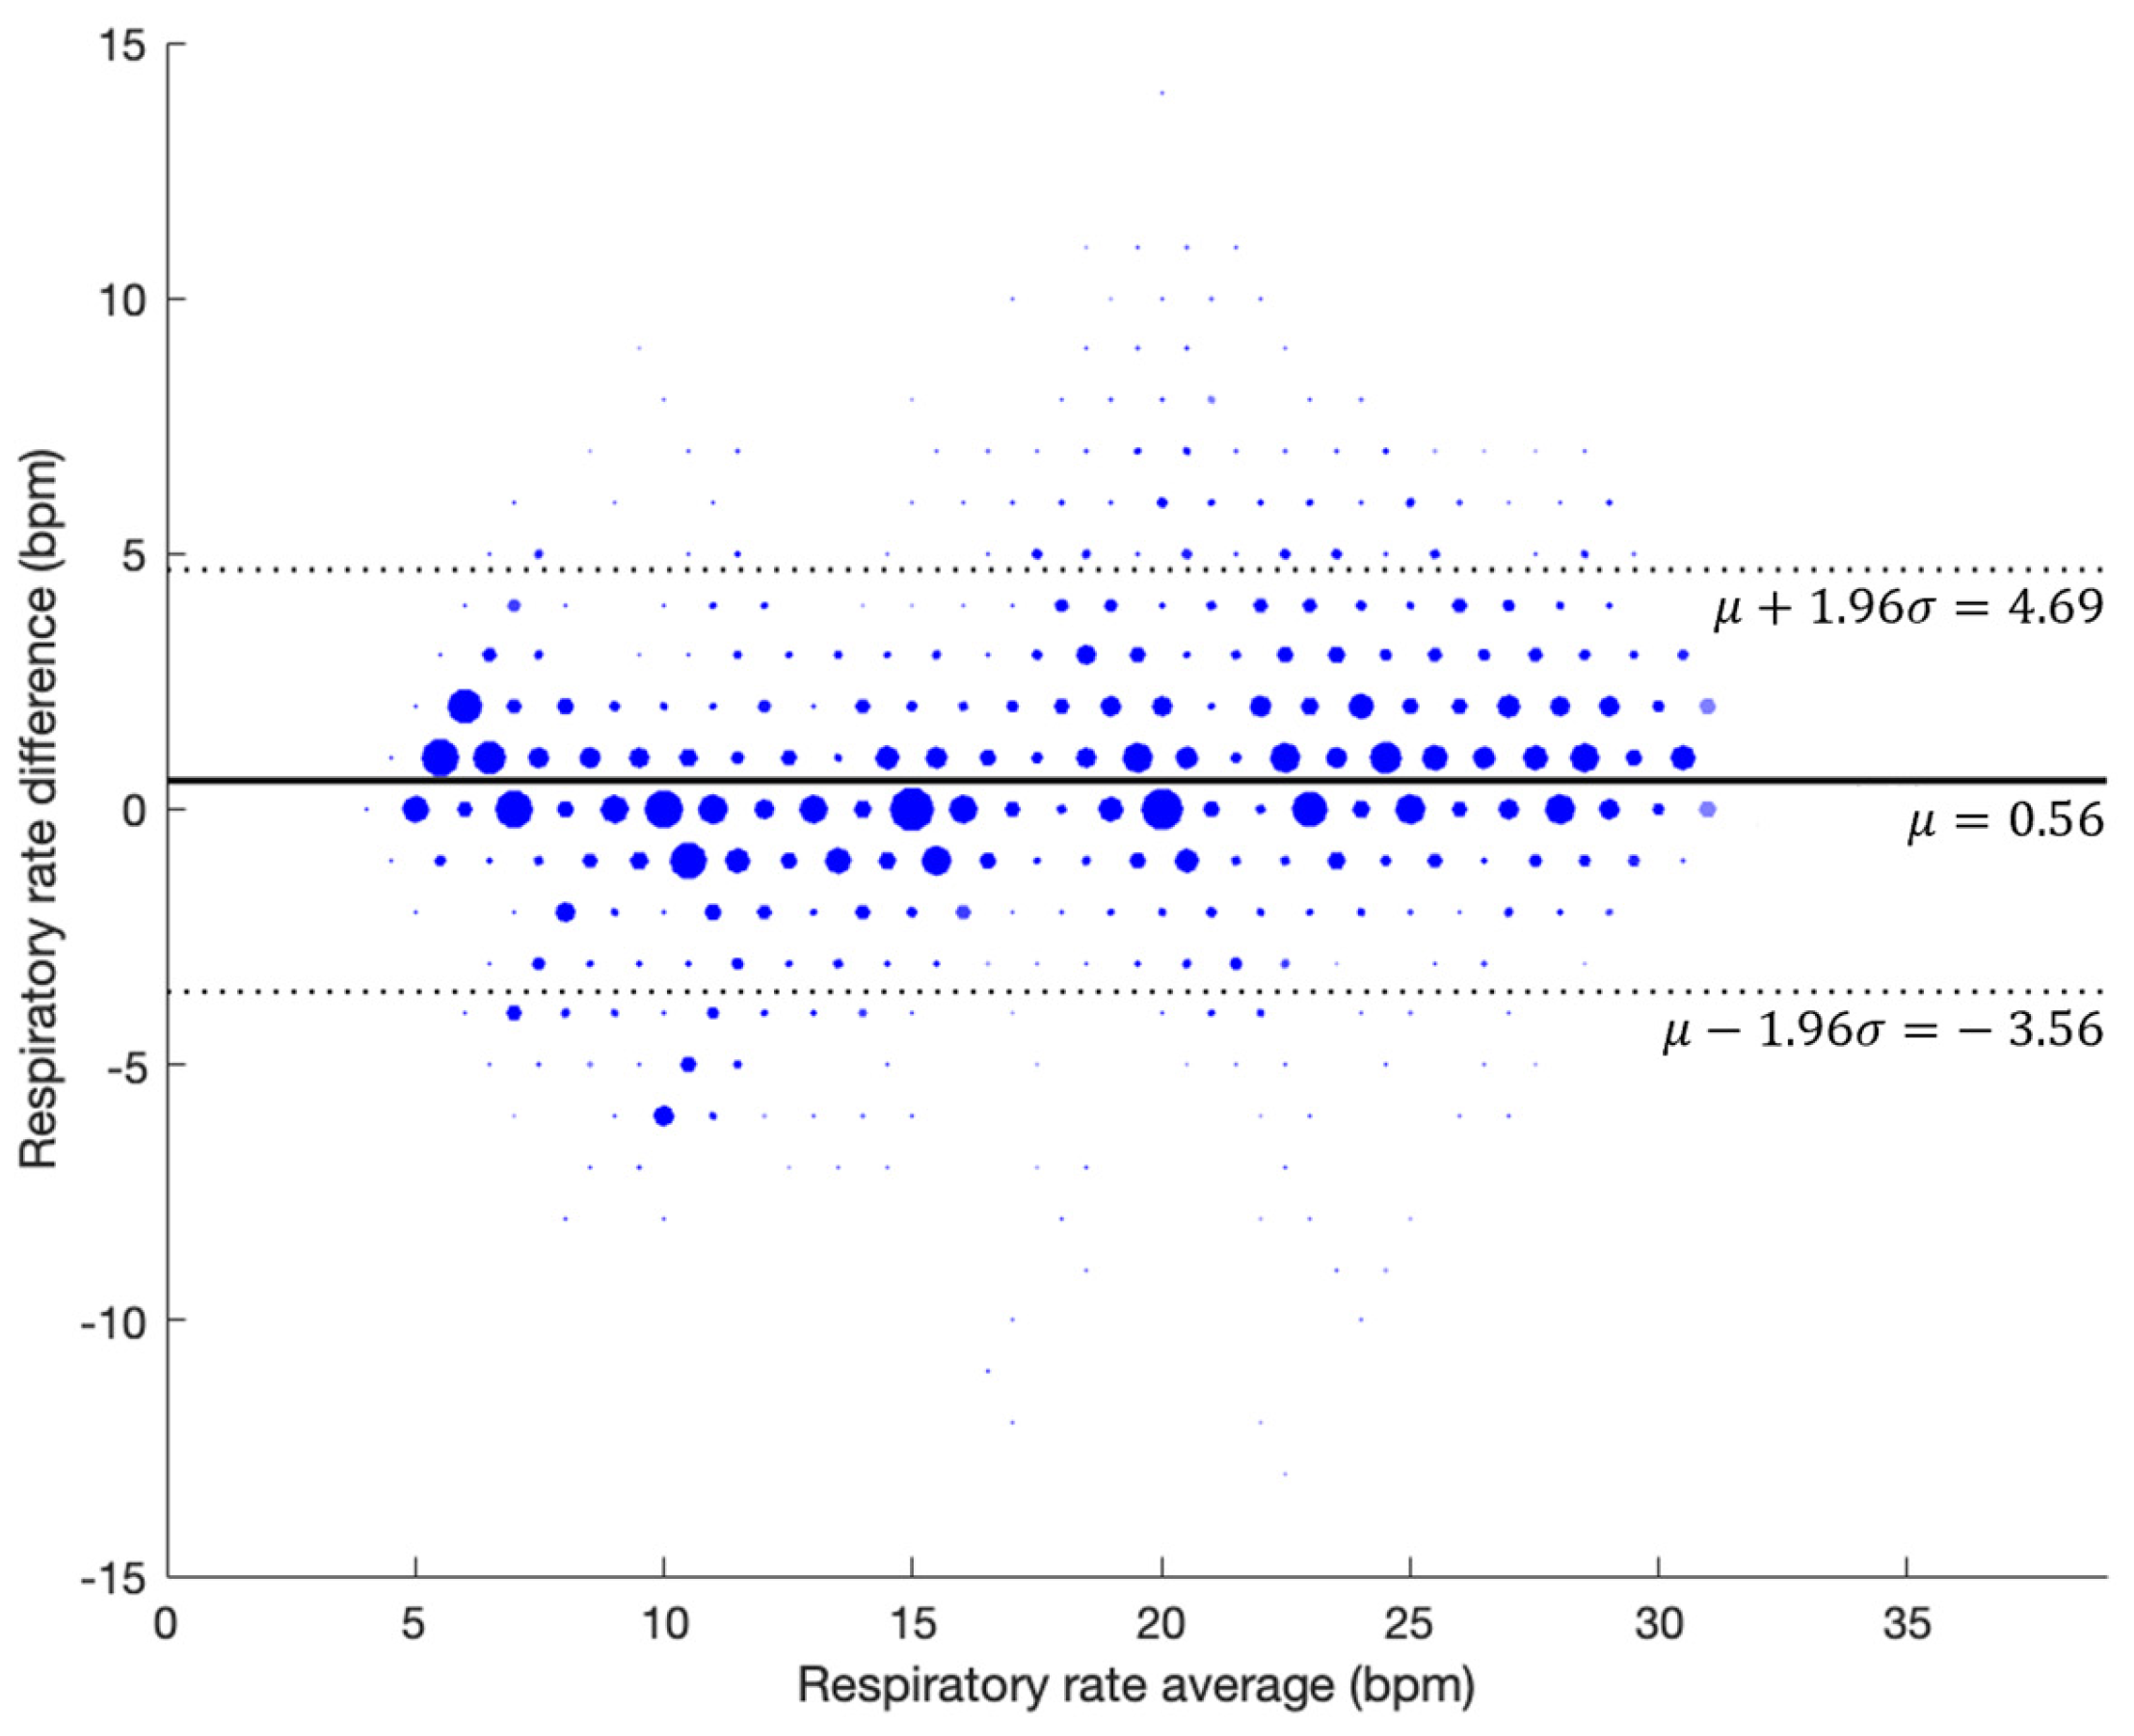
3.2.1. Guided Breathing (No Artifacts)
3.2.2. With Artifacts
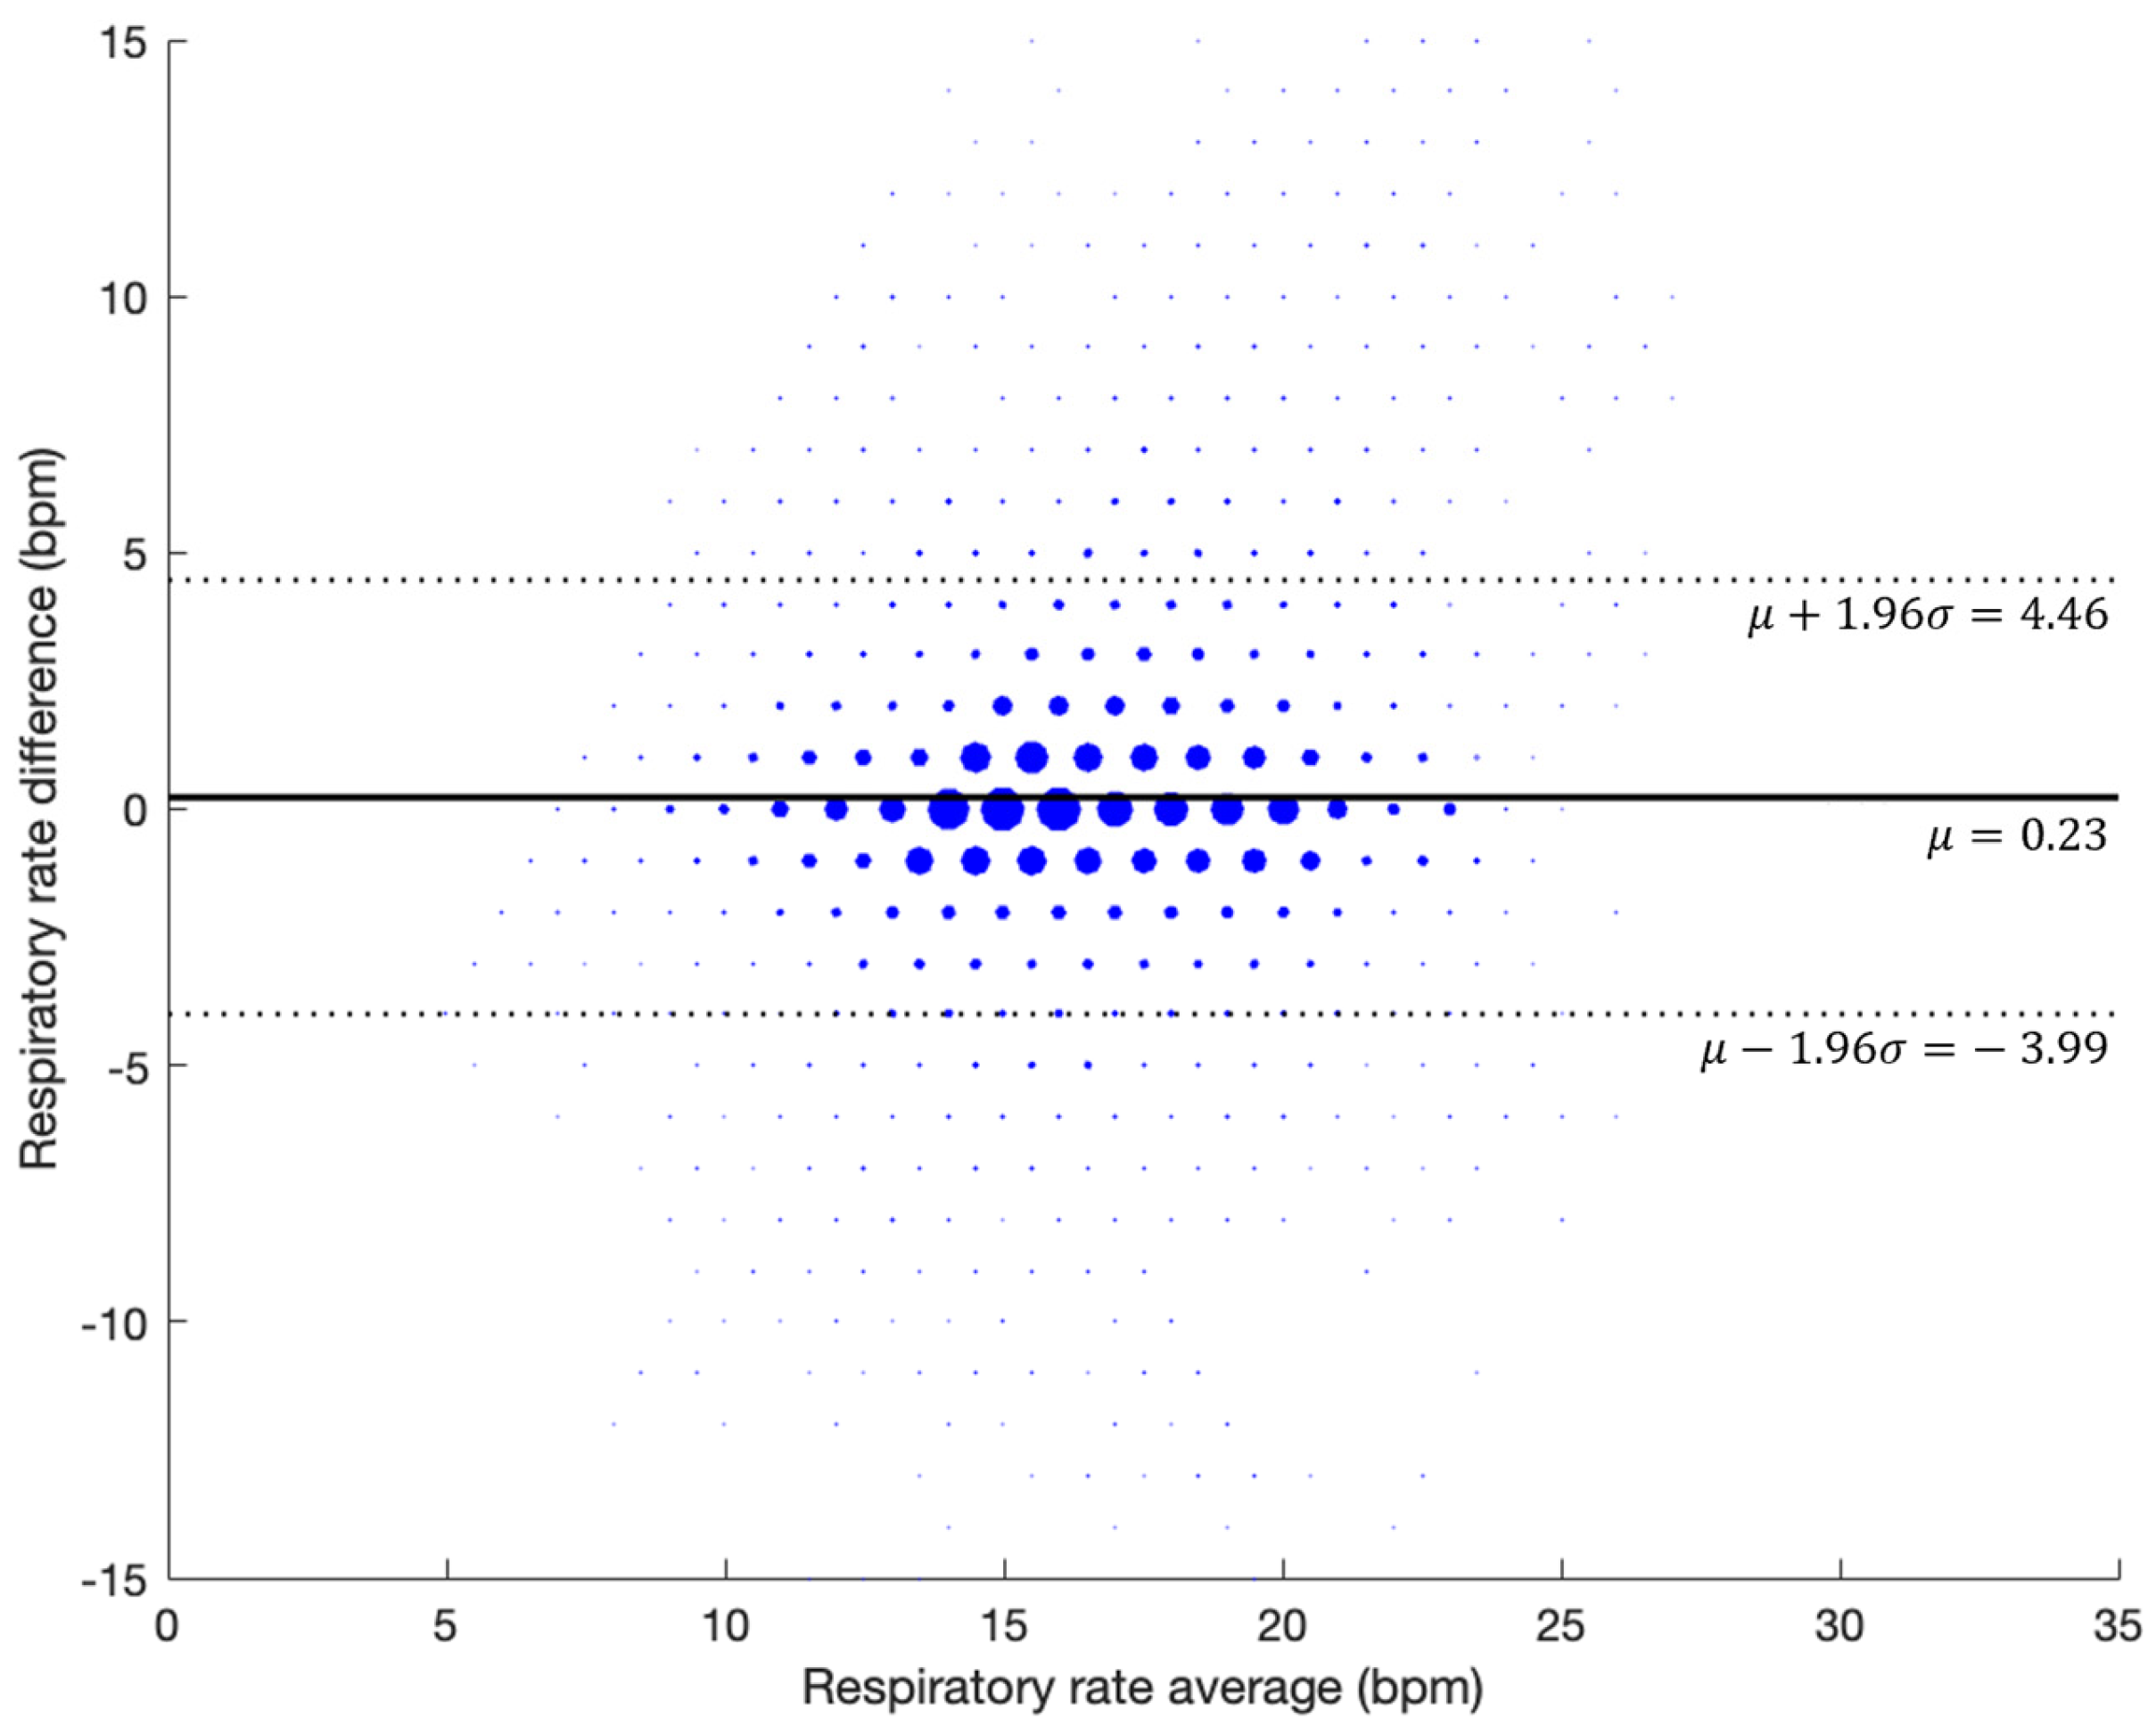
3.3. Evaluation During Natural Sleep (Retrospective Study)
4. Discussion
5. Limitations
6. Conclusions
Author Contributions
Funding
Institutional Review Board Statement
Informed Consent Statement
Data Availability Statement
Conflicts of Interest
Appendix A

| Phase | Step | Time (min) | Respiratory Rate (BPM) | Action |
|---|---|---|---|---|
| Experiment Start (Phase 1) | Breathing Normally | 1 | Variable | Unspecified |
| Phase 2 (Controlled Breathing) | Breath at pace | 1 | 14 | Unspecified |
| Phase 3 (Controlled Breathing) | Breath at pace | 1 | 12 | Unspecified |
| Phase 4 (Controlled Breathing) | Breath at pace | 1 | 10 | Unspecified |
| Phase 5 (Controlled Breathing) | Breath at pace | 1 | 8 | Unspecified |
| Phase 6 (Controlled Breathing) | Breath at pace | 1 | 6 | Unspecified |
| Phase 7 (Controlled Breathing) | Breath at pace | 1 | 4 | Unspecified |
| Phase 8 (Controlled Breathing) | Breath at pace | 2 | 14 | Unspecified |
| Phase 9 (Controlled Breathing) | Breath at pace | 1 | 16 | Unspecified |
| Phase 10 (Controlled Breathing) | Breath at pace | 1 | 18 | Unspecified |
| Phase 11 (Controlled Breathing) | Breath at pace | 1 | 20 | Unspecified |
| Phase 12 (Controlled Breathing) | Breath at pace | 1 | 22 | Unspecified |
| Phase 13 (Controlled Breathing) | Breath at pace | 1 | 24 | Unspecified |
| Phase 14 (Controlled Breathing) | Breath at pace | 1 | 26 | Unspecified |
| Phase 15 (Controlled Breathing) | Breath at pace | 1 | 28 | Unspecified |
| Phase 16 (Controlled Breathing) | Breath at pace | 1 | 30 | Unspecified |
| Transition to Rest | Breath at pace | 1 | 19 | Unspecified |
| Rest | Breath at pace | 1 | variable | Unspecified |
| Phase 17 (Shallow Breathing) | Shallow Breathing | 2 | 24 | Unspecified |
| Transition to Rest | Breath at pace | 1 | 18 | Unspecified |
| Rest | Breath at pace | 1 | 14 | Unspecified |
| Phase 19 (Abrupt Changes) | Abrupt Changes | 2 | 9 | Unspecified |
| Phase 20 (Abrupt Changes) | Abrupt Changes | 2 | 6 | Unspecified |
| Phase 21 (Abrupt Changes) | Abrupt Changes | 2 | 4 | Unspecified |
| Phase 22 (Abrupt Changes) | Abrupt Changes | 2 | 14 | Unspecified |
| Phase 23 (Abrupt Changes) | Abrupt Changes | 2 | 19 | Unspecified |
| Phase 24 (Abrupt Changes) | Abrupt Changes | 2 | 22 | Unspecified |
| Phase 25 (Abrupt Changes) | Abrupt Changes | 2 | 27 | Unspecified |
| Transition to Rest | Breath at pace | 1 | 18 | Unspecified |
| Rest | Breath at pace | 1 | 14 | Unspecified |
| Phase 26 (Physical Noises) | Groaning Events | 2 | Variable | Groan Event |
| Rest | Breath at pace | 1 | Variable | Unspecified |
| Phase 27 (Physical Noises) | Snoring Event | 2 | Variable | Snoring Event |
| Rest | Breath at pace | 1 | Variable | Unspecified |
| Phase 28 (Physical Noises) | Cough Event | 2 | Variable | Cough Event |
| Rest | Breath at pace | 1 | Variable | Unspecified |
| Phase 29 (Natural Noise) | Hospital Noises (65 dB) | 2 | Variable | Unspecified |
| Rest | Breath at pace | 1 | Variable | Unspecified |
| Phase 30 (Natural Noise) | Talking Noises (65 dB) | 2 | Variable | Unspecified |
| Rest | Breath at pace | 1 | 14–16 bpm | Unspecified |
| Phase 31 (Physical Movement) | Move head right and left | 1 | Variable | Change every 10 s |
| Phase 32 (Physical Movement) | Rest | 1 | Variable | Unspecified |
| Phase 33 (Physical Movement) | Move Head Up and center | 1 | Variable | Change every 10 s |
| Phase 34 (Physical Movement) | Rest | 1 | Variable | Unspecified |
| Phase 35 (Physical Movement) | Move head: right–left then back to center | 1 | Variable | Change every 10 s |
| Phase 36 (Physical Movement) | Rest | 1 | Variable | Unspecified |
| Exit | (1) Export iPad data to Box (2) Save montage on lab laptop from the SOMNO | Unspecified | Unspecified |
| Company Name [URL] | Primary Predicate Device [Technology] | Accuracy (Range) | Intended Use | Year |
|---|---|---|---|---|
| Biobeat Technologies Ltd. (Petah Tikva, Israel) [https://www.accessdata.fda.gov/cdrh_docs/pdf21/K212153.pdf accessed on 22 November 2024] | BB-613WP Patch [Wrist PPG] | ±3 BPM (4–40 BPM) | Spot measurements Intended for adults in clinical and home settings Not intended for critical care patients | 2022 |
| Sound Life Sciences, Inc. (Seattle, WA, USA) [https://www.accessdata.fda.gov/cdrh_docs/pdf21/K211387.pdf accessed on 22 November 2024] | Breathe Easy Mobile Respiratory Monitor [Phone microphone] | Not Included | Spot measurements Intended for adults in clinical and home settings Not a vital sign or apnea monitor Not used on patients with uncontrolled limb movement | 2021 |
| Masimo Corporation (Irvine, CA, USA) [https://www.accessdata.fda.gov/cdrh_docs/pdf19/K191882.pdf accessed on 22 November 2024] | Masimo Root Monitoring System and Accessories (K171121) [PPG] | ±3 BPM (8–35 BPM) | Continuous monitoring Intended for adults and pediatrics in clinical settings Only stationary conditions | 2020 |
| Philips Healthcare (Best, The Netherlands) [https://www.accessdata.fda.gov/cdrh_docs/pdf19/K192875.pdf accessed on 22 November 2024] | Philips Wearable Biosensor-G5 [ECG and accelerometer] | ±3 BPM (3–40 BPM) | Continuous monitoring Intended for adults in clinical settings | 2020 |
| Xandar Kardian Inc. (Toronto, ON, Canada) [https://www.accessdata.fda.gov/cdrh_docs/pdf20/K202464.pdf accessed on 22 November 2024] | Vital Sign Monitoring Sensor [Radar] | Not Included | Continuous monitoring Intended for adult patients in clinical and home settings Not meant for acute treatment | 2021 |
| Nanowear Inc. (Brooklyn, NY, USA) [https://www.accessdata.fda.gov/cdrh_docs/pdf21/K212160.pdf accessed on 22 November 2024] | SimpleSENSE Platform [Thoracic impedance] | ±2 BPM (6–22 BPM) | Intended for adult patients in clinical and home settings Not intended for critical care patients Only stationary conditions | 2020 |
| Masimo Corporation (Irvine, CA, USA) [https://www.accessdata.fda.gov/cdrh_docs/pdf19/K193242.pdf accessed on 22 November 2024] | Masimo Radical-7 Pulse Co-Oximeter and Accessories (K193242) [PPG] | ±3 BPM (4–70 BPM) | Spot or continuous monitoring Intended for adult patients in clinical and home settings For adults, pediatrics, infants, and neonate patients | 2020 |
| Spire Health (San Francisco, CA, USA) [https://www.accessdata.fda.gov/cdrh_docs/pdf19/K192952.pdf accessed on 22 November 2024] | Spire Health Remote Patient Monitoring System [Force Sensor] | Not Included | Continuous monitoring Intended for adult patients in clinical and home settings Not intended for ICU or acutely ill cardiac patients | 2020 |
| Circadia Technologies Ltd. (Los Angeles, CA, USA) [https://www.accessdata.fda.gov/cdrh_docs/pdf20/K200445.pdf accessed on 22 November 2024] | The Circadia C100 System [Radar] | ±2 BPM (7–38 BPM) | Spot or continuous monitoring Intended for adult patients in clinical and home settings Only stationary conditions | 2020 |
| Shenzhen Fiber Medical Technology Co., Ltd. (Shenzhen, China) [https://www.accessdata.fda.gov/cdrh_docs/pdf19/K190775.pdf accessed on 22 November 2024] | RHEA Vital Sign Vigilance System [Optical Fiber] | ±2 BPM (7–45 BPM) | Continuous monitoring Intended for adult patients in clinical and home settings Only stationary conditions | 2019 |
| Masimo Corporation (Irvine, CA, USA) [https://www.accessdata.fda.gov/cdrh_docs/pdf18/K181956.pdf accessed on 22 November 2024] | Masimo MightySat Rx Fingertip Pulse Oximeter [Fingertip PPG] | ±3 BPM (4–70 BPM) | Continuous monitoring Intended for adult patients in home environment Only stationary conditions | 2018 |
| VitalConnect Inc. (San Jose, CA, USA) [https://www.accessdata.fda.gov/cdrh_docs/pdf19/K192757.pdf accessed on 22 November 2024] | VitalConnect Platform, VitalPatch Biosensor [ECG and Accelerometer] | NA (10–30 BPM) | Continuous monitoring Intended for adult patients in clinical (excluding critical care) and home settings Only stationary conditions | 2019 |
| Snap40 Ltd. (Edinburgh, UK) [https://www.accessdata.fda.gov/cdrh_docs/pdf18/K182543.pdf accessed on 22 November 2024] | Wearable Vital Signs Monitoring System - Snap40 [Accelerometer, Gyroscope and oximeter] | NA (6–60 BPM) | Intermittent or spot measurements Intended for adult patients in clinical (excluding critical care) and home settings | 2019 |
| Covidien (Dublin, Ireland) acquired by Medtronic (Minneapolis, MN, USA) [https://www.accessdata.fda.gov/cdrh_docs/pdf14/K141518.pdf accessed on 22 November 2024] | Nellcor™ Bedside Respiratory Patient Monitoring System [PPG] | ±1 BPM (4–40 BPM) | Continuous monitoring Intended for adult patients in clinical settings | 2015 |
| PneumaCare Limited (Cambridge, UK) [https://www.accessdata.fda.gov/cdrh_docs/pdf15/K151940.pdf accessed on 22 November 2024] | Thora-3Di, Model T-01 [Structured light plethysmography imaging] | ±0.75 BPM (8–25 BPM) | Spot measurements Intended for adult patients in clinical settings | 2016 |
| Skanray Technologies Pvt Ltd. (Mysuru, Karnataka, India) [https://www.accessdata.fda.gov/cdrh_docs/pdf17/K172147.pdf accessed on 22 November 2024] | Star 65 [ECG, Capnography] | ±1 BPM (0–30 BPM) ±2 BPM (30–60 BPM) ±4 BPM (60–150 BPM) | Continuous monitoring Intended for adults, pediatrics, neonates—Clinical environments | 2018 |
References
- Rolfe, S. The importance of respiratory rate monitoring. Br. J. Nurs. 2019, 28, 504–508. [Google Scholar] [CrossRef] [PubMed]
- Gravelyn, T.R.; Weg, J.G. Respiratory rate as an indicator of acute respiratory dysfunction. JAMA 1980, 244, 1123–1125. [Google Scholar] [CrossRef] [PubMed]
- Brown, H.; Terrence, J.; Vasquez, P.; Bates, D.; Zimlichman, E. Continuous monitoring in an inpatient medical-surgical unit: A controlled clinical trial. Am. J. Med. 2014, 127, 226–232. [Google Scholar] [CrossRef] [PubMed]
- National Institute for Health and Care Excellent (NICE). National Early Warning Score Systems That Alert to Deteriorating Adult Patients in Hospital. NICE Advice. Available online: https://www.nice.org.uk/advice/mib205 (accessed on 22 November 2024).
- Grassmann, M.; Vlemincx, E.; Von Leupoldt, A.; Mittelstädt, J.; Van den Bergh, O. Respiratory changes in response to cognitive load: A systematic review. Neural Plast. 2016, 2016, 8146809. [Google Scholar] [CrossRef]
- Mochizuki, K.; Shintani, R.; Mori, K.; Sato, T.; Sakaguchi, O.; Takeshige, K.; Nitta, K.; Imamura, H. Importance of respiratory rate for the prediction of clinical deterioration after emergency department discharge: A single-center, case-control study. Acute Med. Surg. 2017, 4, 172–178. [Google Scholar] [CrossRef]
- Cretikos, M.; Bellomo, R.; Hillman, K.; Chen, J.; Finfer, S.; Flabouris, A. Respiratory rate: The neglected vital sign. Med. J. Aust. 2008, 188, 657–659. [Google Scholar] [CrossRef]
- Drummond, G.; Fischer, D.; Arvind, D. Current clinical methods of measurement of respiratory rate give imprecise values. ERJ Open Res. 2020, 6, 00023-2020. [Google Scholar] [CrossRef]
- AL-Khalidi, F.; Saatchi, R.; Burke, D.; Elphick, H.; Tan, S. Respiration rate monitoring methods: A review. Pediatr. Pulmonol. 2011, 46, 523–529. [Google Scholar] [CrossRef]
- Wilkes, A. Capnography. Br. J. Anaesth. 2011, 107, 650–651. [Google Scholar] [CrossRef]
- Kallioinen, N.; Hill, A.; Christofidis, M.; Horswill, M.; Watson, M. Quantitative systematic review: Sources of inaccuracy in manually measured adult respiratory rate data. J. Adv. Nurs. 2021, 77, 98–124. [Google Scholar] [CrossRef]
- Simoes, E.; Roark, R.; Berman, S.; Esler, L.; Murphy, J. Respiratory rate: Measurement of variability over time and accuracy at different counting periods. Arch. Dis. Child. 1991, 66, 1199–1203. [Google Scholar] [CrossRef] [PubMed]
- Liu, H.; Allen, J.; Zheng, D.; Chen, F. Recent development of respiratory rate measurement technologies. Physiol. Meas. 2019, 40, 07TR01. [Google Scholar] [CrossRef] [PubMed]
- Sun, G.; Okada, M.; Nakamura, R.; Matsuo, T.; Kirimoto, T.; Hakozaki, Y.; Matsui, T. Twenty-four-hour continuous and remote monitoring of respiratory rate using a medical radar system for the early detection of pneumonia in symptomatic elderly bedridden hospitalized patients. Clin. Case Rep. 2019, 7, 83. [Google Scholar] [CrossRef] [PubMed]
- O’Carroll, O.; MacCann, R.; O’Reilly, A.; Dunican, E.; Feeney, E.; Ryan, S.; Cotter, A.; Mallon, P.; Keane, M.; Butler, M.; et al. Remote monitoring of oxygen saturation in individuals with COVID-19 pneumonia. Eur. Respir. J. 2020, 56, 2001492. [Google Scholar] [CrossRef] [PubMed]
- Honkoop, P.; Simpson, A.; Bonini, M.; Snoeck-Stroband, J.; Meah, S.; Chung, K.; Usmani, O.; Fowler, S.; Sont, J. MyAirCoach: The use of home-monitoring and mHealth systems to predict deterioration in asthma control and the occurrence of asthma exacerbations; study protocol of an observational study. BMJ Open 2017, 7, e013935. [Google Scholar] [CrossRef]
- Tomasic, I.; Tomasic, N.; Trobec, R.; Krpan, M.; Kelava, T. Continuous remote monitoring of COPD patients—Justification and explanation of the requirements and a survey of the available technologies. Med. Biol. Eng. Comput. 2018, 56, 547–569. [Google Scholar] [CrossRef]
- Massaroni, C.; Nicolò, A.; Schena, E.; Sacchetti, M. Remote respiratory monitoring in the time of COVID-19. Front. Physiol. 2020, 11, 635. [Google Scholar] [CrossRef]
- Leenen, J.; Leerentveld, C.; van Dijk, J.; van Westreenen, H.; Schoonhoven, L.; Patijn, G. Current evidence for continuous vital signs monitoring by wearable wireless devices in hospitalized adults: Systematic review. J. Med. Internet Res. 2020, 22, e18636. [Google Scholar] [CrossRef]
- Keogh, A.; Dorn, J.; Walsh, L.; Calvo, F.; Caulfield, B. Comparing the usability and acceptability of wearable sensors among older Irish adults in a real-world context: Observational study. JMIR Mhealth Uhealth 2020, 8, e15704. [Google Scholar] [CrossRef]
- Meier, D.Y.; Barthelmess, P.; Sun, W.; Liberatore, F. Wearable technology acceptance in health care based on national culture differences: Cross-country analysis between Chinese and Swiss consumers. J. Med. Internet Res. 2020, 22, e18801. [Google Scholar] [CrossRef]
- Devani, N.; Pramono, R.; Imtiaz, S.; Bowyer, S.; Rodriguez-Villegas, E.; Mandal, S. Accuracy and usability of AcuPebble SA100 for automated diagnosis of obstructive sleep apnoea in the home environment setting: An evaluation study. BMJ Open 2021, 11, e046803. [Google Scholar] [CrossRef] [PubMed]
- AcuPebble SA100, 510(k) Premarket Notification. [Online]. Available online: https://www.accessdata.fda.gov/cdrh_docs/pdf21/K210480.pdf (accessed on 22 November 2024).
- CapnostreamTM 35 Portable Respiratory Monitor, 510(k) Premarket Notification. [Online]. Available online: https://www.accessdata.fda.gov/cdrh_docs/pdf15/K150272.pdf (accessed on 22 November 2024).
- Driver, C.; Laporta, M.; Bergese, S.; Urman, R.; Di Piazza, F.; Overdyk, F.; Sprung, J.; Weingarten, T. Frequency and temporal distribution of postoperative respiratory depressive events. Anesth. Analg. 2021, 132, 1206–1214. [Google Scholar] [CrossRef] [PubMed]
- Weingarten, T.; Morimatsu, H.; Fiorda-Diaz, J.; Bergese, S.; Ariyoshi, M.; Sprung, J.; Dahan, A.; Overdyk, F. New-Onset Atrial Fibrillation Detected by Continuous Capnography Monitoring: A Case Report. Am. J. Case Rep. 2020, 21, e925510-1–e925510-6. [Google Scholar] [CrossRef] [PubMed]
- Broens, S.; Prins, S.; de Kleer, D.; Niesters, M.; Dahan, A.; van Velzen, M. Postoperative respiratory state assessment using the Integrated Pulmonary Index (IPI) and resultant nurse interventions in the post-anesthesia care unit: A randomized controlled trial. J. Clin. Monit. Comput. 2021, 35, 1093–1102. [Google Scholar] [CrossRef] [PubMed]
- Khanna, A.; Bergese, S.; Jungquist, C.; Morimatsu, H.; Uezono, S.; Lee, S.; Ti, L.; Urman, R.; McIntyre, R., Jr.; Tornero, C.; et al. Prediction of opioid-induced respiratory depression on inpatient wards using continuous capnography and oximetry: An international prospective, observational trial. Anesth. Analg. 2020, 131, 1012. [Google Scholar] [CrossRef]
- Khanna, A.; Jungquist, C.; Buhre, W.; Soto, R.; Di Piazza, F.; Saager, L. Modeling the cost savings of continuous pulse oximetry and capnography monitoring of United States General Care Floor patients receiving opioids based on the PRODIGY Trial. Adv. Ther. 2021, 38, 3745–3759. [Google Scholar] [CrossRef]
- Medtronic (UK). Covidien Capnostream™ 35 Portable Respiratory Monitor. Available online: https://www.medtronic.com/covidien/en-gb/products/capnography/capnostream-35-portable-respiratory-monitor.html (accessed on 22 November 2024).
- ISO80601-2-71. Medical Electrical Equipment-Part 2-61: Particular Requirements for Basic Safety and Essential Performance of Pulse Oximeter Equipment. 2011. [Online]. Available online: https://zdn.nz/site/capesmedicalsuppliesnz/images/downloads/m70-iso80601-2-61-2017-test-report.pdf (accessed on 22 November 2024).
- Bland, J.; Altman, D. Statistical methods for assessing agreement between two methods of clinical measurement. Lancet 1986, 327, 307–310. [Google Scholar] [CrossRef]
- Bland, J.; Altman, D. Agreement between methods of measurement with multiple observations per individual. J. Biopharm. Stat. 2007, 17, 571–582. [Google Scholar] [CrossRef]
- Bergese, S.; Mestek, M.; Kelley, S.; McIntyre, M., Jr.; Uribe, A.; Sethi, R.; Watson, J.; Addison, P. Multicenter study validating accuracy of a continuous respiratory rate measurement derived from pulse oximetry: A comparison with capnography. Anesth. Analg. 2017, 124, 1153. [Google Scholar] [CrossRef]
- Eisenberg, M.; Givony, D.; Levin, R. Acoustic respiration rate and pulse oximetry-derived respiration rate: A clinical comparison study. J. Clin. Monit. Comput. 2020, 34, 139–146. [Google Scholar] [CrossRef]
- Masimo Rad-97 Pulse CO-Oximeter and Accessories, Masimo Radical-7 Pulse CO-Oximeter and Accessories, Masimo Radius-7 Pulse CO-Oximeter and Accessories, 510(k) Premarket Notification. Available online: https://www.accessdata.fda.gov/cdrh_docs/pdf19/K193242.pdf (accessed on 22 November 2024).
- RespiraSense, 510(k) Premarket Notification. Available online: https://www.accessdata.fda.gov/cdrh_docs/pdf22/K220111.pdf (accessed on 22 November 2024).
- National Institute for Health and Care Excellent (NICE). RespiraSense for Continuously Monitoring Respiratory Rate. 5 July 2022. Available online: https://www.nice.org.uk/advice/mib299/ (accessed on 22 November 2024).
- Gutierrez, G.; Williams, J.; Alrehaili, G.; McLean, A.; Pirouz, R.; Amdur, R.; Jain, V.; Ahari, J.; Bawa, A.; Kimbro, S. Respiratory rate variability in sleeping adults without obstructive sleep apnea. Physiol. Rep. 2016, 4, e12949. [Google Scholar] [CrossRef] [PubMed]
- Newton, K.; Malik, V.; Lee-Chiong, T. Sleep and breathing. Clin. Chest Med. 2014, 35, 451–456. [Google Scholar] [CrossRef] [PubMed]
- Amer, A.Y.A.; Wouters, F.; Vranken, J.; de Korte-de Boer, D.; Smit-Fun, V.; Duflot, P.; Beaupain, M.; Vandervoort, P.; Luca, S.; Aerts, J.; et al. Vital signs prediction and early warning score calculation based on continuous monitoring of hospitalised patients using wearable technology. Sensors 2020, 20, 6593. [Google Scholar] [CrossRef] [PubMed]
| Breathing Step | BPM | Minute | Breathing Step | BPM | Minute |
|---|---|---|---|---|---|
| Controlled Breathing | 14 | 1 min | Shallow Breathing | 24 | 2 min |
| 12 | |||||
| 10 | |||||
| 8 | |||||
| 6 | |||||
| 4 | |||||
| 14 (Rest) | |||||
| 16 | Abrupt Changes | 14 | 2 min | ||
| 18 | 9 | ||||
| 20 | 6 | ||||
| 22 | 4 | ||||
| 24 | 14 | ||||
| 26 | 19 | ||||
| 28 | 24 | ||||
| 30 | 27 |
| Artifact Type | Event | Rate | Minute |
|---|---|---|---|
| Physiological Noise | Groaning | Constant | 2 min |
| Snoring | Constant | ||
| Coughing | 10–12 Coughs | ||
| Environmental Noise | 65 dBA Hospital Noises | Constant | 2 min |
| 65 dBA Hospital Noises + talking | |||
| Physical Noises (Head movement) | Lateral head movements | Transition every 10 s | 1 min |
| Posterior head movements | |||
| Lateral head shake |
| Characteristic | Measure | Value |
|---|---|---|
| Age (years) | Median | 26 |
| Mean | 29 | |
| Standard deviation | 6 | |
| Range | [24, 47] | |
| BMI | Median | 23.5 |
| Mean | 23.4 | |
| Standard deviation | 3.6 | |
| Range | [19.4, 33.8] | |
| Weight (kg) | Median | 74 |
| Mean | 71.3 | |
| Standard deviation | 15.3 | |
| Range | [54, 100] | |
| Height (cm) | Median | 172 |
| Mean | 173.7 | |
| Standard deviation | 11.4 | |
| Range | [153, 193] | |
| Number of participants per BMI classification | Underweight (<18.5) | 0 (0%) |
| Healthy weight (18.5–24.9) | 13 (86.67%) | |
| Overweight (25–29.9) | 1 (6.67%) | |
| Obese (30–39.9) | 1 (6.67%) | |
| Severely obese (>40) | 0 (0%) | |
| Sex | Male | 10 (66.7%) |
| Female | 5 (33.3%) |
| Characteristic | Measure | Value |
|---|---|---|
| Age (years) | Median | 45 |
| Mean | 44 | |
| Standard deviation | 11 | |
| Range | [21, 65] | |
| BMI Self-reported. Data available from 128 patients (84.2%) | Median | 29.9 |
| Mean | 31.2 | |
| Standard deviation | 7.6 | |
| Range | [17.6, 56.6] | |
| Weight (kg) Self-Reported. Data available from 129 patients (84.9%) | Median | 92 |
| Mean | 95.3 | |
| Standard deviation | 25.7 | |
| Range | [45.7, 190] | |
| Height (cm) Self-reported. Data available from 132 patients (86.8%) | Median | 175.2 |
| Mean | 174.4 | |
| Standard deviation | 9.8 | |
| Range | [150, 197] | |
| Number of patients per BMI classification | Underweight (<18.5) | 1 (0.7%) |
| Healthy weight (18.5–24.9) | 26 (17.3%) | |
| Overweight (25–29.9) | 36 (24%) | |
| Obese (30–39.9) | 51 (34%) | |
| Severely obese (>40) | 12 (8%) | |
| Sex | Male | 107 (71.3%) |
| Female | 43 (28.7%) | |
| Ethnicity (Number of patients) | White British | 47 (31%) |
| White other | 19 (12.67%) | |
| Asian or Asian British (excluding the ones below) | 31 (20.67%) | |
| Black or Black British (excluding the ones below) | 3 (2%) | |
| Indian | 2 (1.33%) | |
| Pakistani | 2 (1.33%) | |
| White or Black African | 2 (1.33%) | |
| Chinese | 1 (0.67%) | |
| White or Black Caribbean | 5 (3.33%) | |
| Other | 38 (25.34%) | |
| Most common comorbidities | High blood pressure | 38 (25.3%) |
| Diabetes | 17 (11.3%) | |
| Asthma | 10 (6.7%) |
| Segmented RR | Error (mean ± std BPM) | Bias (mean ± std BPM) | RMSD (BPM) | Data Points | In Range (mean ± std %) | Value Outputted (mean ± std %) |
|---|---|---|---|---|---|---|
| Complete Data | 1.83 ± 2.09 | 0.63 ± 2.71 | 2.78 | 16,872 | 78.86 ± 17.36 | 95.63 ± 6.62 |
| Phases | ≤±1 bpm | ≤±2 bpm | ≤±3 bpm | ≤±4 bpm | ≤±5 bpm |
|---|---|---|---|---|---|
| Guided Breathing | 75.01% | 87.39% | 92.64% | 95.96% | 97.70% |
| Complete Data | 71.79% | 84.03% | 89.66% | 93.45% | 95.79% |
| Segmented RR | Error (BPM) | Bias (BPM) | RMSD (BPM) | Data Points |
|---|---|---|---|---|
| Controlled Breathing | 1.21 ± 1.36 | 0.59 ± 1.71 | 1.81 | 5653 |
| Shallow Breathing | 2.00 ± 2.06 | 1.40 ± 2.52 | 2.88 | 835 |
| Abrupt Changes | 1.66 ± 1.83 | 0.42 ± 2.43 | 2.46 | 6157 |
| Tachypnoea | 1.83 ± 1.93 | 1.20 ± 2.37 | 2.66 | 4271 |
| Normal | 1.18 ± 1.39 | 0.45 ± 1.77 | 1.83 | 4524 |
| Bradypnea | 1.43 ± 2.14 | −0.02 ± 2.1 | 2.14 | 3850 |
| Guided Breathing | 1.48 ± 1.67 | 0.56 ± 2.16 | 2.23 | 12,645 |
| Segmented RR | In Range (mean ± std %) | Value Outputted (mean ± std %) |
|---|---|---|
| Controlled Breathing | 90.60 ± 10.06 | 100 ± 0 |
| Shallow Breathing | 74.17 ± 21.90 | 100 ± 0 |
| Abrupt Changes | 86.16 ± 9.94 | 100 ± 0 |
| Tachypnoea | 79.36 ± 13.74 | 100 ± 0 |
| Normal | 93.89 ± 6.78 | 100 ± 0 |
| Bradypnea | 90.37 ± 7.79 | 100 ± 0 |
| Guided Breathing | 87.35 ± 7.71 | 100 ± 0 |
| Segmented RR | Error (mean ± std BPM) | Bias (mean ± std BPM) | RMSD (BPM) | Data Points |
|---|---|---|---|---|
| Physiological Noise | 2.35 ± 2.40 | 0.25 ± 3.35 | 3.36 | 2130 |
| - Groaning | 2.88 ± 2.98 | 0.92 ± 4.04 | 4.14 | 718 |
| - Snoring | 1.64 ± 1.70 | −0.36 ± 2.33 | 2.36 | 742 |
| - Coughing | 2.59 ± 2.15 | 0.19 ± 3.36 | 3.37 | 670 |
| Artificial Noise | 3.33 ± 2.78 | 1.69 ± 4.00 | 4.34 | 1156 |
| Movement Noise | 3.54 ± 3.27 | 1.05 ± 4.71 | 4.82 | 941 |
| Segmented RR | In Range (mean ± std %) | Value Outputted (mean ± std %) |
|---|---|---|
| Physiological Noise | 81.88 ± 14.88 | 98.41 ± 6.15 |
| - Groaning | 70.56 ± 33.92 | 95.33 ± 18.07 |
| - Snoring | 93.60 ± 11.42 | 100 ± 0 |
| - Coughing | 77.63 ± 26.59 | 100 ± 0 |
| Artificial Noise | 68.50 ± 24.08 | 75.36 ± 33.58 |
| Movement Noise | 71.85 ± 23.31 | 100 ± 0 |
| Error (BPM) | Bias (BPM) | RMSD (BPM) | Data Points |
|---|---|---|---|
| 1.40 ± 1.11 | −0.23 ± 1.87 | 2.46 | 26,820 |
| ≤±1 bpm | ≤±2 bpm | ≤±3 bpm | ≤±4 bpm | ≤±5 bpm |
|---|---|---|---|---|
| 72.38% | 84.29% | 90.11% | 93.50% | 95.56% |
Disclaimer/Publisher’s Note: The statements, opinions and data contained in all publications are solely those of the individual author(s) and contributor(s) and not of MDPI and/or the editor(s). MDPI and/or the editor(s) disclaim responsibility for any injury to people or property resulting from any ideas, methods, instructions or products referred to in the content. |
© 2024 by the authors. Licensee MDPI, Basel, Switzerland. This article is an open access article distributed under the terms and conditions of the Creative Commons Attribution (CC BY) license (https://creativecommons.org/licenses/by/4.0/).
Share and Cite
Abdulsadig, R.S.; Devani, N.; Singh, S.; Patel, Z.; Pramono, R.X.A.; Mandal, S.; Rodriguez-Villegas, E. Clinical Validation of Respiratory Rate Estimation Using Acoustic Signals from a Wearable Device. J. Clin. Med. 2024, 13, 7199. https://doi.org/10.3390/jcm13237199
Abdulsadig RS, Devani N, Singh S, Patel Z, Pramono RXA, Mandal S, Rodriguez-Villegas E. Clinical Validation of Respiratory Rate Estimation Using Acoustic Signals from a Wearable Device. Journal of Clinical Medicine. 2024; 13(23):7199. https://doi.org/10.3390/jcm13237199
Chicago/Turabian StyleAbdulsadig, Rawan S., Nikesh Devani, Sukhpreet Singh, Zaibaa Patel, Renard Xaviero Adhi Pramono, Swapna Mandal, and Esther Rodriguez-Villegas. 2024. "Clinical Validation of Respiratory Rate Estimation Using Acoustic Signals from a Wearable Device" Journal of Clinical Medicine 13, no. 23: 7199. https://doi.org/10.3390/jcm13237199
APA StyleAbdulsadig, R. S., Devani, N., Singh, S., Patel, Z., Pramono, R. X. A., Mandal, S., & Rodriguez-Villegas, E. (2024). Clinical Validation of Respiratory Rate Estimation Using Acoustic Signals from a Wearable Device. Journal of Clinical Medicine, 13(23), 7199. https://doi.org/10.3390/jcm13237199