
Analysis of Course of Changes in Blood Lactate Concentration in Response to Graded Exercise Test and Modified Wingate Test in Adolescent Road Cyclists


Abstract
1. Introduction
2. Materials and Methods
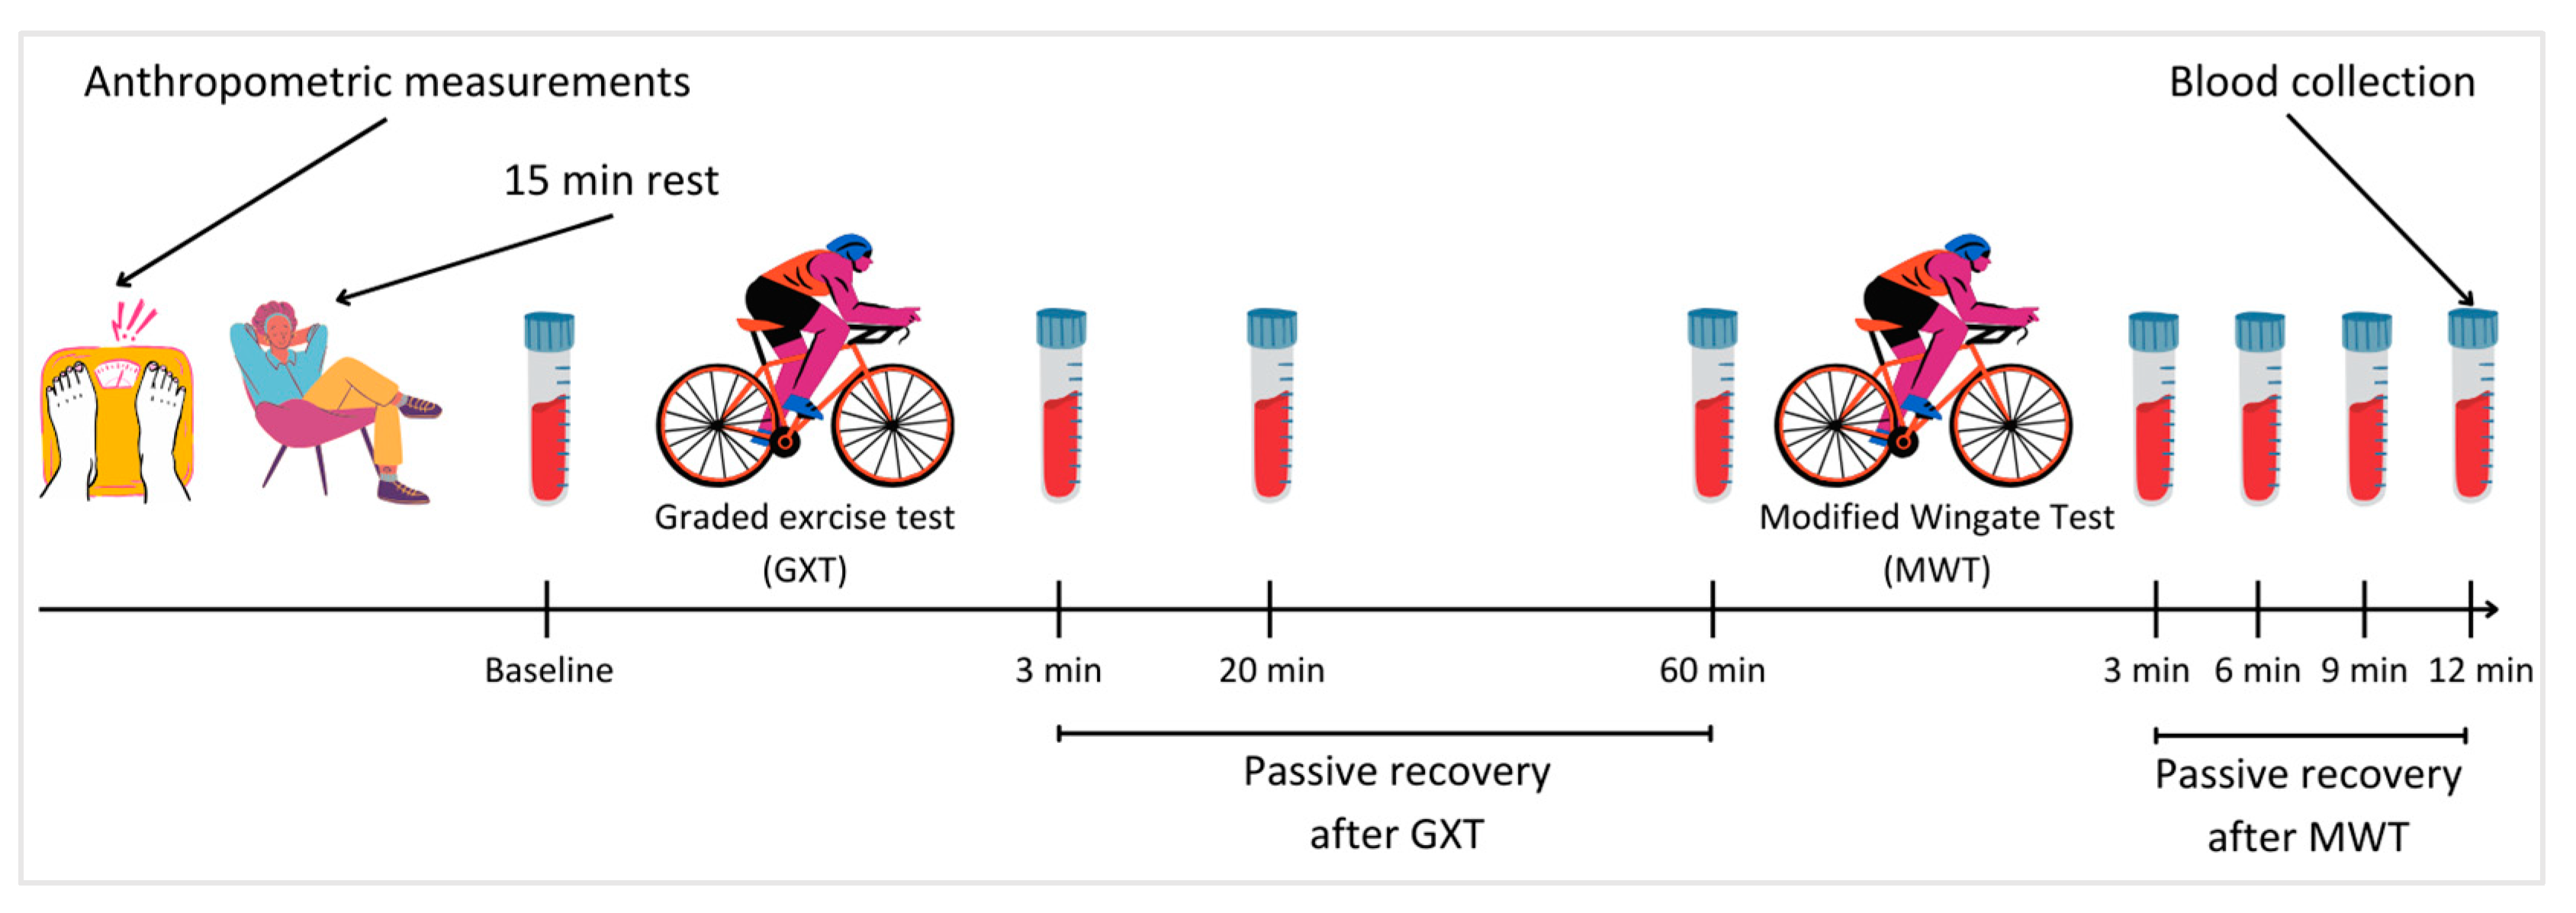
2.1. Study Design
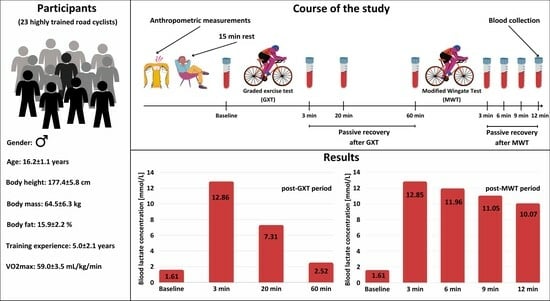
2.2. Participants
2.3. Anthropometric Measurements
2.4. Graded Exercise Test
2.5. Modified Wingate Test
2.6. Blood Lactate Concentration Measurement
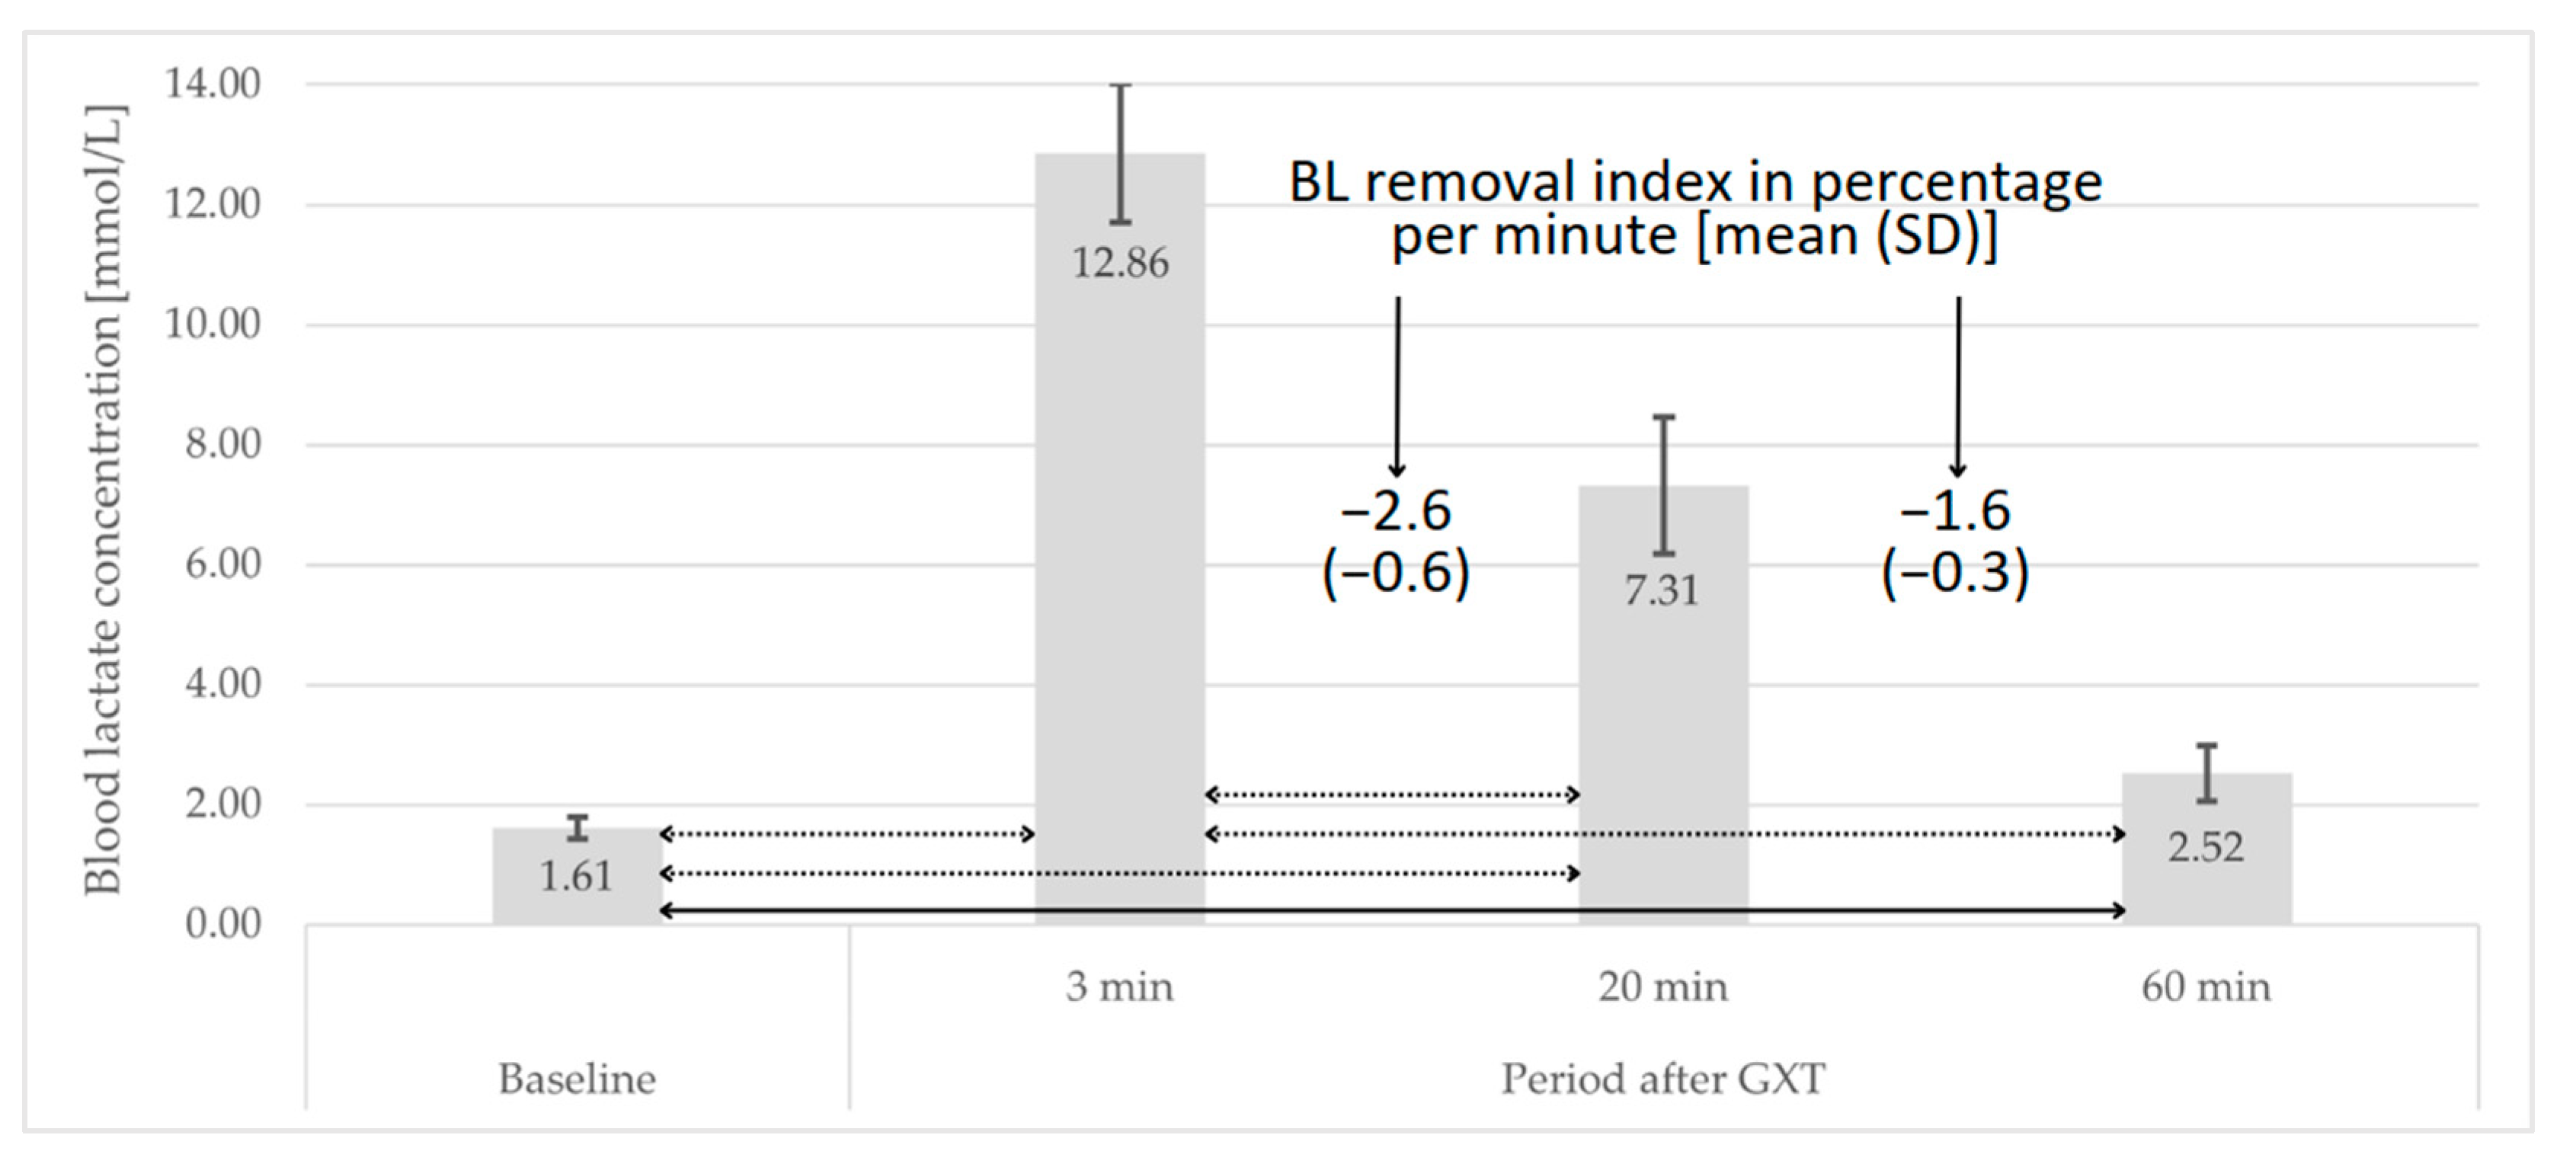
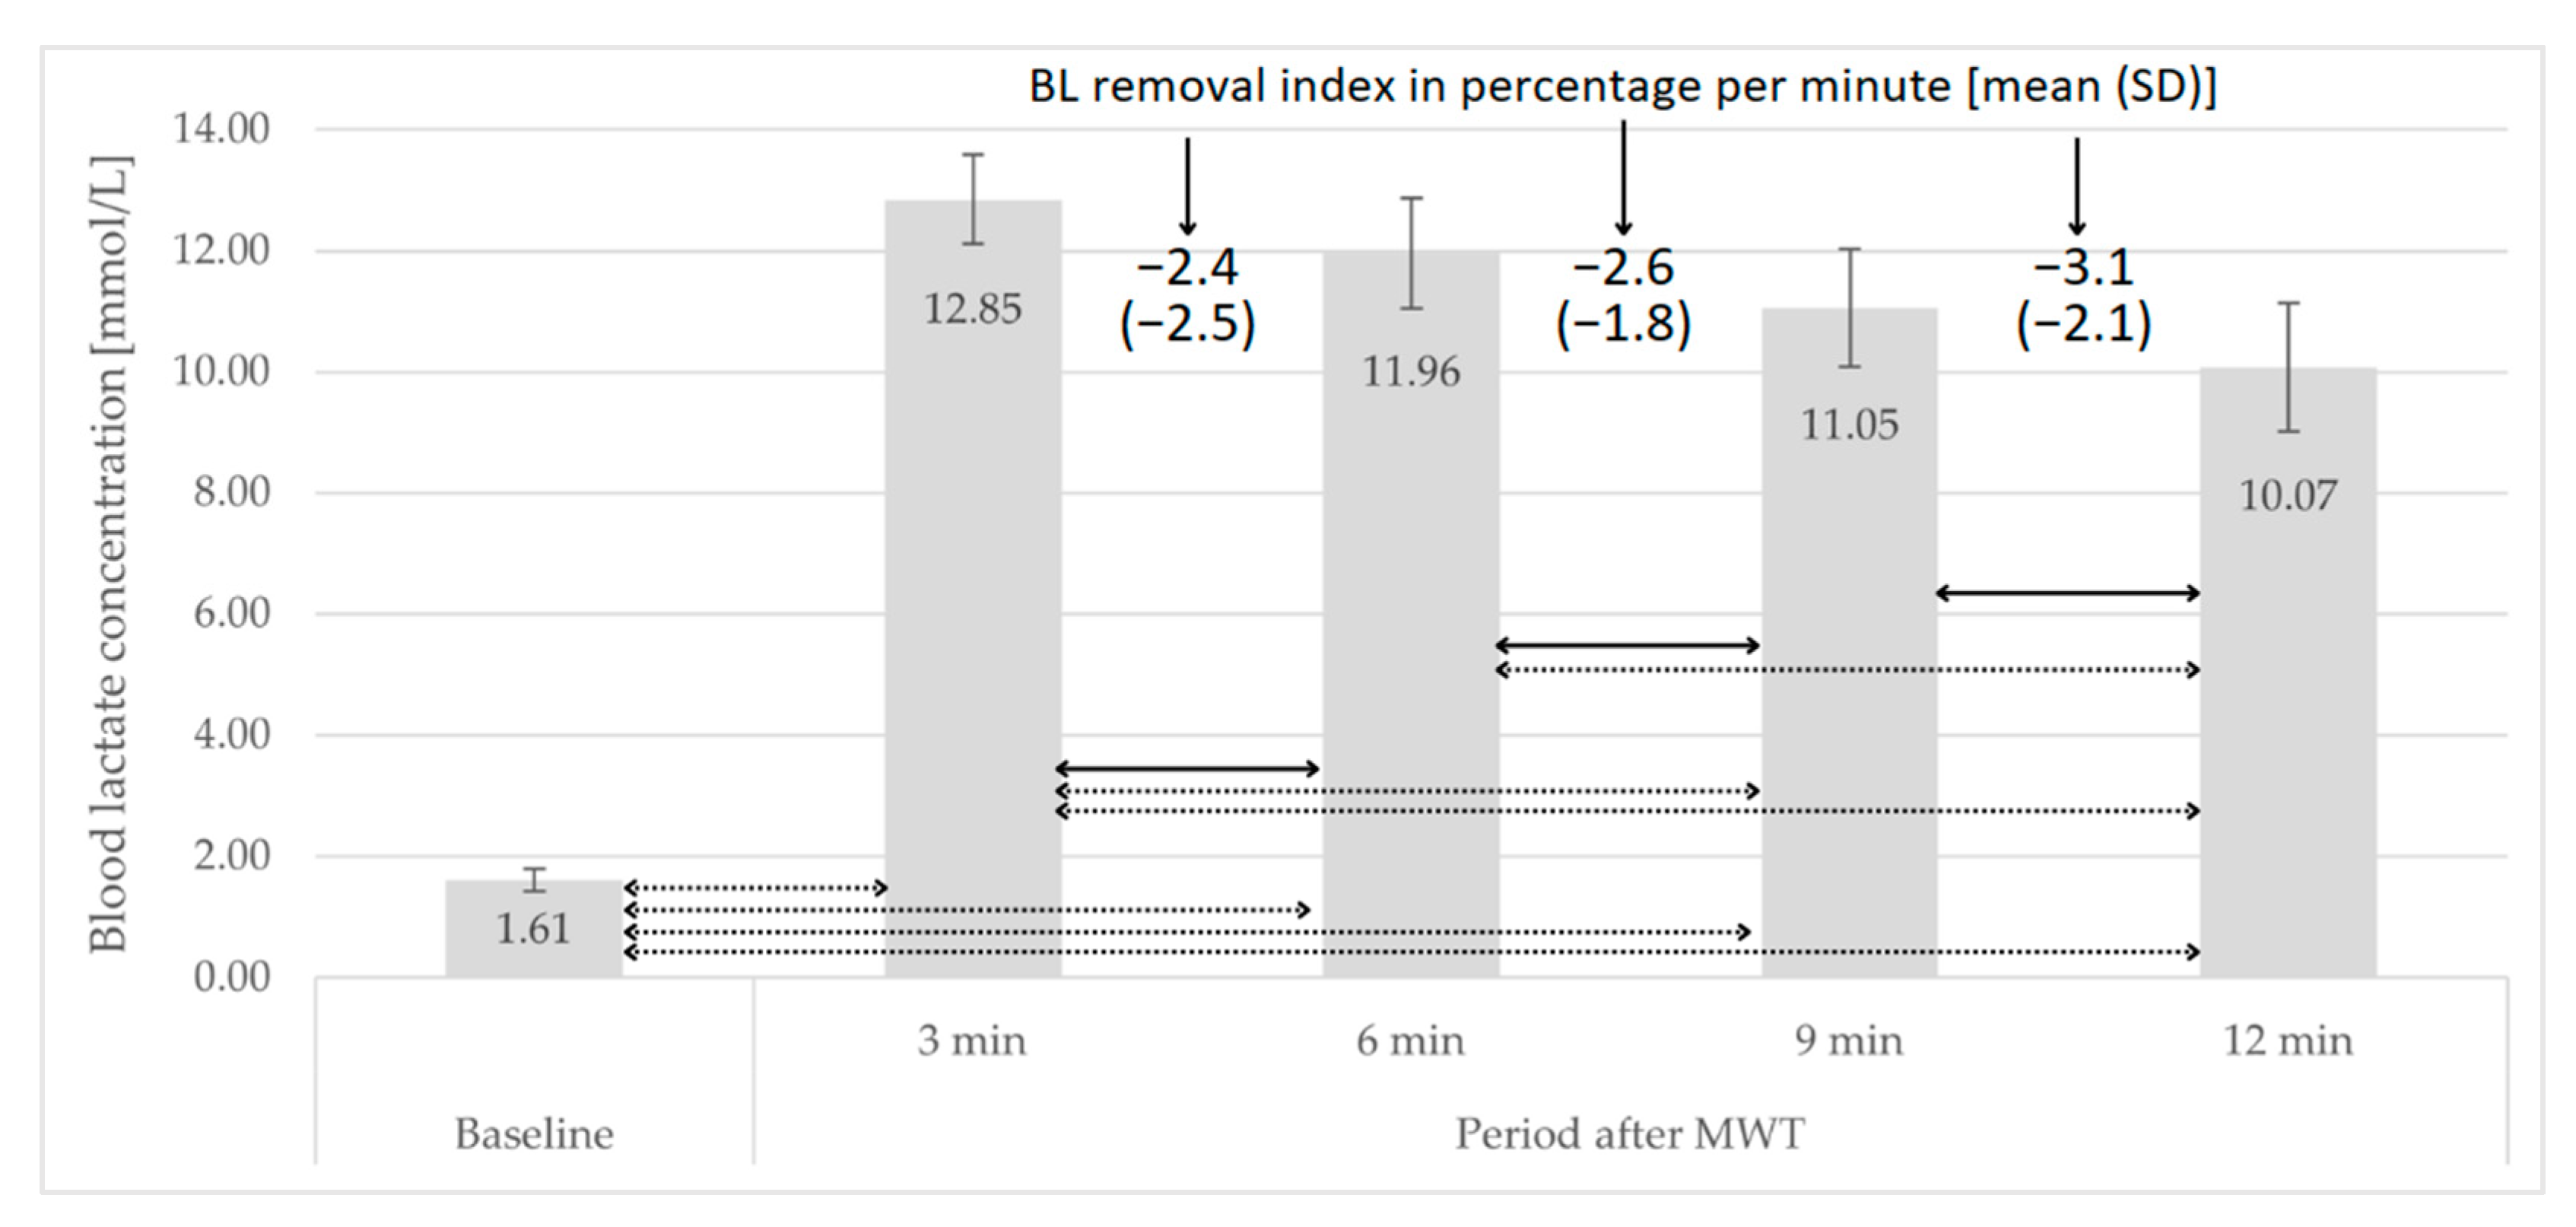
- A—BL concentration [mmol × L−1] at time point A;
- B—BL concentration [mmol × L−1] at the time point B;
- ∆T—time interval in minutes between measurements A and B;
- Assumption: point A precedes point B.
2.7. Statistical Analysis
3. Results
3.1. Aerobic and Anaerobic Performance
3.2. Post-GXT Course of Changes in BL Concentration
3.3. Post-MWT Course of Changes in BL Concentration
4. Discussion
5. Conclusions
Funding
Institutional Review Board Statement
Informed Consent Statement
Data Availability Statement
Conflicts of Interest
References
- Hargreaves, M.; Spriet, L.L. Skeletal Muscle Energy Metabolism during Exercise. Nat. Metab. 2020, 2, 817–828. [Google Scholar] [CrossRef] [PubMed]
- Baker, J.S.; McCormick, M.C.; Robergs, R.A. Interaction among Skeletal Muscle Metabolic Energy Systems during Intense Exercise. J. Nutr. Metab. 2010, 2010, 905612. [Google Scholar] [CrossRef]
- Bergström, J.; Hultman, E.; Roch-Norlund, A.E. Muscle Glycogen Synthetase in Normal Subjects. Scand. J. Clin. Lab. Investig. 1972, 29, 231–236. [Google Scholar] [CrossRef] [PubMed]
- Cheetham, M.E.; Boobis, L.H.; Brooks, S.; Williams, C. Human Muscle Metabolism during Sprint Running. J. Appl. Physiol. 1986, 61, 54–60. [Google Scholar] [CrossRef] [PubMed]
- Westerblad, H.; Lee, J.A.; Lannergren, J.; Allen, D.G. Cellular Mechanisms of Fatigue in Skeletal Muscle. Am. J. Physiol.-Cell Physiol. 1991, 261, C195–C209. [Google Scholar] [CrossRef] [PubMed]
- Binder, R.K.; Wonisch, M.; Corra, U.; Cohen-Solal, A.; Vanhees, L.; Saner, H.; Schmid, J.-P. Methodological Approach to the First and Second Lactate Threshold in Incremental Cardiopulmonary Exercise Testing. Eur. J. Cardiovasc. Prev. Rehabil. 2008, 15, 726–734. [Google Scholar] [CrossRef] [PubMed]
- Pallarés, J.G.; Morán-Navarro, R.; Ortega, J.F.; Fernández-Elías, V.E.; Mora-Rodriguez, R. Validity and Reliability of Ventilatory and Blood Lactate Thresholds in Well-Trained Cyclists. PLoS ONE 2016, 11, e0163389. [Google Scholar] [CrossRef]
- Midgley, A.W.; McNaughton, L.R.; Polman, R.; Marchant, D. Criteria for Determination of Maximal Oxygen Uptake. Sports Med. 2007, 37, 1019–1028. [Google Scholar] [CrossRef]
- Edvardsen, E.; Hem, E.; Anderssen, S.A. End Criteria for Reaching Maximal Oxygen Uptake Must Be Strict and Adjusted to Sex and Age: A Cross-Sectional Study. PLoS ONE 2014, 9, e85276. [Google Scholar] [CrossRef]
- Beneke, R.; Pollmann, C.; Bleif, I.; Leithäuser, R.; Hütler, M. How Anaerobic Is the Wingate Anaerobic Test for Humans? Eur. J. Appl. Physiol. 2002, 87, 388–392. [Google Scholar] [CrossRef]
- Takei, N.; Kakinoki, K.; Hatta, H. Repeated Sprint Training in Hypoxia Delays Fatigue during 30-Sec All-out Sprint and Reduces Blood Lactate Concentrations after Exercise in Trained Cyclists: A Case Study. J. Phys. Fit. Sports Med. 2020, 9, 31–35. [Google Scholar] [CrossRef]
- Paixão, R.; da Mota, G.; Marocolo, M. Acute Effect of Ischemic Preconditioning Is Detrimental to Anaerobic Performance in Cyclists. Int. J. Sports Med. 2014, 35, 912–915. [Google Scholar] [CrossRef]
- Beneke, R.; Leithäuser, R.M.; Ochentel, O. Blood Lactate Diagnostics in Exercise Testing and Training. Int. J. Sports Physiol. Perform. 2011, 6, 8–24. [Google Scholar] [CrossRef] [PubMed]
- Granata, C.; Jamnick, N.A.; Bishop, D.J. Principles of Exercise Prescription, and How They Influence Exercise-Induced Changes of Transcription Factors and Other Regulators of Mitochondrial Biogenesis. Sports Med. 2018, 48, 1541–1559. [Google Scholar] [CrossRef]
- Franchini, E.; de Moraes Bertuzzi, R.C.; Takito, M.Y.; Kiss, M.A.P.D.M. Effects of Recovery Type after a Judo Match on Blood Lactate and Performance in Specific and Non-Specific Judo Tasks. Eur. J. Appl. Physiol. 2009, 107, 377–383. [Google Scholar] [CrossRef] [PubMed]
- Martin, J.S.; Friedenreich, Z.D.; Borges, A.R.; Roberts, M.D. Acute Effects of Peristaltic Pneumatic Compression on Repeated Anaerobic Exercise Performance and Blood Lactate Clearance. J. Strength Cond. Res. 2015, 29, 2900–2906. [Google Scholar] [CrossRef]
- Di Masi, F.; De Souza Vale, R.G.; Dantas, E.H.M.; Barreto, A.C.L.; da Silva Novaes, J.; Reis, V.M. Is Blood Lactate Removal during Water Immersed Cycling Faster than during Cycling on Land? J. Sports Sci. Med. 2007, 6, 188–192. [Google Scholar]
- Ferreira, J.; Da Silva Carvalho, R.; Barroso, T.; Szmuchrowski, L.; Śledziewski, D. Effect of Different Types of Recovery on Blood Lactate Removal After Maximum Exercise. PJST 2011, 18, 105–111. [Google Scholar] [CrossRef]
- Durand, R.; Galli, M.; Chenavard, M.; Bandiera, D.; Freund, H.; Messonnier, L.A. Modelling of Blood Lactate Time-Courses During Exercise and/or the Subsequent Recovery: Limitations and Few Perspectives. Front. Physiol. 2021, 12, 702252. [Google Scholar] [CrossRef]
- Messonnier, L.A.; Emhoff, C.-A.W.; Fattor, J.A.; Horning, M.A.; Carlson, T.J.; Brooks, G.A. Lactate Kinetics at the Lactate Threshold in Trained and Untrained Men. J. Appl. Physiol. 2013, 114, 1593–1602. [Google Scholar] [CrossRef]
- Zając, B.; Gaj, P.; Ambroży, T. Analysis of Training Loads in Polish Adolescent Road Cyclists in the Preparatory Period and Their Effects on Physical Fitness. J. Kinesiol. Exerc. Sci. 2023, 33, 1–10. [Google Scholar] [CrossRef]
- Faria, E.W.; Parker, D.L.; Faria, I.E. The Science of Cycling. Sports Med. 2005, 35, 285–312. [Google Scholar] [CrossRef] [PubMed]
- Ebert, T.R.; Martin, D.T.; Stephens, B.; Withers, R.T. Power Output During a Professional Men’s Road-Cycling Tour. Int. J. Sports Physiol. Perform. 2006, 1, 324–335. [Google Scholar] [CrossRef] [PubMed]
- Gallo, G.; Leo, P.; March, M.M.; Giorgi, A.; Faelli, E.; Ruggeri, P.; Mujika, I.; Filipas, L. Differences in Training Characteristics Between Junior, Under 23 and Professional Cyclists. Int. J. Sports Med. 2022, 43, 1183–1189. [Google Scholar] [CrossRef]
- Bret, C.; Messonnier, L.; Nouck Nouck, J.M.; Freund, H.; Dufour, A.B.; Lacour, J.R. Differences in Lactate Exchange and Removal Abilities in Athletes Specialised in Different Track Running Events (100 to 1500 m). Int. J. Sports Med. 2003, 24, 108–113. [Google Scholar] [CrossRef]
- Beneke, R.; Hütler, M.; Jung, M.; Leithäuser, R.M. Modeling the Blood Lactate Kinetics at Maximal Short-Term Exercise Conditions in Children, Adolescents, and Adults. J. Appl. Physiol. 2005, 99, 499–504. [Google Scholar] [CrossRef] [PubMed]
- Messonnier, L.; Freund, H.; Féasson, L.; Prieur, F.; Castells, J.; Denis, C.; Linossier, M.-T.; Geyssant, A.; Lacour, J.-R. Blood Lactate Exchange and Removal Abilities after Relative High-Intensity Exercise: Effects of Training in Normoxia and Hypoxia. Eur. J. Appl. Physiol. 2001, 84, 403–412. [Google Scholar] [CrossRef]
- Messonnier, L.; Freund, H.; Denis, C.; Féasson, L.; Lacour, J.-R. Effects of Training on Lactate Kinetics Parameters and Their Influence on Short High-Intensity Exercise Performance. Int. J. Sports Med. 2006, 27, 60–66. [Google Scholar] [CrossRef]
- Messonnier, L.; Freund, H.; Bourdin, M.; Belli, A.; Lacour, J.-R. Lactate Exchange and Removal Abilities in Rowing Performance. Med. Sci. Sports Exerc. 1997, 29, 396–401. [Google Scholar] [CrossRef]
- Joyner, M.J.; Coyle, E.F. Endurance Exercise Performance: The Physiology of Champions. J. Physiol. 2008, 586, 35–44. [Google Scholar] [CrossRef]
- Taylor, S.J.; Whincup, P.H.; Hindmarsh, P.C.; Lampe, F.; Odoki, K.; Cook, D.G. Performance of a New Pubertal Self-Assessment Questionnaire: A Preliminary Study. Paediatr. Perinat. Epidemiol. 2001, 15, 88–94. [Google Scholar] [CrossRef]
- McKay, A.K.A.; Stellingwerff, T.; Smith, E.S.; Martin, D.T.; Mujika, I.; Goosey-Tolfrey, V.L.; Sheppard, J.; Burke, L.M. Defining Training and Performance Caliber: A Participant Classification Framework. Int. J. Sports Physiol. Perform. 2022, 17, 317–331. [Google Scholar] [CrossRef] [PubMed]
- Williams, N. The Borg Rating of Perceived Exertion (RPE) Scale. Occup. Med. 2017, 67, 404–405. [Google Scholar] [CrossRef]
- Tanaka, H.; Monahan, K.D.; Seals, D.R. Age-Predicted Maximal Heart Rate Revisited. J. Am. Coll. Cardiol. 2001, 37, 153–156. [Google Scholar] [CrossRef]
- Castañeda-Babarro, A. The Wingate Anaerobic Test, a Narrative Review of the Protocol Variables That Affect the Results Obtained. Appl. Sci. 2021, 11, 7417. [Google Scholar] [CrossRef]
- Jaafar, H.; Rouis, M.; Coudrat, L.; Attiogbé, E.; Vandewalle, H.; Driss, T. Effects of Load on Wingate Test Performances and Reliability. J. Strength Cond. Res. 2014, 28, 3462–3468. [Google Scholar] [CrossRef] [PubMed]
- Hebestreit, H.; Meyer, F.; Htay-Htay; Heigenhauser, G.J.F.; Bar-Or, O. Plasma Metabolites, Volume and Electrolytes Following 30-s High-Intensity Exercise in Boys and Men. Eur. J. Appl. Physiol. Occup. Physiol. 1996, 72, 563–569. [Google Scholar] [CrossRef] [PubMed]
- Tanaka, H.; Shindo, M. Running Velocity at Blood Lactate Threshold of Boys Aged 6-15 Years Compared with Untrained and Trained Young Males. Int. J. Sports Med. 1985, 6, 90–94. [Google Scholar] [CrossRef]
- Paterson, D.H.; Cunningham, D.A.; Bumstead, L.A. Recovery O2 and Blood Lactic Acid: Longitudinal Analysis in Boys Aged 11 to 15 Years. Eur. J. Appl. Physiol. Occup. Physiol. 1986, 55, 93–99. [Google Scholar] [CrossRef]
- Fellmann, N.; Bedu, M.; Spielvogel, H.; Falgairette, G.; Van Praagh, E.; Jarrige, J.F.; Coudert, J. Anaerobic Metabolism during Pubertal Development at High Altitude. J. Appl. Physiol. 1988, 64, 1382–1386. [Google Scholar] [CrossRef]
- Mero, A. Blood Lactate Production and Recovery from Anaerobic Exercise in Trained and Untrained Boys. Eur. J. Appl. Physiol. Occup. Physiol. 1988, 57, 660–666. [Google Scholar] [CrossRef] [PubMed]
- Wilson, J.M.; Loenneke, J.P.; Jo, E.; Wilson, G.J.; Zourdos, M.C.; Kim, J.-S. The Effects of Endurance, Strength, and Power Training on Muscle Fiber Type Shifting. J. Strength Cond. Res. 2012, 26, 1724–1729. [Google Scholar] [CrossRef] [PubMed]
- Tesch, P.A.; Thorsson, A.; Kaiser, P. Muscle Capillary Supply and Fiber Type Characteristics in Weight and Power Lifters. J. Appl. Physiol. 1984, 56, 35–38. [Google Scholar] [CrossRef]
- Foster, C.; Costill, D.L.; Daniels, J.T.; Fink, W.J. Skeletal Muscle Enzyme Activity, Fiber Composition and VO2 Max in Relation to Distance Running Performance. Eur. J. Appl. Physiol. Occup. Physiol. 1978, 39, 73–80. [Google Scholar] [CrossRef] [PubMed]
- Costill, D.L.; Daniels, J.; Evans, W.; Fink, W.; Krahenbuhl, G.; Saltin, B. Skeletal Muscle Enzymes and Fiber Composition in Male and Female Track Athletes. J. Appl. Physiol. 1976, 40, 149–154. [Google Scholar] [CrossRef]
- Bergh, U.; Thorstensson, A.; Sjödin, B.; Hulten, B.; Piehl, K.; Karlsson, J. Maximal Oxygen Uptake and Muscle Fiber Types in Trained and Untrained Humans. Med. Sci. Sports 1978, 10, 151–154. [Google Scholar]
- Chatel, B.; Bret, C.; Edouard, P.; Oullion, R.; Freund, H.; Messonnier, L.A. Lactate Recovery Kinetics in Response to High-Intensity Exercises. Eur. J. Appl. Physiol. 2016, 116, 1455–1465. [Google Scholar] [CrossRef]
- Mota, M.R.; Dantas, R.A.E.; Oliveira-Silva, I.; Sales, M.M.; da Costa Sotero, R.; Espíndola Mota Venâncio, P.; Teixeira Júnior, J.; Chaves, S.N.; de Lima, F.D. Effect of Self-Paced Active Recovery and Passive Recovery on Blood Lactate Removal Following a 200 m Freestyle Swimming Trial. Open Access J. Sports Med. 2017, 8, 155–160. [Google Scholar] [CrossRef]
- Sharma, L.; Hussain, M.; Verma, S. Effect of Recovery Modalities on Blood Lactate Clearance. Saudi J. Sports Med. 2017, 17, 65. [Google Scholar] [CrossRef]

| Mean ± SD | CV (%) | Minimum–Maximum | |
|---|---|---|---|
| PVO2MAX (W) | 379 ± 33 | 8.7 | 320–440 |
| PVO2MAX (W × kg−1) | 5.90 ± 0.44 | 7.5 | 4.87–6.90 |
| VO2max (L × min−1) | 3.79 ± 0.29 | 7.7 | 3.22–4.51 |
| VO2max (mL × kg−1 × min−1) | 59.0 ± 3.5 | 5.9 | 48.5–65.9 |
| Mean ± SD | CV (%) | Minimum–Maximum | |
|---|---|---|---|
| Peak power (W) | 923 ± 111 | 12.0 | 710–1232 |
| Peak power (W × kg−1) | 14.3 ± 0.6 | 4.2 | 13.4–15.6 |
| Time to obtain peak power (s) | 3.16 ± 0.99 | 31.3 | 1.00–5.10 |
| Mean power (W) | 722 ± 81 | 11.2 | 553–894 |
| Mean power (W × kg−1) | 11.2 ± 0.6 | 5.4 | 10.3–12.6 |
| Fatigue index (%) | 42.9 ± 6.7 | 15.6 | 31.1–56.3 |
Disclaimer/Publisher’s Note: The statements, opinions and data contained in all publications are solely those of the individual author(s) and contributor(s) and not of MDPI and/or the editor(s). MDPI and/or the editor(s) disclaim responsibility for any injury to people or property resulting from any ideas, methods, instructions or products referred to in the content. |
© 2024 by the author. Licensee MDPI, Basel, Switzerland. This article is an open access article distributed under the terms and conditions of the Creative Commons Attribution (CC BY) license (https://creativecommons.org/licenses/by/4.0/).
Share and Cite
Zając, B. Analysis of Course of Changes in Blood Lactate Concentration in Response to Graded Exercise Test and Modified Wingate Test in Adolescent Road Cyclists. J. Clin. Med. 2024, 13, 535. https://doi.org/10.3390/jcm13020535
Zając B. Analysis of Course of Changes in Blood Lactate Concentration in Response to Graded Exercise Test and Modified Wingate Test in Adolescent Road Cyclists. Journal of Clinical Medicine. 2024; 13(2):535. https://doi.org/10.3390/jcm13020535
Chicago/Turabian StyleZając, Bartosz. 2024. "Analysis of Course of Changes in Blood Lactate Concentration in Response to Graded Exercise Test and Modified Wingate Test in Adolescent Road Cyclists" Journal of Clinical Medicine 13, no. 2: 535. https://doi.org/10.3390/jcm13020535
APA StyleZając, B. (2024). Analysis of Course of Changes in Blood Lactate Concentration in Response to Graded Exercise Test and Modified Wingate Test in Adolescent Road Cyclists. Journal of Clinical Medicine, 13(2), 535. https://doi.org/10.3390/jcm13020535