
Cardiac Arrest Mortality and Disposition Patterns in United States Emergency Departments

 , , , , , , ,
Abstract
1. Introduction
2. Materials and Methods
2.1. Study Population Inclusion and Exclusion Criteria
2.2. Study Definitions and Variables
2.3. Outcomes
2.4. Statistical Method
3. Results
3.1. Demographics
3.2. Hospital Characteristics
3.3. Primary Outcome—ED Mortality
3.4. Common Primary Etiologies for Cardiac Arrest in ED
3.5. Secondary Outcome—Disposition from the ED
4. Discussion
Limitations
5. Conclusions
Supplementary Materials
Author Contributions
Funding
Institutional Review Board Statement
Informed Consent Statement
Data Availability Statement
Conflicts of Interest
References
- Tsao, C.; Aday, A.; Almarzooq, Z.; Alonso, A.; Beaton, A.; Bittencourt, M. Heart Disease and Stroke Statistics-2022 Update: A Report from the American Heart Association. Circulation 2022, 145, E153–E639. [Google Scholar] [PubMed]
- Andersen, L.W.; Holmberg, M.J.; Berg, K.M.; Donnino, M.W.; Granfeldt, A. In-Hospital Cardiac Arrest: A Review. JAMA 2019, 321, 1200–1210. [Google Scholar] [CrossRef] [PubMed]
- Hallstrom, A.P.; Ornato, J.P.; Weisfeldt, M.; Travers, A.; Christenson, J.; McBurnie, M.A.; Zalenski, R.; Becker, L.B.; Schron, E.B.; Proschan, M.; et al. Public-access defibrillation and survival after out-of-hospital cardiac arrest. N. Engl. J. Med. 2004, 351, 637–646. [Google Scholar] [CrossRef] [PubMed]
- Wallace, S.K.; Abella, B.S.; Becker, L.B. Quantifying the effect of cardiopulmonary resuscitation quality on cardiac arrest outcome: A systematic review and meta-analysis. Circ. Cardiovasc. Qual. Outcomes 2013, 6, 148–156. [Google Scholar] [CrossRef]
- Chan, P.S.; McNally, B.; Tang, F.; Kellermann, A.; Group, C.S. Recent trends in survival from out-of-hospital cardiac arrest in the United States. Circulation. 2014, 130, 1876–1882. [Google Scholar] [CrossRef]
- Hsu, S.-H.; Sung, C.-W.; Lu, T.-C.; Wang, C.-H.; Chou, E.H.; Ko, C.-H.; Huang, C.-H.; Tsai, C.-L. The incidence, predictors, and causes of cardiac arrest in United States emergency departments. Resusc. Plus. 2024, 17, 100514. [Google Scholar] [CrossRef]
- Quality AHRQ. Overview of the Nationwide Emergency Department Sample (NEDS). Available online: https://hcup-us.ahrq.gov/nedsoverview.jsp (accessed on 31 July 2024).
- Akintoye, E.; Adegbala, O.; Egbe, A.; Olawusi, E.; Afonso, L.; Briasoulis, A. Association between Hospital volume of cardiopulmonary resuscitation for in-hospital cardiac arrest and survival to Hospital discharge. Resuscitation 2020, 148, 25–31. [Google Scholar] [CrossRef]
- Mir, T.; Qureshi, W.T.; Uddin, M.; Soubani, A.; Saydain, G.; Rab, T.; Kakouros, N. Predictors and outcomes of cardiac arrest in the emergency department and in-patient settings in the United States (2016–2018). Resuscitation 2022, 170, 100–106. [Google Scholar] [CrossRef] [PubMed]
- Melnick, G.; O’Leary, J.F.; Zaniello, B.A.; Abrishamian, L. COVID-19 driven decline in emergency visits: Has it continued, is it permanent, and what does it mean for emergency physicians? Am. J. Emerg. Med. 2022, 61, 64–67. [Google Scholar] [CrossRef]
- Daoud, A.; Ronen, O. Decline in emergency department visits during the COVID-19 quarantine. Am. J. Emerg. Med. 2023, 71, 74–80. [Google Scholar] [CrossRef]
- Yi, S.; Kwon, S.; Suss, R.; Ðoàn, L.; John, I.; Islam, N. The Mutually Reinforcing Cycle of Poor Data Quality and Racialized Stereotypes That Shapes Asian American Health. Health Aff. 2022, 41, 296–303. [Google Scholar] [CrossRef] [PubMed]
- Chin, M.K.; Đoàn, L.N.; Russo, R.G.; Roberts, T.; Persaud, S.; Huang, E.; Fu, L.; Kui, K.Y.; Kwon, S.C.; Yi, S.S. Methods for retrospectively improving race/ethnicity data quality: A scoping review. Epidemiol. Rev. 2023, 45, 127–139. [Google Scholar] [CrossRef] [PubMed]
- Churchwell, K.; Elkind, M.; Benjamin, R.; Carson, A.; Chang, E.; Lawrence, W. Call to Action: Structural Racism as a Fundamental Driver of Health Disparities: A Presidential Advisory from the American Heart Association. Circulation 2020, 142, E454–E468. [Google Scholar] [CrossRef] [PubMed]
- Larkin, G.L.; Copes, W.S.; Nathanson, B.H.; Kaye, W. Pre-resuscitation factors associated with mortality in 49,130 cases of in-hospital cardiac arrest: A report from the National Registry for Cardiopulmonary Resuscitation. Resuscitation 2010, 81, 302–311. [Google Scholar] [CrossRef] [PubMed]
- Joseph, L.; Chan, P.S.; Bradley, S.M.; Zhou, Y.; Graham, G.; Jones, P.G.; Vaughan-Sarrazin, M.; Girotra, S.; for the American Heart Association Get With the Guidelines–Resuscitation Investigators. Temporal Changes in the Racial Gap in Survival After In-Hospital Cardiac Arrest. JAMA Cardiol. 2017, 2, 976–984. [Google Scholar] [CrossRef]
- Ravindran, R.; Kwok, C.S.; Wong, C.W.; Siller-Matula, J.M.; Parwani, P.; Velagapudi, P.; Fischman, D.L.; Alraies, C.; Michos, E.D.; Mamas, M.A. Cardiac arrest and related mortality in emergency departments in the United States: Analysis of the nationwide emergency department sample. Resuscitation 2020, 157, 166–173. [Google Scholar] [CrossRef]
- Chan, P.S.; Spertus, J.A.; Krumholz, H.M.; Berg, R.A.; Li, Y.; Sasson, C.; Nallamothu, B.K. A validated prediction tool for initial survivors of in-hospital cardiac arrest. Arch. Intern. Med. 2012, 172, 947–953. [Google Scholar] [CrossRef]
- Rohlin, O.; Taeri, T.; Netzereab, S.; Ullemark, E.; Djarv, T. Duration of CPR and impact on 30-day survival after ROSC for in-hospital cardiac arrest-A Swedish cohort study. Resuscitation 2018, 132, 1–5. [Google Scholar] [CrossRef]
- Garcia, R.A.; Spertus, J.A.; Girotra, S.; Nallamothu, B.K.; Kennedy, K.F.; McNally, B.F.; Breathett, K.; Del Rios, M.; Sasson, C.; Chan, P.S. Racial and Ethnic Differences in Bystander CPR for Witnessed Cardiac Arrest. N. Engl. J. Med. 2022, 387, 1569–1578. [Google Scholar] [CrossRef]
- Wenger, N.S.; Pearson, M.L.; Desmond, K.A.; Harrison, E.R.; Rubenstein, L.V.; Rogers, W.H.; Kahn, K.L. Epidemiology of do-not-resuscitate orders. Disparity by age, diagnosis, gender, race, and functional impairment. Arch. Intern. Med. 1995, 155, 2056–2062. [Google Scholar] [CrossRef]
- Barnato, A.; Chang, C.; Saynina, O.; Garber, A. Influence of race on inpatient treatment intensity at the end of life. J. Gen. Intern. Med. 2007, 22, 338–345. [Google Scholar] [CrossRef] [PubMed]
- Zheng, N.; Mukamel, D.; Caprio, T.; Cai, S.; Temkin-Greener, H. Racial disparities in in-hospital death and hospice use among nursing home residents at the end of life. Med. Care 2011, 49, 992–998. [Google Scholar] [CrossRef] [PubMed]
- Glei, D.A.; Lee, C.; Weinstein, M. Assessment of Mortality Disparities by Wealth Relative to Other Measures of Socioeconomic Status Among US Adults. JAMA Netw. Open 2022, 5, e226547. [Google Scholar] [CrossRef] [PubMed]
- Rees, C.A.; Monuteaux, M.C.; Raphael, J.L.; Michelson, K.A. Disparities in Pediatric Mortality by Neighborhood Income in United States Emergency Departments. J. Pediatr. 2020, 219, 209–215.e3. [Google Scholar] [CrossRef]
- Sabanayagam, C.; Shankar, A. Income is a stronger predictor of mortality than education in a national sample of US adults. J. Health Popul. Nutr. 2012, 30, 82–86. [Google Scholar] [CrossRef]
- Lee, S.Y.; Lee, S.R.; Choi, E.K.; Han, K.D.; Oh, S.; Lip, G.Y.H. Impact of Socioeconomic Status on Emergency Department Visits in Patients With Atrial Fibrillation: A Nationwide Population-Based Cohort Study. J. Am. Heart Assoc. 2022, 11, e027192. [Google Scholar] [CrossRef]
- Blendon, R.J.; Buhr, T.; Cassidy, E.F.; Pérez, D.J.; Sussman, T.; Benson, J.M.; Herrmann, M.J. Disparities in physician care: Experiences and perceptions of a multi-ethnic America. Health Aff. 2008, 27, 507–517. [Google Scholar] [CrossRef]
- Gray, B.H.; Schlesinger, M.; Siegfried, S.M.; Horowitz, E. Racial and ethnic disparities in the use of high-volume hospitals. INQUIRY J. Health Care Organ. Provis. Financ. 2009, 46, 322–338. [Google Scholar] [CrossRef]
- Kawachi, I.; Daniels, N.; Robinson, D.E. Health disparities by race and class: Why both matter. Health Aff. 2005, 24, 343–352. [Google Scholar] [CrossRef]

| Variables | 2016 | 2017 | 2018 | 2019 | 2020 | Total |
|---|---|---|---|---|---|---|
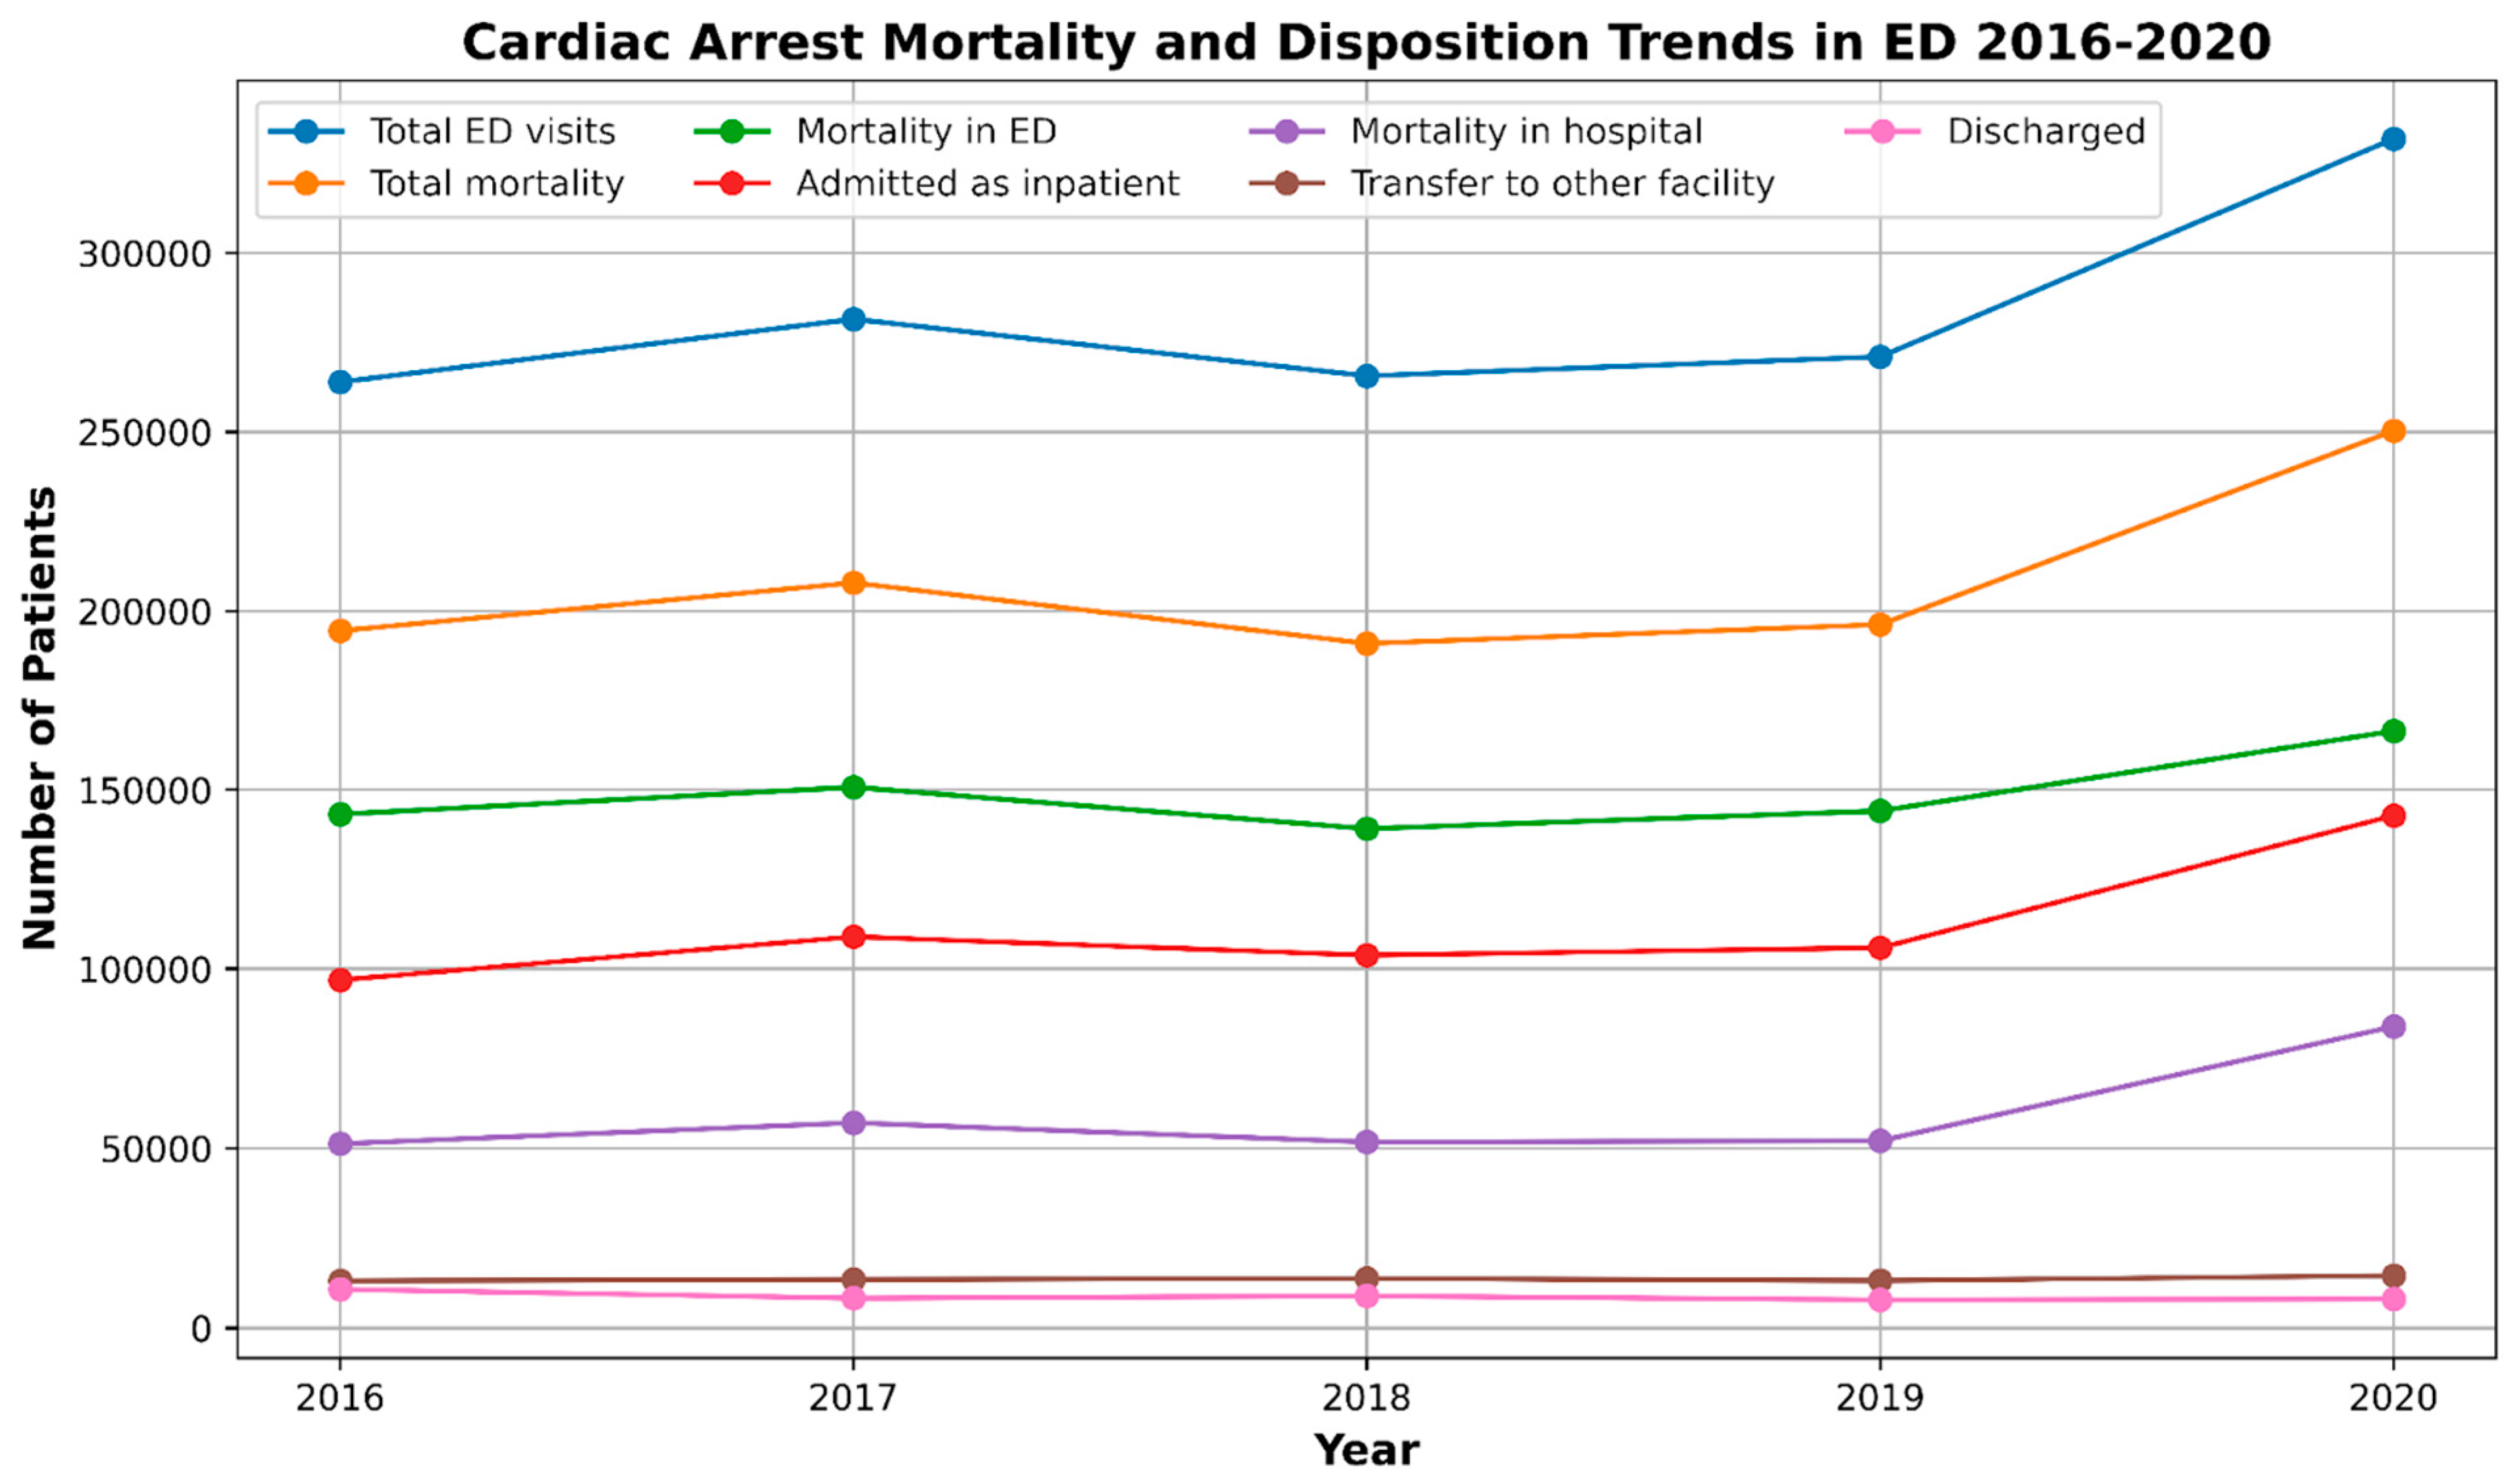
| Total ED visits | 144,842,742 | 144,814,803 | 143,454,430 | 143,432,284 | 123,278,165 | 699,822,424 |
| N Cardiac Arrest and DNR patients in ED visits | 263,961 | 281,520 | 265,658 | 271,015 | 331,906 | 1,414,060 |
| % Cardiac Arrest and DNR patients in ED visits | 0.18% | 0.19% | 0.19% | 0.19% | 0.27% | 0.20% |
| Disposition | ||||||
| Admitted as inpatient | 96,880 | 108,967 | 103,819 | 105,874 | 142,824 | 558,364 |
| Mortality in ED | 143,189 | 150,755 | 139,145 | 144,113 | 166,440 | 743,642 |
| Discharged | 10,761 | 8285 | 8905 | 7843 | 8076 | 43,870 |
| Transfer to other facility | 13,131 | 13,511 | 13,789 | 13,185 | 14,567 | 68,183 |
| Mortality | ||||||
| Did not die | 69,502 | 73,655 | 74,761 | 74,821 | 81,561 | 374,300 |
| Died in the ED | 143,189 | 150,755 | 139,145 | 144,113 | 166,440 | 743,642 |
| % Died in the ED | 54.25% | 53.55% | 52.38% | 53.18% | 50.15% | 52.59% |
| Died in the hospital | 51,271 | 57,110 | 51,752 | 52,081 | 83,905 | 296,119 |
| % Died in the hospital | 52.92% | 52.41% | 49.85% | 49.19% | 58.75% | 53.03% |
| Characteristics | Cardiac Arrest and DNR (2016–2020) | |
|---|---|---|
| N | % | |
| N | 1,414,062 | 100.00 |
| Gender | N | % |
| Female | 553,016 | 39.11 |
| Male | 861,046 | 60.89 |
| Mean Age (Years) | Mean | SD |
| Female | 66.17 | 16.89 |
| Male | 62.67 | 16.79 |
| Age Groups | N | % |
| 18–29 | 62,814 | 4.49 |
| 30–49 | 200,839 | 14.27 |
| 50–69 | 563,678 | 39.85 |
| ≥70 | 586,731 | 41.40 |
| Race (2019–2020) | N | % |
| Asian or Pacific Islander | 15,834 | 1.13 |
| Black | 127,230 | 8.85 |
| Hispanic | 66,544 | 4.78 |
| Native American | 2521 | 0.17 |
| Other | 23,783 | 1.65 |
| White | 367,009 | 25.42 |
| Disposition from Ed | N | % |
| Admitted as an inpatient to this hospital | 558,364 | 40.07 |
| Against medical advice | 1371 | 0.10 |
| Died in ED | 743,642 | 52.55 |
| Discharged alive unknown destination | 2845 | 0.20 |
| Home health care | 227 | 0.02 |
| Routine | 39,430 | 2.60 |
| Transfer other | 8234 | 0.56 |
| Transfer to short-term hospital | 59,948 | 3.90 |
| Median Household Income | N | % |
| ≤49,999 | 499,190 | 35.30 |
| 50,000–64,999 | 369,425 | 25.95 |
| 65,000–85,999 | 294,982 | 20.82 |
| ≥86,000 | 250,465 | 17.92 |
| Insurance Status | N | % |
| Medicaid | 178,950 | 12.77 |
| Medicare | 777,920 | 54.79 |
| No charge | 4573 | 0.35 |
| Other | 41,071 | 2.87 |
| Private insurance | 267,487 | 18.86 |
| Self-pay | 144,059 | 10.37 |
| Hospital Region | N | % |
| Midwest | 299,039 | 20.11 |
| Northeast | 253,543 | 16.91 |
| South Atlantic | 630,898 | 45.20 |
| West | 230,581 | 17.77 |
| Hospital Urban–Rural Designation | N | % |
| Collapsed category of small metropolitan and micropolitan | 12,345 | 0.74 |
| Large metropolitan areas with at least 1 million residents | 727,449 | 53.34 |
| Metropolitan, collapsed category of large and small metropolitan | 11,669 | 1.07 |
| Micropolitan areas | 113,571 | 7.16 |
| Non-metropolitan, collapsed category of micropolitan and non-urban | 26,578 | 2.11 |
| Not metropolitan or micropolitan (non-urban residual) | 64,445 | 3.92 |
| Small metropolitan areas with less than 1 million residents | 458,004 | 31.66 |
| Hospital Teaching Status | N | % |
| Metropolitan non-teaching | 337,624 | 26.68 |
| Metropolitan teaching | 871,843 | 60.14 |
| Non-metropolitan hospital | 204,595 | 13.19 |
| Mortality | N | % |
| Did not die | 374,299 | 26.18 |
| Died in the ED | 743,642 | 52.55 |
| Died in the hospital | 296,120 | 21.26 |
| Comorbidities | N | % |
| AIDS | 7447 | 0.54 |
| Alcohol | 51,877 | 3.71 |
| Autoimmune | 22,382 | 1.59 |
| Dementia | 66,126 | 4.69 |
| Depression | 68,219 | 4.82 |
| Drug abuse | 46,963 | 3.37 |
| Chronic pulmonary disease | 240,537 | 17.07 |
| Obesity | 136,390 | 9.71 |
| Peripheral vascular disease | 68,838 | 4.86 |
| Hypothyroidism | 86,413 | 6.10 |
| AKI | 289,085 | 20.79 |
| Cardiogenic shock | 40,823 | 2.93 |
| Acute liver failure | 58,055 | 4.16 |
| CAD | 302,886 | 21.47 |
| Smoking | 306,179 | 21.45 |
| HTN | 678,861 | 48.37 |
| Diabetes | 387,567 | 27.66 |
| Cancer | 75,065 | 5.32 |
| Factors | Adjusted Odds Ratio | 95% CI Lower Limit | 95% CI Upper Limit | p-Value |
|---|---|---|---|---|
| Gender | ||||
| Male | Reference | |||
| Female | 1 | 0.97 | 1.02 | 0.690 |
| Age Groups | ||||
| 18–29 | Reference | |||
| 30–49 | 1.3 | 1.22 | 1.39 | <0.001 |
| 50–69 | 1.71 | 1.6 | 1.82 | <0.001 |
| ≥70 | 2.38 | 2.23 | 2.55 | <0.001 |
| Race (2019–2020) | ||||
| White | Reference | |||
| Asian or Pacific Islander | 0.79 | 0.73 | 0.85 | <0.001 |
| Black | 0.96 | 0.92 | 0.99 | 0.008 |
| Hispanic | 0.81 | 0.77 | 0.84 | <0.001 |
| Native American | 0.9 | 0.74 | 1.1 | 0.318 |
| Other | 0.94 | 0.88 | 1 | 0.047 |
| Median Household Income | ||||
| ≤49,999 | Reference | |||
| 50,000–64,999 | 1.03 | 1.00 | 1.06 | 0.076 |
| 65,000–85,999 | 1.09 | 1.05 | 1.13 | <0.001 |
| ≥86,000 | 1.12 | 1.07 | 1.16 | <0.001 |
| Insurance Status | ||||
| Medicaid | Reference | |||
| Medicare | 1.1 | 1.05 | 1.15 | <0.001 |
| No charge | 1.39 | 1.14 | 1.7 | 0.001 |
| Other | 1 | 0.92 | 1.08 | 0.956 |
| Private insurance | 0.95 | 0.91 | 1 | 0.031 |
| Self-pay | 1.77 | 1.68 | 1.86 | <0.001 |
| Hospital Region | ||||
| Midwest | Reference | |||
| Northeast | 0.99 | 0.95 | 1.03 | 0.553 |
| South Atlantic | 0.98 | 0.94 | 1.01 | 0.178 |
| West | 0.82 | 0.79 | 0.86 | <0.001 |
| Hospital Urban–Rural Designation | ||||
| Large metropolitan areas with at least 1 million residents | Reference | |||
| Collapsed category of small metropolitan and micropolitan | 0.98 | 0.88 | 1.09 | 0.663 |
| Metropolitan, collapsed category of large and small metropolitan | 1 | 0.85 | 1.17 | 0.988 |
| Micropolitan areas | 1.01 | 0.97 | 1.06 | 0.566 |
| Non-metropolitan, collapsed category of micropolitan and non-urban | 0.96 | 0.89 | 1.05 | 0.381 |
| Not metropolitan or micropolitan (non-urban residual) | 1.19 | 1.12 | 1.26 | <0.001 |
| Small metropolitan areas with less than 1 million residents | 1.03 | 1 | 1.06 | 0.039 |
| Hospital Teaching Status | ||||
| Metropolitan teaching | Reference | |||
| Metropolitan non-teaching | 1.1 | 1.07 | 1.13 | <0.001 |
| Non-metropolitan hospital | 1.16 | 1.12 | 1.21 | <0.001 |
| Elixhauser Comorbidities | ||||
| ≤4 | Reference | |||
| >4 | 1.18 | 1.01 | 1.37 | 0.035 |
| Primary Diagnosis | N (%) | Mortality N (%) |
|---|---|---|
| Cardiac arrest | 761,889 (54%) | 659,089 (86.5%) |
| Respiratory failure | 52,223 (3.7%) | 15,088 (28.8%) |
| Gastrointestinal bleed (GIB) | 4240 (0.3%) | 303 (7.2%) |
| Syncope | 2905 (0.2%) | 149 (5.1%) |
| ST-elevation myocardial infarction (STEMI) | 46,248 (3.3%) | 1775 (3.8%) |
| COVID-19 | 16,952 (1.2%) | 625 (3.7%) |
| Ventricular fibrillation | 22,046 (1.6%) | 787 (3.6%) |
| Bradycardia unspecified | 2197 (0.2%) | 75 (3.4%) |
| Hyperkalemia | 3248 (0.2%) | 82 (2.5%) |
| Illicit drug overdose | 10,157 (0.7%) | 218 (2.1%) |
| Pneumonia | 7165 (0.5%) | 135 (1.9%) |
| Atrial fibrillation | 4041 (0.3%) | 66 (1.6%) |
| Ventricular tachycardia | 9661 (1.6%) | 148 (1.5%) |
| Non-ST-elevation myocardial infarction (NSTEMI) | 24,373 (1.7%) | 244 (1%) |
| Sepsis | 125,303 (8.9%) | 990 (0.8%) |
| Atrioventricular (AV) block complete | 6871 (0.5%) | 39 (0.5%) |
| Characteristics | Cardiac Arrest and DNR (2016–2020) | ||||
|---|---|---|---|---|---|
| Admitted as Inpatient | Mortality in ED | Discharged | Transfer to Other Facility | p-Value | |
| N | 558,364 | 743,642 | 43,872 | 68,182 | |
| % | 39.49 | 52.59 | 3.10 | 4.82 | |
| Gender | % | % | % | % | <0.001 |
| Female | 41.98% | 50.67% | 2.87% | 4.48% | |
| Male | 38.84% | 53.76% | 2.94% | 4.45% | |
| Age in Years | Mean (SD) | Mean (SD) | Mean (SD) | Mean (SD) | |
| Female | 64.94 (16.19) | 67.65 (17.24) | 64.49 (18.65) | 61.89 (16.34) | |
| Male | 62.94 (15.87) | 62.79 (17.39) | 59.74 (18.13) | 60.73 (15.96) | |
| Age Groups | % | % | % | % | <0.001 |
| 18–29 | 33.90% | 56.42% | 4.64% | 5.05% | |
| 30–49 | 39.31% | 52.01% | 3.62% | 5.06% | |
| 50–69 | 42.79% | 49.29% | 2.76% | 5.16% | |
| ≥70 | 38.39% | 55.46% | 2.63% | 3.52% | |
| Race (2019–2020) | % | % | % | % | <0.001 |
| Asian or Pacific Islander | 48.03% | 47.92% | 1.93% | 2.12% | |
| Black | 44.11% | 50.24% | 2.55% | 3.09% | |
| Hispanic | 49.49% | 46.29% | 1.62% | 2.59% | |
| Native American | 43.29% | 46.51% | 3.04% | 7.16% | |
| Other | 38.72% | 55.74% | 3.25% | 2.29% | |
| White | 39.39% | 52.78% | 2.44% | 5.38% | |
| Median Household Income | % | % | % | % | <0.001 |
| ≤49,999 | 40.39% | 51.75% | 3.15% | 4.71% | |
| 50K–64,999 | 39.45% | 52.03% | 2.86% | 5.66% | |
| 65K–85,999 | 40.66% | 52.86% | 2.55% | 3.93% | |
| ≥86k | 39.65% | 54.54% | 2.94% | 2.86% | |
| Insurance Status | % | % | % | % | <0.001 |
| Medicaid | 47.03% | 45.12% | 3.35% | 4.51% | |
| Medicare | 41.97% | 51.49% | 2.54% | 4.01% | |
| No charge | 39.52% | 56.00% | 1.90% | 2.59% | |
| Other | 37.37% | 53.92% | 3.00% | 5.71% | |
| Private insurance | 40.73% | 50.56% | 3.03% | 5.67% | |
| Self-pay | 21.04% | 70.48% | 4.14% | 4.34% | |
| Hospital Region | % | % | % | % | <0.001 |
| Midwest | 37.09% | 53.25% | 3.54% | 6.12% | |
| Northeast | 37.50% | 54.88% | 3.90% | 3.73% | |
| South Atlantic | 40.19% | 52.88% | 2.65% | 4.28% | |
| West | 45.59% | 48.72% | 1.92% | 3.77% | |
| Hospital Urban–Rural Designation | % | % | % | % | <0.001 |
| Collapsed category of small metropolitan and micropolitan | 50.95% | 47.34% | 1.34% | 0.36% | |
| Large metropolitan areas with at least 1 million residents | 42.71% | 51.79% | 2.91% | 2.59% | |
| Metropolitan, collapsed category of large and small metropolitan | 36.04% | 57.57% | 3.94% | 2.45% | |
| Micropolitan areas | 22.58% | 58.46% | 3.62% | 15.34% | |
| Non-metropolitan, collapsed category of micropolitan and non-urban | 36.06% | 54.62% | 3.73% | 5.59% | |
| Not metropolitan or micropolitan (non-urban residual) | 8.64% | 66.98% | 4.76% | 19.62% | |
| Small metropolitan areas with less than 1 million residents | 43.61% | 50.53% | 2.47% | 3.38% | |
| Hospital Teaching Status | % | % | % | % | <0.001 |
| Metropolitan non-teaching | 37.04% | 54.65% | 2.55% | 5.76% | |
| Metropolitan teaching | 45.68% | 49.91% | 2.84% | 1.57% | |
| Non-metropolitan hospital | 20.60% | 60.37% | 3.98% | 15.05% | |
| Elixhauser Comorbidities | % | % | % | % | <0.001 |
| ≤4 | 38.85% | 53.64% | 2.96% | 4.55% | |
| >4 | 92.02% | 6.33% | 0.67% | 0.97% | |
| Factors | Adjusted Odds Ratio | 95% CI Lower Limit | 95% CI Upper Limit | p-Value |
|---|---|---|---|---|
| Gender | ||||
| Male | Reference | |||
| Female | 1.08 | 1.01 | 1.15 | 0.029 |
| Age Groups | ||||
| 18–29 | Reference | |||
| 30–49 | 1.12 | 0.96 | 1.32 | 0.150 |
| 50–69 | 1.36 | 1.17 | 1.59 | <0.001 |
| ≥70 | 1.15 | 0.97 | 1.36 | 0.107 |
| Race (2019–2020) | ||||
| White | Reference | |||
| Asian or Pacific Islander | 0.47 | 0.37 | 0.61 | <0.001 |
| Black | 0.80 | 0.73 | 0.87 | <0.001 |
| Hispanic | 0.64 | 0.57 | 0.73 | <0.001 |
| Native American | 0.95 | 0.61 | 1.47 | 0.813 |
| Other | 0.56 | 0.45 | 0.69 | <0.001 |
| Median Household Income | ||||
| ≤49,999 | Reference | |||
| 50K–64,999 | 1.30 | 1.20 | 1.41 | <0.001 |
| 65K–85,999 | 1.17 | 1.06 | 1.29 | 0.002 |
| ≥86k | 0.93 | 0.82 | 1.05 | 0.229 |
| Insurance Status | ||||
| Medicaid | Reference | |||
| Medicare | 1.03 | 0.92 | 1.16 | 0.573 |
| No charge | 1.23 | 0.70 | 2.14 | 0.471 |
| Other | 1.23 | 1.02 | 1.49 | 0.031 |
| Private insurance | 1.15 | 1.03 | 1.28 | 0.015 |
| Self-pay | 1.56 | 1.36 | 1.78 | <0.001 |
| Hospital Region | ||||
| Midwest | Reference | |||
| Northeast | 0.97 | 0.87 | 1.09 | 0.614 |
| South Atlantic | 0.51 | 0.47 | 0.56 | <0.001 |
| West | 0.62 | 0.56 | 0.69 | <0.001 |
| Hospital Urban–Rural Designation | ||||
| Large metropolitan areas with at least 1 million residents | Reference | |||
| Collapsed category of small metropolitan and micropolitan | 0.08 | 0.04 | 0.17 | <0.001 |
| Metropolitan, collapsed category of large and small metropolitan | 0.42 | 0.27 | 0.66 | <0.001 |
| Micropolitan areas | 2.06 | 1.88 | 2.25 | <0.001 |
| Non-metropolitan, collapsed category of micropolitan and non-urban | 0.63 | 0.52 | 0.76 | <0.001 |
| Not metropolitan or micropolitan (non-urban residual) | 6.76 | 6.03 | 7.58 | <0.001 |
| Small metropolitan areas with less than 1 million residents | 1.19 | 1.10 | 1.30 | <0.001 |
| Hospital Teaching Status | ||||
| Metropolitan teaching | Reference | |||
| Metropolitan non-teaching | 4.94 | 4.57 | 5.34 | <0.001 |
| Non-metropolitan hospital | 8.78 | 8.00 | 9.64 | <0.001 |
| Elixhauser Comorbidities | ||||
| ≤4 | Reference | |||
| >4 | 2.59 | 1.77 | 3.80 | <0.001 |
Disclaimer/Publisher’s Note: The statements, opinions and data contained in all publications are solely those of the individual author(s) and contributor(s) and not of MDPI and/or the editor(s). MDPI and/or the editor(s) disclaim responsibility for any injury to people or property resulting from any ideas, methods, instructions or products referred to in the content. |
© 2024 by the authors. Licensee MDPI, Basel, Switzerland. This article is an open access article distributed under the terms and conditions of the Creative Commons Attribution (CC BY) license (https://creativecommons.org/licenses/by/4.0/).
Share and Cite
Zabel, K.M.; Quazi, M.A.; Leyba, K.; Millhuff, A.C.; Madi, M.; Madrid, W.H.; Goyal, A.; Bilal, M.I.; Sohail, A.H.; Sagheer, S.; et al. Cardiac Arrest Mortality and Disposition Patterns in United States Emergency Departments. J. Clin. Med. 2024, 13, 5585. https://doi.org/10.3390/jcm13185585
Zabel KM, Quazi MA, Leyba K, Millhuff AC, Madi M, Madrid WH, Goyal A, Bilal MI, Sohail AH, Sagheer S, et al. Cardiac Arrest Mortality and Disposition Patterns in United States Emergency Departments. Journal of Clinical Medicine. 2024; 13(18):5585. https://doi.org/10.3390/jcm13185585
Chicago/Turabian StyleZabel, Kenneth M., Mohammed A. Quazi, Katarina Leyba, Alexandra C. Millhuff, Mikel Madi, Wilfredo Henriquez Madrid, Aman Goyal, Muhammad Ibraiz Bilal, Amir H. Sohail, Shazib Sagheer, and et al. 2024. "Cardiac Arrest Mortality and Disposition Patterns in United States Emergency Departments" Journal of Clinical Medicine 13, no. 18: 5585. https://doi.org/10.3390/jcm13185585
APA StyleZabel, K. M., Quazi, M. A., Leyba, K., Millhuff, A. C., Madi, M., Madrid, W. H., Goyal, A., Bilal, M. I., Sohail, A. H., Sagheer, S., & Sheikh, A. B. (2024). Cardiac Arrest Mortality and Disposition Patterns in United States Emergency Departments. Journal of Clinical Medicine, 13(18), 5585. https://doi.org/10.3390/jcm13185585