
Changes in Global Longitudinal Strain after TAVI: Additional Prognostic Value over Cardiac Damage in Patients with Severe Aortic Stenosis

 , , ,
, , , 
Abstract
:1. Introduction
2. Materials and Methods
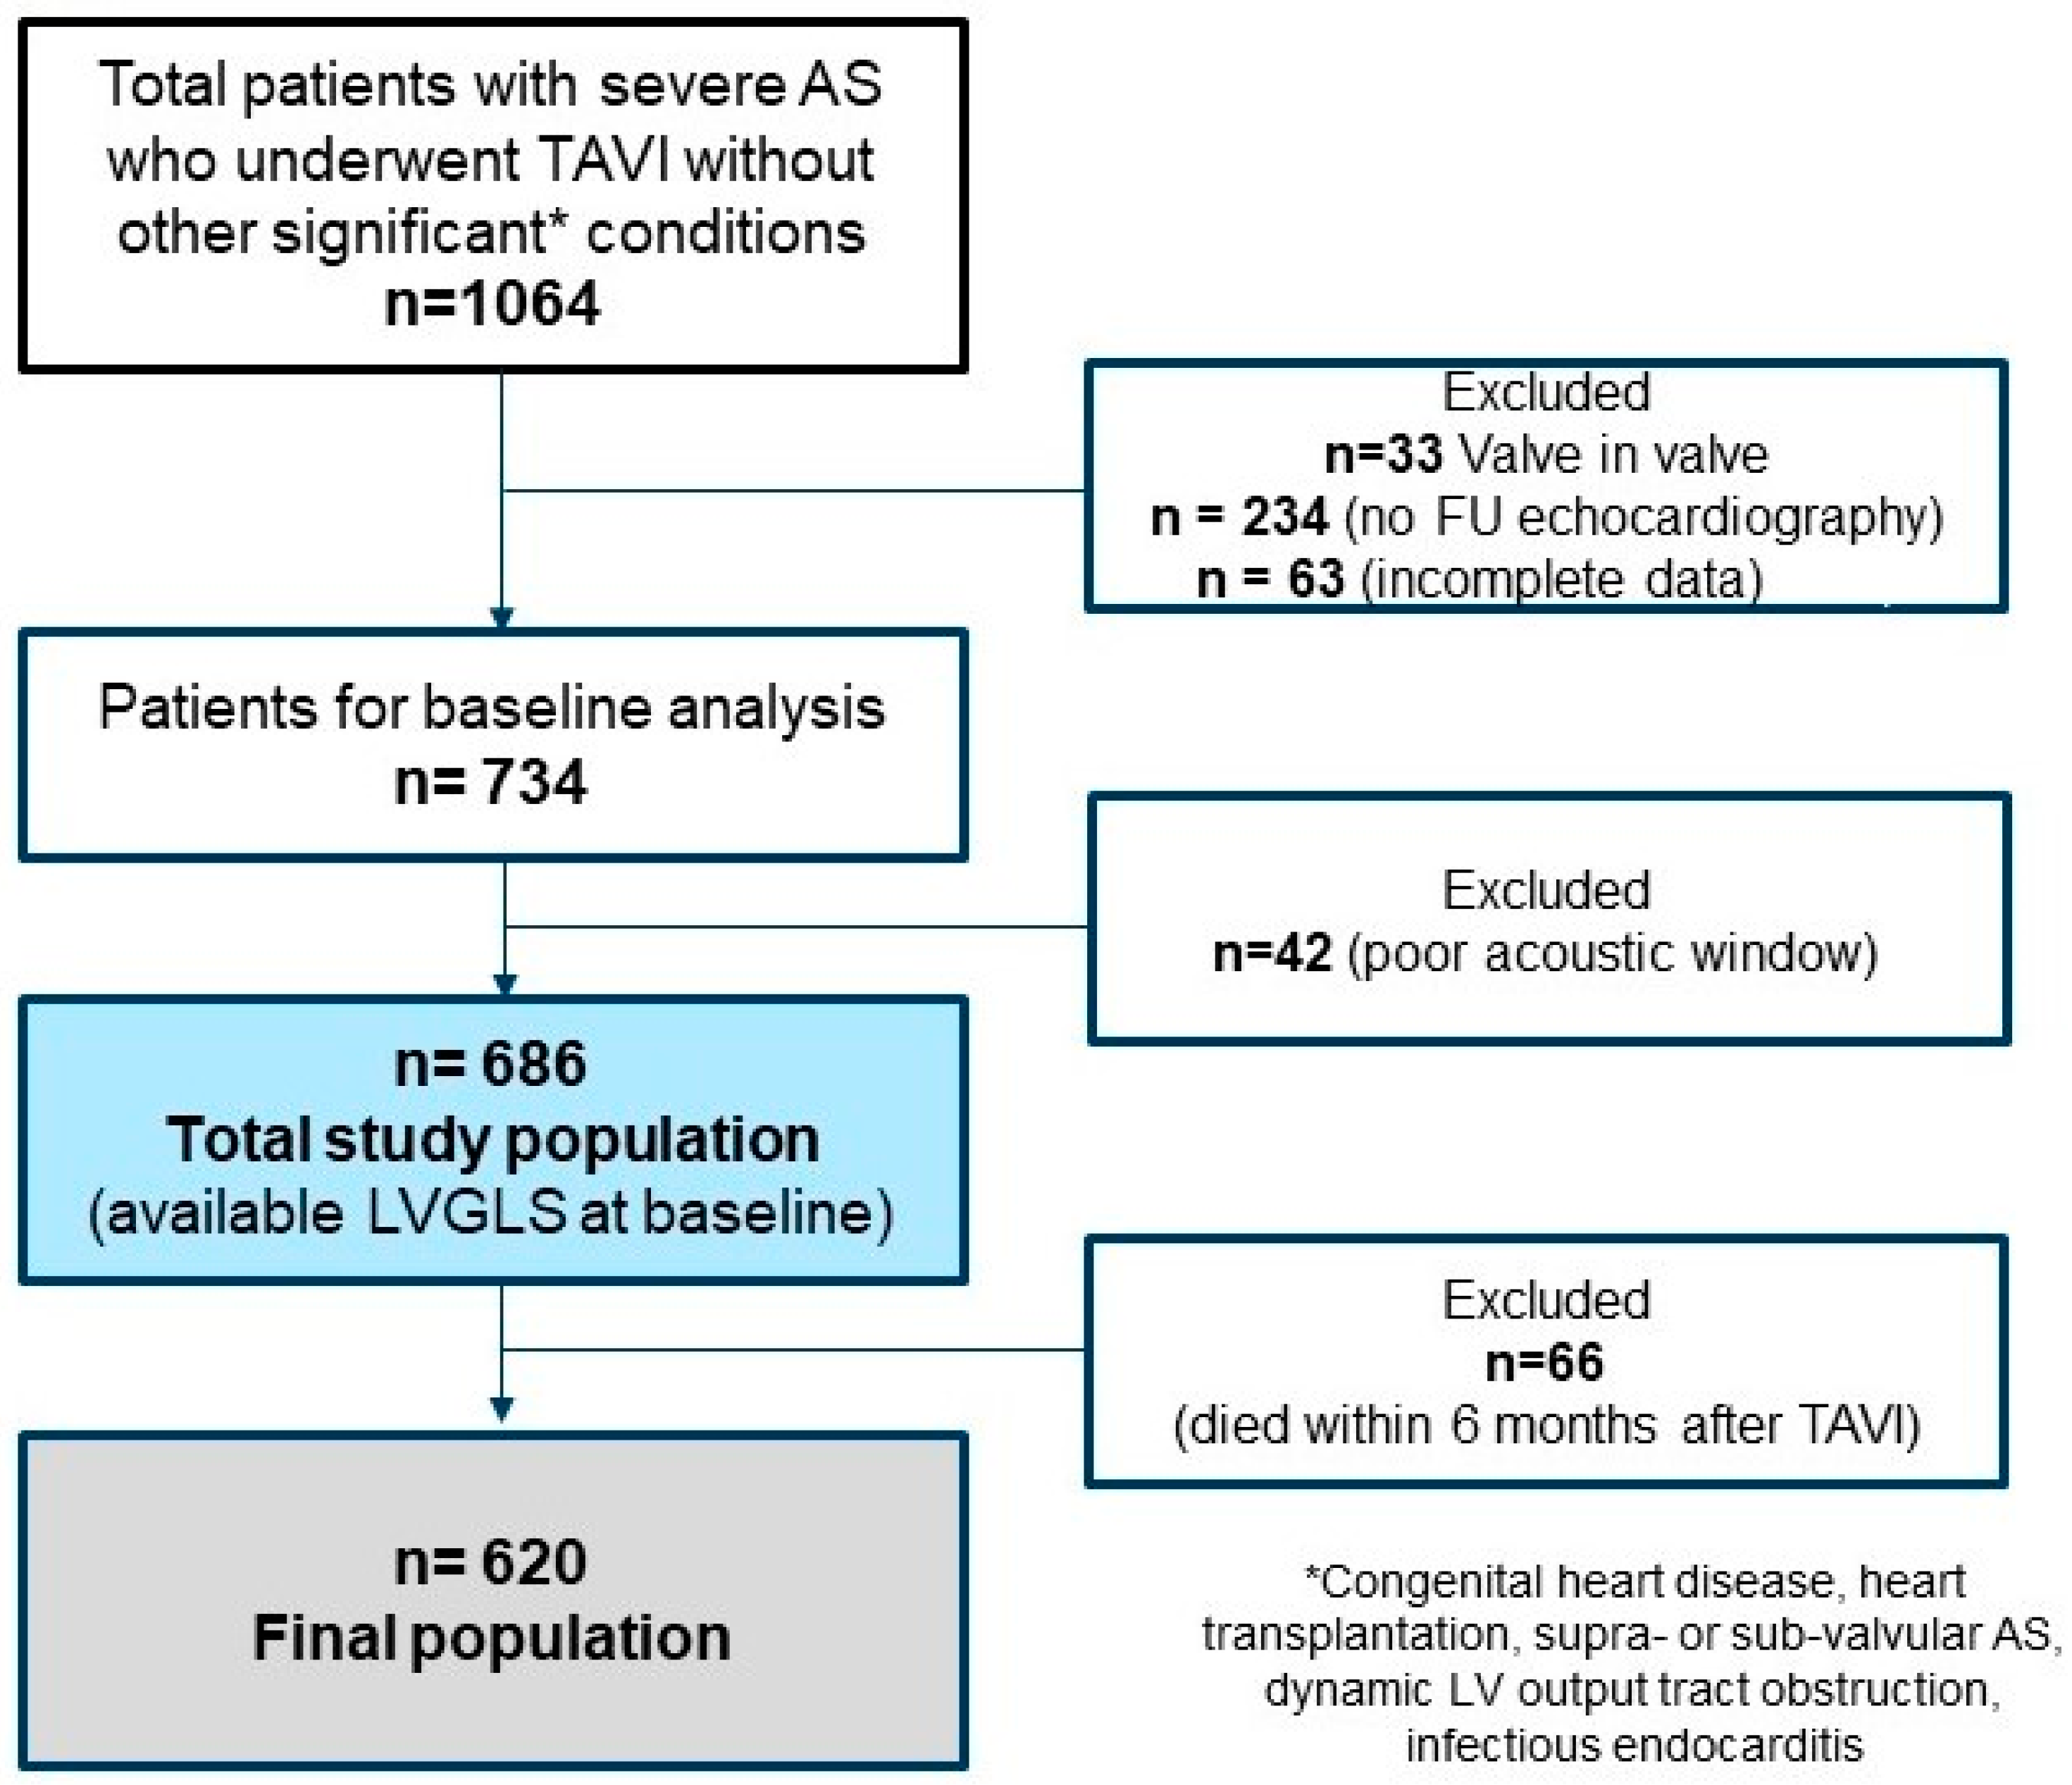
2.1. Study Population
2.2. Echocardiographic Assessment
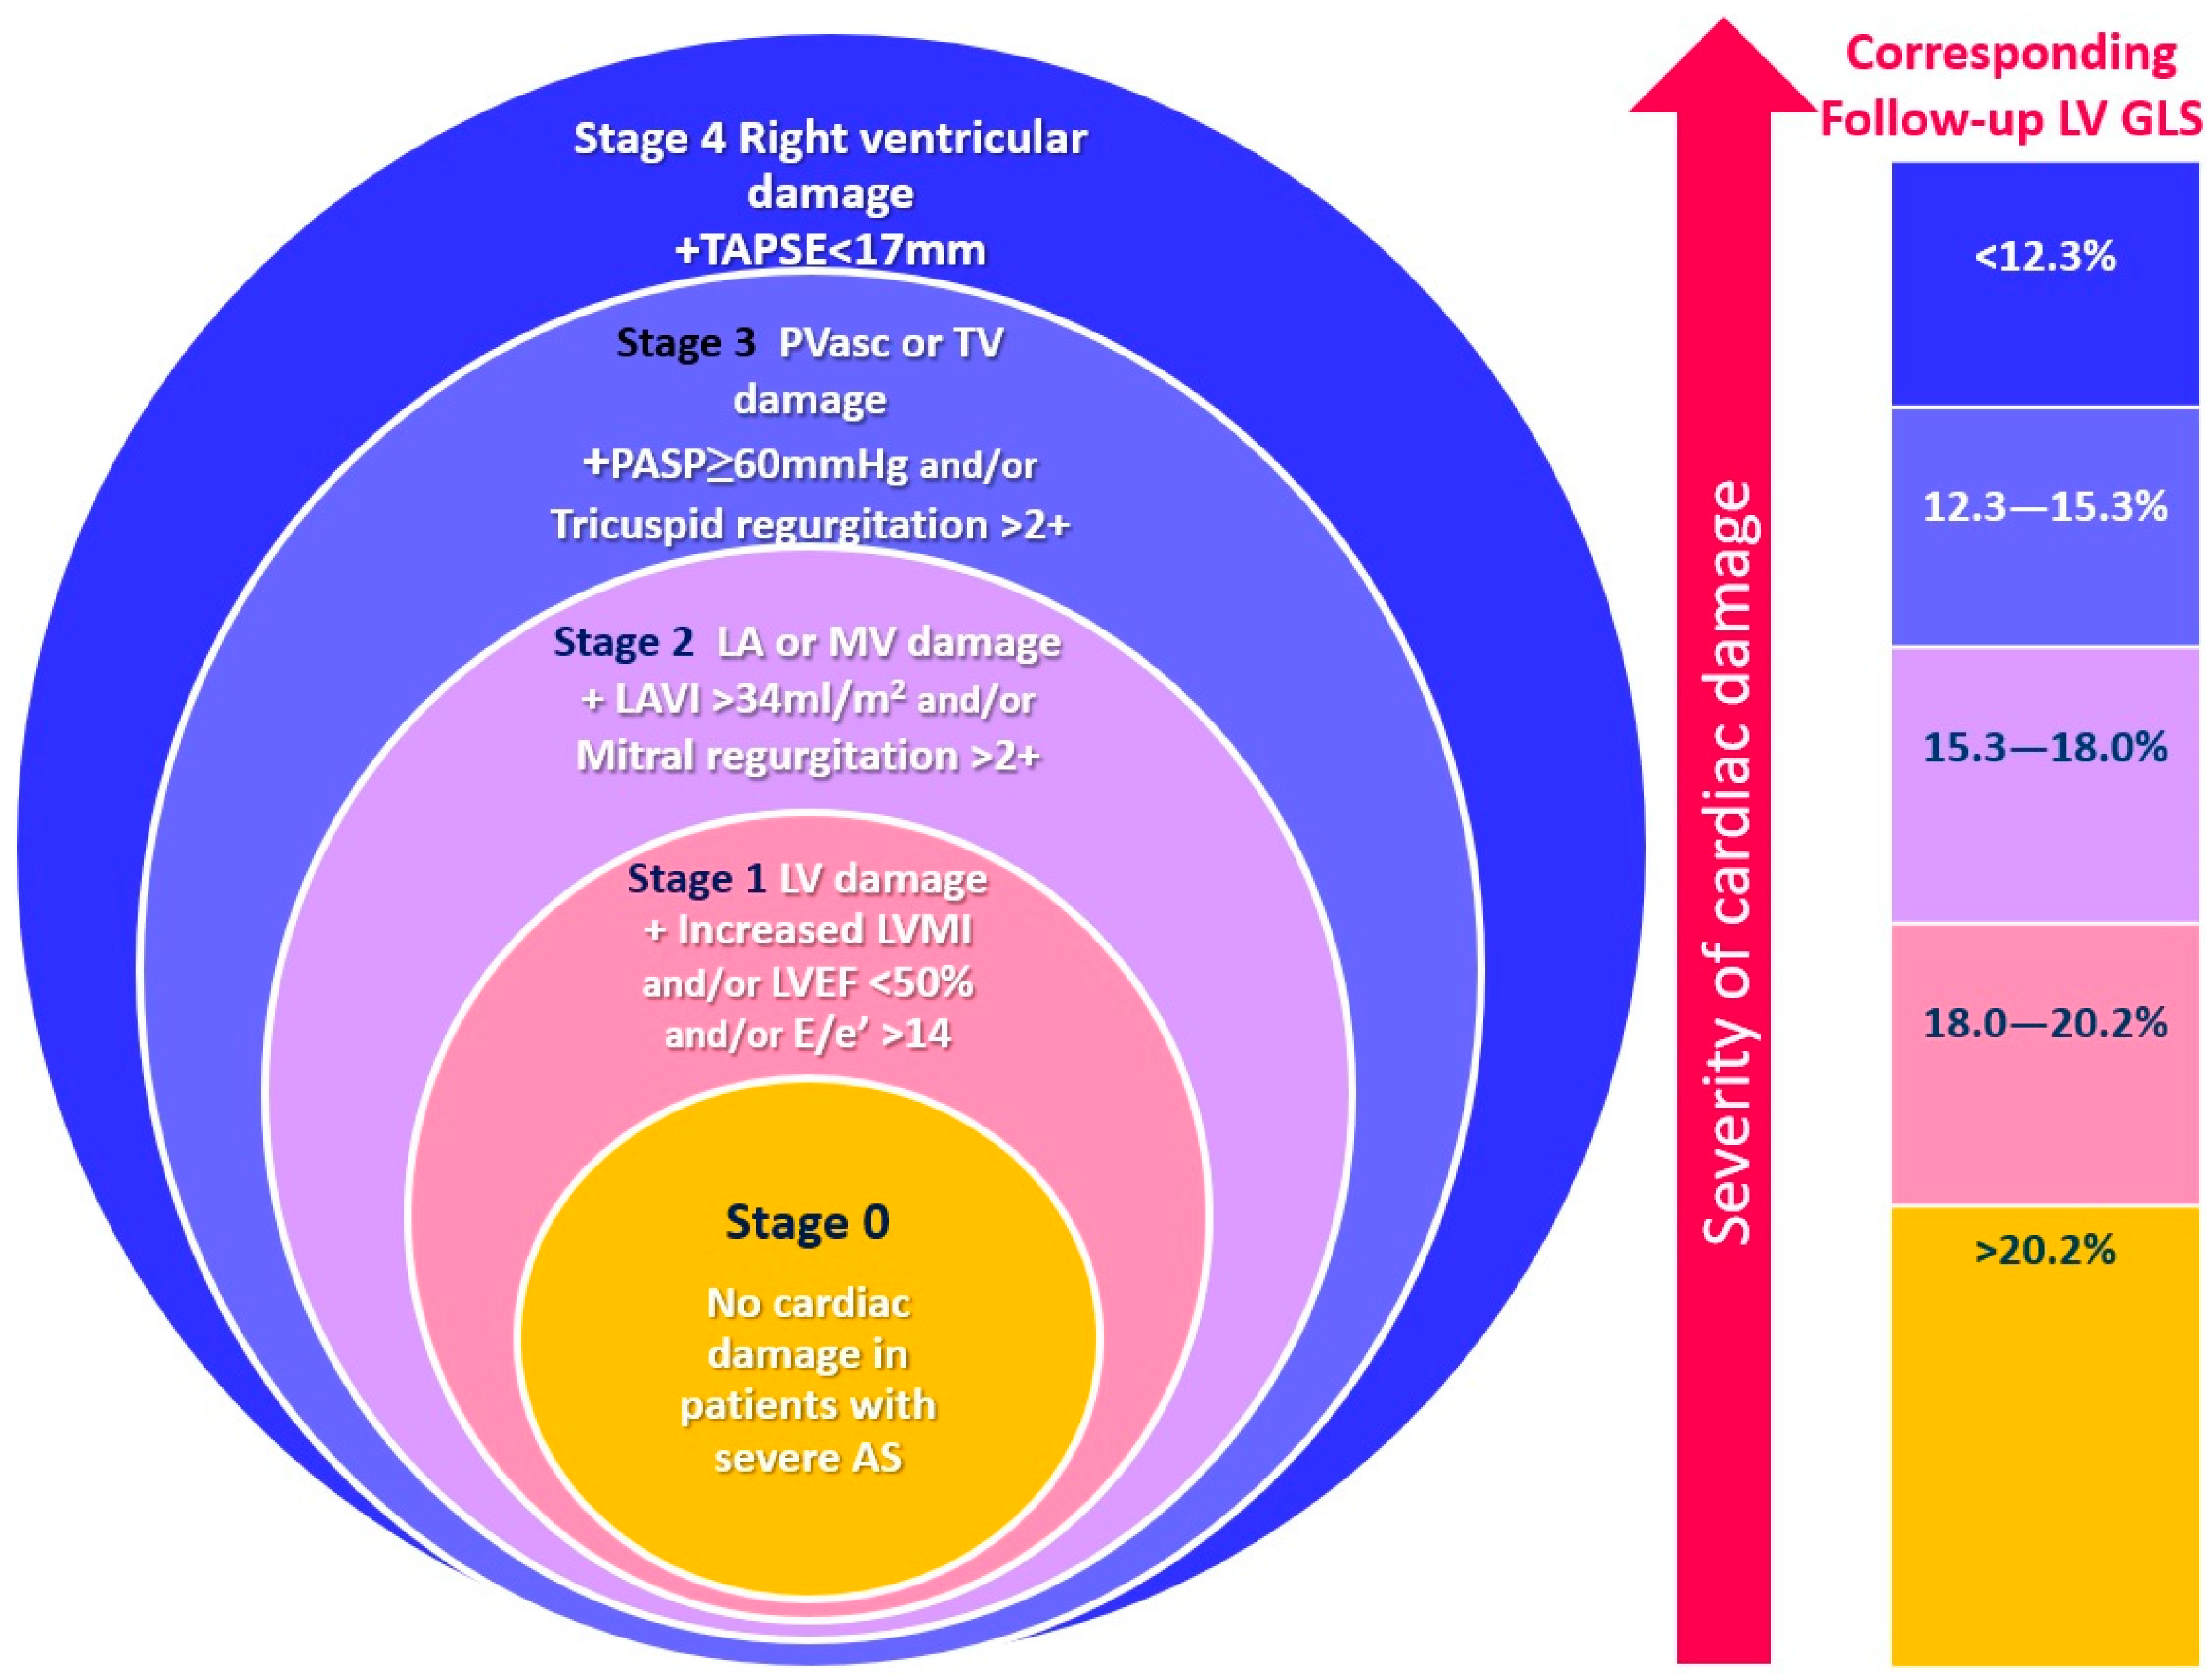
2.3. Cardiac Damage Staging
2.4. Follow-Up and Study Endpoint
2.5. Statistical Analysis
3. Results
3.1. Baseline Clinical and Echocardiographic Characteristics
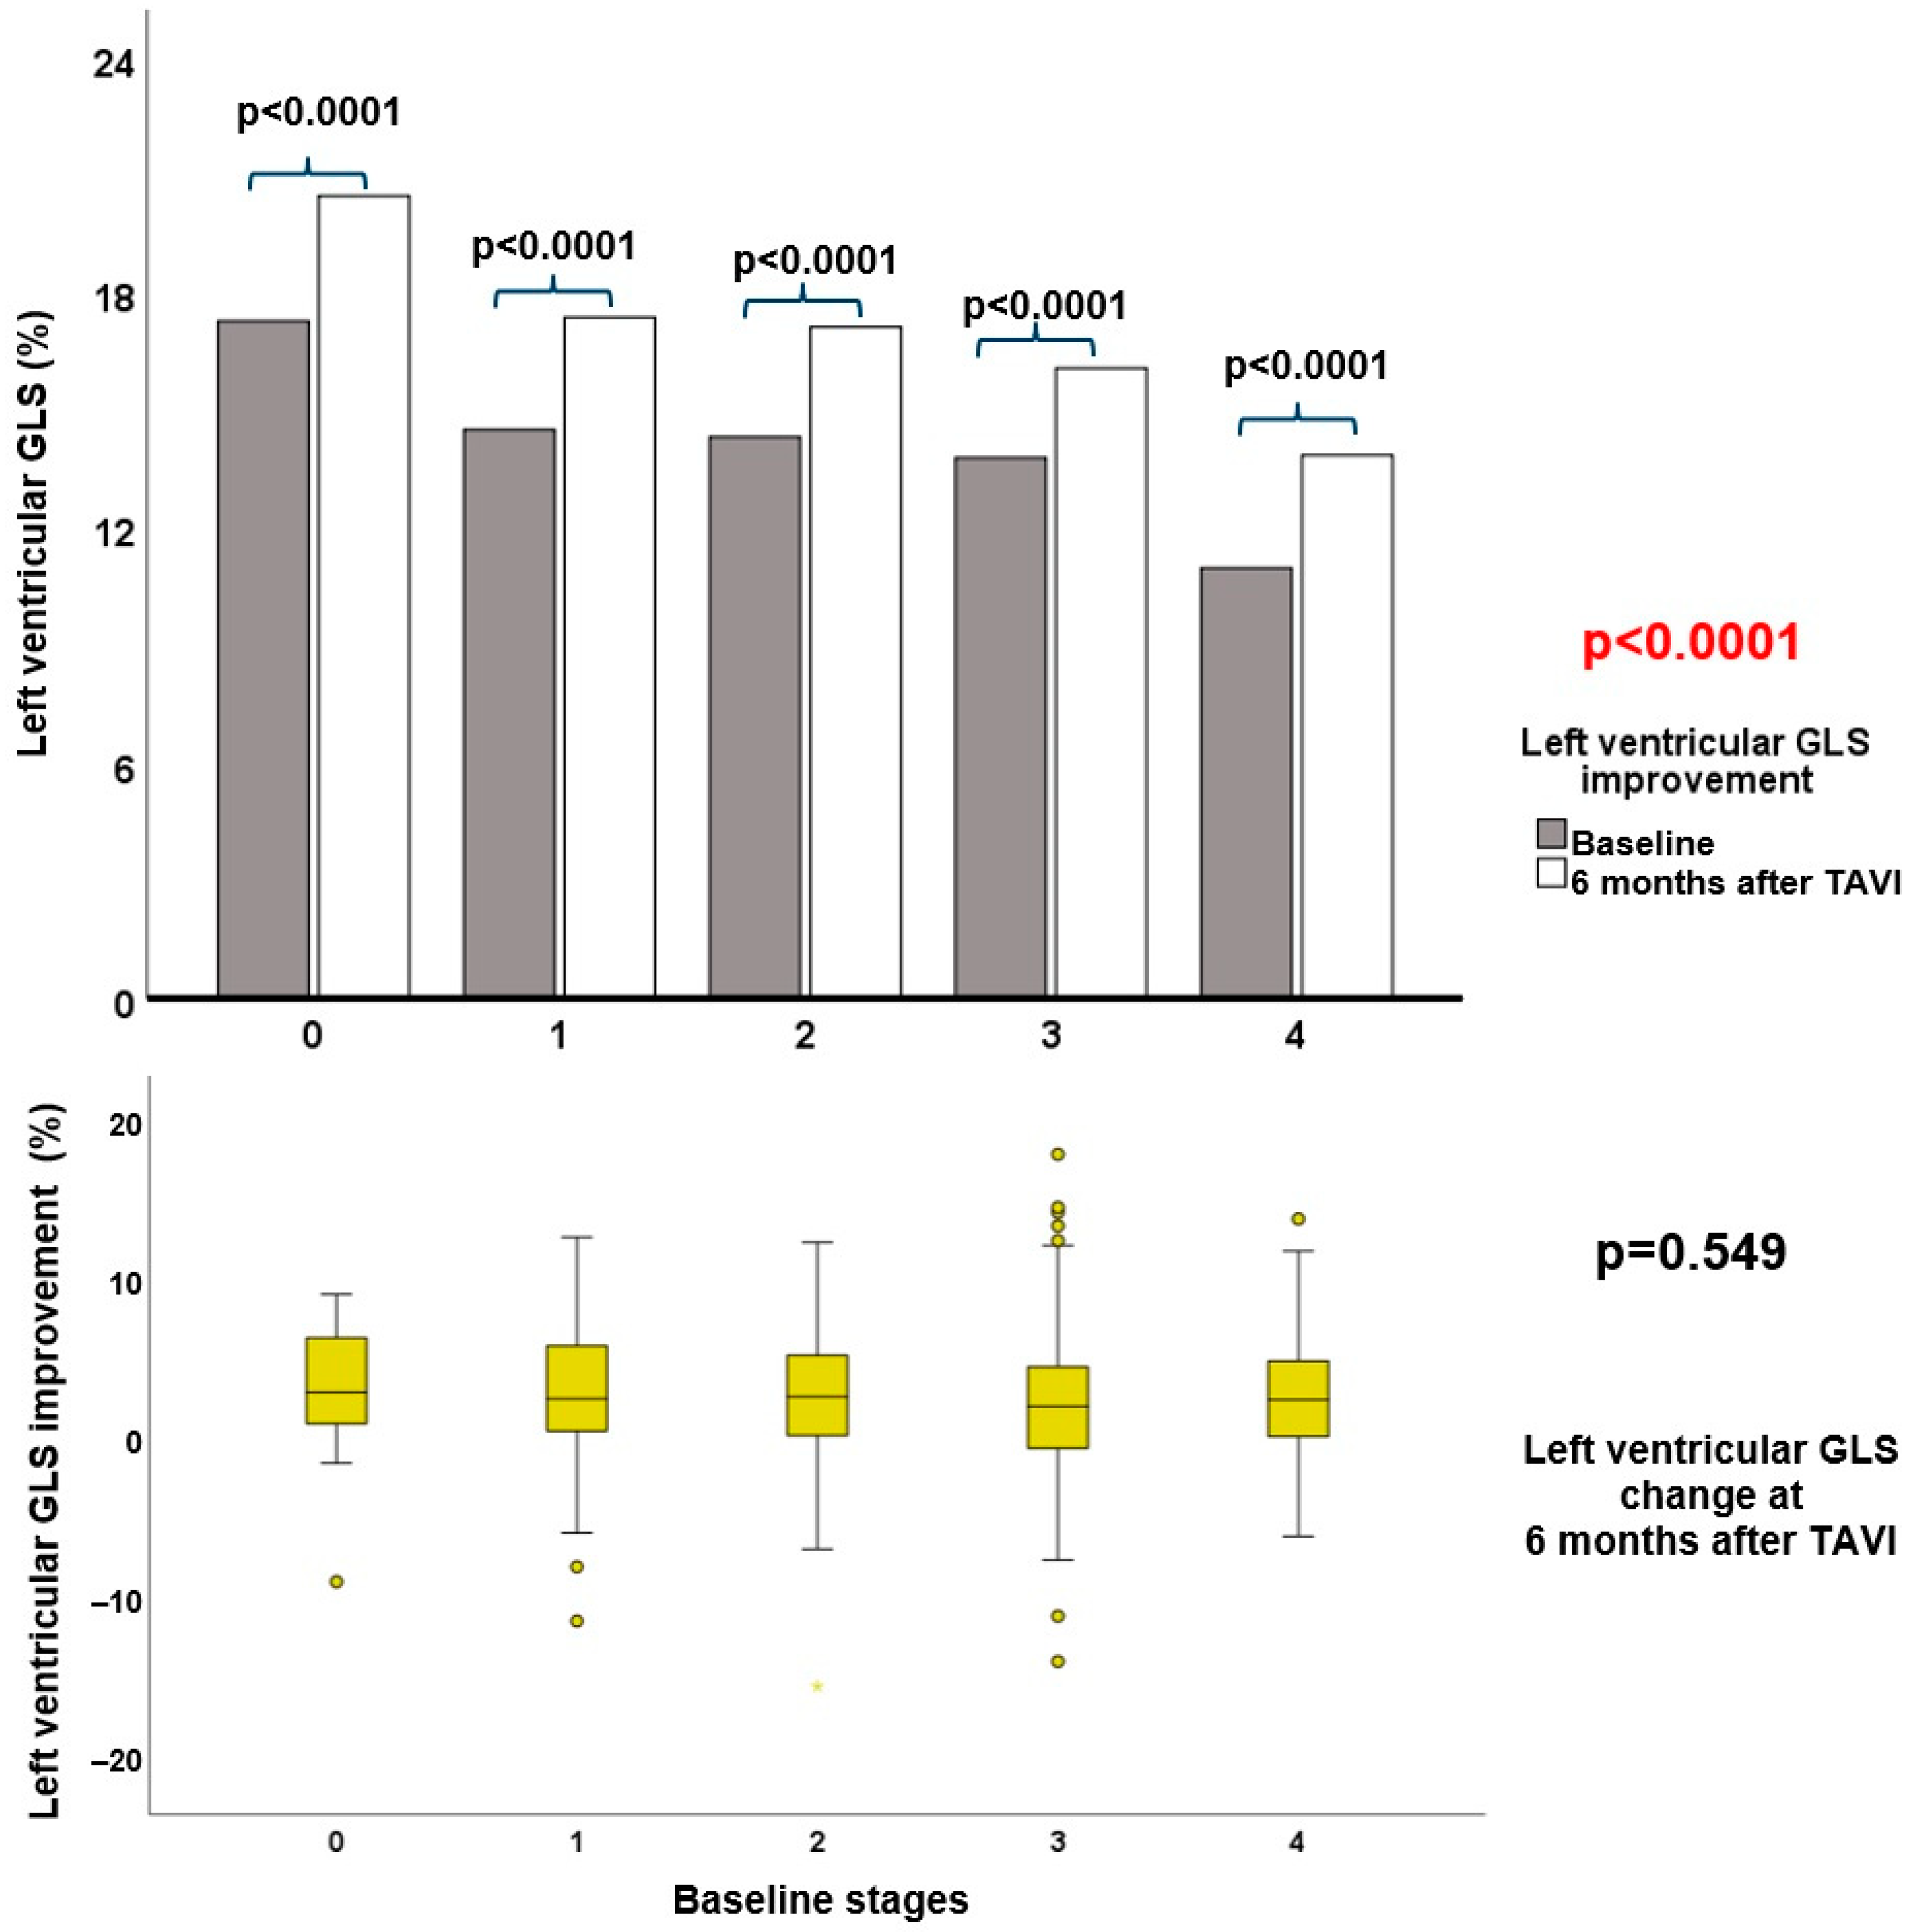
3.2. Echocardiographic Follow-up after TAVI
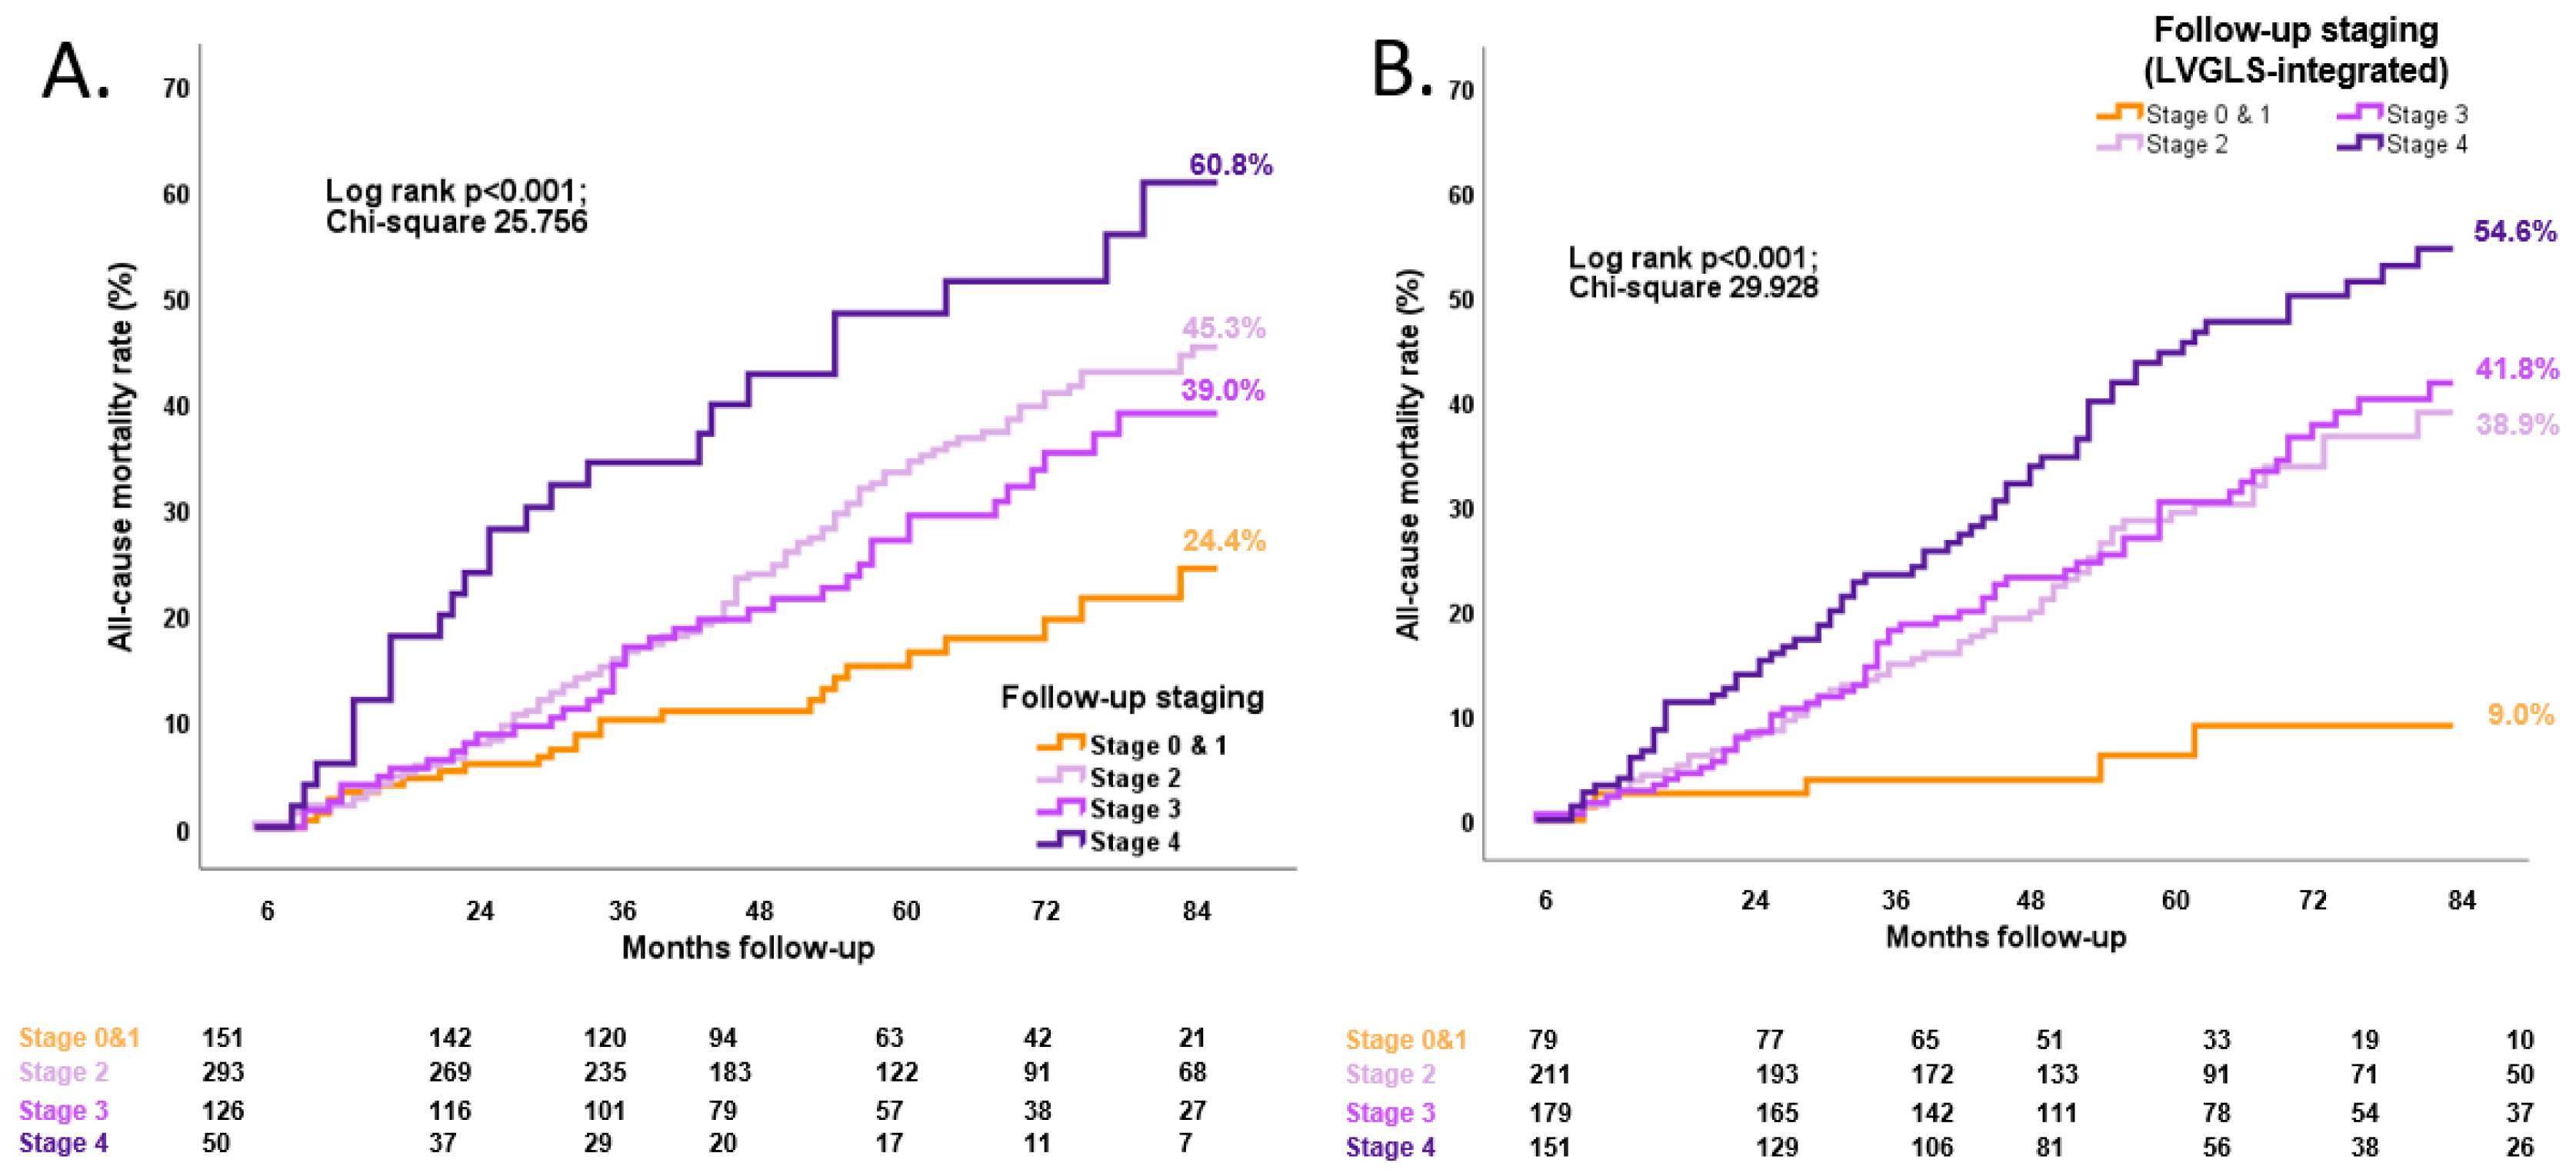
3.3. Association between Follow-up LVGLS-Integrated Cardiac Damage Staging and Long-Term All-Cause Mortality

| Univariate Analysis | Multivariate Analysis * Model 1 | Multivariate Analysis * Model 2 | ||||
|---|---|---|---|---|---|---|
| HR (95% CI) | p-Value | HR (95% CI) | p-Value | HR (95% CI) | p-Value | |
| Age, years | 0.987 (0.969–1.006) | 0.174 | ||||
| Male gender | 1.474 (1.105–1.966) | 0.008 | 1.258 (0.896–1.765) | 0.186 | 1.276 (0.912–1.786) | 0.155 |
| Body mass index (kg/m2) | 0.998 (0.966–1.031) | 0.909 | ||||
| Coronary artery disease | 1.481 (1.101–1.991) | 0.009 | 1.078 (0.760–1.530) | 0.672 | 1.087 (0.766–1.543) | 0.640 |
| Previous myocardial infarction | 1.420 (1.036–1.946) | 0.029 | ||||
| Diuretic usage at baseline | 1.579 (1.170–2.131) | 0.003 | 1.362 (0.995–1.864) | 0.054 | 1.322 (0.965–1.812) | 0.082 |
| Atrial fibrillation | 1.277 (0.913–1.787) | 0.153 | ||||
| Previous cardiac surgery | 1.738 (1.283–2.355) | 0.001 | 1.254 (0.846–1.859) | 0.260 | 1.211 (0.818–1.791) | 0.339 |
| Diabetes mellitus | 1.248 (0.921–1.692) | 0.153 | ||||
| Hypertension | 0.985 (0.714–1.358) | 0.925 | ||||
| Peripheral artery disease | 1.679 (1.258–2.241) | <0.001 | 1.358 (0.989–1.865) | 0.058 | 1.365 (0.994–1.874) | 0.054 |
| Smoking | 1.390 (1.004–1.926) | 0.048 | 1.329 (0.941–1.877) | 0.106 | 1.361 (0.963–1.923) | 0.081 |
| Chronic obstructive pulmonary disease | 1.306 (0.927–1.840) | 0.126 | ||||
| NYHA III–IV | 1.137 (0.849–1.522) | 0.389 | ||||
| AV area, indexed | 0.879 (0.366–2.113) | 0.773 | ||||
| AV mean gradient, mmHg | 0.991 (0.982–0.999) | 0.036 | 1.002 (0.992–1.011) | 0.760 | 1.002 (0.992–1.012) | 0.701 |
| EuroSCORE II | 1.060 (1.032–1.088) | <0.0001 | - | - | - | - |
| Hemoglobin (g/dL) | 0.895 (0.828–0.968) | 0.005 | 0.857 (0.784–0.936) | <0.001 | 0.857 (0.785–0.934) | <0.001 |
| Creatinine (mg/dL) | 1.219 (1.088–1.366) | <0.001 | 1.165 (1.024–1.326) | 0.021 | 1.164 (1.025–1.322) | 0.020 |
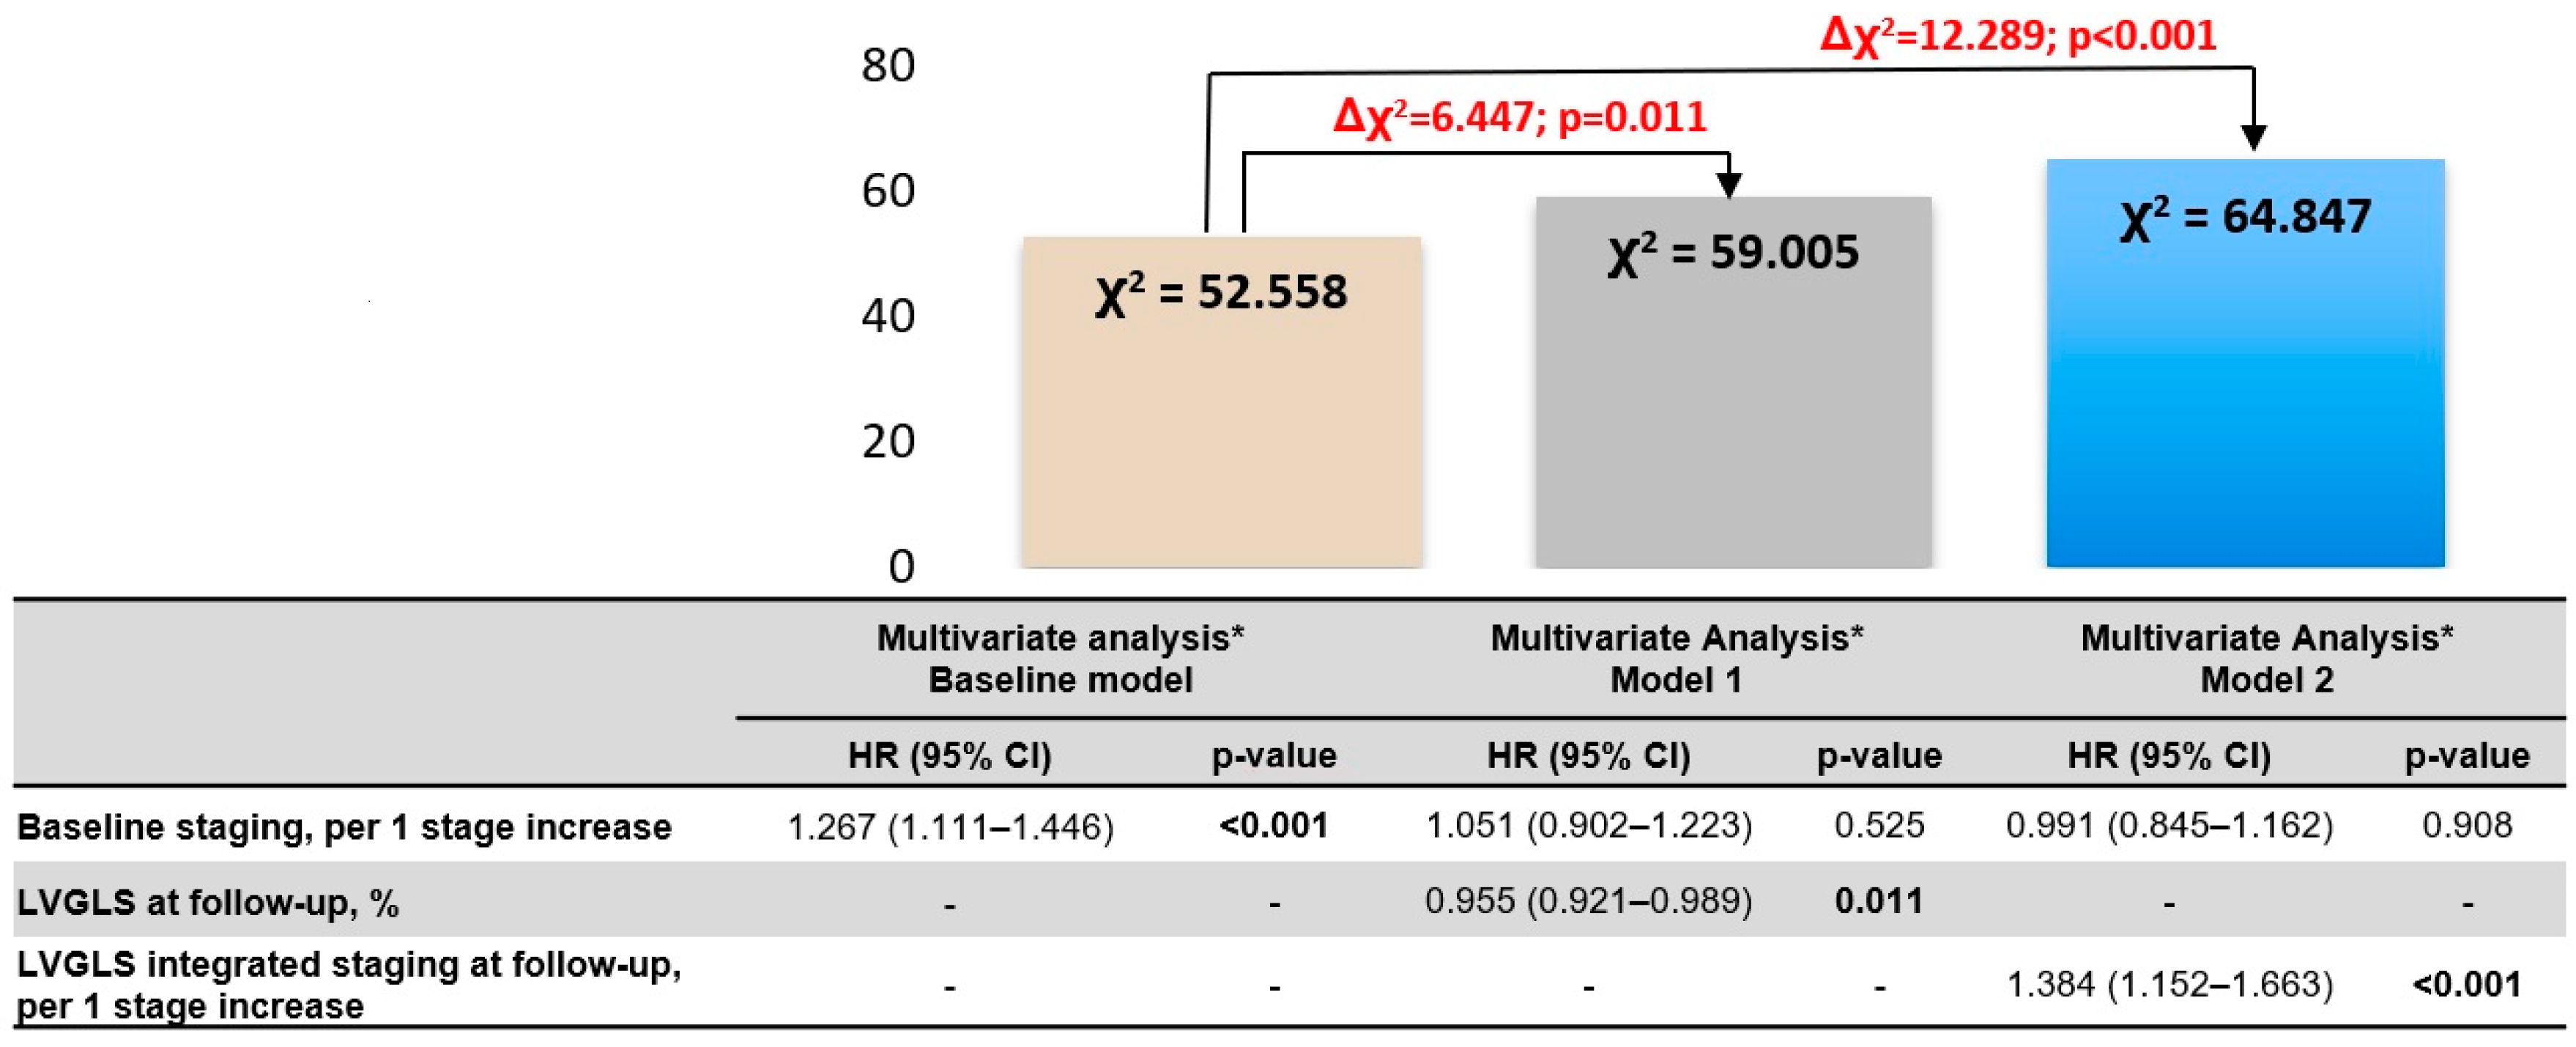
| Baseline staging, per 1 stage increase | 1.147 (1.002–1.312) | 0.047 | 1.051 (0.902–1.223) | 0.525 | 0.991 (0.845–1.162) | 0.908 |
| Baseline LVGLS (%) | 0.973 (0.942–1.006) | 0.105 | ||||
| LVGLS at follow-up | 0.940 (0.913–0.968) | <0.001 | 0.955 (0.921–0.989) | 0.011 | - | - |
| Follow-up LVGLS-integrated staging, per 1 stage increase | 1.355 (1.161–1.582) | <0.001 | - | - | 1.384 (1.152–1.663) | <0.001 |
4. Discussion
4.1. The Improvement of Cardiac Damage and LVGLS after TAVI
4.2. The Prognostic Value of Follow-Up Cardiac Damage Staging and LVGLS
4.3. Limitations
5. Conclusions
Supplementary Materials
Author Contributions
Funding
Institutional Review Board Statement
Informed Consent Statement
Data Availability Statement
Conflicts of Interest
References
- Iung, B.; Delgado, V.; Rosenhek, R.; Price, S.; Prendergast, B.; Wendler, O.; De Bonis, M.; Tribouilloy, C.; Evangelista, A.; Bogachev-Prokophiev, A.; et al. Contemporary Presentation and Management of Valvular Heart Disease. Circulation 2019, 140, 1156–1169. [Google Scholar] [CrossRef]
- Pellikka, P.A.; Sarano, M.E.; Nishimura, R.A.; Malouf, J.F.; Bailey, K.R.; Scott, C.G.; Barnes, M.E.; Tajik, A.J. Outcome of 622 adults with asymptomatic, hemodynamically significant aortic stenosis during prolonged follow-up. Circulation 2005, 111, 3290–3295. [Google Scholar] [CrossRef]
- Rosenhek, R.; Zilberszac, R.; Schemper, M.; Czerny, M.; Mundigler, G.; Graf, S.; Bergler-Klein, J.; Grimm, M.; Gabriel, H.; Maurer, G. Natural History of Very Severe Aortic Stenosis. Circulation 2010, 121, 151–156. [Google Scholar] [CrossRef]
- Otto, C.M.; Prendergast, B. Aortic-valve stenosis—From patients at risk to severe valve obstruction. N. Engl. J. Med. 2014, 371, 744–756. [Google Scholar] [CrossRef]
- Dahl, J.S.; Magne, J.; Pellikka, P.A.; Donal, E.; Marwick, T.H. Assessment of Subclinical Left Ventricular Dysfunction in Aortic Stenosis. JACC Cardiovasc. Imaging 2019, 12, 163–171. [Google Scholar] [CrossRef]
- Krayenbuehl, H.P.; Hess, O.M.; Ritter, M.; Monrad, E.S.; Hoppeler, H. Left Ventricular Systolic Function in Aortic Stenosis. Eur. Heart J. 1988, 9 (Suppl. E), 19–23. [Google Scholar] [CrossRef]
- Ito, S.; Miranda, W.R.; Nkomo, V.T.; Connolly, H.M.; Pislaru, S.V.; Greason, K.L.; Pellikka, P.A.; Lewis, B.R.; Oh, J.K. Reduced Left Ventricular Ejection Fraction in Patients with Aortic Stenosis. J. Am. Coll. Cardiol. 2018, 71, 1313–1321. [Google Scholar] [CrossRef]
- Généreux, P.; Pibarot, P.; Redfors, B.; Mack, M.J.; Makkar, R.R.; Jaber, W.A.; Svensson, L.G.; Kapadia, S.; Tuzcu, E.M.; Thourani, V.H.; et al. Staging Classification of Aortic Stenosis Based on the Extent of Cardiac Damage. Eur. Heart J. 2017, 38, 3351–3358. [Google Scholar] [CrossRef]
- Généreux, P.; Pibarot, P.; Redfors, B.; Bax, J.J.; Zhao, Y.; Makkar, R.R.; Kapadia, S.; Thourani, V.H.; Mack, M.J.; Nazif, T.M.; et al. Evolution and Prognostic Impact of Cardiac Damage after Aortic Valve Replacement. J. Am. Coll. Cardiol. 2022, 80, 783–800. [Google Scholar] [CrossRef]
- Meredith, T.; Roy, D.; Hayward, C.; Feneley, M.; Kovacic, J.; Muller, D.; Namasivayam, M. Strain Assessment in Aortic Stenosis: Pathophysiology and Clinical Utility. J. Am. Soc. Echocardiogr. Off. Publ. Am. Soc. Echocardiogr. 2024, 37, 64–76. [Google Scholar] [CrossRef]
- Vollema, E.M.; Amanullah, M.; Prihadi, E.A.; Ng, A.C.T.; van der Bijl, P.; Sin, Y.K.; Ajmone Marsan, N.; Ding, Z.P.; Généreux, P.; Leon, M.B.; et al. Incremental Value of Left Ventricular Global Longitudinal Strain in a Newly Proposed Staging Classification Based on Cardiac Damage in Patients with Severe Aortic Stenosis. Eur. J. Echocardiogr. 2020, 21, 1248–1258. [Google Scholar] [CrossRef]
- Perry, A.S.; Stein, E.J.; Biersmith, M.; Fearon, W.F.; Elmariah, S.; Kim, J.B.; Clark, D.E.; Patel, J.N.; Gonzales, H.; Baker, M.; et al. Global Longitudinal Strain and Biomarkers of Cardiac Damage and Stress as Predictors of Outcomes after Transcatheter Aortic Valve Implantation. J. Am. Heart Assoc. 2022, 11, e026529. [Google Scholar] [CrossRef]
- Schueler, R.; Sinning, J.-M.; Momcilovic, D.; Weber, M.; Ghanem, A.; Werner, N.; Nickenig, G.; Grube, E.; Hammerstingl, C. Three-Dimensional Speckle-Tracking Analysis of Left Ventricular Function after Transcatheter Aortic Valve Implantation. J. Am. Soc. Echocardiogr. Off. Publ. Am. Soc. Echocardiogr. 2012, 25, 827–834.e1. [Google Scholar] [CrossRef]
- Poulin, F.; Carasso, S.; Horlick, E.M.; Rakowski, H.; Lim, K.-D.; Finn, H.; Feindel, C.M.; Greutmann, M.; Osten, M.D.; Cusimano, R.J.; et al. Recovery of Left Ventricular Mechanics after Transcatheter Aortic Valve Implantation: Effects of Baseline Ventricular Function and Postprocedural Aortic Regurgitation. J. Am. Soc. Echocardiogr. 2014, 27, 1133–1142. [Google Scholar] [CrossRef]
- Løgstrup, B.B.; Andersen, H.R.; Thuesen, L.; Christiansen, E.H.; Terp, K.; Klaaborg, K.E.; Poulsen, S.H. Left ventricular global systolic longitudinal deformation and prognosis 1 year after femoral and apical transcatheter aortic valve implantation. J. Am. Soc. Echocardiogr. Off. Publ. Am. Soc. Echocardiogr. 2013, 26, 246–254. [Google Scholar] [CrossRef]
- Vahanian, A.; Beyersdorf, F.; Praz, F.; Milojevic, M.; Baldus, S.; Bauersachs, J.; Capodanno, D.; Conradi, L.; De Bonis, M.; De Paulis, R.; et al. 2021 ESC/EACTS Guidelines for the Management of Valvular Heart Disease. Eur. Heart J. 2021, 43, 561–632. [Google Scholar] [CrossRef]
- Lang, R.M.; Badano, L.P.; Mor-Avi, V.; Afilalo, J.; Armstrong, A.; Ernande, L.; Flachskampf, F.A.; Foster, E.; Goldstein, S.A.; Kuznetsova, T.; et al. Recommendations for Cardiac Chamber Quantification by Echocardiography in Adults: An Update from the American Society of Echocardiography and the European Association of Cardiovascular Imaging. Eur. Heart J. Cardiovasc. Imaging 2015, 16, 233–271. [Google Scholar] [CrossRef]
- Nagueh, S.F.; Smiseth, O.A.; Appleton, C.P.; Byrd, B.F.; Dokainish, H.; Edvardsen, T.; Flachskampf, F.A.; Gillebert, T.C.; Klein, A.L.; Lancellotti, P.; et al. Recommendations for the Evaluation of Left Ventricular Diastolic Function by Echocardiography: An Update from the American Society of Echocardiography and the European Association of Cardiovascular Imaging. Eur. Heart J. Cardiovasc. Imaging 2016, 17, 1321–1360. [Google Scholar] [CrossRef]
- Lancellotti, P.; Pibarot, P.; Chambers, J.; La Canna, G.; Pepi, M.; Dulgheru, R.; Dweck, M.; Delgado, V.; Garbi, M.; Vannan, M.A.; et al. Multi-Modality Imaging Assessment of Native Valvular Regurgitation: An EACVI and ESC Council of Valvular Heart Disease Position Paper. Eur. Heart J. Cardiovasc. Imaging 2022, 23, e171–e232. [Google Scholar] [CrossRef]
- Rudski, L.G.; Lai, W.W.; Afilalo, J.; Hua, L.; Handschumacher, M.D.; Chandrasekaran, K.; Solomon, S.D.; Louie, E.K.; Schiller, N.B. Guidelines for the Echocardiographic Assessment of the Right Heart in Adults: A Report from the American Society of Echocardiography. J. Am. Soc. Echocardiogr. 2010, 23, 685–713. [Google Scholar] [CrossRef]
- Morgan, C.J. Landmark Analysis: A Primer. J. Nucl. Cardiol. 2019, 26, 391–393. [Google Scholar] [CrossRef]
- Orsinelli, D.A.; Aurigemma, G.P.; Battista, S.; Krendel, S.; Gaasch, W.H. Left ventricular hypertrophy and mortality after aortic valve replacement for aortic stenosis. A high-risk subgroup identified by preoperative relative wall thickness. J. Am. Coll. Cardiol. 1993, 22, 1679–1683. [Google Scholar] [CrossRef]
- Capoulade, R.; Clavel, M.A.; Le Ven, F.; Dahou, A.; Thébault, C.; Tastet, L.; Shen, M.; Arsenault, M.; Bédard, É.; Beaudoin, J.; et al. Impact of left ventricular remodeling patterns on outcomes in patients with aortic stenosis. Eur. Heart J. Cardiovasc. Imaging 2017, 18, 1378–1387. [Google Scholar] [CrossRef]
- Fortuni, F.; Butcher, S.C.; van der Kley, F.; Lustosa, R.P.; Karalis, I.; de Weger, A.; Priori, S.G.; van der Bijl, P.; Bax, J.J.; Delgado, V.; et al. Left Ventricular Myocardial Work in Patients with Severe Aortic Stenosis. J. Am. Soc. Echocardiogr. 2021, 34, 257–266. [Google Scholar] [CrossRef]
- Weidemann, F.; Herrmann, S.; Störk, S.; Niemann, M.; Frantz, S.; Lange, V.; Beer, M.; Gattenlöhner, S.; Voelker, W.; Ertl, G.; et al. Impact of Myocardial Fibrosis in Patients with Symptomatic Severe Aortic Stenosis. Circulation 2009, 120, 577–584. [Google Scholar] [CrossRef]
- Slimani, A.; Melchior, J.; de Meester, C.; Pierard, S.; Roy, C.; Amzulescu, M.; Bouzin, C.; Maes, F.; Pasquet, A.; Pouleur, A.C.; et al. Relative Contribution of Afterload and Interstitial Fibrosis to Myocardial Function in Severe Aortic Stenosis. JACC Cardiovasc. Imaging 2020, 13 Pt 2, 589–600. [Google Scholar] [CrossRef]
- Otto, C.M.; Nishimura, R.A.; Bonow, R.O.; Carabello, B.A.; Erwin, J.P.; Gentile, F.; Jneid, H.; Krieger, E.V.; Mack, M.; McLeod, C.; et al. 2020 ACC/AHA Guideline for the Management of Patients with Valvular Heart Disease: Executive Summary: A Report of the American College of Cardiology/American Heart Association Joint Committee on Clinical Practice Guidelines. Circulation 2021, 143, 5. [Google Scholar] [CrossRef]
- Lindman, B.R.; Dweck, M.R.; Lancellotti, P.; Généreux, P.; Piérard, L.A.; O’Gara, P.T.; Bonow, R.O. Management of Asymptomatic Severe Aortic Stenosis: Evolving Concepts in Timing of Valve Replacement. JACC Cardiovasc. Imaging 2020, 13 Pt 1, 481–493. [Google Scholar] [CrossRef]
- Spath, N.B.; Gomez, M.; Everett, R.J.; Semple, S.; Chin, C.W.L.; White, A.C.; Japp, A.G.; Newby, D.E.; Dweck, M.R. Global Longitudinal Strain Analysis Using Cardiac MRI in Aortic Stenosis: Comparison with Left Ventricular Remodeling, Myocardial Fibrosis, and 2-year Clinical Outcomes. Radiol. Cardiothorac. Imaging 2019, 1, e190027. [Google Scholar] [CrossRef]
- Fortuni, F.; Bax, J.J.; Delgado, V. Changing the Paradigm in the Management of Valvular Heart Disease. Circulation 2021, 143, 209–211. [Google Scholar] [CrossRef]
- Sato, K.; Kumar, A.; Jones, B.; Mick, S.; Krishnaswamy, A.; Grimm, R.A.; Desai, M.Y.; Griffin, B.P.; Leonardo Rodriguez, L.; Kapadia, S.; et al. Reversibility of Cardiac Function Predicts Outcome after Transcatheter Aortic Valve Replacement in Patients with Severe Aortic Stenosis. J. Am. Heart Assoc. 2017, 6, e005798. [Google Scholar] [CrossRef] [PubMed]
- Généreux, P. Staging the Extent of Cardiac Damage among Patients with Valve Disease: Growth of Evidence Continues. JACC Cardiovasc. Interv. 2023, 16, 152–155. [Google Scholar] [CrossRef] [PubMed]
- Ye, Z.; Yang, L.T.; Medina-Inojosa, J.R.; Scott, C.G.; Padang, R.; Luis, S.A.; Nkomo, V.T.; Enriquez-Sarano, M.; Michelena, H.I. Multichamber Strain Characterization Is a Robust Prognosticator for Both Bicuspid and Tricuspid Aortic Stenosis. J. Am. Soc. Echocardiogr. Off. Publ. Am. Soc. Echocardiogr. 2022, 35, 956–965. [Google Scholar] [CrossRef]
- Negishi, T.; Negishi, K.; Thavendiranathan, P.; Cho, G.-Y.; Popescu, B.A.; Vinereanu, D.; Kurosawa, K.; Penicka, M.; Marwick, T.H.; Aakhus, S.; et al. Effect of Experience and Training on the Concordance and Precision of Strain Measurements. JACC Cardiovasc. Imaging 2017, 10, 518–522. [Google Scholar] [CrossRef]
| Total Population (n = 686) | Baseline | p-Value | |||||
|---|---|---|---|---|---|---|---|
| Stage 0 (n = 29) | Stage 1 (n = 73) | Stage 2 (n = 204) | Stage 3 (n = 217) | Stage 4 (n = 163) | |||
| Age (years) | 79.9 ± 7.3 | 78.8 ± 7.7 | 78.4 ± 8.5 | 80.3 ± 5.6 | 80.9 ± 7.2 | 79.1 ± 8.6 | 0.035 |
| Male gender, n (%) | 375 (55) | 16 (55) | 47 (64) | 111 (54) | 103 (48) | 98 (60) | 0.054 |
| Body mass index (kg/m2) | 26.5 ± 4.4 | 26.2 ± 3.9 | 26.9 ± 5.9 | 27.3 ± 4.3 | 25.7 ± 4.3 § | 26.3 ± 3.7 | 0.007 |
| Body surface area (m2) | 1.9 ± 0.2 | 1.9 ± 0.2 | 1.9 ± 0.2 | 1.9 ± 0.2 | 1.8 ± 0.2 § | 1.9 ± 0.2 | 0.050 |
| Hypertension, n (%) | 514 (76) | 19 (68) | 58 (80) | 155 (78) | 161 (76) | 121 (75) | 0.725 |
| Diabetes mellitus, n (%) | 196 (29) | 6 (21) | 23 (32) | 68 (34) | 47 (22) | 52 (32) | 0.057 |
| Atrial fibrillation, n (%) | 129 (19) | 1 (3) | 3 (4) | 24 (12) | 42 (19) | 59 (36) | <0.0001 |
| Pacemaker, n (%) | 85 (12) | 2 (7) | 5 (7) | 19 (9) | 31 (14) | 28 (17) | 0.065 |
| Hyperlipidemia, n (%) | 436 (65) | 18 (64) | 40 (55) | 129 (65) | 143 (67) | 106 (65) | 0.446 |
| Coronary artery disease, n (%) | 406 (60) | 14 (50) | 42 (58) | 115 (57) | 122 (57) | 113 (69) | 0.066 |
| Previous cardiac surgery, n (%) | 135 (20) | 3 (10) | 9 (12) | 35 (17) | 29 (13) | 59 (36) | <0.0001 |
| Previous myocardial infarction, n (%) | 153 (23) | 4 (14) | 18 (25) | 36 (18) | 46 (21) | 49 (30) | 0.056 |
| Smoking, n (%) | 139 (21) | 5 (17) | 22 (30) | 44 (23) | 32 (15) | 36 (23) | 0.078 |
| Chronic obstructive pulmonary disease, n (%) | 141 (22) | 9 (31) | 19 (26) | 45 (23) | 31 (15) | 37 (24) | 0.104 |
| Peripheral artery disease, n (%) | 192 (28) | 9 (32) | 23 (32) | 56 (28) | 51 (24) | 53 (33) | 0.390 |
| EuroSCORE II (%) | 3.2 (2.0–5.4) | 2.0 (1.6–3.5) | 2.7 (1.7–4.4) | 3.0 (1.9–4.7) | 3.0 (2.1–4.6) | 4.7 (2.8–8.5) †‡§‖ | <0.0001 |
| NYHA class III or IV, n (%) | 389 (58) | 13 (48) | 38 (54) | 106 (54) | 128 (60) | 104 (65) | 0.129 |
| Hemoglobin (g/dL) | 12.5 ± 1.7 | 13.0 ± 1.6 | 12.7 ± 1.6 | 12.4 ± 1.9 | 12.4 ± 1.7 | 12.7 ± 1.6 | 0.118 |
| Creatinine (mg/dL) | 1.2 ± 0.8 | 1.1 ± 0.3 | 1.3 ± 1.4 | 1.2 ± 0.5 | 1.1 ± 0.9 | 1.3 ± 0.7 | 0.141 |
| Medication Beta-blocker, n (%) | 406 (61) | 16 (57) | 43 (59) | 112 (56) | 125 (60) | 110 (69) | 0.175 |
| ACEi/ARB, n (%) | 369 (55) | 17 (61) | 37 (51) | 112 (56) | 108 (51) | 95 (59) | 0.498 |
| Calcium antagonist, n (%) | 175 (26) | 5 (18) | 18 (25) | 56 (28) | 45 (21) | 51 (32) | 0.157 |
| Diuretics, n (%) | 378 (56) | 13 (46.4) | 31 (43) | 103 (52) | 123 (59) | 108 (68) | 0.002 |
| Aspirin, n (%) | 311 (47) | 18 (67) | 40 (56) | 104 (53) | 91 (44) | 58 (37) | 0.002 |
| OAC/NOAC, n (%) | 258 (39) | 3 (11) | 19 (27) | 51 (26) | 92 (44) | 93 (59) | <0.0001 |
| Statin, n (%) | 441 (66) | 20 (71) | 43 (59) | 138 (69) | 135 (64) | 105 (66) | 0.514 |
| Total Population (n = 686) | Baseline | p-Value | |||||
|---|---|---|---|---|---|---|---|
| Stage 0 (n = 29) | Stage 1 (n = 73) | Stage 2 (n = 204) | Stage 3 (n = 217) | Stage 4 (n = 163) | |||
| LV end-diastolic diameter indexed (mm/m2) | 25.3 ± 4.5 | 22.2 ± 3.6 | 25.6 ± 3.9 † | 25.1 ± 4.0 † | 25.3 ± 4.5 † | 26.0 ± 5.1 † | 0.001 |
| LV end-diastolic volume (mL/m2) | 47.7 (37.6–64.0) | 37.0 (30.0–45.7) | 45.5 (35.8–56.9) | 47.8 (37.9–61.6) † | 48.7 (38.6–64.0) † | 52.2 (38.1–74.2) † | <0.0001 |
| LV mass index (g/m2) | 126.4 ± 38.4 | 84.6 ± 17.2 | 122.7 ± 35.1 † | 130.6 ± 38.6 † | 127.4 ± 39.2 † | 129.1 ± 37.0 † | <0.0001 |
| LV ejection fraction (%) | 58.0 (46.3–65.0) | 65.0 (59.5–71.0) | 59.6 (50.7–66.1) | 60.0 (52.0–66.0) † | 58.0 (47.3–65.0) † | 48.0 (36.9–60.0) †‡§‖ | <0.0001 |
| LV global longitudinal strain (%) | 13.4 ± 4.2 | 17.2 ± 3.4 | 14.5 ± 3.4 | 14.3 ± 3.7 | 13.7 ± 4.1 | 10.7 ± 4.1 | <0.0001 |
| E/e′ ratio | 16.7 (12.0–24.3) | 10.9 (8.6–12.0) | 15.8 (11.1–21.0) | 16.9 (12.5–25.3) † | 16.8 (12.5–25.0) † | 18.1 (12.9–25.7) † | <0.0001 |
| Left atrial volume index (mL/m2) | 44.6 ± 16.4 | 24.4 ± 4.4 | 27.8 ± 4.4 | 46.8 ± 11.3 †‡ | 47.7 ± 18.5 †‡ | 49.0 ± 16.4 †‡ | <0.0001 |
| Significant mitral regurgitation, n (%) | 149 (22) | - | - | 34 (17) | 65 (31) | 50 (31) | <0.0001 |
| Systolic pulmonary arterial pressure (mmHg) | 34.5 ± 15.1 | 26.8 ± 11.4 | 26.7 ± 13.5 | 29.2 ± 13.4 | 40.9 ± 13.5 †‡§ | 37.6 ± 15.9 †‡§ | <0.0001 |
| Significant tricuspid regurgitation, n (%) | 309 (45) | - | - | - | 210 (97) | 99 (61) | <0.0001 |
| Tricuspid annular plane systolic excursion (mm) | 18.8 ± 4.5 | 19.6 ± 2.5 | 20.7 ± 4.1 | 21.1 ± 3.7 | 20.1 ± 3.0 § | 13.0 ± 2.0 †‡§‖ | <0.0001 |
| Mean aortic valve gradient (mmHg) | 41.1 ± 17.3 | 45.7 ± 13.6 | 43.3 ± 18.2 | 45.3 ± 18.0 | 41.0 ± 17.0 | 34.3 ± 15.1 †‡§‖ | <0.0001 |
| Peak aortic jet velocity (m/s) | 3.9 ± 0.8 | 4.2 ± 0.6 | 4.0 ± 0.8 | 4.1 ± 0.8 | 3.9 ± 0.8 § | 3.6 ± 0.8 †‡§‖ | <0.0001 |
| Indexed aortic valve area (cm2/m2) | 0.4 ± 0.2 | 0.4 ± 0.1 | 0.5 ± 0.2 | 0.4 ± 0.2 | 0.5 ± 0.2 | 0.4 ± 0.2 | 0.520 |
| Baseline (n = 620) | Follow-Up (n = 620) | p-Value | |
|---|---|---|---|
| LV end-diastolic diameter indexed (mm/m2) | 25.2 ± 4.5 | 26.2 ± 3.9 | <0.0001 |
| LV end-diastolic volume (mL/m2) | 47.7 (37.6–64.0) | 45.9 (38.5–56.4) | <0.0001 |
| LV mass index (g/m2) | 125.1 ± 38.5 | 118.2 ± 29.9 | <0.0001 |
| LV global longitudinal strain (%) | 13.6 ± 4.2 | 16.3 ± 4.6 | <0.0001 |
| LV ejection fraction (%) | 58.0 (46.1–65.0) | 61.5 (53.3–69.3) | <0.0001 |
| E/e′ ratio | 16.7 (12.0–24.3) | 18.8 (14.2–27.0) | <0.0001 |
| Left atrial volume index (mL/m2) | 44.3 ± 16.5 | 43.4 ± 16.8 | 0.107 |
| Significant mitral regurgitation, n (%) | 126 (21) | 80 (13) | <0.0001 |
| Systolic pulmonary arterial pressure (mmHg) | 34.4 ± 14.8 | 31.0 ± 13.6 | <0.0001 |
| Significant tricuspid regurgitation, n (%) | 274 (44) | 140 (23) | <0.0001 |
| Tricuspid annular plane systolic excursion (mm) | 19.0 ± 4.5 | 20.0 ± 3.1 | <0.0001 |
| Mean aortic valve gradient (mmHg) | 41.8 ± 17.2 | 9.8 ± 4.2 | <0.0001 |
| Peak aortic jet velocity (m/s) | 4.0 ± 0.8 | 2.1 ± 0.4 | <0.0001 |
Disclaimer/Publisher’s Note: The statements, opinions and data contained in all publications are solely those of the individual author(s) and contributor(s) and not of MDPI and/or the editor(s). MDPI and/or the editor(s) disclaim responsibility for any injury to people or property resulting from any ideas, methods, instructions or products referred to in the content. |
© 2024 by the authors. Licensee MDPI, Basel, Switzerland. This article is an open access article distributed under the terms and conditions of the Creative Commons Attribution (CC BY) license (https://creativecommons.org/licenses/by/4.0/).
Share and Cite
Myagmardorj, R.; Fortuni, F.; Galloo, X.; Nabeta, T.; Meucci, M.C.; Butcher, S.C.; van der Kley, F.; Bax, J.J.; Ajmone Marsan, N. Changes in Global Longitudinal Strain after TAVI: Additional Prognostic Value over Cardiac Damage in Patients with Severe Aortic Stenosis. J. Clin. Med. 2024, 13, 3945. https://doi.org/10.3390/jcm13133945
Myagmardorj R, Fortuni F, Galloo X, Nabeta T, Meucci MC, Butcher SC, van der Kley F, Bax JJ, Ajmone Marsan N. Changes in Global Longitudinal Strain after TAVI: Additional Prognostic Value over Cardiac Damage in Patients with Severe Aortic Stenosis. Journal of Clinical Medicine. 2024; 13(13):3945. https://doi.org/10.3390/jcm13133945
Chicago/Turabian StyleMyagmardorj, Rinchyenkhand, Federico Fortuni, Xavier Galloo, Takeru Nabeta, Maria Chiara Meucci, Steele C. Butcher, Frank van der Kley, Jeroen J. Bax, and Nina Ajmone Marsan. 2024. "Changes in Global Longitudinal Strain after TAVI: Additional Prognostic Value over Cardiac Damage in Patients with Severe Aortic Stenosis" Journal of Clinical Medicine 13, no. 13: 3945. https://doi.org/10.3390/jcm13133945
APA StyleMyagmardorj, R., Fortuni, F., Galloo, X., Nabeta, T., Meucci, M. C., Butcher, S. C., van der Kley, F., Bax, J. J., & Ajmone Marsan, N. (2024). Changes in Global Longitudinal Strain after TAVI: Additional Prognostic Value over Cardiac Damage in Patients with Severe Aortic Stenosis. Journal of Clinical Medicine, 13(13), 3945. https://doi.org/10.3390/jcm13133945