
Risk Factors for Progression of Cervical Congenital Scoliosis and Associated Compensatory Curve Behavior

 , , ,
, , ,
Abstract
1. Introduction
2. Materials and Methods
2.1. Study Population
2.2. Data Collection
2.3. Statistical Analysis
3. Results
4. Discussion
5. Conclusions
Author Contributions
Funding
Institutional Review Board Statement
Informed Consent Statement
Data Availability Statement
Conflicts of Interest
References
- Pahys, J.M.; Guille, J.T. What’s new in congenital scoliosis? J. Pediatr. Orthop. 2018, 38, e172–e179. [Google Scholar] [CrossRef] [PubMed]
- Guille, J.T.; Sherk, H.H. Congenital osseous anomalies of the upper and lower cervical spine in children. J. Bone Jt. Surg. Am. 2002, 84, 277–288. [Google Scholar] [CrossRef] [PubMed]
- Mackel, C.E.; Jada, A.; Samdani, A.F.; Stephen, J.H.; Bennett, J.T.; Baaj, A.A.; Hwang, S.W. A comprehensive review of the diagnosis and management of congenital scoliosis. Child’s Nerv. Syst. 2018, 34, 2155–2171. [Google Scholar] [CrossRef] [PubMed]
- McMaster, M.J.; Ohtsuka, K. The natural history of congenital scoliosis. A study of two hundred and fifty-one patients. J. Bone Jt. Surg. Am. 1982, 64, 1128–1147. [Google Scholar] [CrossRef] [PubMed]
- McMaster, M.J.; Singh, H. Natural history of congenital kyphosis and kyphoscoliosis. A study of one hundred and twelve patients. J. Bone Jt. Surg. Am. 1999, 81, 1367–1383. [Google Scholar] [CrossRef] [PubMed]
- Campbell, R.J., Jr. Spine deformities in rate congenital syndromes: Clinical issues. Spine 2009, 34, 1815–1827. [Google Scholar] [CrossRef] [PubMed]
- McKay, S.D.; Al-Omari, A.; Tomlinson, L.A.; Dormans, J.P. Review of cervical spine anomalies in genetic syndromes. Spine 2012, 37, E269–E277. [Google Scholar] [CrossRef] [PubMed]
- Loughenbury, P.R.; Gummerson, N.W.; Tsirikos, A.I. Congenital spinal deformity: Assessment, natural history and treatment. Orthop. Trauma 2017, 31, 364–369. [Google Scholar] [CrossRef]
- Mesfin, A.; Bakhsh, W.R.; Chuntarapas, T.; Riew, K.D. Cervical scoliosis: Clinical and radiographic outcomes. Glob. Spine J. 2016, 6, 7–13. [Google Scholar] [CrossRef] [PubMed]
- Samartzis, D.; Kalluri, P.; Herman, J.; Lubicky, J.P.; Shen, F.H. Cervical scoliosis in the Klippel-Feil patient. Spine 2011, 36, E1501–E1508. [Google Scholar] [CrossRef] [PubMed]
- Yu, M.; Diao, Y.; Sun, Y.; Zhang, F.; Pan, S.; Chen, X.; Zhou, F.; Zhao, Y.; Xu, N. Evaluation of a combined approach to the correction of congenital cervical or cervicothoracic scoliosis. Spine J. 2019, 19, 803–815. [Google Scholar] [CrossRef] [PubMed]
- Balioğlu, M.B.; Albayrak, A.; Atıcı, Y.; Tacal, M.T.; Kaygusuz, M.A.; Yıldırım, C.H.; Kaya, M.; Taşdemiroğlu, E.; Akbaşak, A. Scoliosis-associated cervical spine pathologies. Spine Deform. 2014, 2, 131–142. [Google Scholar] [CrossRef]
- Winter, R.B.; Moe, J.H.; Lonstein, J.E. Posterior spinal arthrodesis for congenital scoliosis. An analysis of the cases of two hundred and ninety patients, five to nineteen years old. J. Bone Jt. Surg. Am. 1984, 66, 1188–1197. [Google Scholar] [CrossRef]
- Ames, C.P.; Blondel, B.; Scheer, J.K.; Schwab, F.J.; Le Huec, J.C.; Massicotte, E.M.; Patel, A.A.; Traynelis, V.C.; Kim, H.J.; Shaffrey, C.I.; et al. Cervical radiographical alignment: Comprehensive assessment techniques and potential importance in cervical myelopathy. Spine 2013, 38, S149–S160. [Google Scholar] [CrossRef]
- Scheer, J.K.; Tang, J.A.; Smith, J.S.; Acosta, F.L.; Protopsaltis, T.S.; Blondel, B.; Bess, S.; Shaffrey, C.I.; Deviren, V.; Lafage, V.; et al. Cervical spine alignment, sagittal deformity, and clinical implications: A review. J. Neurosurg. Spine 2013, 19, 141–159. [Google Scholar] [CrossRef]
- Kim, T.H.; Lee, S.Y.; Kim, Y.C.; Park, M.S.; Kim, S.W. T1 slope as a predictor of kyphotic alignment change after laminoplasty in patients with cervical myopathy. Spine 2013, 38, E992–E997. [Google Scholar] [CrossRef] [PubMed]
- Staub, B.N.; Lafage, R.; Kim, H.J.; Shaffrey, C.I.; Mundis, G.M.; Hostin, R.; Burton, D.; Lenke, L.; Gupta, M.C.; Ames, C.; et al. Cervical mismatch: The normative value of T1 slope minus cervical lordosis and its ability to predict ideal cervical lordosis. J. Neurosurg. Spine 2018, 30, 31–37. [Google Scholar] [CrossRef]
- Celestre, P.C.; Dimar, J.R., 2nd; Glassman, S.D. Spinopelvic parameters: Lumbar lordosis, pelvic incidence, pelvic tilt, and sacral slope: What does a spine surgeon need to know to plan a lumbar deformity correction? Neurosurg. Clin. N. Am. 2018, 29, 323–329. [Google Scholar] [CrossRef]
- Chang, D.G.; Yang, J.H.; Lee, J.H.; Kim, J.H.; Suh, S.W.; Ha, K.Y.; Suk, S.I. Congenital scoliosis treated with posterior vertebral column resection in patients younger than 18 years: Longer than 10-year follow-up. J. Neurosurg. Spine 2016, 25, 225–233. [Google Scholar] [CrossRef] [PubMed]
- Hedequist, D.J. Surgical treatment of congenital scoliosis. Orthop. Clin. N. Am. 2007, 38, 497–509. [Google Scholar] [CrossRef] [PubMed]


| Total Number (%) | Number of Boys (%) | |
|---|---|---|
| Klippel–Feil syndrome | 23 (60) | 11 (48) |
| Torticollis | 8 (21) | 6 (75) |
| VACTERL syndrome | 4 (10) | 1 (25) |
| Tethered cord syndrome | 3 (7.5) | 1 (33) |
| Goldenhar syndrome | 3 (7.5) | 1 (33) |
| Sprengel’s deformity | 3 (7.5) | 0 (0) |
| Larsen syndrome | 2 (5) | 1 (50) |
| Osteogenesis imperfecta | 1 (2.5) | 1 (100) |
| Brown syndrome | 1 (2.5) | 1 (100) |
| Bruck syndrome | 1 (2.5) | 1 (100) |
| Poland’s syndrome | 1 (2.5) | 0 (0) |
| Total | 38 (100) | 22 (100) |
| At Presentation | Last Follow-Up | Interval Change | |||||||
|---|---|---|---|---|---|---|---|---|---|
| No Progression (N = 22) | Progression (N = 16) | p-Value | No Progression (N = 22) | Progression (N = 16) | p-Value | No Progression (N = 22) | Progression (N = 16) | p-Value | |
| Age (yr) | 5.8 ± 3.9 | 5.4 ± 4.5 | 0.801 | 8.8 ± 3.3 | 8.5 ± 4.4 | 0.859 | 3.2 ± 3.7 | 2.8 ± 1.8 | 0.725 |
| Weight (kg) | 18.7 ± 8.4 | 18.2 ± 11.3 | 0.893 | 25.9 ± 11.7 | 26.7 ± 13.1 | 0.829 | 7.7 ± 11.4 | 5.8 ± 6.1 | 0.558 |
| Height (cm) | 103.3 ± 16.7 | 98.5 ± 24.5 | 0.534 | 122.7 ± 19.2 | 120.9 ± 23.9 | 0.867 | 21.5 ± 30.6 | 18.7 ± 12.4 | 0.771 |
| Cervical coronal curve (°) | 18.6 ± 15.8 | 16.3 ± 18.1 | 0.682 | 22.2 ± 15.8 | 26.2 ± 18.4 | 0.520 | 5.3 ± 4.0 | 8.4 ± 7.2 | 0.151 |
| Thoracic coronal curve (°) | 30.2 ± 24.0 | 27.0 ± 18.3 | 0.743 | 54.1 ± 22.6 | 33.2 ± 20.6 | 0.063 | 12.9 ± 16.5 | 7.9 ± 9.9 | 0.436 |
| Lumbar coronal curve (°) | 27.7 ± 14.3 | 19.1 ± 9.6 | 0.225 | 39.7 ± 19.8 | 26.6 ± 8.9 | 0.158 | 11.7 ± 7.9 | 5.8 ± 15.4 | 0.502 |
| C2 CSVL (mm) | 24.4 ± 11.1 | 6.9 ± 25.2 | 0.860 | 18.2 ± 25.8 | 17.0 ± 23.4 | 0.921 | 18.4 ± 23.1 | −4.9 ± 21.8 | 0.069 |
| C7 CSVL (mm) | 25.4 ± 17.1 | 6.9 ± 36.3 | 0.200 | 20.6 ± 24.9 | 15.5 ± 32.7 | 0.739 | 18.7 ± 48.8 | −2.9 ± 13.7 | 0.224 |
| C2 SVA (mm) | 57.5 ± 41.1 | 20.8 ± 30.7 | 0.053 | 38.0 ± 10.9 | 28.0 ± 39.7 | 0.569 | −11.2 ± 64.5 | 11.5 ± 47.0 | 0.495 |
| C7 SVA (mm) | 51.3 ± 35.8 | 20.9 ± 29.7 | 0.075 | 20.2 ± 4.5 | 25.0 ± 43.4 | 0.813 | −9.6 ± 67.7 | 3.0 ± 52.6 | 0.723 |
| Thoracic kyphosis (°) | 40.0 ± 12.5 | 44.0 ± 12.4 | 0.476 | 36.0 ± 4.8 | 43.7 ± 15.0 | 0.279 | −2.0 ± 10.6 | 0.9 ± 8.7 | 0.551 |
| Lumbar lordosis (°) | 43.5 ± 13.6 | 50.4 ± 11.9 | 0.233 | 45.3 ± 12.1 | 59.3 ± 13.2 | 0.056 | 8.8 ± 13.0 | 11.7 ± 15.2 | 0.687 |
| T1 slope (°) | 23.8 ± 7.1 | 32.4 ± 14.0 | 0.041 | 25.4 ± 6.9 | 26.2 ± 8.3 | 0.784 | −1.1 ± 8.9 | −2.5 ± 13.1 | 0.741 |
| Cervical kyphosis (°) | −7.3 ± 20.1 | −10.4 ± 21.3 | 0.666 | −7.9 ± 26.0 | −9.5 ± 24.1 | 0.859 | 1.6 ± 26.1 | −3.6 ± 12.0 | 0.508 |
| T1S–cervical kyphosis (°) | 29.6 ± 24.8 | 42.8 ±30.1 | 0.164 | 33.4 ± 29.3 | 35.7 ± 27.8 | 0.819 | 0.9 ± 20.4 | 1.1 ± 18.4 | 0.978 |
| Occiput-C2 (°) | 25.5 ± 14.2 | 29.3 ± 16.4 | 0.470 | 18.8 ± 9.8 | 20.4 ± 15.0 | 0.714 | −7.4 ± 14.9 | −4.7 ± 11.7 | 0.598 |
| C2-T3 (°) | 16.2 ± 11.4 | 21.9 ± 16.7 | 0.238 | 17.1 ± 16.0 | 19.9 ± 15.9 | 0.624 | −2.9 ± 10.7 | 2.3 ± 10.2 | 0.201 |
| Variable | Presentation | Last Follow-Up | Δ | Significance |
|---|---|---|---|---|
| Age (years) | 7.0 ± 3.9 | 8.7 ± 3.9 | 1.5 ± 1.5 | 0.004 |
| Height (cm) | 108.8 ± 15.1 | 120.1 ± 17.4 | 8.9 ± 8.7 | 0.016 |
| Weight (kg) | 21.2 ± 10.1 | 24.3 ± 10.2 | 2.6 ± 3.4 | 0.021 |
| Cervical major coronal curve (°) | 16.0 ± 14.7 | 21.7 ± 16.4 | 5.7 ± 5.6 | 0.005 |
| Thoracic major coronal curve (°) | 33.7 ± 25.6 | 34.6 ± 24.4 | 2.7 ± 15.4 | 0.640 |
| Lumbar major coronal curve (°) | 14.8 ± 10.0 | 15.5 ± 9.5 | 1.4 ± 9.8 | 0.673 |
| C2-CSVL (mm) | 20.2 ± 15.8 | 14.0 ± 15.7 | −2.0 ± 23.9 | 0.817 |
| C7-CSVL (mm) | 22.9 ± 19.0 | 15.6 ± 15.1 | −3.7 ± 18.7 | 0.597 |
| C2-SVA (mm) | 34.7 ± 48.8 | 40.4 ± 47.6 | 18.1 ± 67.6 | 0.582 |
| C7-SVA (mm) | 29.5 ± 42.8 | 27.7 ± 52.6 | 15.8 ± 66.2 | 0.585 |
| Thoracic kyphosis (°) | 43.5 ± 10.6 | 38.0 ± 7.2 | 0.3 ± 7.5 | 0.924 |
| Lumbar lordosis (°) | 43.8 ± 16.6 | 48.0 ± 17.4 | 4.0 ± 3.8 | 0.040 |
| T1 slope (°) | 23.5 ± 8.5 | 23.1 ± 5.4 | 0.8 ± 7.4 | 0.714 |
| T1S-CL (°) | 29.9 ± 29.8 | 24.8 ± 34.3 | 0.6 ± 17.4 | 0.642 |
| Cervical lordosis (°) | −8.1 ± 23.5 | −1.7 ± 33.1 | 4.9 ± 28.0 | 0.540 |
| O-C2 angle (°) | 27.2 ± 15.9 | 22.1 ± 14.9 | −2.1 ± 10.4 | 0.484 |
| C2-T3 angle (°) | 14.7 ± 10.3 | 17.7 ± 16.5 | 3.3 ± 11.0 | 0.324 |
| Variable | ρ Cervical major curve | Significance | ρ Thoracic major curve | Significance |
|---|---|---|---|---|
| Age (years) | −0.021 | 0.899 | 0.031 | 0.873 |
| Height (cm) | −0.275 | 0.128 | −0.048 | 0.811 |
| Weight (kg) | −0.312 | 0.068 | −0.082 | 0.672 |
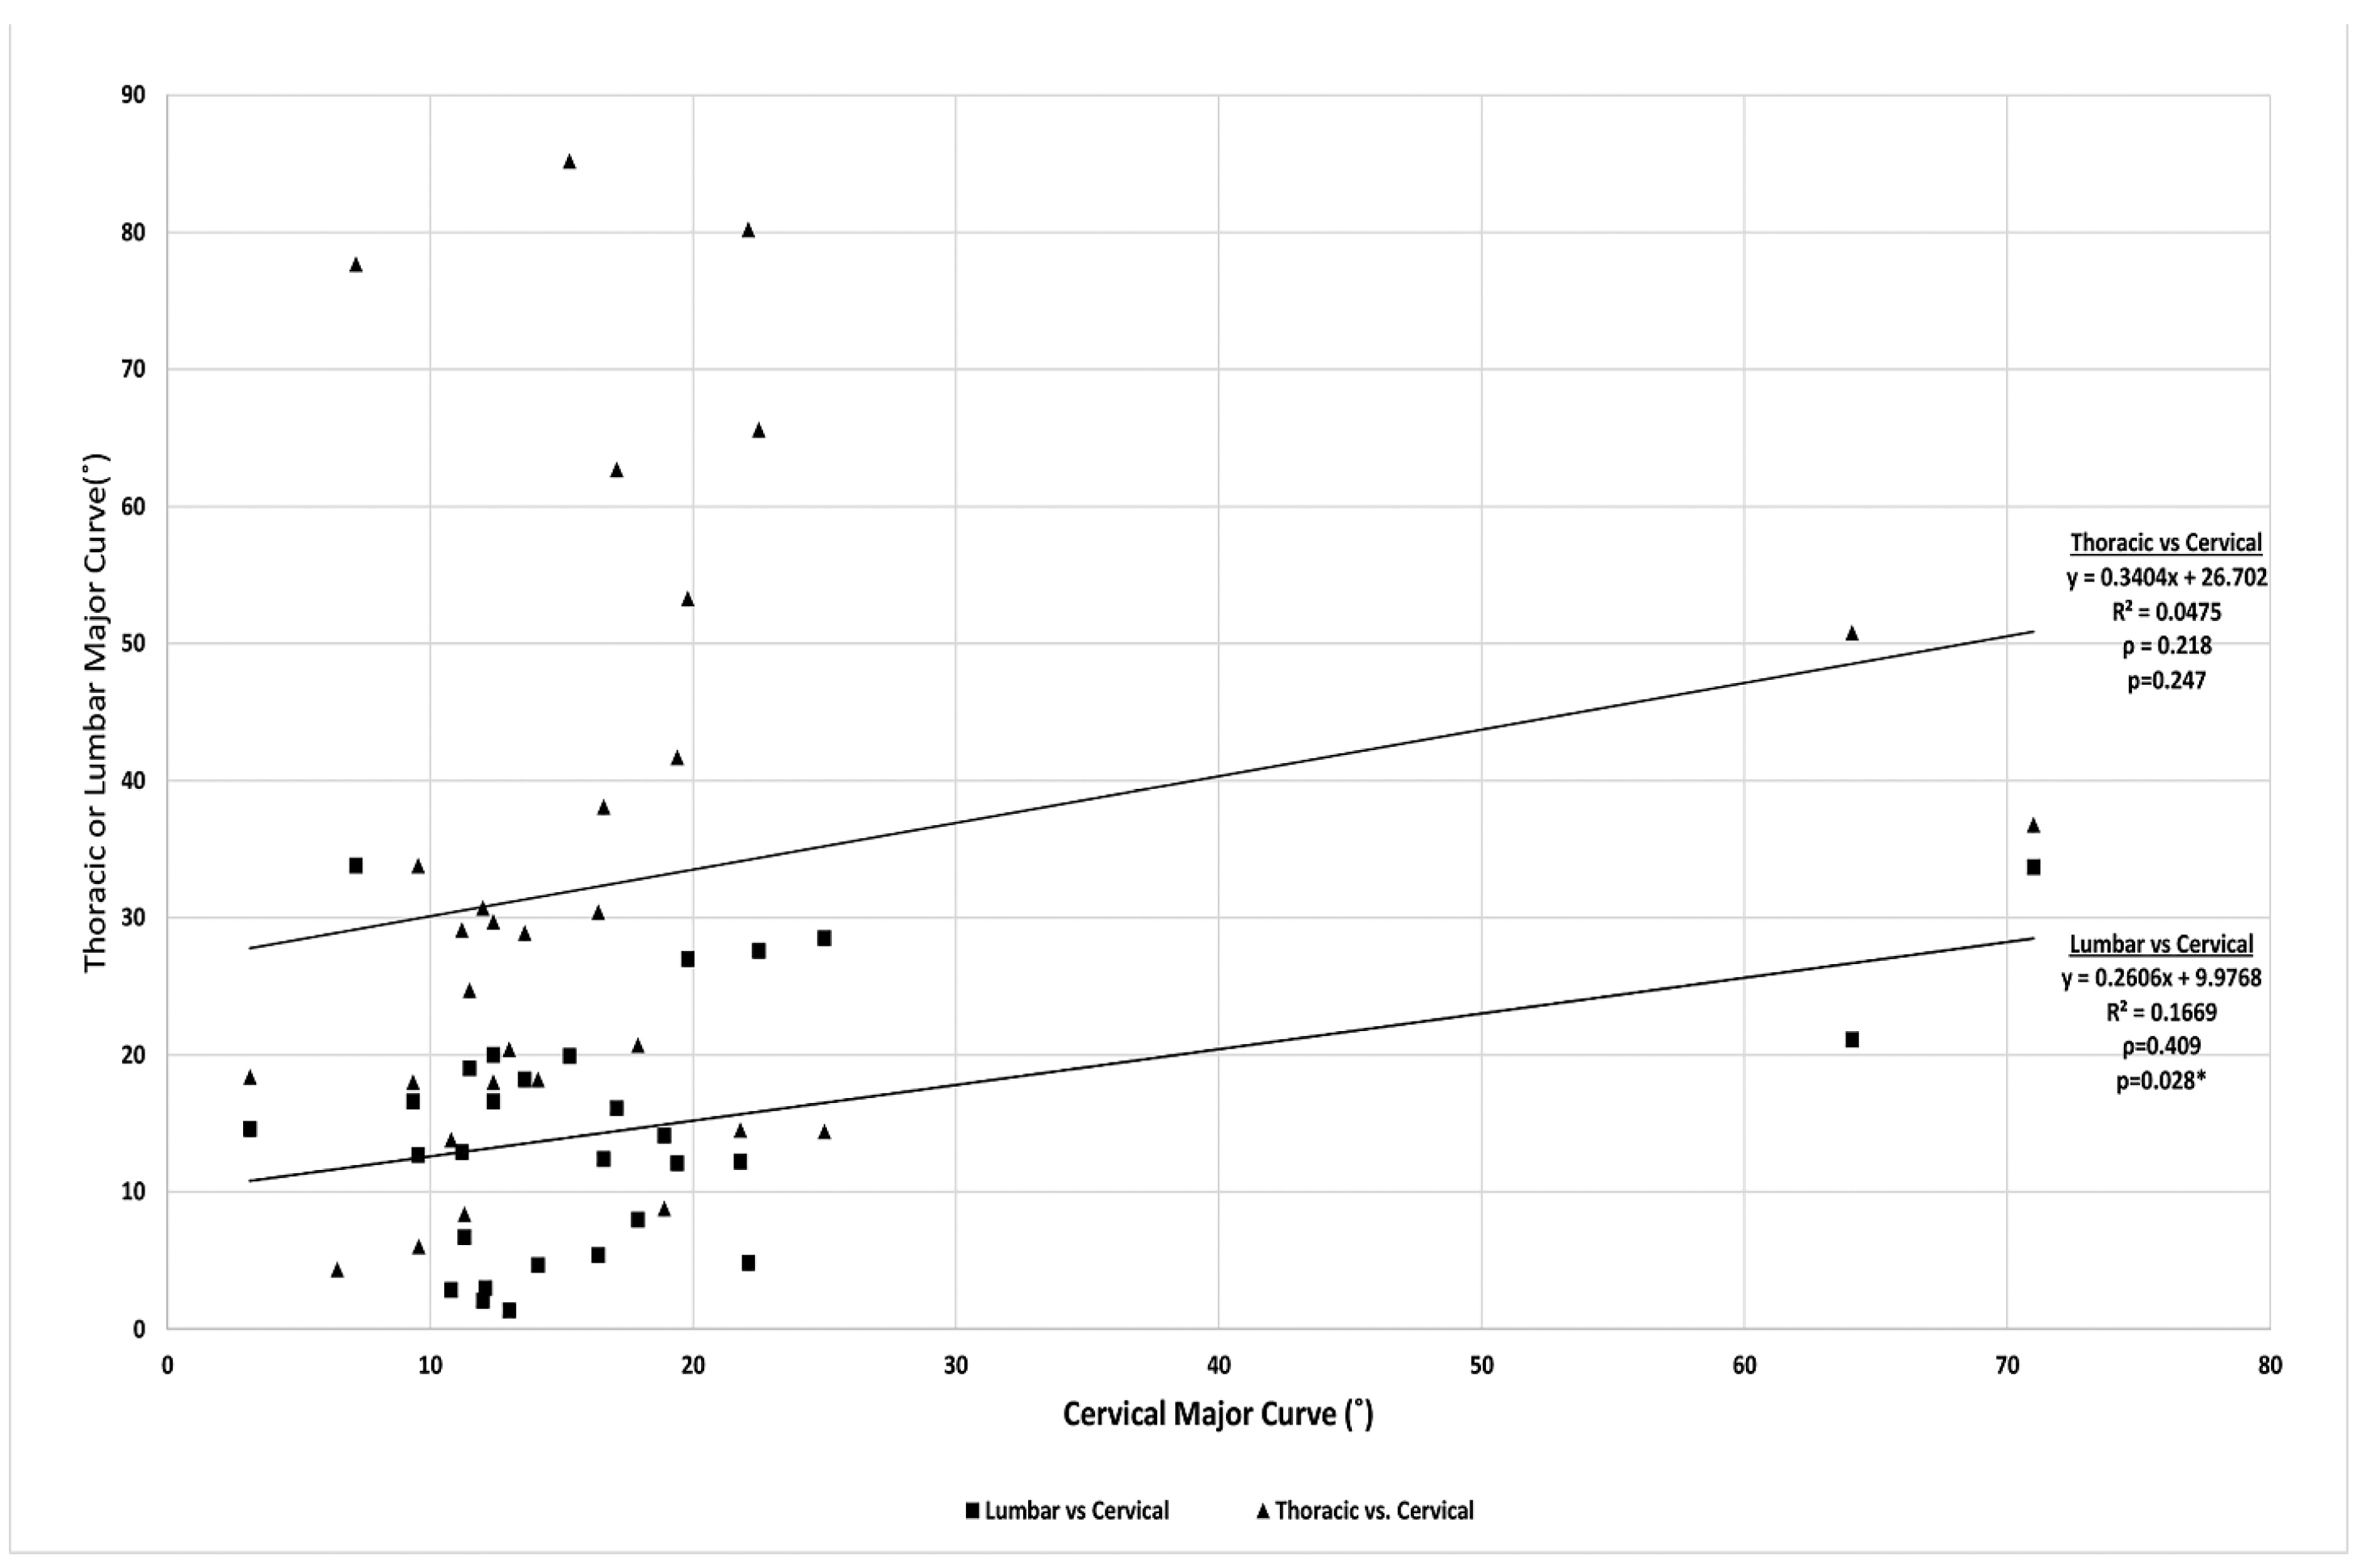
| Cervical major coronal curve (°) | 0.218 | 0.247 | ||
| Thoracic major coronal curve (°) | 0.218 | 0.247 | ||
| Lumbar major coronal curve (°) | 0.409 | 0.028 | 0.377 | 0.048 |
| C2-CSVL (mm) | 0.407 | 0.035 | −0.105 | 0.609 |
| C7-CSVL (mm) | 0.403 | 0.037 | −0.067 | 0.744 |
| C2-SVA (mm) | −0.185 | 0.398 | 0.177 | 0.432 |
| C7-SVA (mm) | −0.121 | 0.565 | −0.033 | 0.882 |
| Thoracic kyphosis (°) | 0.083 | 0.699 | −0.402 | 0.063 |
| Lumbar lordosis (°) | −0.172 | 0.411 | −0.437 | 0.037 |
| T1 slope (°) | −0.344 | 0.034 | −0.135 | 0.493 |
| T1S-CL (°) | −0.108 | 0.519 | −0.537 | 0.003 |
| Cervical lordosis (°) | 0.009 | 0.955 | 0.408 | 0.028 |
| O-C2 angle (°) | −0.002 | 0.993 | −0.128 | 0.51 |
| C2-T3 angle (°) | −0.011 | 0.95 | −0.267 | 0.177 |
Disclaimer/Publisher’s Note: The statements, opinions and data contained in all publications are solely those of the individual author(s) and contributor(s) and not of MDPI and/or the editor(s). MDPI and/or the editor(s) disclaim responsibility for any injury to people or property resulting from any ideas, methods, instructions or products referred to in the content. |
© 2024 by the authors. Licensee MDPI, Basel, Switzerland. This article is an open access article distributed under the terms and conditions of the Creative Commons Attribution (CC BY) license (https://creativecommons.org/licenses/by/4.0/).
Share and Cite
Amanullah, A.A.; Oh, T.; Toll, B.J.; Patel, A.; Samdani, A.F.; Pahys, J.M.; Kim, A.J.; Vellanki, A.; Steindler, J.; Ishmael, T.G.; et al. Risk Factors for Progression of Cervical Congenital Scoliosis and Associated Compensatory Curve Behavior. J. Clin. Med. 2024, 13, 3039. https://doi.org/10.3390/jcm13113039
Amanullah AA, Oh T, Toll BJ, Patel A, Samdani AF, Pahys JM, Kim AJ, Vellanki A, Steindler J, Ishmael TG, et al. Risk Factors for Progression of Cervical Congenital Scoliosis and Associated Compensatory Curve Behavior. Journal of Clinical Medicine. 2024; 13(11):3039. https://doi.org/10.3390/jcm13113039
Chicago/Turabian StyleAmanullah, Amir A., Taemin Oh, Brandon J. Toll, Akul Patel, Amer F. Samdani, Joshua M. Pahys, Andrew Jeongyoon Kim, Aniketh Vellanki, Jessica Steindler, Terrence G. Ishmael, and et al. 2024. "Risk Factors for Progression of Cervical Congenital Scoliosis and Associated Compensatory Curve Behavior" Journal of Clinical Medicine 13, no. 11: 3039. https://doi.org/10.3390/jcm13113039
APA StyleAmanullah, A. A., Oh, T., Toll, B. J., Patel, A., Samdani, A. F., Pahys, J. M., Kim, A. J., Vellanki, A., Steindler, J., Ishmael, T. G., & Hwang, S. W. (2024). Risk Factors for Progression of Cervical Congenital Scoliosis and Associated Compensatory Curve Behavior. Journal of Clinical Medicine, 13(11), 3039. https://doi.org/10.3390/jcm13113039