
Pulmonary Function, Computed Tomography Lung Abnormalities, and Small Airway Disease after COVID-19: 3-, 6-, and 9-Month Follow-Up

 , , , and
Abstract
1. Introduction
2. Materials and Methods
3. Results
- Figures and Tables

| Patients | CCTS Score [Points] | ||||||
|---|---|---|---|---|---|---|---|
| (0–5) | (5–10) | (10–15) | (15–20) | (20–25) | p-Value 1 | ||
| Month 0 | Severe/critical n = 19 | 0 (0%) | 6 (32%) | 4 (21%) | 8 (42%) | 1 (5.3%) | 0.005 |
| Mild/moderate n = 152 | 13 (8.6%) | 43 (28%) | 71 (47%) | 25 (16%) | 0 | ||
| Month 3 | Severe/critical n = 19 | 7 (37%) | 7 (37%) | 4 (21%) | 1 (5.3%) | 0 | 0.2 |
| Mild/moderate n = 130 | 65 (50%) | 49 (38%) | 15 (12%) | 1 (0.8%) | 0 | ||
| Month 6 | Severe/critical n = 16 | 6 (38%) | 7 (44%) | 2 (12%) | 1 (6.2%) | 0 | 0.054 |
| Mild/moderate n = 117 | 71 (61%) | 41 (35%) | 4 (2.4%) | 1 (0.9%) | 0 | ||
| Month 9 | Severe/critical n = 15 | 6 (40%) | 6 (40%) | 2 (13%) | 1 (6.7%) | 0 | 0.042 |
| Mild/moderate n = 115 | 76 (66%) | 34 (30%) | 4 (3.5%) | 1 (0.9%) | 0 | ||
| Baseline Characteristic | All Patients (n = 176) | Disease Severity (WHO Ordinary Scale) | p-Value WHO 4–5 vs. WHO 6–7 | |
|---|---|---|---|---|
| Patients WHO 4–5 (n = 154) | Patients WHO 6–7 (n = 22) | |||
| Sex: male/female n/n | 111/65 | 97/57 | 14/8 | |
| Age: years ± SD | 56.8 ± 13.6 | 57.5 ± 12.4 | 56.9 ± 10.9 | 0.42 1 |
| Body mass index: kg/m2 ± SD | 30.0 ± 6.2 | 30.0 ± 5.8 | 30.4 ± 4.0 | 0.73 1 |
| HRCT lung involvement point scale ± SD | 12.1 ± 4.2 | 11.6 ± 4 | 15.1 ± 4.5 | 0.42 1 |
| D-dimer: µg/L−1 ± SD | 1040 ± 1020 | 1020 ± 990 | 1160 ± 1230 | 0.27 2 |
| Mechanical ventilation: n/% | 0/0 | 3/13.6 | ||
| HFNO: n/% | 0/0 | 19/86.4 | ||
| Day to hospital discharge: day ± SD | 14 ± 8.0 | 13 ± 7 | 24 ± 7 | 0.001 1,* |
| Oxygenation (SpO2): % ± SD | 88.7 ± 6.4 | 89.8 ± 5.8 | 81.8 ± 6.2 | 0.001 1,* |
| Coexisting disorder | ||||
| COPD: n/% | 6/3.4 | 5/3.2 | 1/4.5 | 0.71 2 |
| Asthma: n/% | 22/12.5 | 18/11.7 | 4/18.2 | 0.76 2 |
| Arterial hypertension: n/% | 91/51.7 | 81/52.6 | 10/45.5 | 0.53 2 |
| Coronary artery diseases: n/% | 18/10.2 | 17/11.0 | 1/4.5 | 0.35 2 |
| Chronic heart failure: n/% | 8/4.5 | 6/3.9 | 2/9.1 | 0.28 2 |
| Atrial fibrillation: n/% | 13/7.4 | 13/8.4 | 0/0 | 0.17 2 |
| Chronic kidney failure: n/% | 8/4.5 | 7/4.5 | 1/4.5 | >0.999 2 |
| Diabetes mellitus type 2: n/% | 37/21.0 | 31/20.1 | 6/27.3 | 0.44 2 |
| Rheumatoid arthritis: n/% | 1/0.6 | 1/0.6 | 0/0 | 0.71 2 |
| Pulmonary function at third month of follow-up | value ± SD | |||
| FVC L | 3.98 ± 1.24 | 4.06 ± 1.25 | 3.49 ± 1.04 | 0.03 1,* |
| FVC% | 98.73 ± 17.27 | 99.96 ± 17.34 | 90.14 ± 14.34 | 0.39 1 |
| FEV1 L | 3.14 ± 1.03 | 3.18 ± 1.05 | 2.87 ± 0.78 | 0.12 1 |
| FEV1% | 97.81 ± 18.63 | 98.62 ± 19.04 | 92.18 ± 14.62 | 0.07 1 |
| FEV1/FVC index | 78.66 ± 7.91 | 78.12 ± 7.97 | 82.39 ± 6.5 | 0.009 1,* |
| MEF 75 L/s | 6.53 ± 2.3 | 6.51 ± 2.31 | 6.63 ± 2.3 | 0.82 1 |
| MEF 75% | 51.07 ± 29.7 | 50.31 ± 29.85 | 61.52 ± 27.81 | 0.38 1 |
| MEF 50 L/s | 3.86 ± 1.67 | 3.86 ± 1.67 | 3.93 ± 1.49 | 0.84 1 |
| MEF 50% | 108.92 ± 43.25 | 110.66 ± 43.75 | 96.75 ± 38.32 | 0.129 1 |
| MEF 25 L/s | 1.2 ± 0.69 | 1.19 ± 0.7 | 1.3 ± 0.62 | 0.43 1 |
| MEF 25% | 58.48 ± 30.17 | 58.9 ± 31.1 | 51.7 ± 10.96 | 0.22 1 |
| TLC L | 6.32 ± 1.47 | 6.42 ± 1.47 | 5.61 ± 1.29 | 0.01 1,* |
| TLC% | 99.54 ± 15.87 | 100.99 ± 28.42 | 89.1 ± 14.97 | 0.002 1,* |
| DLCO mmol/min * kPA | 7.03 ± 2.21 | 7.10 ± 2.23 | 6.45 ± 2.01 | 0.18 1 |
| DLCO% | 78.3 ± 17.18 | 79.46 ± 17.14 | 69.51 ± 15.19 | 0.01 1,* |
| Point of Follow-Up | Three Months | Six Months | Nine Months | ||||||
|---|---|---|---|---|---|---|---|---|---|
| Disease Sevrity | WHO 4–5 | WHO 6–7 | p-Value 1 | WHO 4–5 | WHO 6–7 | p-Value 1 | WHO 4–5 | WHO 6–7 | p-Value 1 |
| HRCT lung involvement point scale | 5.8 ± 3.7 | 7.7 ± 4.2 | 0.37 | 5.1 ± 3.2 | 6.7 ± 4.3 | 0.06 | 5.6 ± 3.3 | 7.1 ± 4.5 | 0.09 |
| Oxygenation (SpO2%) | 97.4 ± 1.8 | 97.4 ± 1.5 | 0.27 | 97.5 ± 1.5 | 98.3 ± 0.8 | 0.30 | 97.7 ± 1.2 | 97.8 ± 1.1 | 0.39 |
| Pulmonary function | |||||||||
| FEV1/FVC index | 78.12 ± 7.97 | 82.39 ± 6.5 | 0.009 * | 78.05 ± 7.46 | 80.47 ± 6.68 | 0.28 | 77.97 ± 7.13 | 77.61± 5.83 | 0.89 |
| FEV1/FVC% | 100.21 ± 10.51 | 106.23 ± 7.18 | 0.002 * | 99.71 ± 9.42 | 103.36 ± 7.35 | 0.15 | 99.45± 8.53 | 101.0 ± 5.29 | 0.53 |
| FVC L | 4.06 ± 1.25 | 3.49 ± 1.04 | 0.03 * | 4.13 ± 1.18 | 3.54 ± 1.03 | 0.10 | 4.12 ± 1.27 | 3.87 ± 0.68 | 0.46 |
| FVC%. | 99.96 ± 17.34 | 90.14 ± 14.34 | 0.39 | 97.9 ± 14.75 | 88.64 ± 13.28 | 0.05 * | 96.13± 17.03 | 90.5 ±17.66 | 0.48 |
| FEV1 L | 3.18 ± 1.05 | 2.87 ± 0.78 | 0.12 | 3.25 ± 1.03 | 2.83 ± 0.78 | 0.13 | 3.23 ± 1.08 | 3.01 ± 0.58 | 0.43 |
| FEV1% | 98.62 ± 19.04 | 92.18 ± 14.62 | 0.07 | 97.6 ±17.59 | 89.64 ± 10.71 | 0.05 * | 95.76 ± 19.19 | 90.5 ±14.57 | 0.43 |
| MEF 75 L/s | 6.51 ± 2.31 | 6.63 ± 2.3 | 0.82 | 6.8 ± 2.41 | 6.76 ± 2.08 | 0.95 | 6.73 ± 2.36 | 7.46 ± 1.85 | 0.4 |
| MEF 75% | 50.31 ± 29.85 | 61.52 ± 27.81 | 0.38 | 54.79 ± 30.8 | 63.60 ± 17.79 | 0.31 | 53.46 ± 29.88 | 61.11 ± 33.91 | 0.69 |
| MEF 50 L/s | 3.86 ± 1.67 | 3.93 ± 1.49 | 0.84 | 3.93 ± 1.72 | 3.64 ± 1.18 | 0.49 | 3.75 ± 1.63 | 3.37 ± 1.19 | 0.49 |
| MEF 50% | 110.66 ± 43.75 | 96.75 ± 38.32 | 0.129 | 125.27 ± 47.01 | 111.73 ± 36.27 | 0.28 | 123.92 ± 46.16 | 110.83 ± 36.27 | 0.43 |
| MEF 25 L/s | 1.19 ± 0.7 | 1.3 ± 0.62 | 0.43 | 1.2 ± 0.69 | 1.46 ± 0.53 | 0.63 | 1.14 ± 0.68 | 0.93 ± 0.68 | 0.49 |
| MEF 25% | 58.9 ± 31.1 | 51.7 ± 10.96 | 0.22 | 63.1 ± 29.7 | 63.37 ± 20.21 | 0.81 | 64.1 ± 32.11 | 52.43 ± 26.61 | 0.45 |
| TLC L | 6.42 ± 1.47 | 5.61 ± 1.29 | 0.01 * | 6.44 ± 1.38 | 5.47 ± 1.01 | 0.005 * | 6.34 ± 1.46 | 5.49 ± 0.96 | 0.04 * |
| TLC% | 100.99 ± 28.42 | 89.1 ± 14.97 | 0.002 * | 100.3 ± 17.76 | 89.25 ± 13.98 | 0.01 * | 98.87 ± 14.78 | 86.56 ± 12.08 | 0.02 * |
| DLCO mmol/min * kPA | 7.10 ± 2.23 | 6.45 ± 2.01 | 0.18 | 7.06 ± 2.03 | 3.23 ± 2.11 | 0.18 | 7.16 ± 2.03 | 5.63 ± 1.35 | 0.02 * |
| DLCO% | 79.46 ± 17.14 | 69.51 ± 15.19 | 0.01 * | 79.60 ± 18.13 | 71.64 ± 14.68 | 0.08 | 80.85 ± 15.5 | 67.0 ± 15.15 | 0.04 * |
| Lung Function Parameters | HRCT Lung Involvement Point Scale | Three Months | Six Months | Nine Months | |||
|---|---|---|---|---|---|---|---|
| r | p-Value | r | p-Value | r | p-Value | ||
| FVC L | CT lung score | −0.169 | 0.041 * | −0.299 | 0.006 * | −0.164 | 0.193 |
| FEV1 L | CT lung score | −0.166 | 0.046 * | −0.314 | 0.004 * | −0.191 | 0.127 |
| TLC L | CT lung score | −0.142 | 0.089 | −0.258 | 0.014 * | −0.229 | 0.055 |
| RV% | CT lung score | −0.103 | 0.218 | −0.154 | 0.146 | −0.298 | 0.012 * |
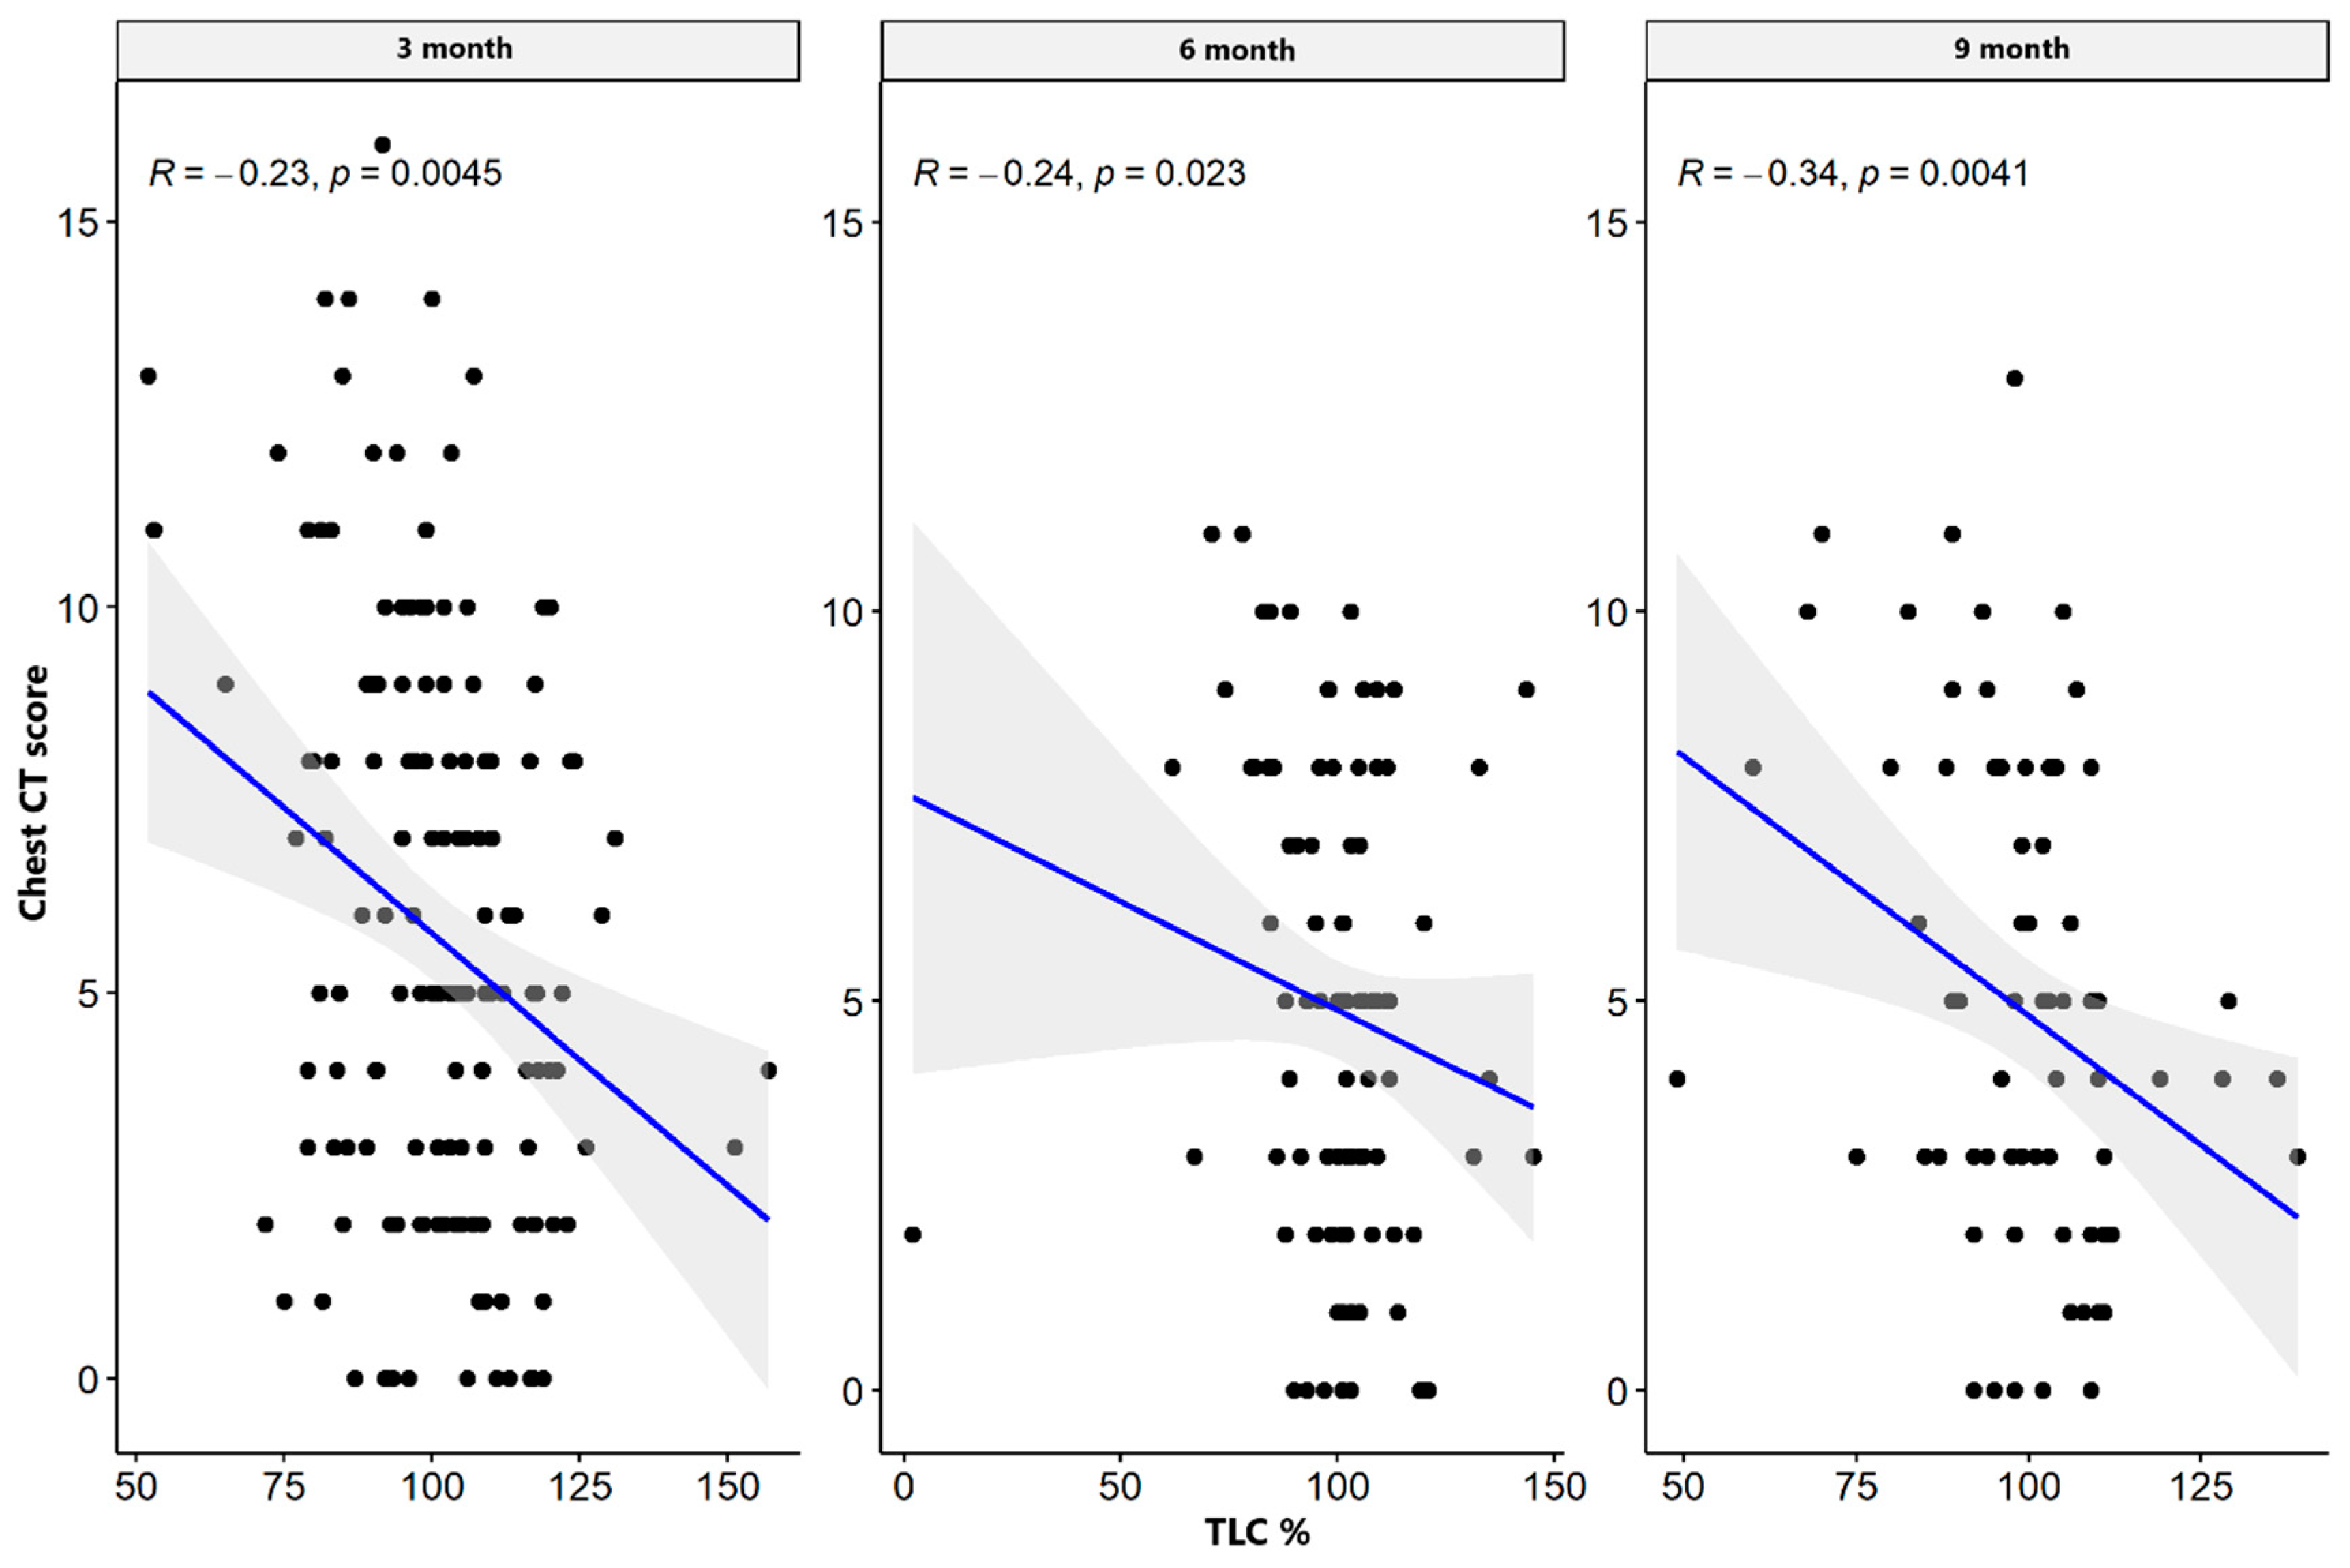
| TLC% | CT lung score | −0.235 | 0.004 * | −0.238 | 0.023 * | −0.337 | 0.004 * |
| DLCO cSB mmol min * kPa | CT lung score | −0.310 | 0.000 * | −0.394 | 0.000 * | −0.290 | 0.014 * |
| DLCO cSB% | CT lung score | −0.313 | 0.000 * | −0.305 | 0.003 * | −0.223 | 0.062 |
| MEF 25 L/s | CT lung score | −0.173 | 0.036 * | −0.297 | 0.007 * | −0.214 | 0.087 |
| MEF 50 L/s | CT lung score | −0.167 | 0.043 * | −0.362 | 0.001 * | −0.253 | 0.042 * |
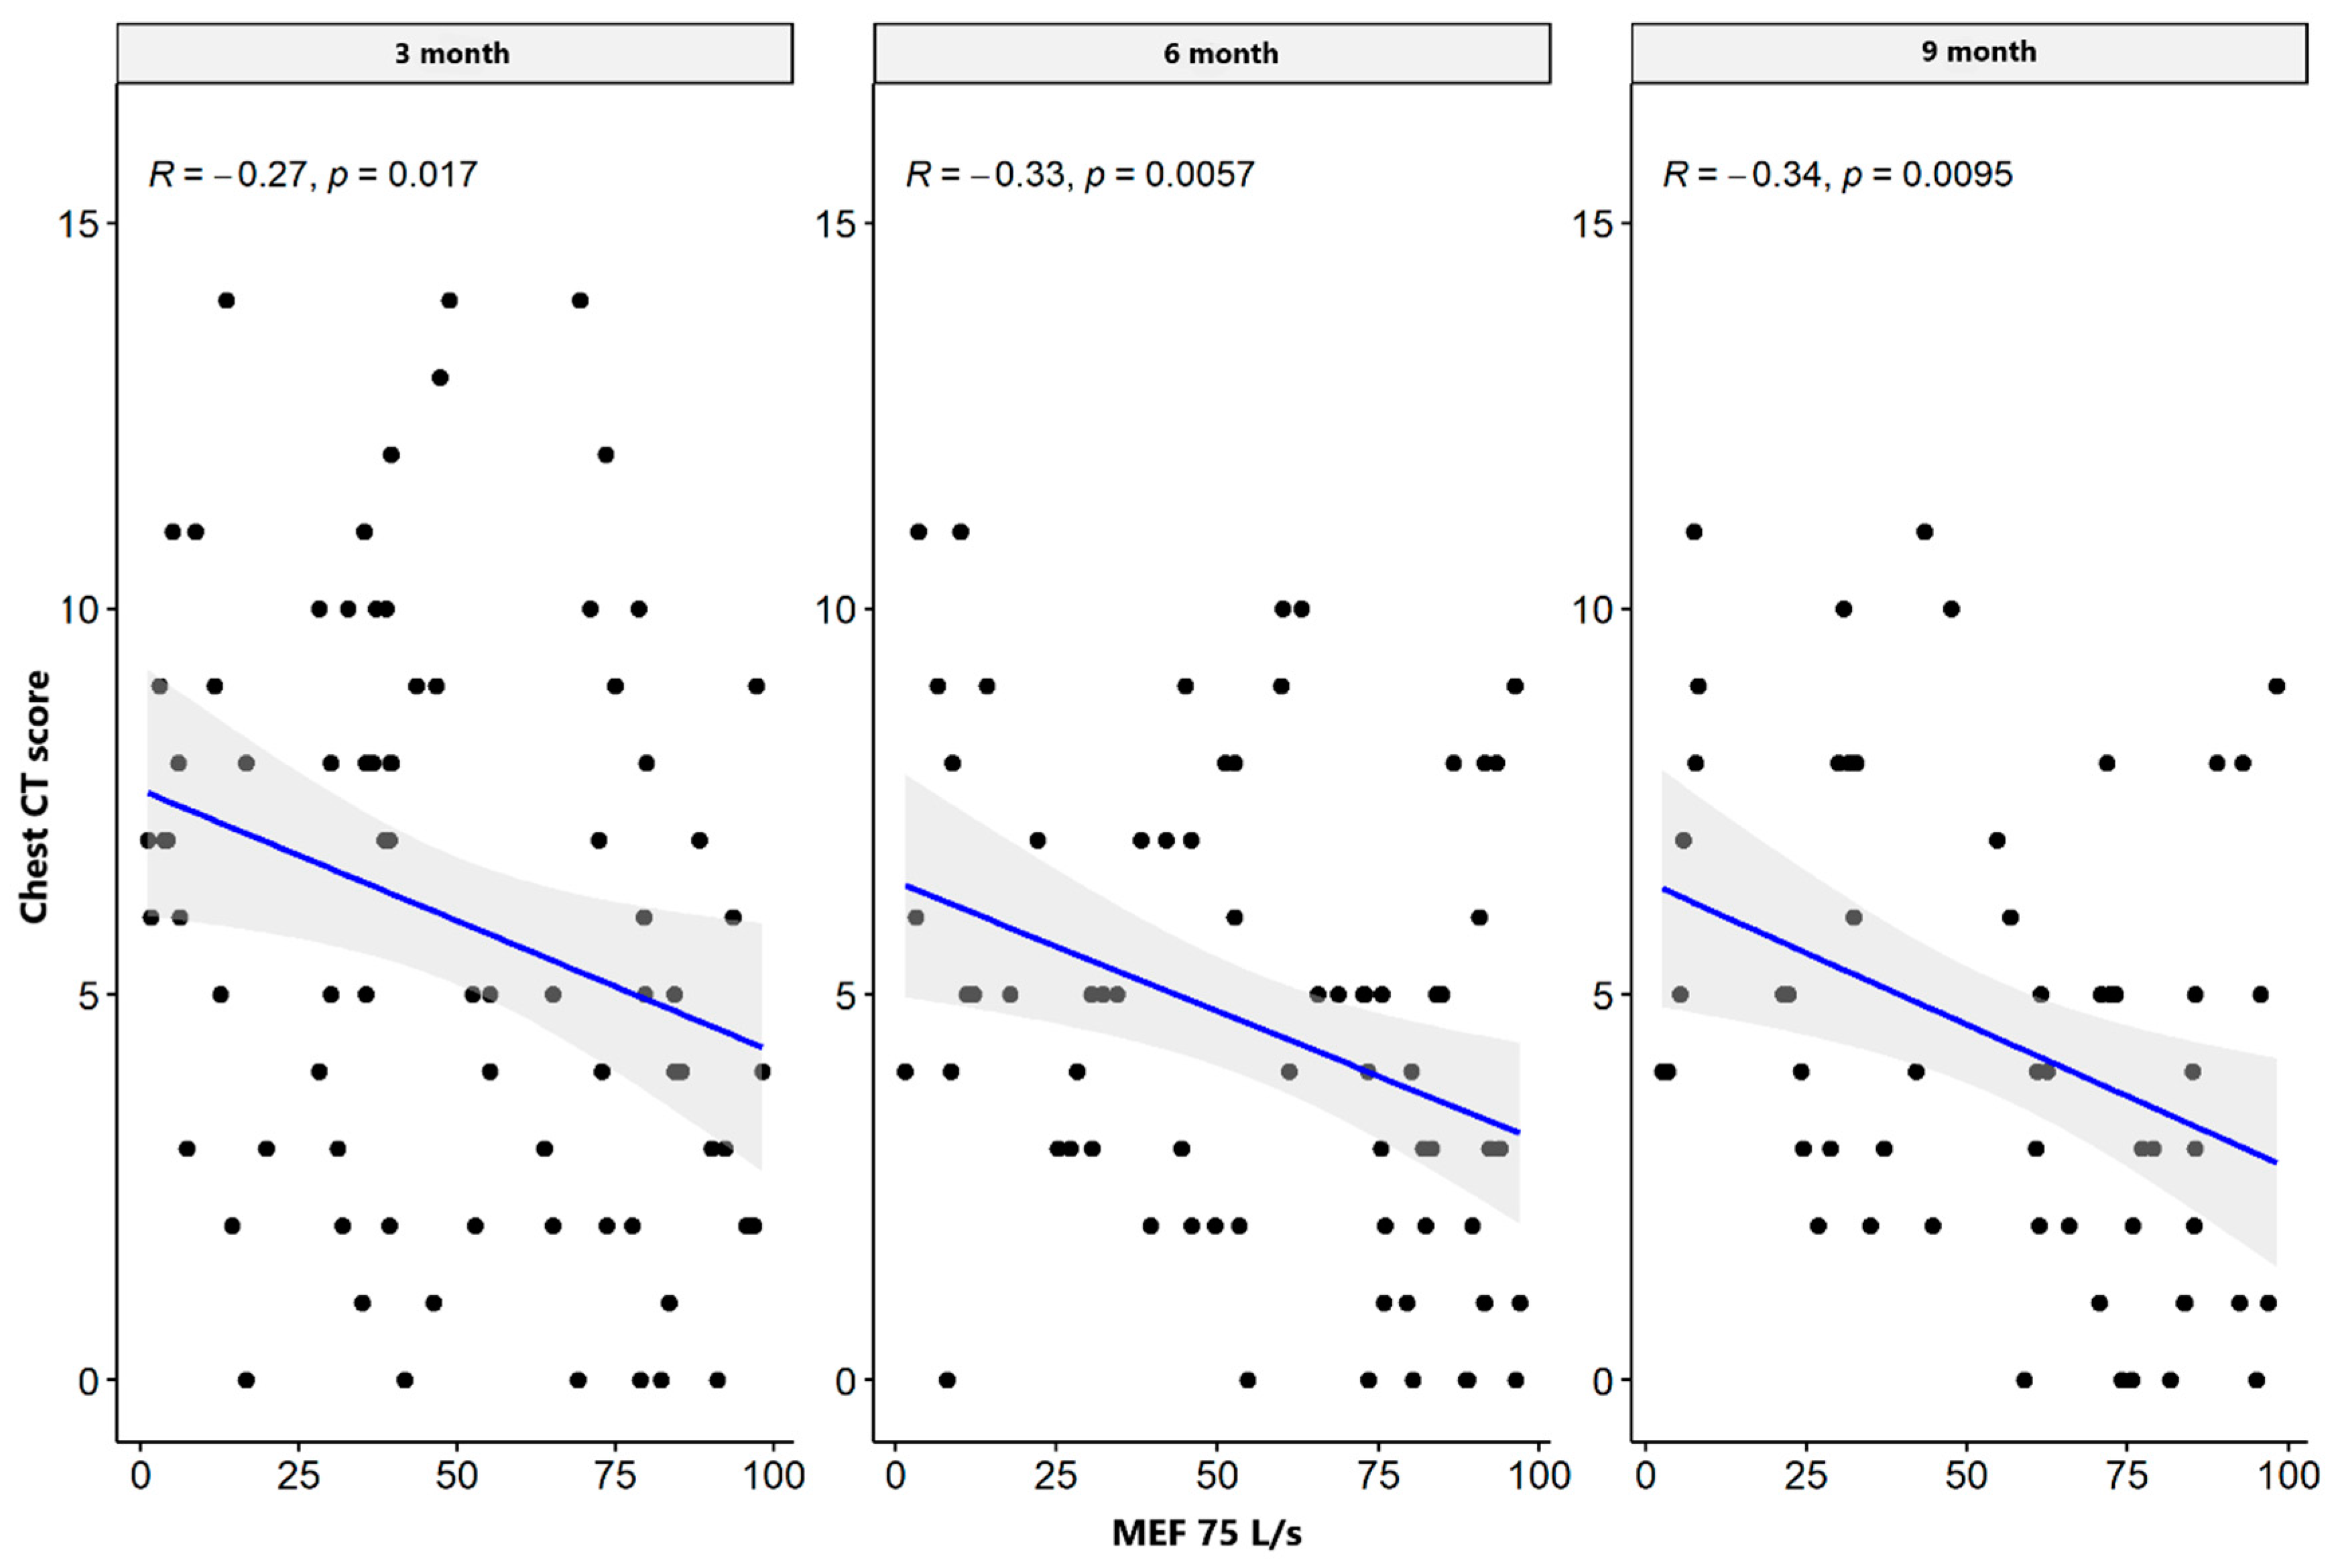
| MEF 75 L/s | CT lung score | −0.086 | 0.302 | −0.289 | 0.009 * | −0.260 | 0.036 * |
| MEF 25% | CT lung score | 0.068 | 0.557 | −0.129 | 0.289 | 0.123 | 0.358 |
| MEF 50% | CT lung score | 0.002 | 0.981 | −0.245 | 0.027 * | −0.048 | 0.704 |
| MEF 75% | CT lung score | −0.270 | 0.017 * | −0.329 | 0.006 * | −0.338 | 0.010 * |
| Lung Function Parameters | HRCT Lung Involvement Point Scale | Three Months | Six Months | Nine Months | |||
|---|---|---|---|---|---|---|---|
| r | p-Value | r | p-Value | r | p-Value | ||
| FVC L | CT lung score | −0.361 | 0.118 | −0.387 | 0.304 | −1.000 | 0.017 * |
| FEV1 L | CT lung score | −0.420 | 0.065 | −0.376 | 0.932 | 0.600 | 0.017 * |
| TLC L | CT lung score | −0.446 | 0.055 | −0.694 | 0.018 * | −0.116 | 0.827 |
| RV% | CT lung score | −0.416 | 0.076 | −0.009 | 0.979 | −0.754 | 0.084 |
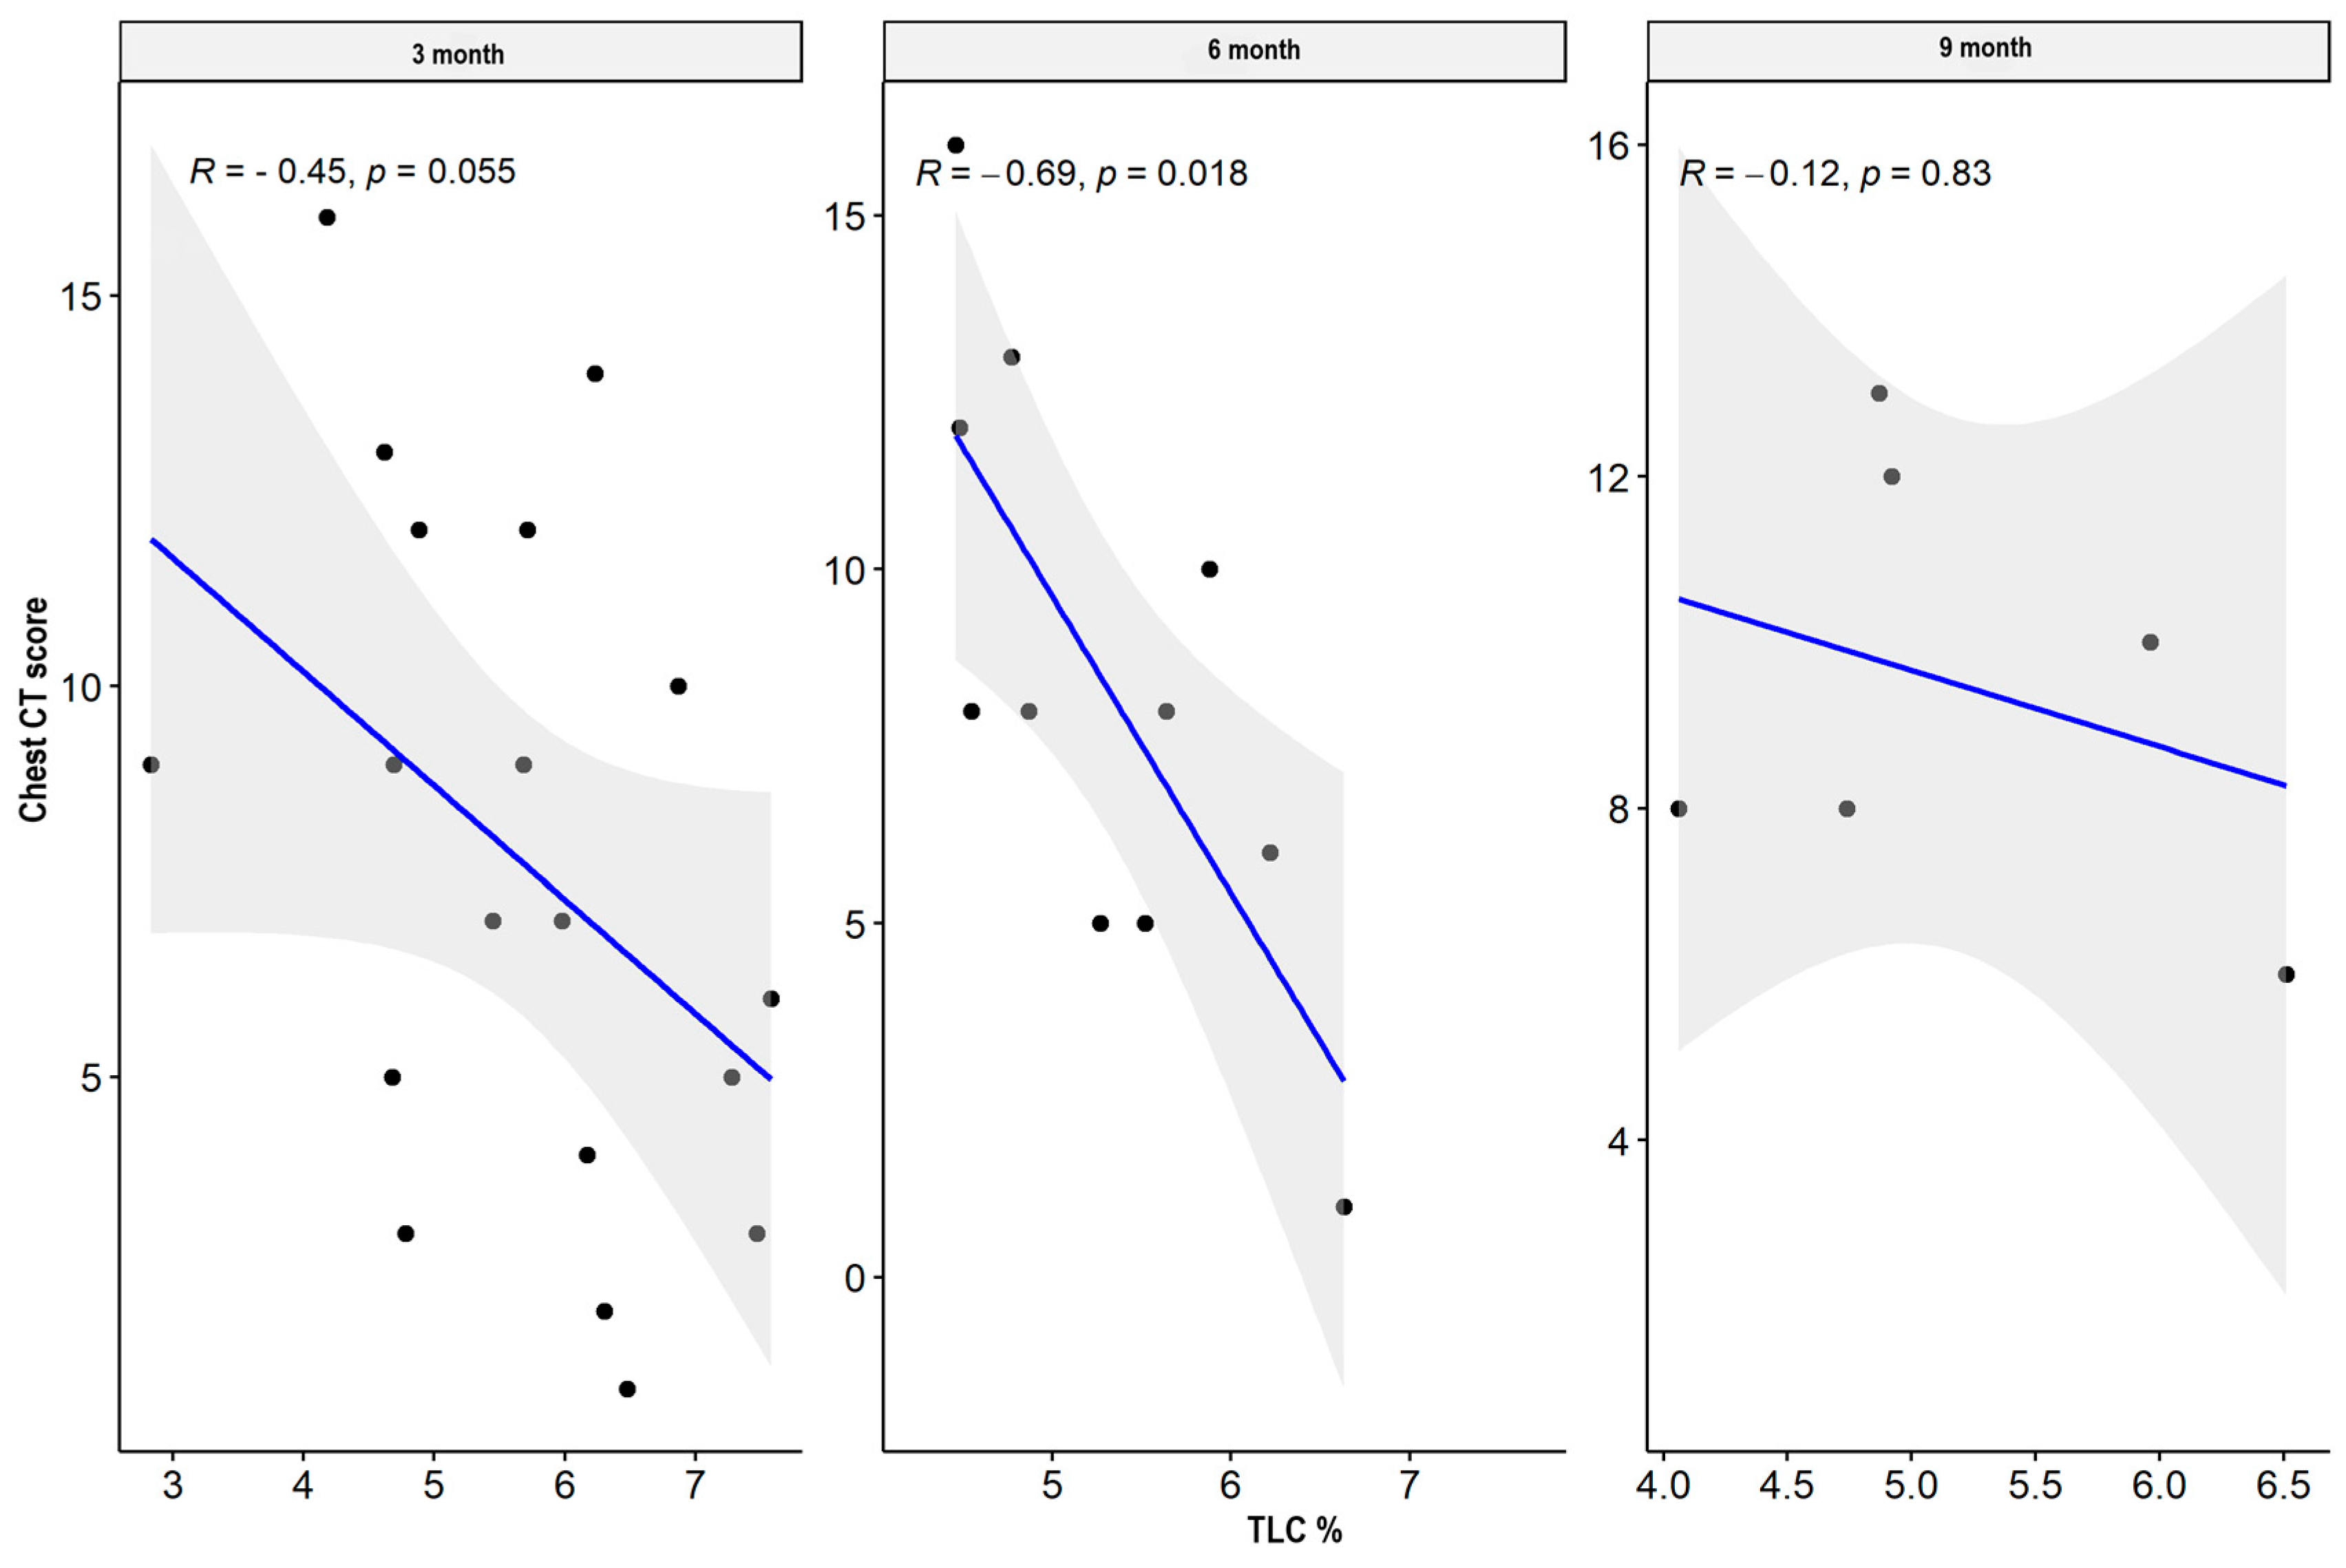
| TLC% | CT lung score | −0.313 | 0.191 | −0.171 | 0.616 | −0.779 | 0.068 |
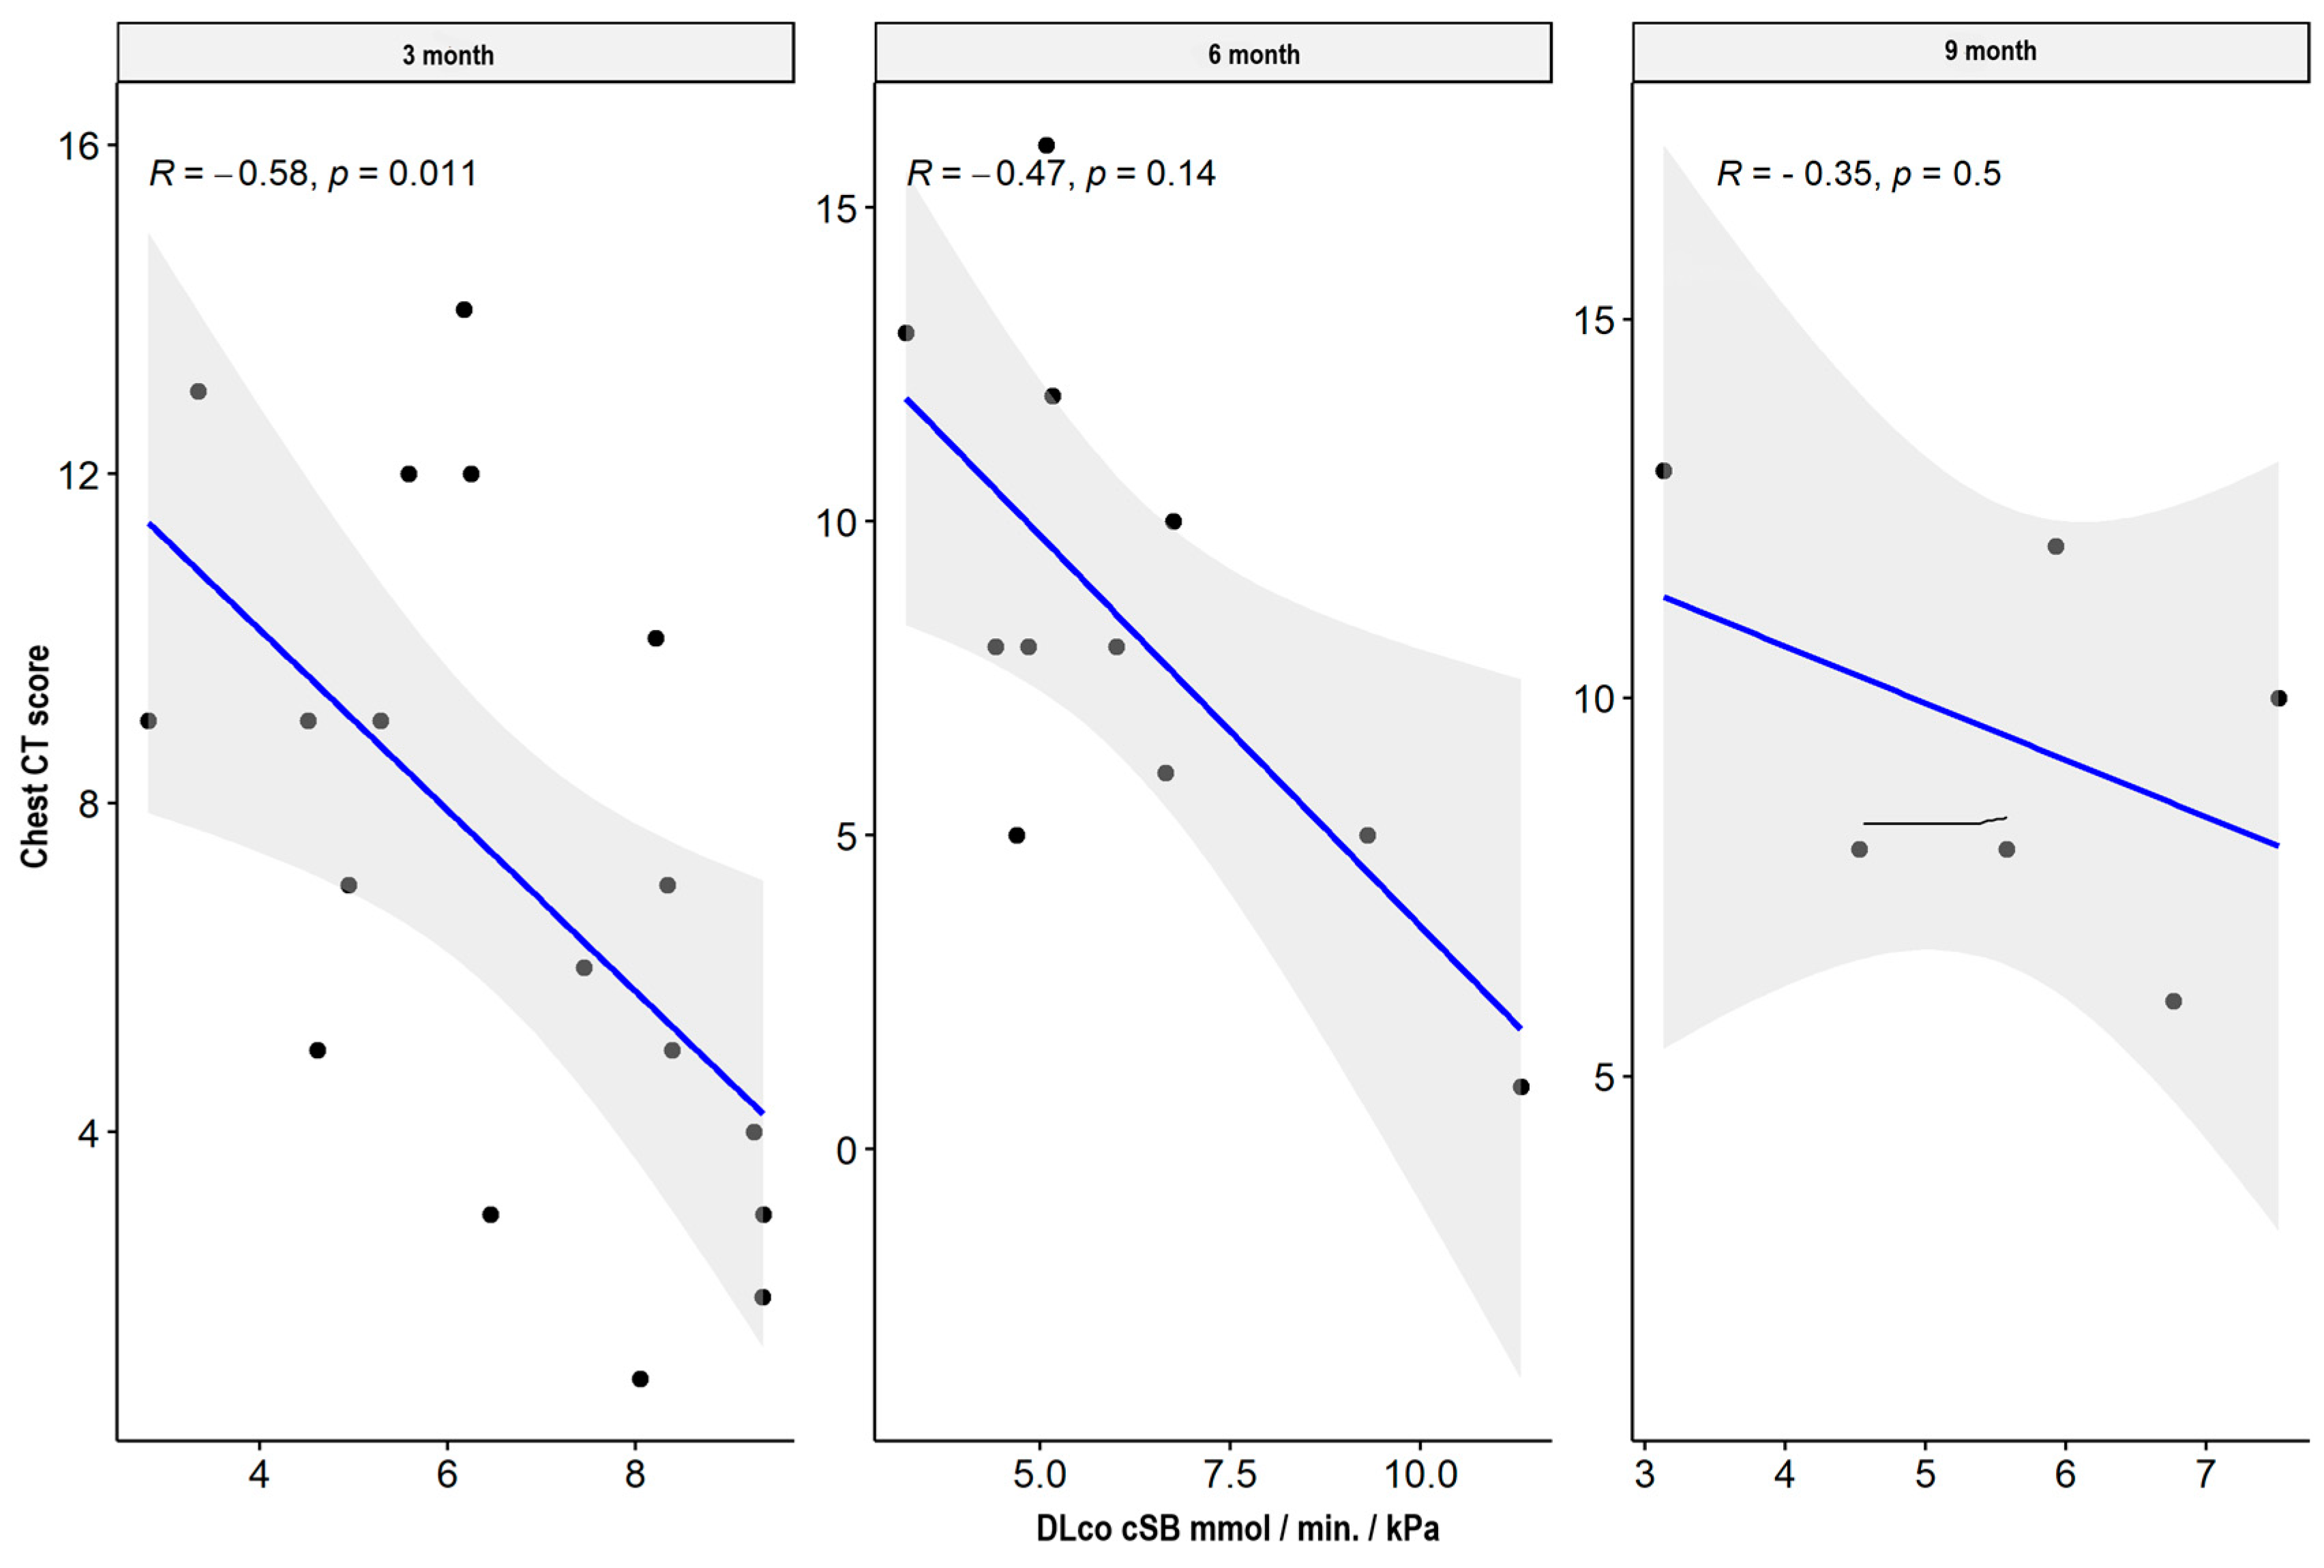
| DLCO cSB mmol min * kPa | CT lung score | −0.581 | 0.011 * | −0.474 | 0.141 | −0.348 | 0.499 |
| DLCO cSB% | CT lung score | −0.537 | 0.022 * | −0.510 | 0.109 | −0.551 | 0.257 |
| MEF 25 L/s | CT lung score | −0.586 | 0.008 * | −0.345 | 0.364 | −0.900 | 0.083 |
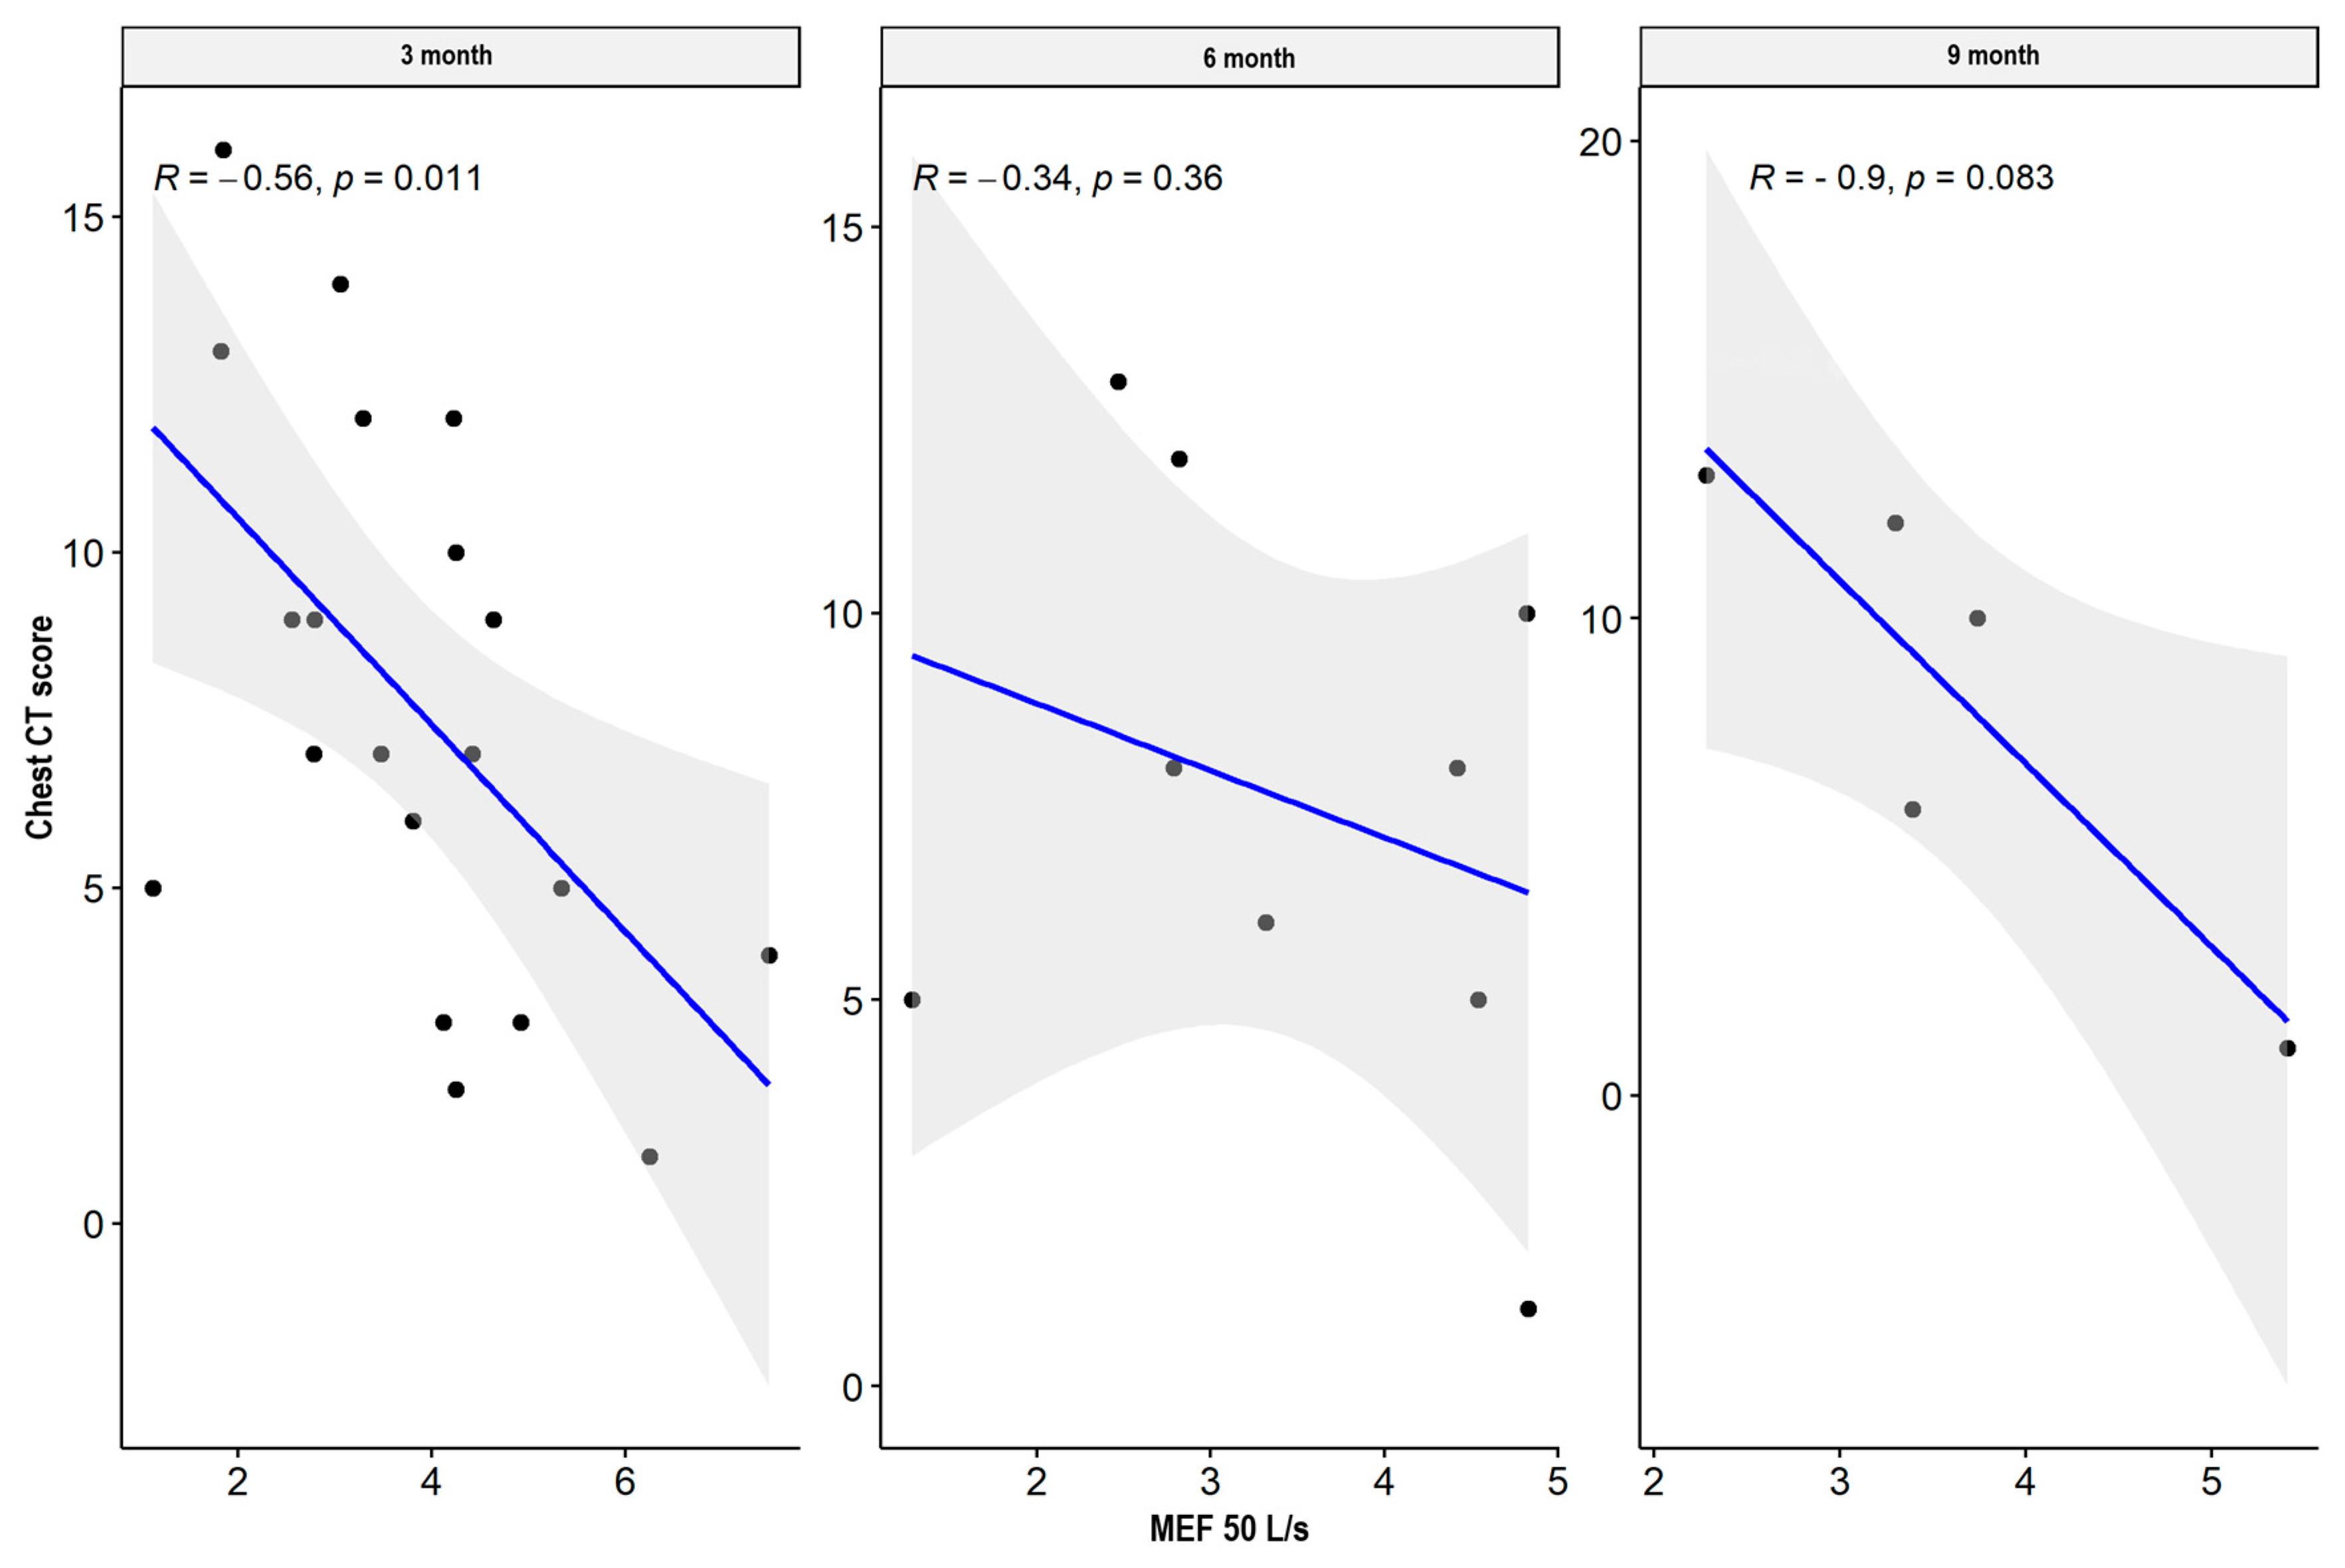
| MEF 50 L/s | CT lung score | −0.556 | 0.011 * | −0.345 | 0.364 | −0.900 | 0.083 |
| MEF 75 L/s | CT lung score | −0.154 | 0.528 | −0.361 | 0.339 | −0.800 | 0.133 |
| MEF 25% | CT lung score | −0.058 | 0.913 | 0.500 | 0.450 | 0.500 | 1.000 |
| MEF 50% | CT lung score | −0.251 | 0.285 | 0.336 | 0.376 | −0.100 | 0.950 |
| MEF 75% | CT lung score | 0.493 | 0.321 | 0.000 | 1.000 | −0.500 | 1.000 |


4. Discussion
- The analyzed studies are single-center studies, and severe/critical patients constitute a small group;
- The inability to perform PFTs in the acute period makes assessing the degree of restrictive and obstructive respiratory disorders impossible;
- According to the guidelines in force at the time, different methods of treating patients in different categories of disease severity were used;
- Extended observation for several years using currently available and new diagnostic methods should be carried out.
5. Conclusions
- Persistent respiratory symptoms after COVID-19, in some people, can result from fibrotic lung parenchyma changes, not visible in CT images.
- The small airway disease after COVID-19 may result from post-infectious stenotic bronchitis due to persistent inflammation, even in mild/moderate COVID-19 patients.
Author Contributions
Funding
Institutional Review Board Statement
Informed Consent Statement
Data Availability Statement
Conflicts of Interest
References
- Zhu, N.; Zhang, D.; Wang, W.; Li, X.; Yang, B.; Song, J.; Zhao, X.; Huang, B.; Shi, W.; Lu, R.; et al. A Novel Coronavirus from Patients with Pneumonia in China, 2019. N. Engl. J. Med. 2020, 382, 727–733. [Google Scholar] [CrossRef] [PubMed]
- Lu, R.; Zhao, X.; Li, J.; Niu, P.; Yang, B.; Wu, H.; Wang, W.; Song, H.; Huang, B.; Zhu, N.; et al. Genomic Characterisation and Epidemiology of 2019 Novel Coronavirus: Implications for Virus Origins and Receptor Binding. Lancet 2020, 395, 565–574. [Google Scholar] [CrossRef] [PubMed]
- Li, Q.; Guan, X.; Wu, P.; Wang, X.; Zhou, L.; Tong, Y.; Ren, R.; Leung, K.S.M.; Lau, E.H.Y.; Wong, J.Y.; et al. Early Transmission Dynamics in Wuhan, China, of Novel Coronavirus-Infected Pneumonia. N. Engl. J. Med. 2020, 382, 1199–1207. [Google Scholar] [CrossRef] [PubMed]
- Masclans, J.R.; Roca, O.; Muñoz, X.; Pallisa, E.; Torres, F.; Rello, J.; Morell, F. Quality of Life, Pulmonary Function, and Tomographic Scan Abnormalities after ARDS. Chest 2011, 139, 1340–1346. [Google Scholar] [CrossRef] [PubMed]
- Han, X.; Fan, Y.; Alwalid, O.; Li, N.; Jia, X.; Yuan, M.; Li, Y.; Cao, Y.; Gu, J.; Wu, H.; et al. Six-Month Follow-up Chest CT Findings after Severe COVID-19 Pneumonia. Radiology 2021, 299, E177–E186. [Google Scholar] [CrossRef] [PubMed]
- Wu, X.; Liu, X.; Zhou, Y.; Yu, H.; Li, R.; Zhan, Q.; Ni, F.; Fang, S.; Lu, Y.; Ding, X.; et al. 3-Month, 6-Month, 9-Month, and 12-Month Respiratory Outcomes in Patients Following COVID-19-Related Hospitalisation: A Prospective Study. Lancet Respir. Med. 2021, 9, 747–754. [Google Scholar] [CrossRef] [PubMed]
- Wanger, J.; Clausen, J.L.; Coates, A.; Pedersen, O.F.; Brusasco, V.; Burgos, F.; Casaburi, R.; Crapo, R.; Enright, P.; van der Grinten, C.P.M.; et al. Standardisation of the Measurement of Lung Volumes. Eur. Respir. J. 2005, 26, 511–522. [Google Scholar] [CrossRef] [PubMed]
- Graham, B.L.; Steenbruggen, I.; Miller, M.R.; Barjaktarevic, I.Z.; Cooper, B.G.; Hall, G.L.; Hallstrand, T.S.; Kaminsky, D.A.; McCarthy, K.; McCormack, M.C.; et al. Standardization of Spirometry 2019 Update. An Official American Thoracic Society and European Respiratory Society Technical Statement. Am. J. Respir. Crit. Care Med. 2019, 200, e70–e88. [Google Scholar] [CrossRef] [PubMed]
- Graham, B.L.; Brusasco, V.; Burgos, F.; Cooper, B.G.; Jensen, R.; Kendrick, A.; MacIntyre, N.R.; Thompson, B.R.; Wanger, J. 2017 ERS/ATS Standards for Single-Breath Carbon Monoxide Uptake in the Lung. Eur. Respir. J. 2017, 49, 1600016. [Google Scholar] [CrossRef]
- Francone, M.; Iafrate, F.; Masci, G.M.; Coco, S.; Cilia, F.; Manganaro, L.; Panebianco, V.; Andreoli, C.; Colaiacomo, M.C.; Zingaropoli, M.A.; et al. Chest CT Score in COVID-19 Patients: Correlation with Disease Severity and Short-Term Prognosis. Eur. Radiol. 2020, 30, 6808–6817. [Google Scholar] [CrossRef]
- Tang, J.W.; Tambyah, P.A.; Hui, D.S.C. Emergence of a Novel Coronavirus Causing Respiratory Illness from Wuhan, China. J. Infect. 2020, 80, 350–371. [Google Scholar] [CrossRef] [PubMed]
- Huang, C.; Wang, Y.; Li, X.; Ren, L.; Zhao, J.; Hu, Y.; Zhang, L.; Fan, G.; Xu, J.; Gu, X.; et al. Clinical Features of Patients Infected with 2019 Novel Coronavirus in Wuhan, China. Lancet 2020, 395, 497–506. [Google Scholar] [CrossRef] [PubMed]
- Xu, Z.; Shi, L.; Wang, Y.; Zhang, J.; Huang, L.; Zhang, C.; Liu, S.; Zhao, P.; Liu, H.; Zhu, L.; et al. Pathological Findings of COVID-19 Associated with Acute Respiratory Distress Syndrome. Lancet Respir. Med. 2020, 8, 420–422. [Google Scholar] [CrossRef] [PubMed]
- Jacobi, A.; Chung, M.; Bernheim, A.; Eber, C. Portable Chest X-Ray in Coronavirus Disease-19 (COVID-19): A Pictorial Review. Clin. Imaging 2020, 64, 35–42. [Google Scholar] [CrossRef] [PubMed]
- Englisch, C.N.; Tschernig, T.; Flockerzi, F.; Meier, C.; Bohle, R.M. Lesions in the Lungs of Fatal Corona Virus Disease COVID-19. Ann. Anat.-Anat. Anz. 2020, 234, 151657. [Google Scholar] [CrossRef]
- Tsui, P.T.; Kwok, M.L.; Yuen, H.; Lai, S.T. Severe Acute Respiratory Syndrome: Clinical Outcome and Prognostic Correlates. Emerg. Infect. Dis. 2003, 9, 1064–1069. [Google Scholar] [CrossRef] [PubMed]
- Hui, D.S. Impact of Severe Acute Respiratory Syndrome (SARS) on Pulmonary Function, Functional Capacity and Quality of Life in a Cohort of Survivors. Thorax 2005, 60, 401–409. [Google Scholar] [CrossRef] [PubMed]
- Tse, G.M.-K. Pulmonary Pathological Features in Coronavirus Associated Severe Acute Respiratory Syndrome (SARS). J. Clin. Pathol. 2004, 57, 260–265. [Google Scholar] [CrossRef] [PubMed]
- Ahmed, H.; Patel, K.; Greenwood, D.; Halpin, S.; Lewthwaite, P.; Salawu, A.; Eyre, L.; Breen, A.; O’Connor, R.; Jones, A.; et al. Long-Term Clinical Outcomes in Survivors of Severe Acute Respiratory Syndrome and Middle East Respiratory Syndrome Coronavirus Outbreaks after Hospitalisation or ICU Admission: A Systematic Review and Meta-Analysis. J. Rehabil. Med. 2020, 52, jrm00063. [Google Scholar] [CrossRef]
- Jia, X.; Han, X.; Cao, Y.; Fan, Y.; Yuan, M.; Li, Y.; Gu, J.; Zheng, Y.; Wang, L.; Qu, Y.; et al. Quantitative Inspiratory–Expiratory Chest CT Findings in COVID-19 Survivors at the 6-Month Follow-Up. Sci. Rep. (Nat. Publ. Group) 2022, 12, 7402. [Google Scholar] [CrossRef]
- González, J.; Benítez, I.D.; Carmona, P.; Santisteve, S.; Monge, A.; Moncusí-Moix, A.; Gort-Paniello, C.; Pinilla, L.; Carratalá, A.; Zuil, M.; et al. Pulmonary Function and Radiologic Features in Survivors of Critical COVID-19: A 3-Month Prospective Cohort. Chest 2021, 160, 187–198. [Google Scholar] [CrossRef] [PubMed]
- Guler, S.A.; Ebner, L.; Aubry-Beigelman, C.; Bridevaux, P.-O.; Brutsche, M.; Clarenbach, C.; Garzoni, C.; Geiser, T.K.; Lenoir, A.; Mancinetti, M.; et al. Pulmonary Function and Radiological Features 4 Months after COVID-19: First Results from the National Prospective Observational Swiss COVID-19 Lung Study. Eur. Respir. J. 2021, 57, 2003690. [Google Scholar] [CrossRef] [PubMed]
- Han, X.; Chen, L.; Fan, Y.; Alwalid, O.; Jia, X.; Zheng, Y.; Liu, J.; Li, Y.; Cao, Y.; Gu, J.; et al. Longitudinal Assessment of Chest CT Findings and Pulmonary Function in Patients after COVID-19. Radiology 2023, 307, e222888. [Google Scholar] [CrossRef] [PubMed]
- Ye, L.; Yao, G.; Lin, S.; Fang, Y.; Chen, X.; Wang, L.; He, S. The Investigation of Pulmonary Function Changes of COVID-19 Patients in Three Months. J. Healthc. Eng. 2022, 2022, 9028835. [Google Scholar] [CrossRef]
- Ye, L.; Hu, B.; Lin, S.; Chen, M.; Fang, Y.; He, S. Dynamic Changes in Lung Function and Imaging in Patients with COVID-19. Can. J. Infect. Dis. Med. Microbiol. 2022, 2022, 1728446. [Google Scholar] [CrossRef]
- Mo, X.; Jian, W.; Su, Z.; Chen, M.; Peng, H.; Peng, P.; Lei, C.; Chen, R.; Zhong, N.; Li, S. Abnormal Pulmonary Function in COVID-19 Patients at Time of Hospital Discharge. Eur. Respir. J. 2020, 55, 2001217. [Google Scholar] [CrossRef]
- Dou, P.; Zhang, S.; Wang, C.; Cai, L.; Liu, Z.; Xu, Q.; Li, X.; Meng, Y.; Rong, Y.; Li, S.; et al. Serial CT Features in Discharged COVID-19 Patients with Positive RT-PCR Re-Test. Eur. J. Radiol. 2020, 127, 109010. [Google Scholar] [CrossRef] [PubMed]
- González, J.; Zuil, M.; Benítez, I.D.; de Gonzalo-Calvo, D.; Aguilar, M.; Santisteve, S.; Vaca, R.; Minguez, O.; Seck, F.; Torres, G.; et al. One Year Overview and Follow-up in a Post-COVID Consultation of Critically Ill Patients. Front. Med. 2022, 9, 897990. [Google Scholar] [CrossRef]
- Tarraso, J.; Safont, B.; Carbonell-Asins, J.A.; Fernandez-Fabrellas, E.; Sancho-Chust, J.N.; Naval, E.; Amat, B.; Herrera, S.; Ros, J.A.; Soler-Cataluña, J.J.; et al. Lung Function and Radiological Findings 1 Year after COVID-19: A Prospective Follow-Up. Respir. Res. 2022, 23, 242. [Google Scholar] [CrossRef]
- Herridge, M.S.; Tansey, C.M.; Matté, A.; Tomlinson, G.; Diaz-Granados, N.; Cooper, A.; Guest, C.B.; Mazer, C.D.; Mehta, S.; Stewart, T.E.; et al. Functional Disability 5 Years after Acute Respiratory Distress Syndrome. N. Engl. J. Med. 2011, 364, 1293–1304. [Google Scholar] [CrossRef]
- Hatabu, H.; Hunninghake, G.M.; Richeldi, L.; Brown, K.K.; Wells, A.U.; Remy-Jardin, M.; Verschakelen, J.; Nicholson, A.G.; Beasley, M.B.; Christiani, D.C.; et al. Interstitial Lung Abnormalities Detected Incidentally on CT: A Position Paper from the Fleischner Society. Lancet Respir. Med. 2020, 8, 726–737. [Google Scholar] [CrossRef] [PubMed]
- Van Beek, E.J.R. Radiologic Findings after COVID-19 and the Correlation with Lung Function. Radiology 2023, 307, e230221. [Google Scholar] [CrossRef] [PubMed]
- Tsakok, M.; Watson, R.T.; Saujani, S.J.; Kong, M.; Xie, C.; Peschl, H.; Wing, L.; Macleod, F.; Shine, B.; Talbot, N.P.; et al. Reduction in Chest CT Severity and Improved Hospital Outcomes in SARS-CoV-2 Omicron Compared with Delta Variant Infection. Radiology 2022, 306, 261–269. [Google Scholar] [CrossRef] [PubMed]
- Grist, J.T.; Collier, G.J.; Walters, H.; Kim, M.; Chen, M.; Abu Eid, G.; Laws, A.; Matthews, V.; Jacob, K.; Cross, S.; et al. Lung Abnormalities Detected with Hyperpolarized 129Xe MRI in Patients with Long COVID. Radiology 2022, 305, 709–717. [Google Scholar] [CrossRef] [PubMed]
Disclaimer/Publisher’s Note: The statements, opinions and data contained in all publications are solely those of the individual author(s) and contributor(s) and not of MDPI and/or the editor(s). MDPI and/or the editor(s) disclaim responsibility for any injury to people or property resulting from any ideas, methods, instructions or products referred to in the content. |
© 2024 by the authors. Licensee MDPI, Basel, Switzerland. This article is an open access article distributed under the terms and conditions of the Creative Commons Attribution (CC BY) license (https://creativecommons.org/licenses/by/4.0/).
Share and Cite
Kłos, K.; Jaskóła-Polkowska, D.; Plewka-Barcik, K.; Rożyńska, R.; Pietruszka-Wałęka, E.; Żabicka, M.; Kania-Pudło, M.; Maliborski, A.; Plicht, K.; Angielski, G.; et al. Pulmonary Function, Computed Tomography Lung Abnormalities, and Small Airway Disease after COVID-19: 3-, 6-, and 9-Month Follow-Up. J. Clin. Med. 2024, 13, 2733. https://doi.org/10.3390/jcm13102733
Kłos K, Jaskóła-Polkowska D, Plewka-Barcik K, Rożyńska R, Pietruszka-Wałęka E, Żabicka M, Kania-Pudło M, Maliborski A, Plicht K, Angielski G, et al. Pulmonary Function, Computed Tomography Lung Abnormalities, and Small Airway Disease after COVID-19: 3-, 6-, and 9-Month Follow-Up. Journal of Clinical Medicine. 2024; 13(10):2733. https://doi.org/10.3390/jcm13102733
Chicago/Turabian StyleKłos, Krzysztof, Dominika Jaskóła-Polkowska, Katarzyna Plewka-Barcik, Renata Rożyńska, Ewa Pietruszka-Wałęka, Magdalena Żabicka, Marta Kania-Pudło, Artur Maliborski, Katarzyna Plicht, Grzegorz Angielski, and et al. 2024. "Pulmonary Function, Computed Tomography Lung Abnormalities, and Small Airway Disease after COVID-19: 3-, 6-, and 9-Month Follow-Up" Journal of Clinical Medicine 13, no. 10: 2733. https://doi.org/10.3390/jcm13102733
APA StyleKłos, K., Jaskóła-Polkowska, D., Plewka-Barcik, K., Rożyńska, R., Pietruszka-Wałęka, E., Żabicka, M., Kania-Pudło, M., Maliborski, A., Plicht, K., Angielski, G., Wojtyszek, A., Jahnz-Różyk, K., & Chciałowski, A. (2024). Pulmonary Function, Computed Tomography Lung Abnormalities, and Small Airway Disease after COVID-19: 3-, 6-, and 9-Month Follow-Up. Journal of Clinical Medicine, 13(10), 2733. https://doi.org/10.3390/jcm13102733