

Differences between SCORE, Framingham Risk Score, and Estimated Pulse Wave Velocity-Based Vascular Age Calculation Methods Based on Data from the Three Generations Health Program in Hungary

 ,
,
Abstract
:1. Introduction
2. Materials and Methods
2.1. Three Generations for Health Program
2.2. Calculation of Vascular Age Using the Framingham Risk Score
2.3. Calculation of Vascular Age Using the Systematic Coronary Risk Evaluation (SCORE) Risk Score
2.4. Calculation of ePWV
2.5. Supernormal, Normal, and Early Vascular Ageing
2.6. Statistical Analysis
3. Results
- -
- Age difference < −2 years: SCORE−, FRS−: supernormal vascular ageing;
- -
- Age difference between −2 and 2 years: SCORE normal, FRS normal: normal vascular ageing;
- -
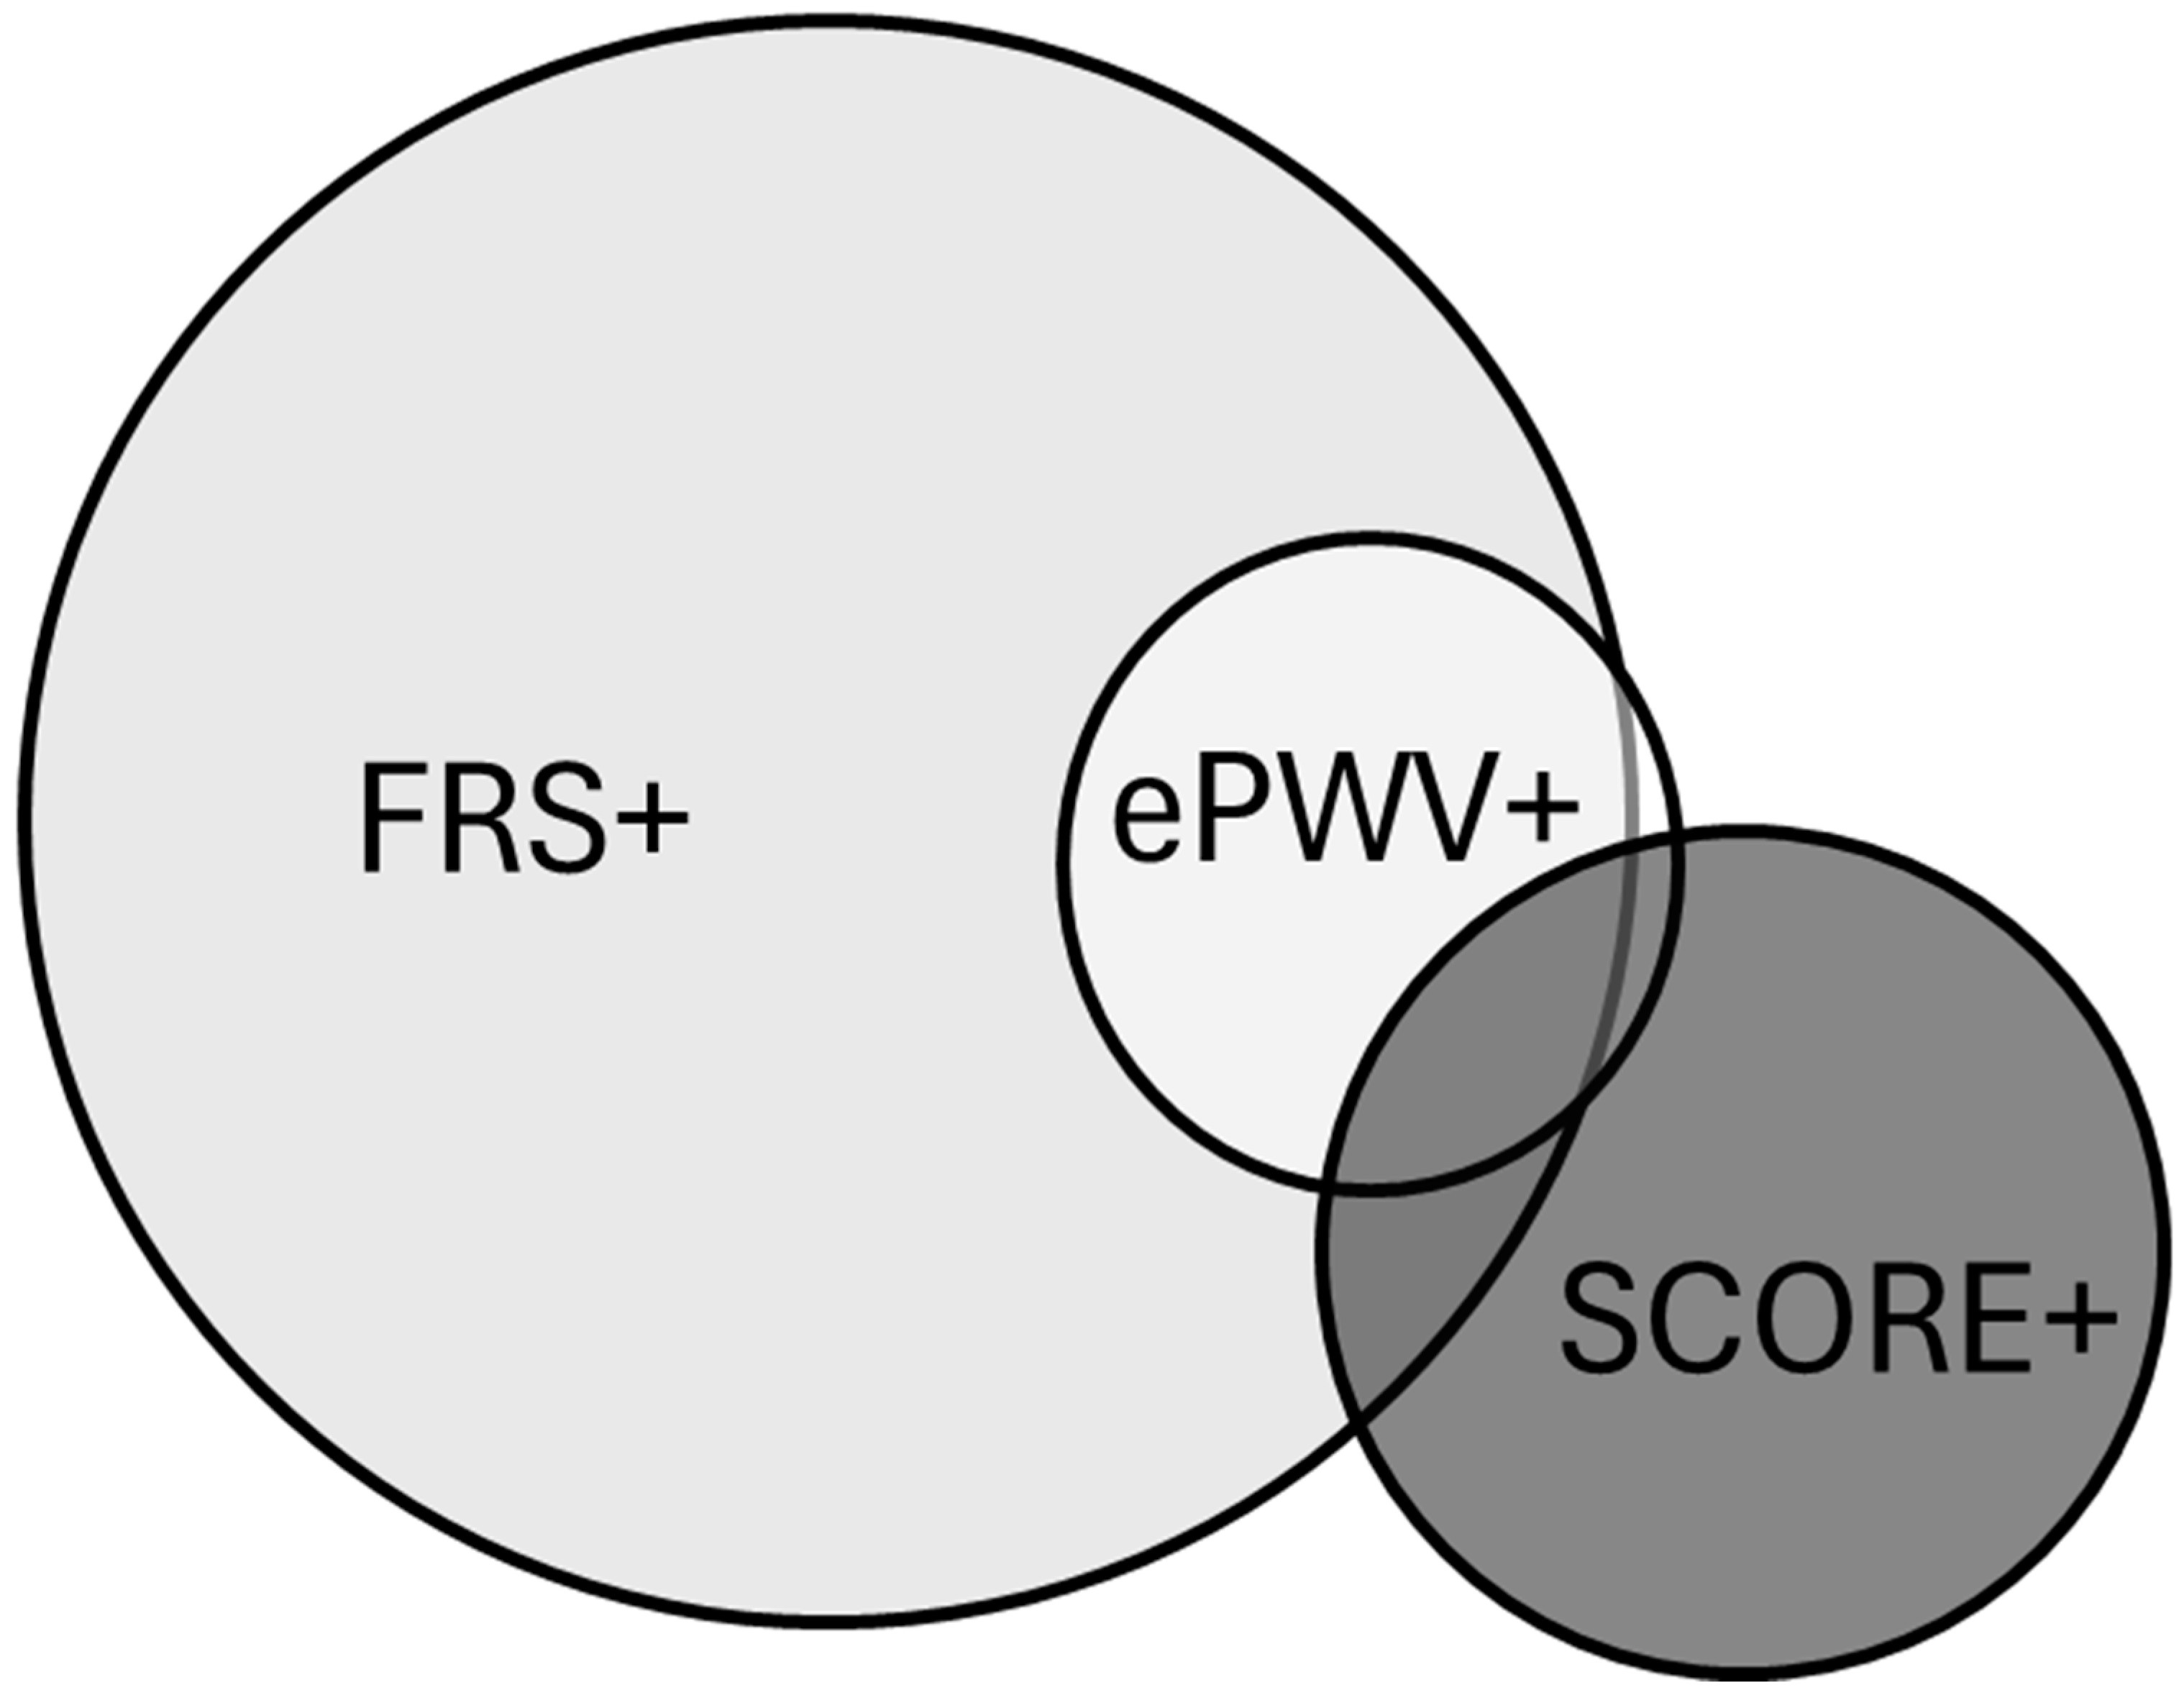
- Age difference > 2 years: SCORE+, FRS+: early vascular ageing.
4. Discussion
5. Conclusions
Author Contributions
Funding
Informed Consent Statement
Data Availability Statement
Acknowledgments
Conflicts of Interest
References
- Ettehad, D.; Emdin, C.A.; Kiran, A.; Anderson, S.G.; Callender, T.; Emberson, J.; Chalmers, J.; Rodgers, A.; Rahimi, K. Blood pressure lowering for prevention of cardiovascular disease and death: A systematic review and meta-analysis. Lancet 2016, 387, 957–967. [Google Scholar] [CrossRef] [PubMed]
- D’Agostino, R.B., Sr.; Vasan, R.S.; Pencina, M.J.; Wolf, P.A.; Cobain, M.; Massaro, J.M.; Kannel, W.B. General cardiovascular risk profile for use in primary care: The Framingham Heart Study. Circulation 2008, 117, 743–753. [Google Scholar] [CrossRef] [PubMed]
- Conroy, R.M.; Pyörälä, K.; Fitzgerald, A.P.; Sans, S.; Menotti, A.; De Backer, G.; De Bacquer, D.; Ducimetière, P.; Jousilahti, P.; Keil, U.; et al. Estimation of ten-year risk of fatal cardiovascular disease in Europe: The SCORE project. Eur. Heart J. 2003, 24, 987–1003. [Google Scholar] [CrossRef] [PubMed]
- Cuende, J.I.; Cuende, N.; Calaveras-Lagartos, J. How to calculate vascular age with the SCORE project scales: A new method of cardiovascular risk evaluation. Eur. Heart J. 2010, 31, 2351–2358. [Google Scholar] [CrossRef] [PubMed]
- Vlachopoulos, C.; Terentes-Printzios, D.; Laurent, S.; Nilsson, P.M.; Protogerou, A.D.; Aznaouridis, K.; Xaplanteris, P.; Koutagiar, I.; Tomiyama, H.; Yamashina, A.; et al. Association of Estimated Pulse Wave Velocity with Survival: A Secondary Analysis of SPRINT. JAMA Netw. Open 2019, 2, e1912831. [Google Scholar] [CrossRef]
- Gyöngyösi, H.; Kőrösi, B.; Batta, D.; Nemcsik-Bencze, Z.; László, A.; Tislér, A.; Cseprekál, O.; Torzsa, P.; Eörsi, D.; Nemcsik, J. Comparison of Different Cardiovascular Risk Score and Pulse Wave Velocity-Based Methods for Vascular Age Calculation. Hear. Lung Circ. 2021, 30, 1744–1751. [Google Scholar] [CrossRef]
- Available online: https://gokvi.hu/harom-generacioval-az-egeszsegert-program-kardiovaszkularis-prevencio-az-alapellatasban (accessed on 1 February 2022).
- Greve, S.V.; Blicher, M.K.; Kruger, R.; Sehestedt, T.; Gram-Kampmann, E.; Rasmussen, S.; Vishram, J.K.; Boutouyrie, P.; Laurent, S.; Olsen, M.H. Estimated carotid-femoral pulse wave velocity has similar predictive value as measured carotid-femoral pulse wave velocity. J. Hypertens. 2016, 34, 1279–1289. [Google Scholar] [CrossRef]
- Reference Values for Arterial Stiffness’ Collaboration. Determinants of pulse wave velocity in healthy people and in the presence of cardiovascular risk factors: ‘Establishing normal and reference values’. Eur. Heart J. 2010, 31, 2338–2350. [Google Scholar] [CrossRef]
- Bruno, R.M.; Nilsson, P.M.; Engström, G.; Wadström, B.N.; Empana, J.P.; Boutouyrie, P.; Laurent, S. Early and Supernormal Vascular Aging: Clinical Characteristics and Association with Incident Cardiovascular Events. Hypertension 2020, 76, 1616–1624. [Google Scholar] [CrossRef]
- Vecsey-Nagy, M.; Szilveszter, B.; Kolossváry, M.; Boussoussou, M.; Vattay, B.; Merkely, B.; Maurovich-Horvat, P.; Radovits, T.; Nemcsik, J. Correlation between Coronary Artery Calcium- and Different Cardiovascular Risk Score-Based Methods for the Estimation of Vascular Age in Caucasian Patients. J. Clin. Med. 2022, 11, 1111. [Google Scholar] [CrossRef]
- Kozakova, M.; Morizzo, C.; Jamagidze, G.; Chiappino, D.; Palombo, C. Comparison between Carotid Distensibility-Based Vascular Age and Risk-Based Vascular Age in Middle-Aged Population Free of Cardiovascular Disease. J. Clin. Med. 2022, 11, 4931. [Google Scholar] [CrossRef] [PubMed]
- Yurdadogan, T.; Malsch, C.; Kotseva, K.; Wood, D.; Leyh, R.; Ertl, G.; Karmann, W.; Müller-Scholden, L.; Morbach, C.; Breunig, M.; et al. Functional versus morphological assessment of vascular age in patients with coronary heart disease. Sci. Rep. 2021, 11, 18164. [Google Scholar] [CrossRef] [PubMed]
- Sigl, M.; Winter, L.; Schumacher, G.; Helmke, S.C.; Shchetynska-Marinova, T.; Amendt, K.; Duerschmied, D.; Hohneck, A.L. Comparison of Functional and Morphological Estimates of Vascular Age. Vivo 2023, 37, 2178–2187. [Google Scholar] [CrossRef] [PubMed]
- Bonner, C.; Jansen, J.; Newell, B.R.; Irwig, L.; Teixeira-Pinto, A.; Glasziou, P.; Doust, J.; McKinn, S.; McCaffery, K. Is the “Heart Age” Concept Helpful or Harmful Compared to Absolute Cardiovascular Disease Risk? An Experimental Study. Med. Decis. Mak. 2015, 35, 967–978. [Google Scholar] [CrossRef] [PubMed]
- Climie, R.E.; Alastruey, J.; Mayer, C.C.; Schwarz, A.; Laucyte-Cibulskiene, A.; Voicehovska, J.; Bianchini, E.; Bruno, R.M.; Charlton, P.H.; Grillo, A.; et al. Vascular ageing: Moving from bench towards bedside. Eur. J. Prev. Cardiol. 2023, 30, 1101–1117. [Google Scholar] [CrossRef] [PubMed]
- Visseren, F.L.J.; Mach, F.; Smulders, Y.M.; Carballo, D.; Koskinas, K.C.; Bäck, M.; Benetos, A.; Biffi, A.; Boavida, J.M.; Capodanno, D.; et al. 2021 ESC Guidelines on cardiovascular disease prevention in clinical practice: Developed by the Task Force for cardiovascular disease prevention in clinical practice with representatives of the European Society of Cardiology and 12 medical societies With the special contribution of the European Association of Preventive Cardiology (EAPC). Rev. Esp. Cardiol. 2022, 75, 429. [Google Scholar] [CrossRef] [PubMed]
- Mancia, G.; Kreutz, R.; Brunström, M.; Burnier, M.; Grassi, G.; Januszewicz, A.; Muiesan, M.L.; Tsioufis, K.; Agabiti-Rosei, E.; Algharably, E.A.E.; et al. 2023 ESH Guidelines for the management of arterial hypertension The Task Force for the management of arterial hypertension of the European Society of Hypertension: Endorsed by the International Society of Hypertension (ISH) and the European Renal Association (ERA). J. Hypertens. 2023, 41, 1874–2071. [Google Scholar] [CrossRef]
- Weber, T.; Wassertheurer, S.; Hametner, B.; Parragh, S.; Eber, B. Noninvasive methods to assess pulse wave velocity: Comparison with the invasive gold standard and relationship with organ damage. J. Hypertens. 2015, 33, 1023–1031. [Google Scholar] [CrossRef]
- Hametner, B.; Wassertheurer, S.; Mayer, C.C.; Danninger, K.; Binder, R.K.; Weber, T. Aortic Pulse Wave Velocity Predicts Cardiovascular Events and Mortality in Patients Undergoing Coronary Angiography: A Comparison of Invasive Measurements and Noninvasive Estimates. Hypertension 2021, 77, 571–581. [Google Scholar] [CrossRef]
- Salvi, P.; Furlanis, G.; Grillo, A.; Pini, A.; Salvi, L.; Marelli, S.; Rovina, M.; Moretti, F.; Gaetano, R.; Pintassilgo, I.; et al. Unreliable Estimation of Aortic Pulse Wave Velocity Provided by the Mobil-O-Graph Algorithm-Based System in Marfan Syndrome. J. Am. Heart Assoc. 2019, 8, e04028. [Google Scholar] [CrossRef]
- Vishram-Nielsen, J.K.K.; Laurent, S.; Nilsson, P.M.; Linneberg, A.; Sehested, T.S.G.; Greve, S.V.; Pareek, M.; Palmieri, L.; Giampaoli, S.; Donfrancesco, C.; et al. Does Estimated Pulse Wave Velocity Add Prognostic Information?: MORGAM Prospective Cohort Project. Hypertension 2020, 75, 1420–1428. [Google Scholar] [CrossRef] [PubMed]


| n | 99,231 |
| Age (years) | 54.0 (48.0–60.0) |
| Men (%) | 40,443 (40.8) |
| Women (%) | 58,788 (59.2) |
| Hypertension (%) | 49,191 (49.6) |
| Diabetes (%) | 15,921 (16.0) |
| Smoking (%) | 28,956 (29.2) |
| Systolic BP (mmHg) | 130.0 (122.0–130.0) |
| Diastolic BP (mmHg) | 80.0 (76.0–86.0) |
| ePWV (m/s) | 9.0 (8.1–10.0) |
| Cholesterol (mmol/L) | 5.4 (4.7–6.2) |
| HDL-cholesterol (mmol/L) | 1.4 (1.2–1.7) |
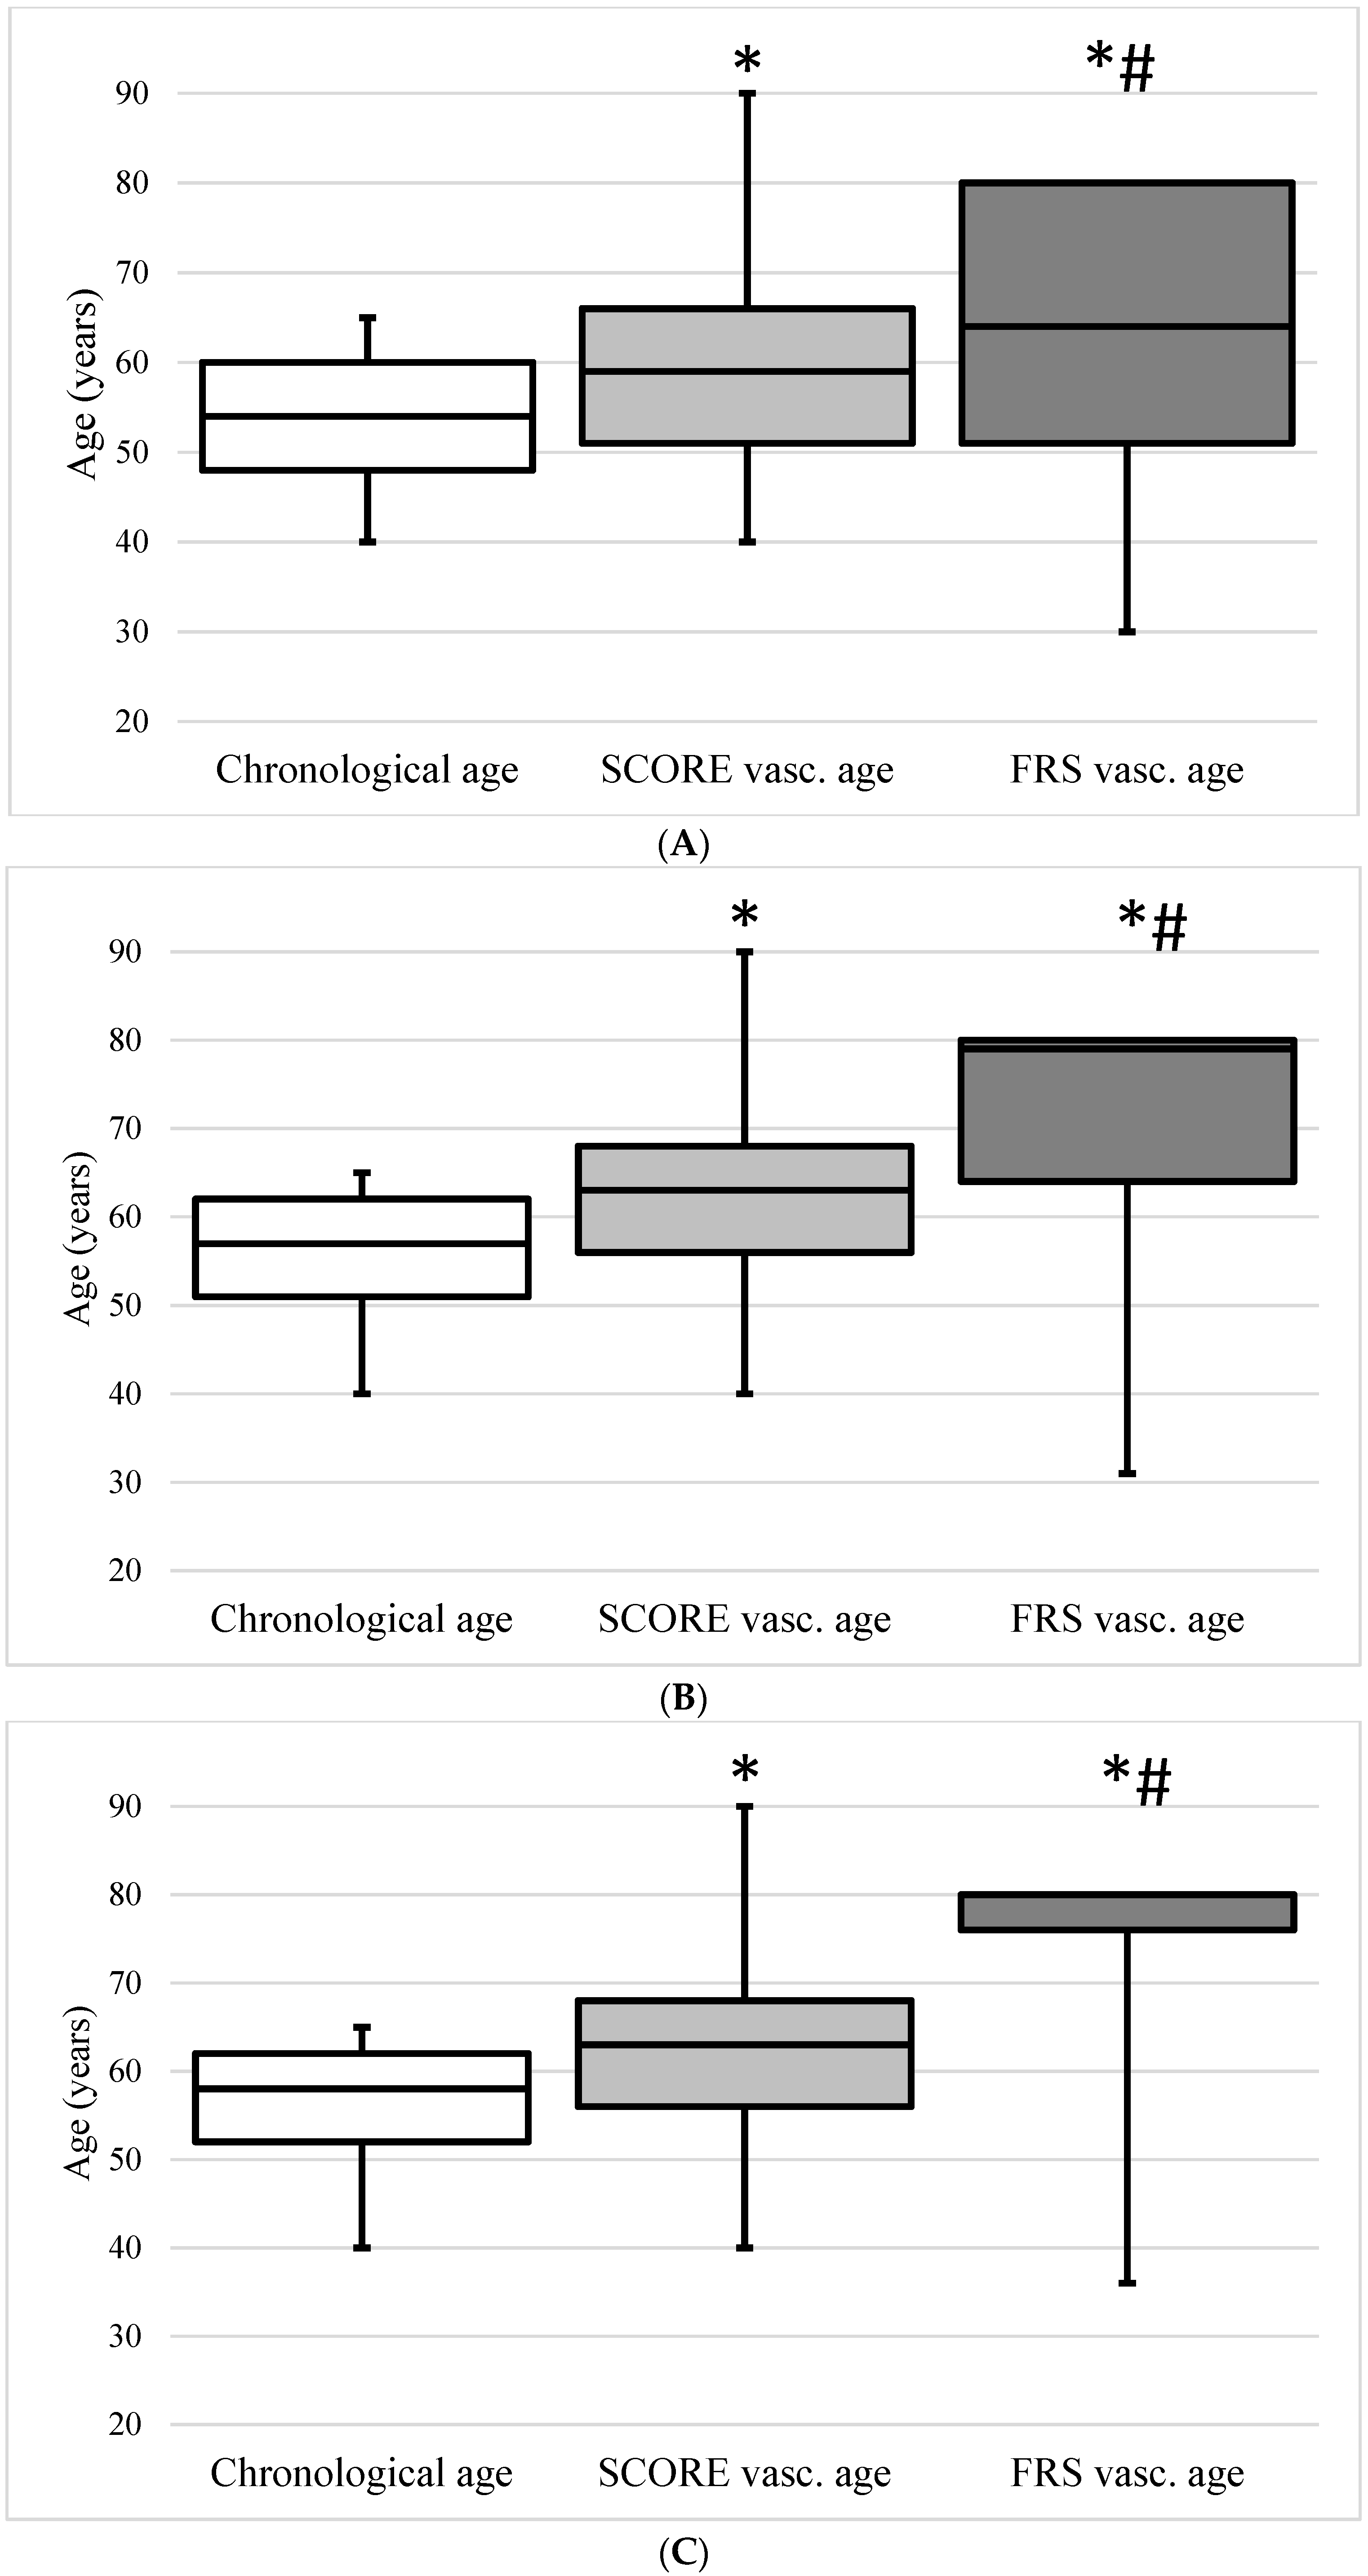
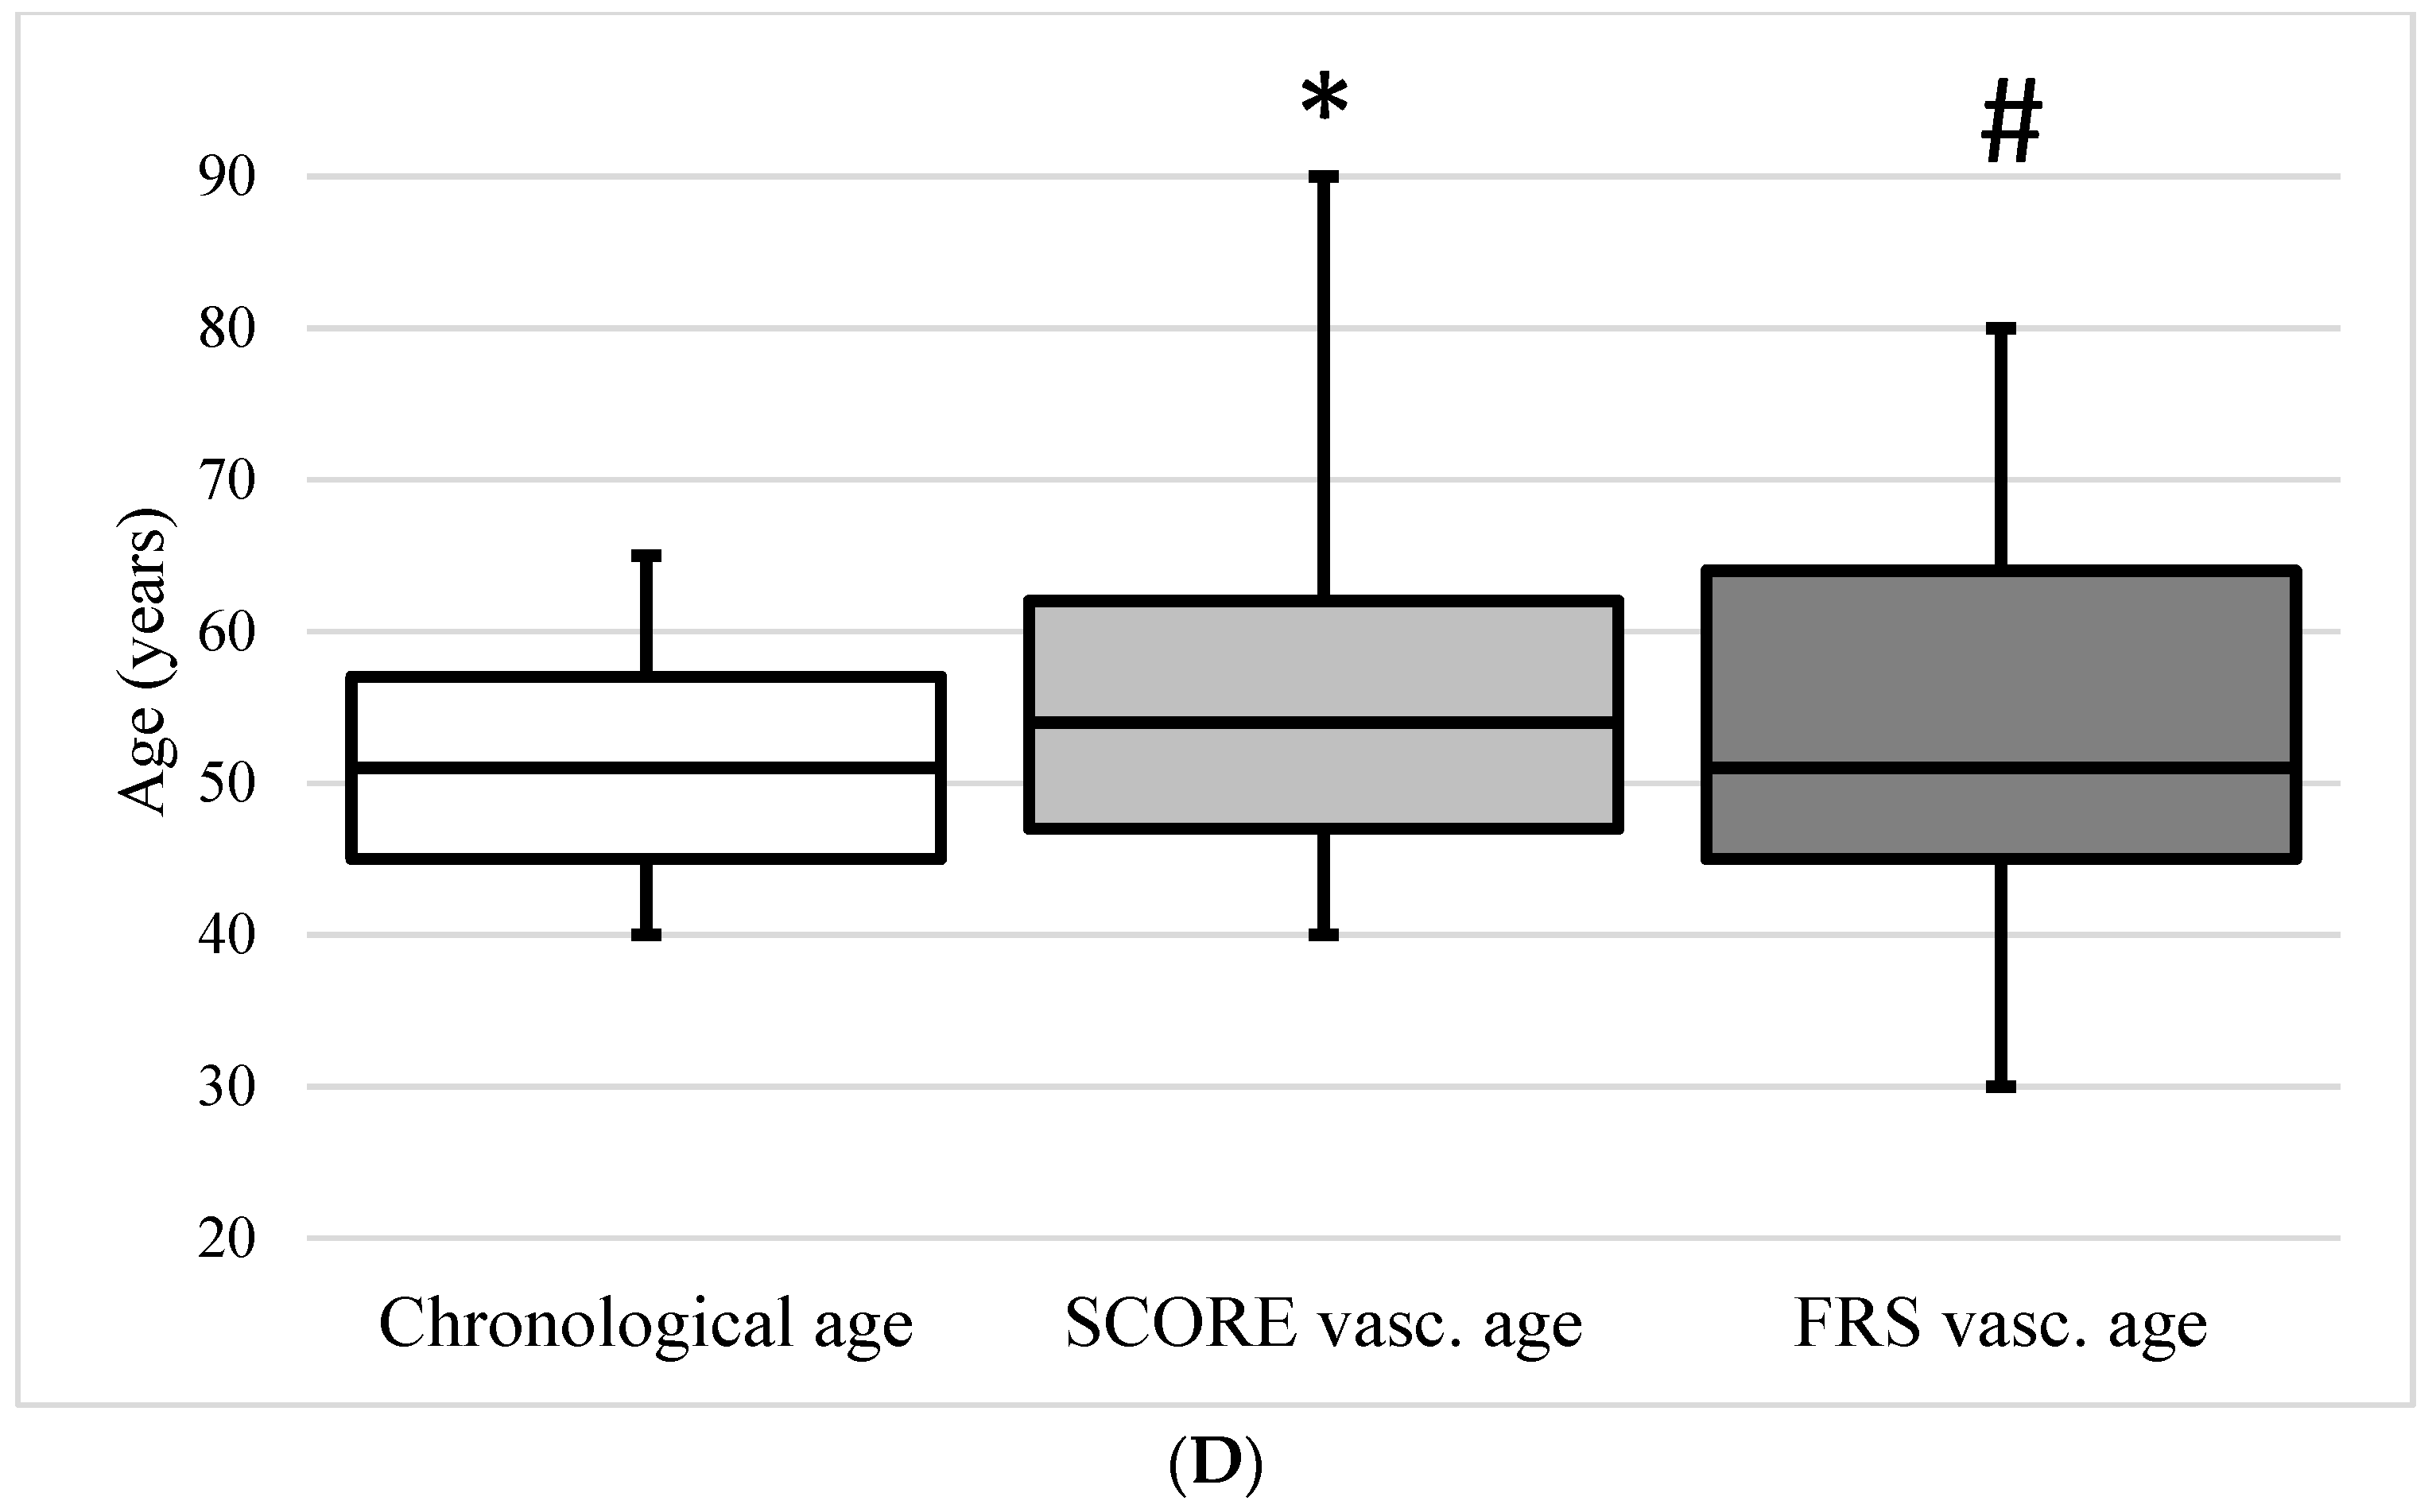
| Supernormal Vascular Aging | Normal Vascular Aging | Early Vascular Aging | |
|---|---|---|---|
| N (%) | 10,557 (10.6) | 78,855 (79.5) | 9819 (9.9) |
| Men (%) | 2671 (25.3) | 32,703 (41.5) | 5069 (51.6) |
| Women (%) | 7886 (74.7) | 46,152 (58.5) | 4750 (48.4) |
| Chronological age (years) | 51.0 (45.0–60.0) | 54.0 (48.0–61.0) | 57.0 (48.0–62.0) |
| SCORE vascular age (years) | 52.0 (46.0–60.0) | 59.0 (51.0–66.0) | 67.00 (58.0–74.0) |
| FRS vascular age (years) | 59.0 (48.0–80.0) | 64.0 (51.0–80.0) | 80.0 (68.0–80.0) |
| ePWV (m/s) | 7.80 (6.9–8.7) | 9.0 (8.2–9.9) | 10.6 (9.80–11.5) |
| Hypertension (%) | 2892 (27.4) | 39,436 (50.0) | 6863 (69.9) |
| Diabetes (%) | 935 (8.9) | 12,936 (16.4) | 2050 (20.9) |
| No hypertension or diabetes (%) | 7375 (69.8) | 36,757 (46.6) | 2718 (27.7) |
| Smoking (%) | 2844 (26.9) | 22,851 (29.0) | 3261 (33.2) |
| Systolic BP (mmHg) | 115.0 (110.0–120.0) | 130.0 (125.0–140.0) | 157.0 (150.0–167.0) |
| Diastolic BP (mmHg) | 70.0 (67.0–72.0) | 80.0 (78.0–85.0) | 95.00 (90.0–100.0) |
| Cholesterol (mmol/L) | 5.3 (4.6–6.1) | 5.4 (4.7–6.2) | 5.60 (4.81–6.40) |
| HDL-cholesterol (mmol/L) | 1.5 (1.2–1.8) | 1.40 (1.2–1.7) | 1.4 (1.2–1.7) |
| Supernormal Vascular Aging | Normal Vascular Aging | Early Vascular Aging | |
|---|---|---|---|
| FRS− (n %) | 5521 (52.3) | 13,077 (16.6) | 61 (0.1) |
| FRS normal (n %) | 1554 (14.7) | 8854 (11.2) | 200 (0.6) |
| FRS+ (n %) | 3482 (33) | 56,924 (72.2) | 9558 (97.3) |
| SCORE− (n %) | 2776 (26.3) | 47,742 (60.5) | 6915 (70.4) |
| SCORE normal (n %) | 1868 (17.7) | 13,742 (17.4) | 1600 (16.3) |
| SCORE+ (n %) | 5913 (56.0) | 17,371 (22.1) | 1304 (13.3) |
Disclaimer/Publisher’s Note: The statements, opinions and data contained in all publications are solely those of the individual author(s) and contributor(s) and not of MDPI and/or the editor(s). MDPI and/or the editor(s) disclaim responsibility for any injury to people or property resulting from any ideas, methods, instructions or products referred to in the content. |
© 2023 by the authors. Licensee MDPI, Basel, Switzerland. This article is an open access article distributed under the terms and conditions of the Creative Commons Attribution (CC BY) license (https://creativecommons.org/licenses/by/4.0/).
Share and Cite
Gyöngyösi, H.; Szőllősi, G.J.; Csenteri, O.; Jancsó, Z.; Móczár, C.; Torzsa, P.; Andréka, P.; Vajer, P.; Nemcsik, J. Differences between SCORE, Framingham Risk Score, and Estimated Pulse Wave Velocity-Based Vascular Age Calculation Methods Based on Data from the Three Generations Health Program in Hungary. J. Clin. Med. 2024, 13, 205. https://doi.org/10.3390/jcm13010205
Gyöngyösi H, Szőllősi GJ, Csenteri O, Jancsó Z, Móczár C, Torzsa P, Andréka P, Vajer P, Nemcsik J. Differences between SCORE, Framingham Risk Score, and Estimated Pulse Wave Velocity-Based Vascular Age Calculation Methods Based on Data from the Three Generations Health Program in Hungary. Journal of Clinical Medicine. 2024; 13(1):205. https://doi.org/10.3390/jcm13010205
Chicago/Turabian StyleGyöngyösi, Helga, Gergő József Szőllősi, Orsolya Csenteri, Zoltán Jancsó, Csaba Móczár, Péter Torzsa, Péter Andréka, Péter Vajer, and János Nemcsik. 2024. "Differences between SCORE, Framingham Risk Score, and Estimated Pulse Wave Velocity-Based Vascular Age Calculation Methods Based on Data from the Three Generations Health Program in Hungary" Journal of Clinical Medicine 13, no. 1: 205. https://doi.org/10.3390/jcm13010205
APA StyleGyöngyösi, H., Szőllősi, G. J., Csenteri, O., Jancsó, Z., Móczár, C., Torzsa, P., Andréka, P., Vajer, P., & Nemcsik, J. (2024). Differences between SCORE, Framingham Risk Score, and Estimated Pulse Wave Velocity-Based Vascular Age Calculation Methods Based on Data from the Three Generations Health Program in Hungary. Journal of Clinical Medicine, 13(1), 205. https://doi.org/10.3390/jcm13010205