
Combining Biomarkers for the Diagnosis of Metastatic Melanoma


 , ,
, , 
Abstract
1. Introduction
2. Materials and Methods
2.1. Study Population
2.2. Enzyme-Linked Immunosorbent Assay
2.3. Statistical Analysis
3. Results
3.1. Patients and Melanoma Characteristics
3.2. Univariate and Multivariate Analysis
3.3. Training Set and Validation Set
3.4. Diagnostic Effect of Biomarkers and the Combinations
4. Discussion
5. Conclusions
Supplementary Materials
Author Contributions
Funding
Institutional Review Board Statement
Informed Consent Statement
Data Availability Statement
Conflicts of Interest
References
- Che, G.; Huang, B.; Xie, Z.; Zhao, J.; Yan, Y.; Wu, J.; Sun, H.; Ma, H. Trends in Incidence and Survival in Patients with Melanoma, 1974–2013. Am. J. Cancer Res. 2019, 9, 1396–1414. [Google Scholar] [PubMed]
- Das, S.; Harris, L.G.; Metge, B.J.; Liu, S.; Riker, A.I.; Samant, R.S.; Shevde, L.A. The Hedgehog Pathway Transcription Factor Gli1 Promotes Malignant Behavior of Cancer Cells by up-Regulating Osteopontin. J. Biol. Chem. 2009, 284, 22888–22897. [Google Scholar] [CrossRef] [PubMed]
- Nikolaou, V.; Stratigos, A.J. Emerging Trends in the Epidemiology of Melanoma. Br. J. Dermatol. 2014, 170, 11–19. [Google Scholar] [CrossRef] [PubMed]
- Carr, S.; Smith, C.; Wernberg, J. Epidemiology and Risk Factors of Melanoma. Surg. Clin. N. Am. 2020, 100, 1–12. [Google Scholar] [CrossRef] [PubMed]
- Gershenwald, J.E.; Scolyer, R.A.; Hess, K.R.; Sondak, V.K.; Long, G.V.; Ross, M.I.; Lazar, A.J.; Faries, M.B.; Kirkwood, J.M.; McArthur, G.A.; et al. Melanoma Staging: Evidence-Based Changes in the American Joint Committee on Cancer Eighth Edition Cancer Staging Manual. CA Cancer J. Clin. 2017, 67, 472–492. [Google Scholar] [CrossRef] [PubMed]
- Balch, C.M.; Gershenwald, J.E.; Soong, S.J.; Thompson, J.F.; Atkins, M.B.; Byrd, D.R.; Buzaid, A.C.; Cochran, A.J.; Coit, D.G.; Ding, S.; et al. Final Version of 2009 Ajcc Melanoma Staging and Classification. J. Clin. Oncol. 2009, 27, 6199–6206. [Google Scholar] [CrossRef] [PubMed]
- Liszkay, G.; Benedek, A.; Polgár, C.; Oláh, J.; Holló, P.; Emri, G.; Csejtei, A.; Kenessey, I.; Polányi, Z.; Knollmajer, K.; et al. Significant Improvement in Melanoma Survival over the Last Decade: A Hungarian Nationwide Study between 2011 and 2019. J. Eur. Acad. Dermatol. Venereol. 2023, 37, 932–940. [Google Scholar] [CrossRef] [PubMed]
- Perrotta, R.; Bevelacqua, Y.; Malaguarnera, G.; Paladina, I.; Giordano, M.; Malaguarnera, M. Serum Markers of Cutaneous Melanoma. Front. Biosci. (Elite Ed.) 2010, 2, 1115–1122. [Google Scholar] [CrossRef][Green Version]
- Petrelli, F.; Cabiddu, M.; Coinu, A.; Borgonovo, K.; Ghilardi, M.; Lonati, V.; Barni, S. Prognostic Role of Lactate Dehydrogenase in Solid Tumors: A Systematic Review and Meta-Analysis of 76 Studies. Acta Oncol. 2015, 54, 961–970. [Google Scholar] [CrossRef]
- Beyeler, M.; Waldispuhl, S.; Strobel, K.; Joller-Jemelka, H.I.; Burg, G.; Dummer, R. Detection of Melanoma Relapse: First Comparative Analysis on Imaging Techniques Versus S100 Protein. Dermatology 2006, 213, 187–191. [Google Scholar] [CrossRef]
- Kiss, T.; Ecsedi, S.; Vizkeleti, L.; Koroknai, V.; Emri, G.; Kovács, N.; Adany, R.; Balazs, M. The Role of Osteopontin Expression in Melanoma Progression. Tumour Biol. 2015, 36, 7841–7847. [Google Scholar] [CrossRef] [PubMed]
- Kiss, T.; Jámbor, K.; Koroknai, V.; Szász, I.; Bárdos, H.; Mokánszki, A.; Ádány, R.; Balázs, M. Silencing Osteopontin Expression Inhibits Proliferation, Invasion and Induce Altered Protein Expression in Melanoma Cells. Pathol. Oncol. Res. 2021, 27, 581395. [Google Scholar] [CrossRef] [PubMed]
- Maier, T.; Laubender, R.P.; Sturm, R.A.; Klingenstein, A.; Korting, H.C.; Ruzicka, T.; Berking, C. Osteopontin Expression in Plasma of Melanoma Patients and in Melanocytic Tumors. J. Eur. Acad. Dermatol. Venereol. 2012, 26, 1084–1091. [Google Scholar] [CrossRef] [PubMed]
- Robert, C.; Grob, J.J.; Stroyakovskiy, D.; Karaszewska, B.; Hauschild, A.; Levchenko, E.; Chiarion Sileni, V.; Schachter, J.; Garbe, C.; Bondarenko, I.; et al. Five-Year Outcomes with Dabrafenib Plus Trametinib in Metastatic Melanoma. N. Engl. J. Med. 2019, 381, 626–636. [Google Scholar] [CrossRef] [PubMed]
- Ascierto, P.A.; Dréno, B.; Larkin, J.; Ribas, A.; Liszkay, G.; Maio, M.; Mandalà, M.; Demidov, L.; Stroyakovskiy, D.; Thomas, L.; et al. 5-Year Outcomes with Cobimetinib Plus Vemurafenib in Brafv600 Mutation-Positive Advanced Melanoma: Extended Follow-up of the Cobrim Study. Clin. Cancer Res. 2021, 27, 5225–5235. [Google Scholar] [CrossRef] [PubMed]
- Wolchok, J.D.; Chiarion-Sileni, V.; Gonzalez, R.; Grob, J.J.; Rutkowski, P.; Lao, C.D.; Cowey, C.L.; Schadendorf, D.; Wagstaff, J.; Dummer, R.; et al. Long-Term Outcomes with Nivolumab Plus Ipilimumab or Nivolumab Alone Versus Ipilimumab in Patients with Advanced Melanoma. J. Clin. Oncol. 2022, 40, 127–137. [Google Scholar] [CrossRef] [PubMed]
- Pozsgai, M.; Németh, K.; Oláh, P.; Gyulai, R.; Lengyel, Z. The Significance of Imaging Examinations During Follow-up for Malignant Melanoma. Eur. J. Dermatol. 2021, 31, 357–363. [Google Scholar] [CrossRef]
- Henry, L.; Fabre, C.; Guiraud, I.; Bastide, S.; Fabbro-Peray, P.; Martinez, J.; Lavabre-Bertrand, T.; Meunier, L.; Stoebner, P.E. Clinical Use of P-Proteasome in Discriminating Metastatic Melanoma Patients: Comparative Study with Ldh, Mia and S100b Protein. Int. J. Cancer 2013, 133, 142–148. [Google Scholar] [CrossRef]
- Bánfalvi, T.; Edesné, M.B.; Gergye, M.; Udvarhelyi, N.; Orosz, Z.; Gilde, K.; Kremmer, T.; Ottó, S.; Tímár, J. Laboratory Markers of Melanoma Progression. Magy. Onkol. 2003, 47, 89–104. [Google Scholar]
- Karagiannis, P.; Fittall, M.; Karagiannis, S.N. Evaluating Biomarkers in Melanoma. Front. Oncol. 2014, 4, 383. [Google Scholar] [CrossRef]
- Tandler, N.; Mosch, B.; Pietzsch, J. Protein and Non-Protein Biomarkers in Melanoma: A Critical Update. Amino Acids 2012, 43, 2203–2230. [Google Scholar] [CrossRef] [PubMed]
- Neuss, H.; Koplin, G.; Raue, W.; Reetz, C.; Mall, J.W. Analysing the Serum Levels of Tumor Markers and Primary Tumor Data in Stage Iii Melanoma Patients in Correlation to the Extent of Lymph Node Metastases—A Prospective Study in 231 Patients. Acta Chir. Belg. 2011, 111, 214–218. [Google Scholar] [CrossRef] [PubMed]
- Heizmann, C.W. S100 Proteins: Diagnostic and Prognostic Biomarkers in Laboratory Medicine. Biochim. Biophys. Acta (BBA)—Mol. Cell Res. 2019, 1866, 1197–1206. [Google Scholar] [CrossRef] [PubMed]
- Gebhardt, C.; Lichtenberger, R.; Utikal, J. Biomarker Value and Pitfalls of Serum S100b in the Follow-up of High-Risk Melanoma Patients. J. Der Dtsch. Dermatol. Ges. 2016, 14, 158–164. [Google Scholar] [CrossRef] [PubMed]
- Aceti, A.; Margarucci, L.M.; Scaramucci, E.; Orsini, M.; Salerno, G.; Di Sante, G.; Gianfranceschi, G.; Di Liddo, R.; Valeriani, F.; Ria, F.; et al. Serum S100b Protein as a Marker of Severity in COVID-19 Patients. Sci. Rep. 2020, 10, 18665. [Google Scholar] [CrossRef] [PubMed]
- Peric, B.; Zagar, I.; Novakovic, S.; Zgajnar, J.; Hocevar, M. Role of Serum S100b and Pet-Ct in Follow-up of Patients with Cutaneous Melanoma. BMC Cancer 2011, 11, 328. [Google Scholar] [CrossRef] [PubMed]
- Mocellin, S.; Zavagno, G.; Nitti, D. The Prognostic Value of Serum S100b in Patients with Cutaneous Melanoma: A Meta-Analysis. Int. J. Cancer 2008, 123, 2370–2376. [Google Scholar] [CrossRef]
- Dummer, R.; Hauschild, A.; Lindenblatt, N.; Pentheroudakis, G.; Keilholz, U. Cutaneous Melanoma: Esmo Clinical Practice Guidelines for Diagnosis, Treatment and Follow-Up. Ann. Oncol. 2015, 26 (Suppl. S5), v126–v132. [Google Scholar] [CrossRef]
- Coit, D.G.; Thompson, J.A.; Albertini, M.R.; Barker, C.; Carson, W.E.; Contreras, C.; Daniels, G.A.; DiMaio, D.; Fields, R.C.; Fleming, M.D.; et al. Cutaneous Melanoma, Version 2.2019, Nccn Clinical Practice Guidelines in Oncology. J. Natl. Compr. Cancer Netw. 2019, 17, 367–402. [Google Scholar] [CrossRef]
- Revythis, A.; Shah, S.; Kutka, M.; Moschetta, M.; Ozturk, M.A.; Pappas-Gogos, G.; Ioannidou, E.; Sheriff, M.; Rassy, E.; Boussios, S. Unraveling the Wide Spectrum of Melanoma Biomarkers. Diagnostics 2021, 11, 1341. [Google Scholar] [CrossRef]
- Janka, E.A.; Várvölgyi, T.; Sipos, Z.; Soós, A.; Hegyi, P.; Kiss, S.; Dembrovszky, F.; Csupor, D.; Kéringer, P.; Pécsi, D.; et al. Predictive Performance of Serum S100b Versus Ldh in Melanoma Patients: A Systematic Review and Meta-Analysis. Front. Oncol. 2021, 11, 772165. [Google Scholar] [CrossRef] [PubMed]
- Zhao, H.; Chen, Q.; Alam, A.; Cui, J.; Suen, K.C.; Soo, A.P.; Eguchi, S.; Gu, J.; Ma, D. The Role of Osteopontin in the Progression of Solid Organ Tumor. Cell Death Dis. 2018, 9, 356. [Google Scholar] [CrossRef] [PubMed]
- Bandopadhyay, M.; Bulbule, A.; Butti, R.; Chakraborty, G.; Ghorpade, P.; Ghosh, P.; Gorain, M.; Kale, S.; Kumar, D.; Kumar, S.; et al. Osteopontin as a Therapeutic Target for Cancer. Expert Opin. Ther. Targets 2014, 18, 883–895. [Google Scholar] [CrossRef] [PubMed]
- Filia, A.; Elliott, F.; Wind, T.; Field, S.; Davies, J.; Kukalizch, K.; Randerson-Moor, J.; Harland, M.; Bishop, D.T.; Banks, R.E.; et al. Plasma Osteopontin Concentrations in Patients with Cutaneous Melanoma. Oncol. Rep. 2013, 30, 1575–1580. [Google Scholar] [CrossRef]


| Patients N = 206 | Training Set N = 138 | Validation Set N = 68 | |||||||
|---|---|---|---|---|---|---|---|---|---|
| Variables | Non-Metastatic N = 120 | Metastatic N = 86 | p-Value | Non-Metastatic N = 80 | Metastatic N = 58 | p-Value | Non-Metastatic N = 40 | Metastatic N = 28 | p-Value |
| Melanoma patients | |||||||||
| Age (years) (mean ± SD) | 61.00 ± 12.28 | 64.14 ± 11.68 | 0.092 | 60.86 ± 12.15 | 64.67 ± 12.56 | 0.076 | 61.15 ± 12.73 | 63.96 ± 9.53 | 0.754 |
| Sex, N (%) | 0.317 | 0.493 | 0.444 | ||||||
| Male | 67 (55.8) | 54 (62.8) | 45 (56.3) | 36 (62.1) | 22 (55.0) | 18 (64.3) | |||
| Female | 53 (44.2) | 32 (37.2) | 35 (43.7) | 22 (37.9) | 18 (45.0) | 10 (35.7) | |||
| Primary melanoma | |||||||||
| Localization, N (%) | 0.108 | 0.007 | 0.395 | ||||||
| Head and neck | 16 (13.3) | 11 (12.8) | 14 (17.5) | 6 (10.3) | 2 (5.0) | 5 (17.9) | |||
| Upper extremities | 33 (27.5) | 28 (32.6) | 19 (23.7) | 20 (34.5) | 14 (35.0) | 8 (28.6) | |||
| Lower extremities | 21 (17.5) | 24 (27.9) | 13 (16.3) | 20 (34.5) | 8 (20.0) | 4 (14.3) | |||
| Trunk | 50 (41.7) | 23 (26.7) | 34 (42.5) | 12 (20.7) | 16 (40.0) | 11 (39.2) | |||
| Histological subtype, N (%) | 0.019 | 0.098 | 0.130 | ||||||
| SSM | 44 (22.5) | 16 (30.2) | 28 (35.0) | 11 (19.0) | 16 (40.0) | 5 (17.9) | |||
| NM | 49 (40.8) | 44 (51.2) | 33 (41.3) | 27 (46.6) | 16 (40.0) | 17 (60.7) | |||
| MM | 27 (36.7) | 26 (18.6) | 19 (23.7) | 20 (34.4) | 8 (20.0) | 6 (21.4) | |||
| Clark level, N (%) | 0.012 | 0.024 | 0.344 | ||||||
| II | 10 (8.3) | 2 (2.3) | 7 (8.8) | 2 (3.4) | 3 (7.5) | 0 (0.0) | |||
| III | 50 (41.7) | 27 (31.4) | 31 (38.7) | 18 (31.0) | 19 (47.5) | 9 (32.1) | |||
| IV | 42 (35.0) | 23 (26.8) | 31 (38.7) | 15 (25.9) | 11 (27.5) | 8 (28.6) | |||
| V | 10 (8.3) | 18 (20.9) | 4 (5.0) | 11 (19.0) | 6 (15.0) | 7 (25.0) | |||
| Unknown | 8 (6.7) | 16 (18.6) | 7 (8.8) | 12 (20.7) | 1 (2.5) | 4 (14.3) | |||
| AJCC 8th edition pT Category, N (%) | <0.001 | 0.001 | 0.061 | ||||||
| pT1a-T2a | 43 (35.8) | 8 (9.3) | 30 (37.5) | 6 (10.3) | 13 (32.5) | 2 (7.1) | |||
| pT2b-T3a | 18 (15.0) | 14 (16.3) | 11 (13.7) | 10 (17.2) | 7 (17.5) | 4 (14.3) | |||
| pT3b-T4a | 25 (20.8) | 18 (20.9) | 18 (22.5) | 12 (20.7) | 7 (17.5) | 6 (21.4) | |||
| pT4b | 34 (28.4) | 46 (53.5) | 21 (26.3) | 30 (51.7) | 13 (32.5) | 16 (57.1) | |||
| BRAF mutation | |||||||||
| BRAF | 0.375 | 0.141 | 0.578 | ||||||
| Wild type | 33 (27.5) | 53 (61.6) | 21 (26.2) | 39 (67.2) | 12 (30.0) | 14 (50.0) | |||
| V600E/K | 27 (22.5) | 32 (37.2) | 19 (23.8) | 19 (32.8) | 8 (20.0) | 13 (46.4) | |||
| Unknown | 60 (50.0) | 1 (1.1) | 40 (50.0) | 0 | 20 (50.0) | 1 (3.6) | |||
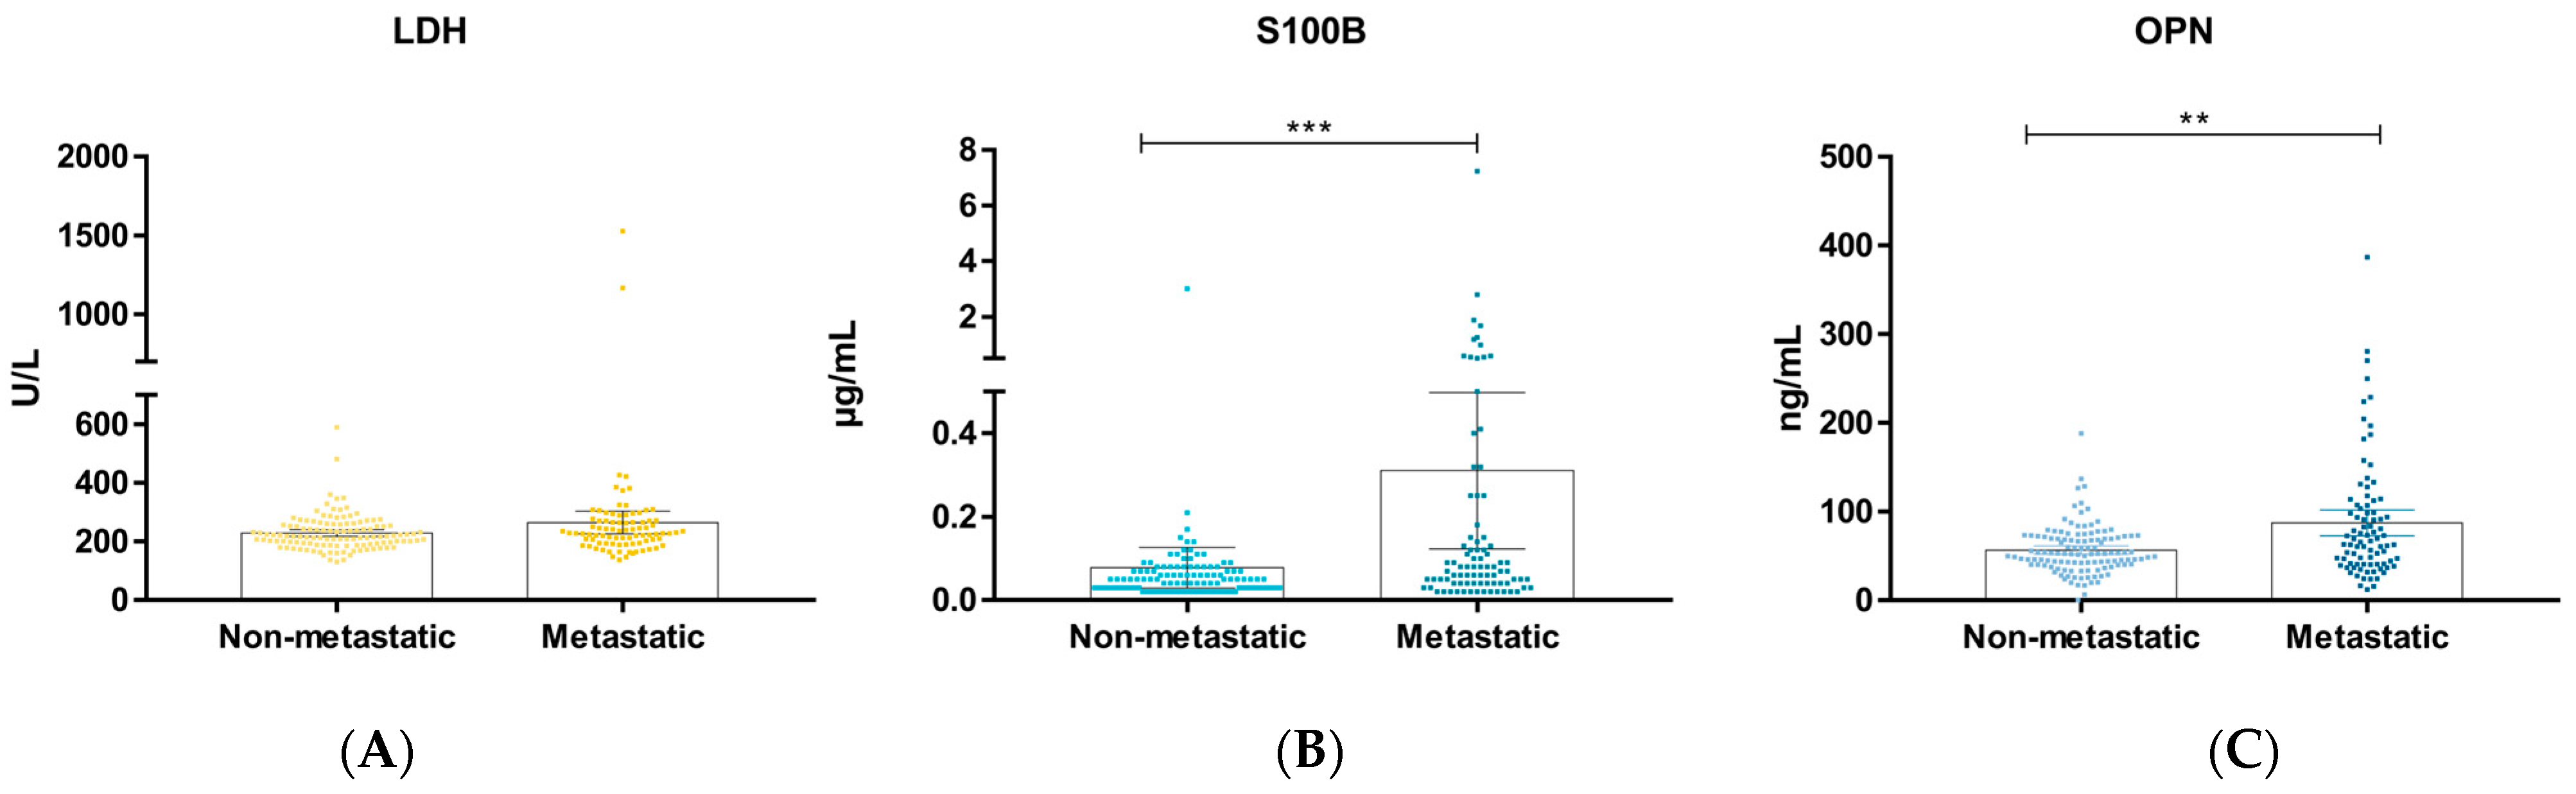
| Biomarkers | |||||||||
| LDH (U/L) (mean ± SD) | 229.10 ± 61.55 | 264.63 ± 180.55 | 0.107 | 228.45 ± 55.28 | 279.52 ± 215.51 | 0.132 | 230.70 ± 73.25 | 233.79 ± 55.78 | 0.380 |
| S100B (µg/mL) (mean ± SD) | 0.08 ± 0.27 | 0.31 ± 0.87 | <0.001 | 0.09 ± 0.33 | 0.34 ± 1.01 | <0.001 | 0.05 ± 0.03 | 0.25 ± 0.48 | 0.010 |
| OPN (ng/mL) (mean ± SD) | 56.63 ± 27.09 | 87.33 ± 67.64 | 0.002 | 55.65 ± 28.30 | 86.89 ± 73.67 | 0.019 | 58.59 ± 24.70 | 88.26 ± 54.27 | 0.046 |
| Univariate Logistic Regression Model | Multivariate Logistic Regression Model | ||||
|---|---|---|---|---|---|
| Variables | Categories | OR [95% CI] | p-Value | OR [95% CI] | p-Value |
| Age | ≥60 years/<60 years | 1.22 [0.69; 2.17] | 0.487 | - | |
| Sex | male/female | 1.34 [0.76; 2.35] | 0.318 | - | |
| Localization of primary tumor | head and neck/trunk | 1.50 [0.60; 3.72] | 0.388 | 2.14 [0.73; 6.26] | 0.166 |
| upper extremities/trunk | 1.85 [0.91; 3.73] | 0.089 | 2.30 [0.99; 5.34] | 0.052 | |
| lower extremities/trunk | 2.48 [1.16; 5.35] | 0.020 | 2.80 [1.14; 6.90] | 0.025 | |
| Histological subtype | SSM/MM | 0.38 [0.17; 1.10] | 0.065 | - | |
| NM/MM | 0.93 [0.48; 1.83] | 0.839 | |||
| Clark level | III/II | 2.70 [0.55; 13.22] | 0.220 | - | |
| IV/II | 2.74 [0.55; 13.58] | 0.218 | |||
| V/II | 9.00 [0.86; 49.47] | 0.110 | |||
| AJCC 8th edition pT category | pT2b-T3a/pT1a-T2a | 4.18 [1.50; 11.69] | 0.006 | 4.18 [1.25; 14.02] | 0.020 |
| pT3b-T4a/pT1a-T2a | 3.87 [1.47; 10.19] | 0.006 | 4.09 [1.32; 12.70] | 0.015 | |
| pT4b/pT1a-T2a | 7.27 [3.03; 17.45] | <0.001 | 9.86 [3.51; 27.67] | <0.001 | |
| BRAF | V600E/K/wild type | 0.74 [0.38; 1.45] | 0.375 | - | |
| S100B | 3.29 [1.81; 5.98] | <0.001 | 2.30 [1.14; 4.63] | 0.020 | |
| LDH | 2.55 [1.17; 5.59] | 0.019 | 1.91 [0.72; 5.06] | 0.193 | |
| OPN | 4.95 [2.45; 10.02] | <0.001 | 5.13 [2.21; 11.91] | <0.001 | |
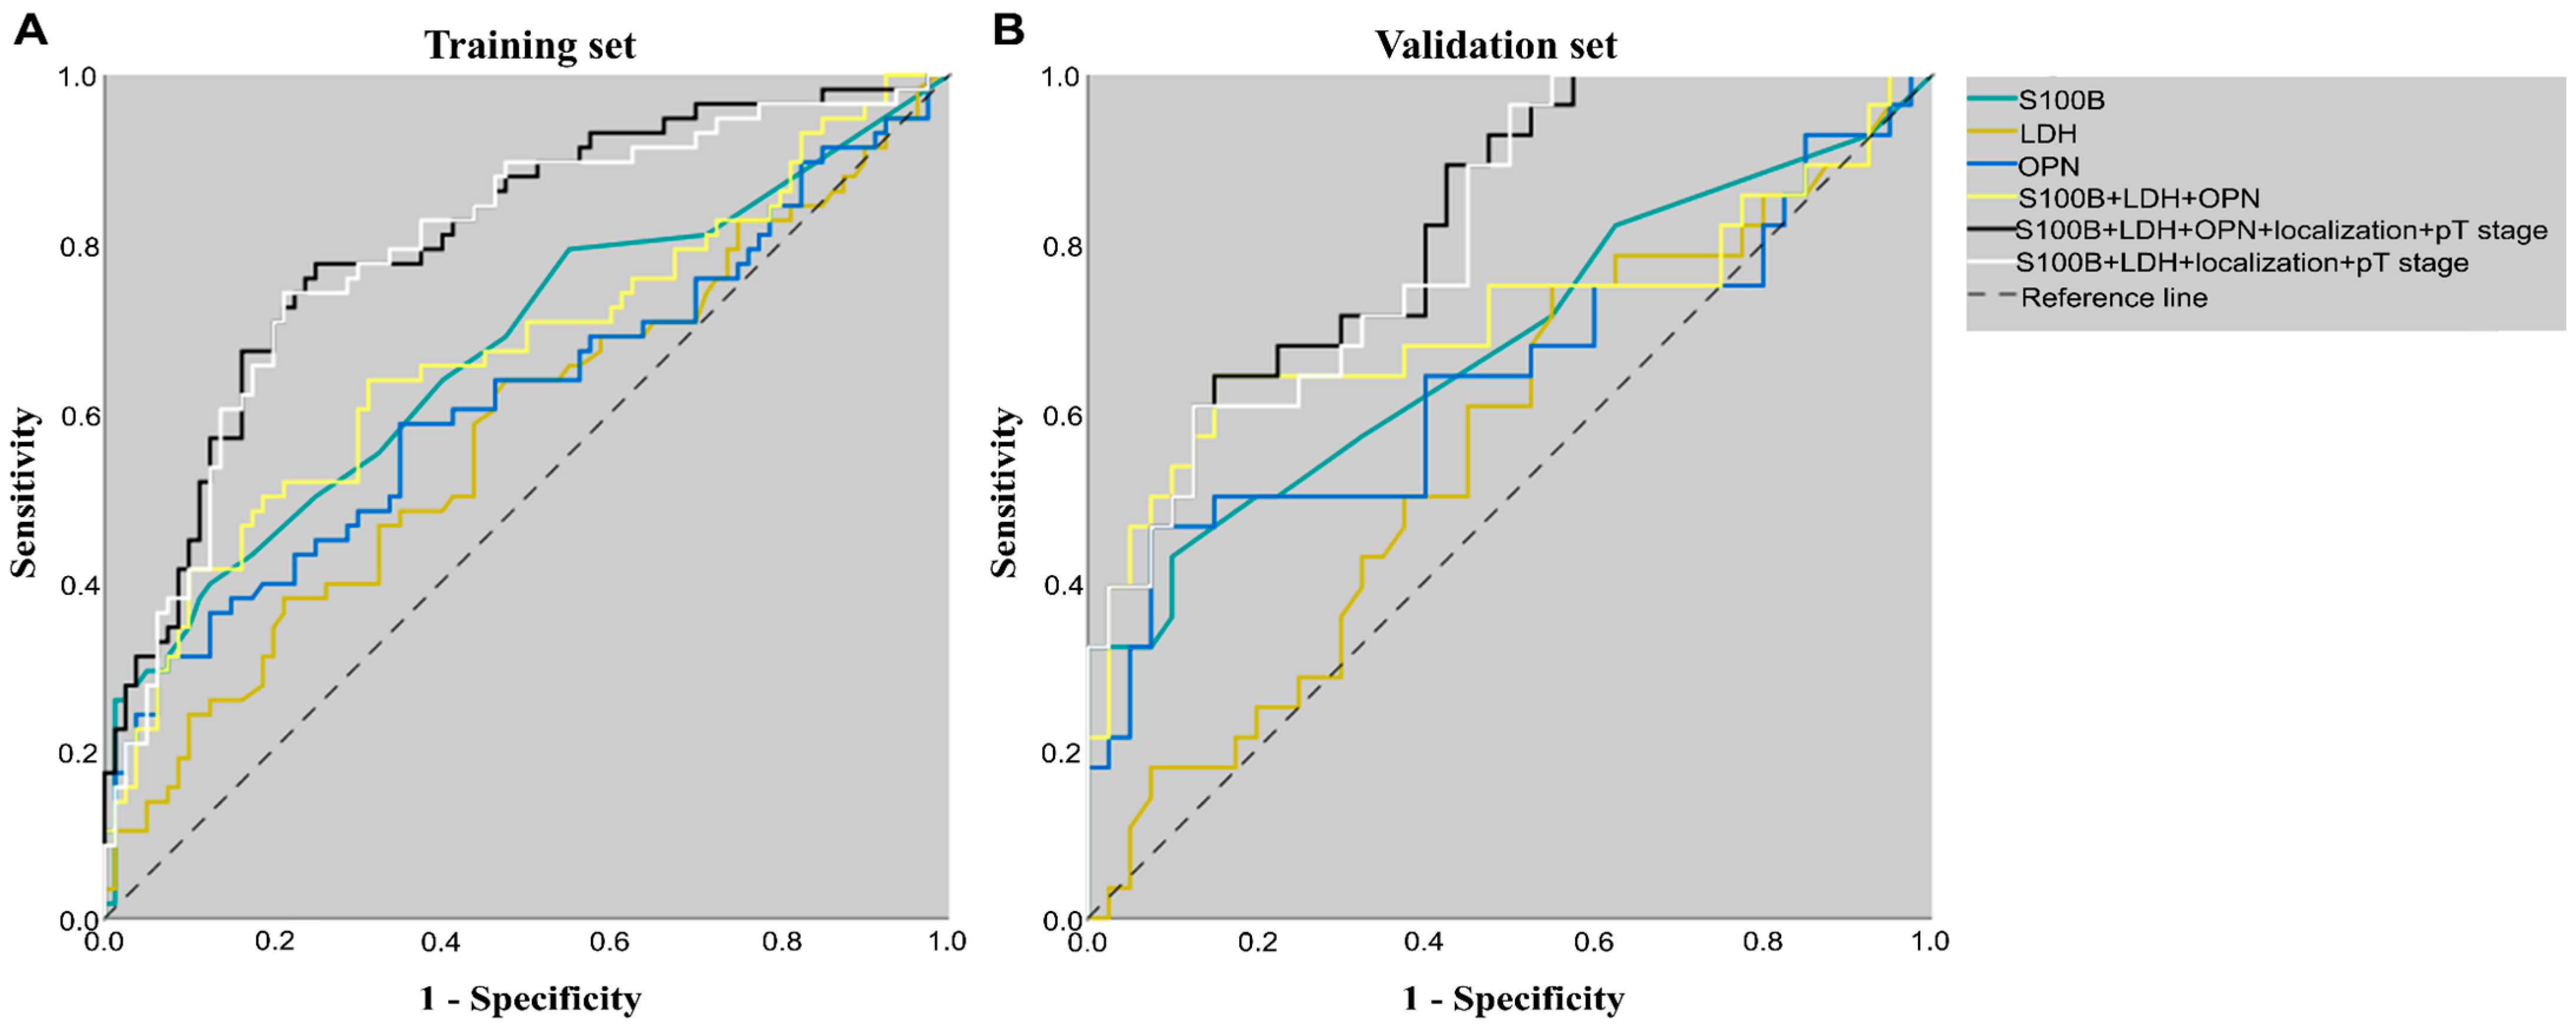
| Training Set | Validation Set | ||||||||||||
|---|---|---|---|---|---|---|---|---|---|---|---|---|---|
| Variables | Cut-Off | AUROC [95% CI] p-Value | Sensitivity [95% CI] | Specificity [95% CI] | PPV [95% CI] | NPV [95% CI] | Diagnostic Accuracy [95% CI] | AUROC [95% CI] p-Value | Sensitivity [95% CI] | Specificity [95% CI] | PPV [95% CI] | NPV [95% CI] | Diagnostic Accuracy [95% CI] |
| S100B | 0.085 | 0.671 [0.598; 0.752], p = 0.001 | 0.43 [0.30; 0.57] | 0.83 [0.72; 0.90] | 0.64 [0.51; 0.76] | 0.67 [0.61; 0.72] | 0.66 [0.57; 0.74] | 0.682 [0.547; 0.817] p = 0.011 | 0.43 [0.25; 0.63 | 0.90 [0.76; 0.97] | 0.75 [0.52; 0.89] | 0.69 [0.62; 0.76] | 0.71 [0.58; 0.81] |
| LDH | 220.5 | 0.575 [0.477; 0.674] p = 0.131 | 0.64 [0.50; 0.76] | 0.53 [0.41; 0.64] | 0.67 [0.57; 0.75] | 0.43 [0.42; 0.57] | 0.57 [0.49; 0.66] | 0.563 [0.424; 0.703] p = 0.376 | 0.54 [0.34; 0.73] | 0.55 [0.39; 0.71] | 0.46 [0.34; 0.58] | 0.63 [0.51; 0.73] | 0.54 [0.42; 0.67] |
| OPN | 80.09 | 0.616 [0.518; 0.715] p = 0.020 | 0.36 [0.24; 0.50] | 0.88 [0.78; 0.94] | 0.65 [0.61; 0.70] | 0.68 [0.52; 0.81] | 0.66 [0.57; 0.74] | 0.643 [0.500; 0.786] p = 0.046 | 0.46 [0.28; 0.66] | 0.90 [0.76; 0.97] | 0.77 [0.54; 0.90] | 0.71 [0.63; 0.78] | 0.72 [0.60; 0.82] |
| S100B + localization + pT stage | 0.435 | 0.788 [0.709; 0.867] p < 0.001 | 0.76 [0.63; 0.86] | 0.76 [0.65; 0.85] | 0.70 [0.60; 0.78] | 0.81 [0.73; 0.87] | 0.76 [0.68; 0.83] | 0.802 [0.699; 0.904] p < 0.001 | 0.61 [0.41; 0.79] | 0.80 [0.64; 0.91] | 0.68 [0.52; 0.81] | 0.74 [0.64; 0.83] | 0.72 [0.60; 0.82] |
| LDH + localization + pT stage | 0.458 | 0.785 [0.706; 0.864] p < 0.001 | 0.72 [0.59; 0.83] | 0.79 [0.68; 0.87] | 0.71 [0.61; 0.80] | 0.80 [0.72; 0.86] | 0.76 [0.68; 0.83] | 0.744 [0.624; 0.864] p = 0.001 | 0.71 [0.51; 0.87] | 0.75 [0.59; 0.87] | 0.67 [0.53; 0.78] | 0.79 [0.67; 0.87] | 0.74 [0.61; 0.84] |
| OPN + localization + pT stage | 0.460 | 0.791 [0.714; 0.868] p < 0.001 | 0.67 [0.54; 0.79] | 0.80 [0.70; 0.88] | 0.71 [0.60; 0.80] | 0.77 [0.70; 0.83] | 0.75 [0.67; 0.82] | 0.798 [0.694; 0.902] p < 0.001 | 0.64 [0.44; 0.81] | 0.80 [0.64; 0.91] | 0.69 [0.53; 0.82] | 0.76 [0.66; 0.84] | 0.74 [0.61; 0.84] |
| S100B + LDH + OPN + localization + pT stage | 0.413 | 0.803 [0.729; 0.878] p < 0.001 | 0.78 [0.65; 0.88] | 0.75 [0.64; 0.84] | 0.69 [0.60; 0.77] | 0.82 [0.74; 0.88] | 0.76 [0.68; 0.83] | 0.822 [0.726; 0.919] p < 0.001 | 0.68 [0.48; 0.84] | 0.78 [0.62; 0.89] | 0.68 [0.53; 0.80] | 0.78 [0.66; 0.86] | 0.74 [0.61; 0.84] |
| S100B + LDH + localization + pT stage | 0.459 | 0.791 [0.713; 0.869] p < 0.001 | 0.74 [0.61; 0.85] | 0.79 [0.68; 0.87] | 0.72 [0.62; 0.80] | 0.81 [0.73; 0.87] | 0.77 [0.69; 0.84] | 0.812 [0.712; 0.911] p < 0.001 | 0.61 [0.41; 0.79] | 0.85 [0.70; 0.94] | 0.74 [0.56; 0.86] | 0.76 [0.66; 0.83] | 0.75 [0.63; 0.85] |
Disclaimer/Publisher’s Note: The statements, opinions and data contained in all publications are solely those of the individual author(s) and contributor(s) and not of MDPI and/or the editor(s). MDPI and/or the editor(s) disclaim responsibility for any injury to people or property resulting from any ideas, methods, instructions or products referred to in the content. |
© 2023 by the authors. Licensee MDPI, Basel, Switzerland. This article is an open access article distributed under the terms and conditions of the Creative Commons Attribution (CC BY) license (https://creativecommons.org/licenses/by/4.0/).
Share and Cite
Várvölgyi, T.; Janka, E.A.; Szász, I.; Koroknai, V.; Toka-Farkas, T.; Szabó, I.L.; Ványai, B.; Szegedi, A.; Emri, G.; Balázs, M. Combining Biomarkers for the Diagnosis of Metastatic Melanoma. J. Clin. Med. 2024, 13, 174. https://doi.org/10.3390/jcm13010174
Várvölgyi T, Janka EA, Szász I, Koroknai V, Toka-Farkas T, Szabó IL, Ványai B, Szegedi A, Emri G, Balázs M. Combining Biomarkers for the Diagnosis of Metastatic Melanoma. Journal of Clinical Medicine. 2024; 13(1):174. https://doi.org/10.3390/jcm13010174
Chicago/Turabian StyleVárvölgyi, Tünde, Eszter Anna Janka, István Szász, Viktória Koroknai, Tünde Toka-Farkas, Imre Lőrinc Szabó, Beatrix Ványai, Andrea Szegedi, Gabriella Emri, and Margit Balázs. 2024. "Combining Biomarkers for the Diagnosis of Metastatic Melanoma" Journal of Clinical Medicine 13, no. 1: 174. https://doi.org/10.3390/jcm13010174
APA StyleVárvölgyi, T., Janka, E. A., Szász, I., Koroknai, V., Toka-Farkas, T., Szabó, I. L., Ványai, B., Szegedi, A., Emri, G., & Balázs, M. (2024). Combining Biomarkers for the Diagnosis of Metastatic Melanoma. Journal of Clinical Medicine, 13(1), 174. https://doi.org/10.3390/jcm13010174