
Diagnostic Efficiency of Pan-Immune-Inflammation Value to Predict Prostate Cancer in Patients with Prostate-Specific Antigen between 4 and 20 ng/mL
Abstract
:1. Introduction
2. Materials and Methods
2.1. Patient Selection Information Collection
2.2. Biopsy Method and Pathological Examination
2.3. Data Management
2.4. Statistical Analysis
3. Results
3.1. Clinical Demographics of the Eligible Patients
3.2. Univariable and Multivariable Analyses of Clinical Indicators
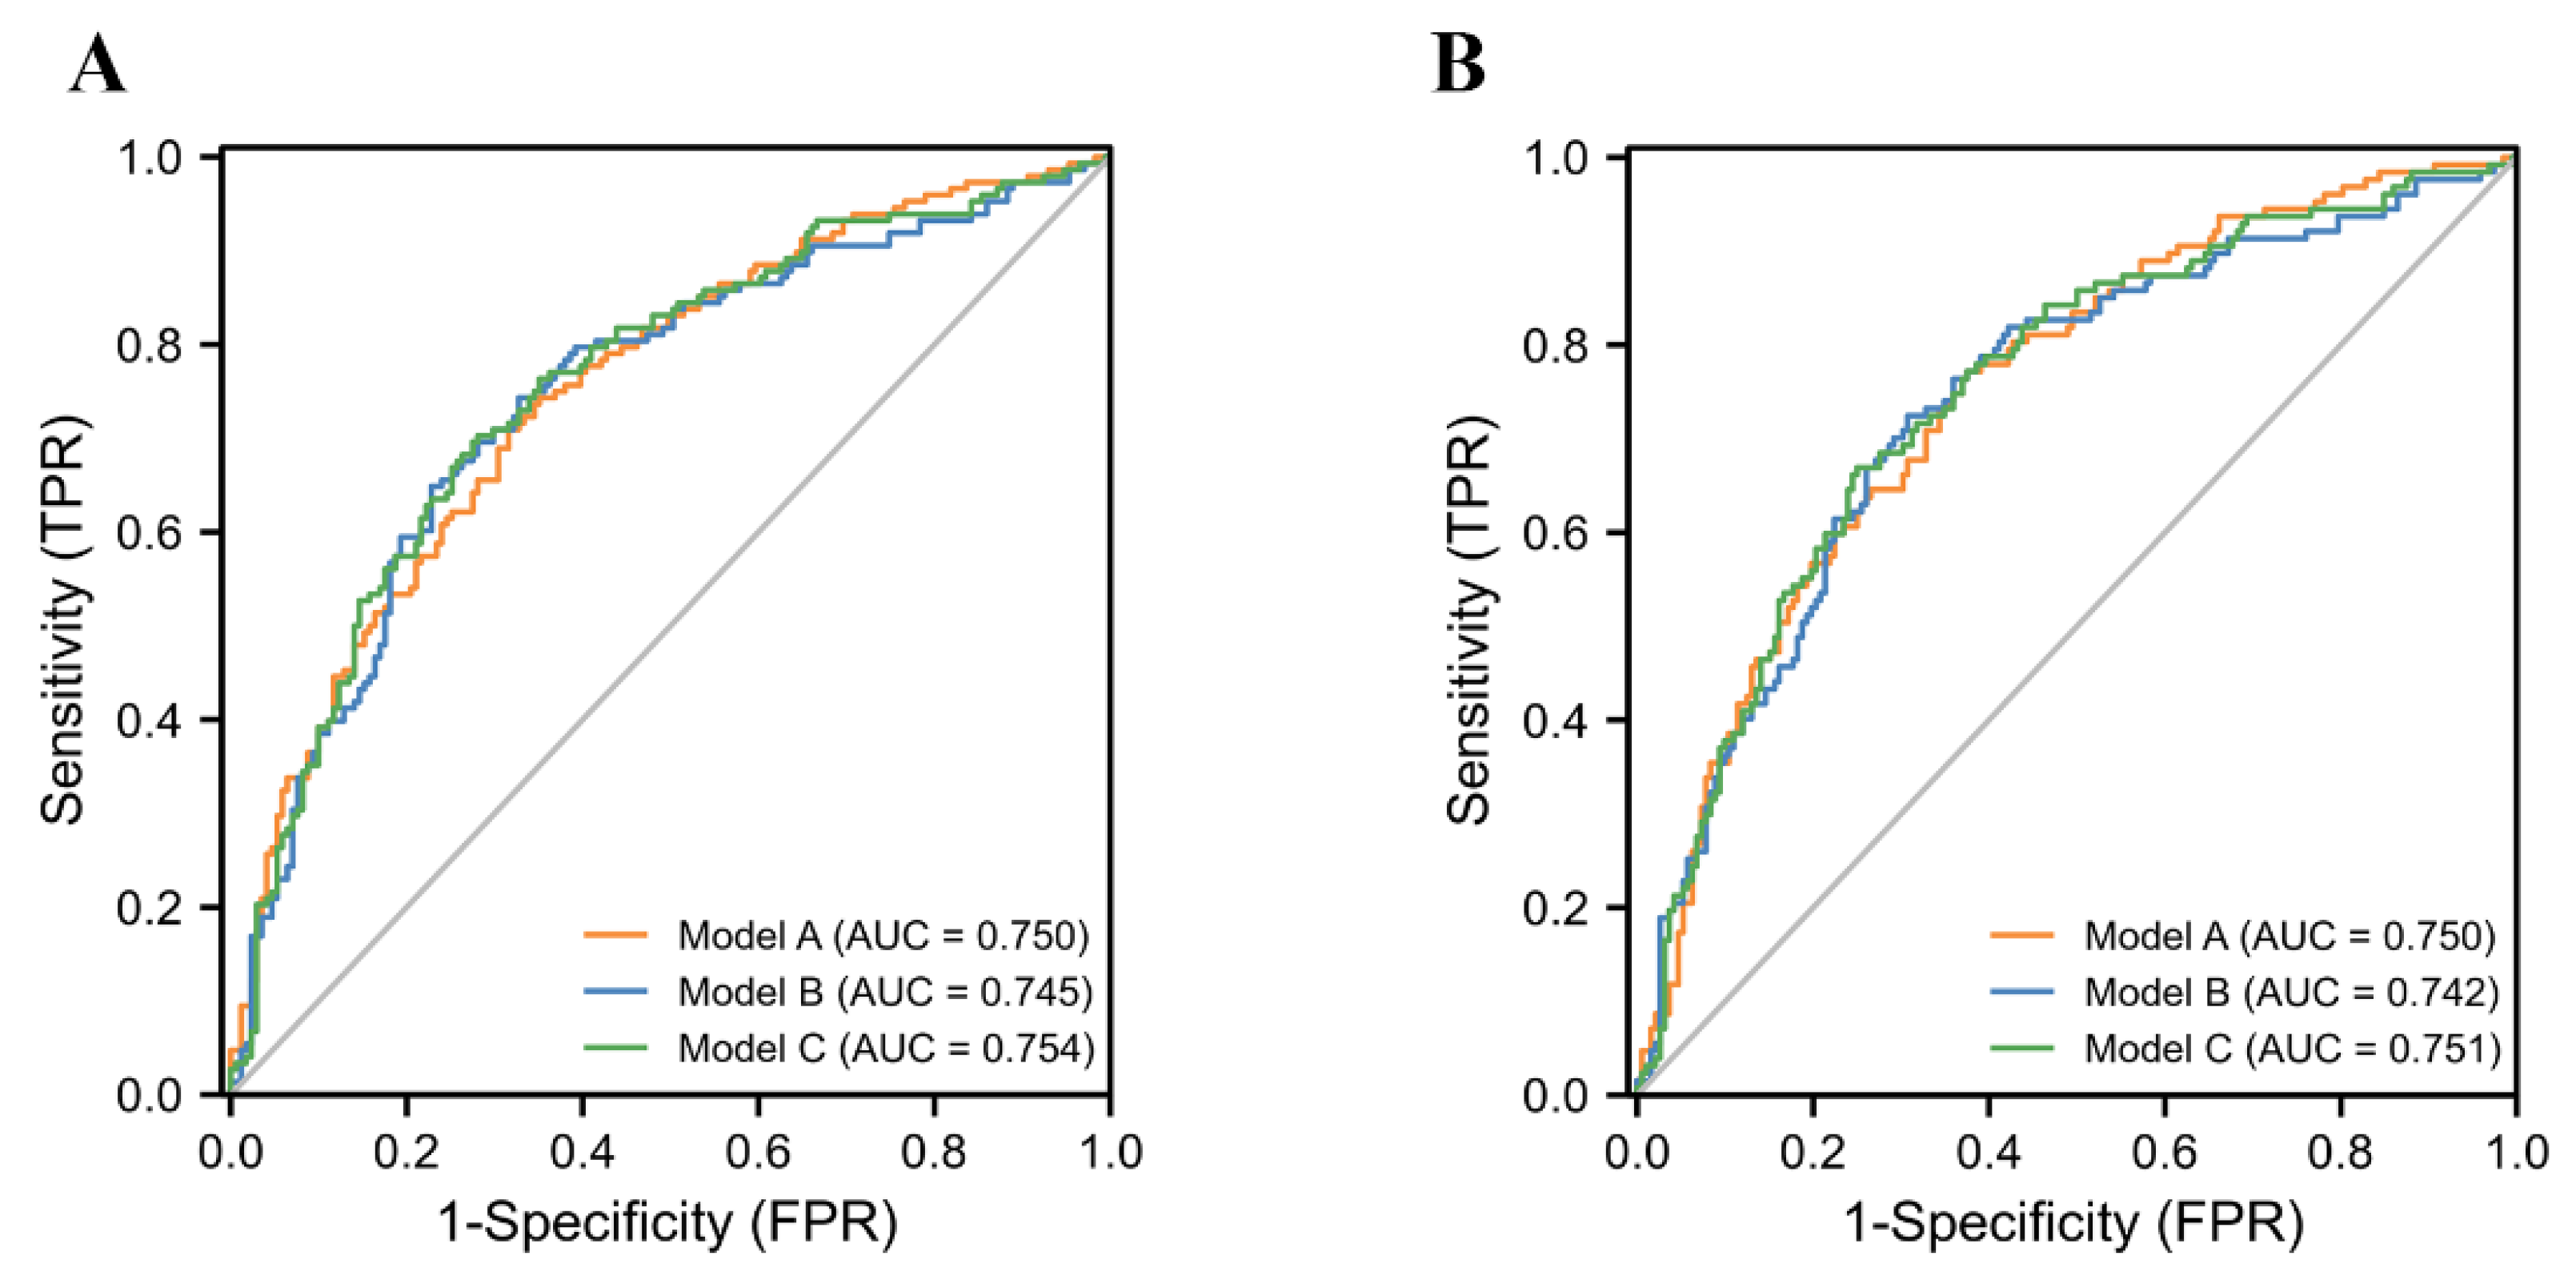
3.3. Multivariable Logistic Regression Analysis of Different Models of Inflammatory Markers
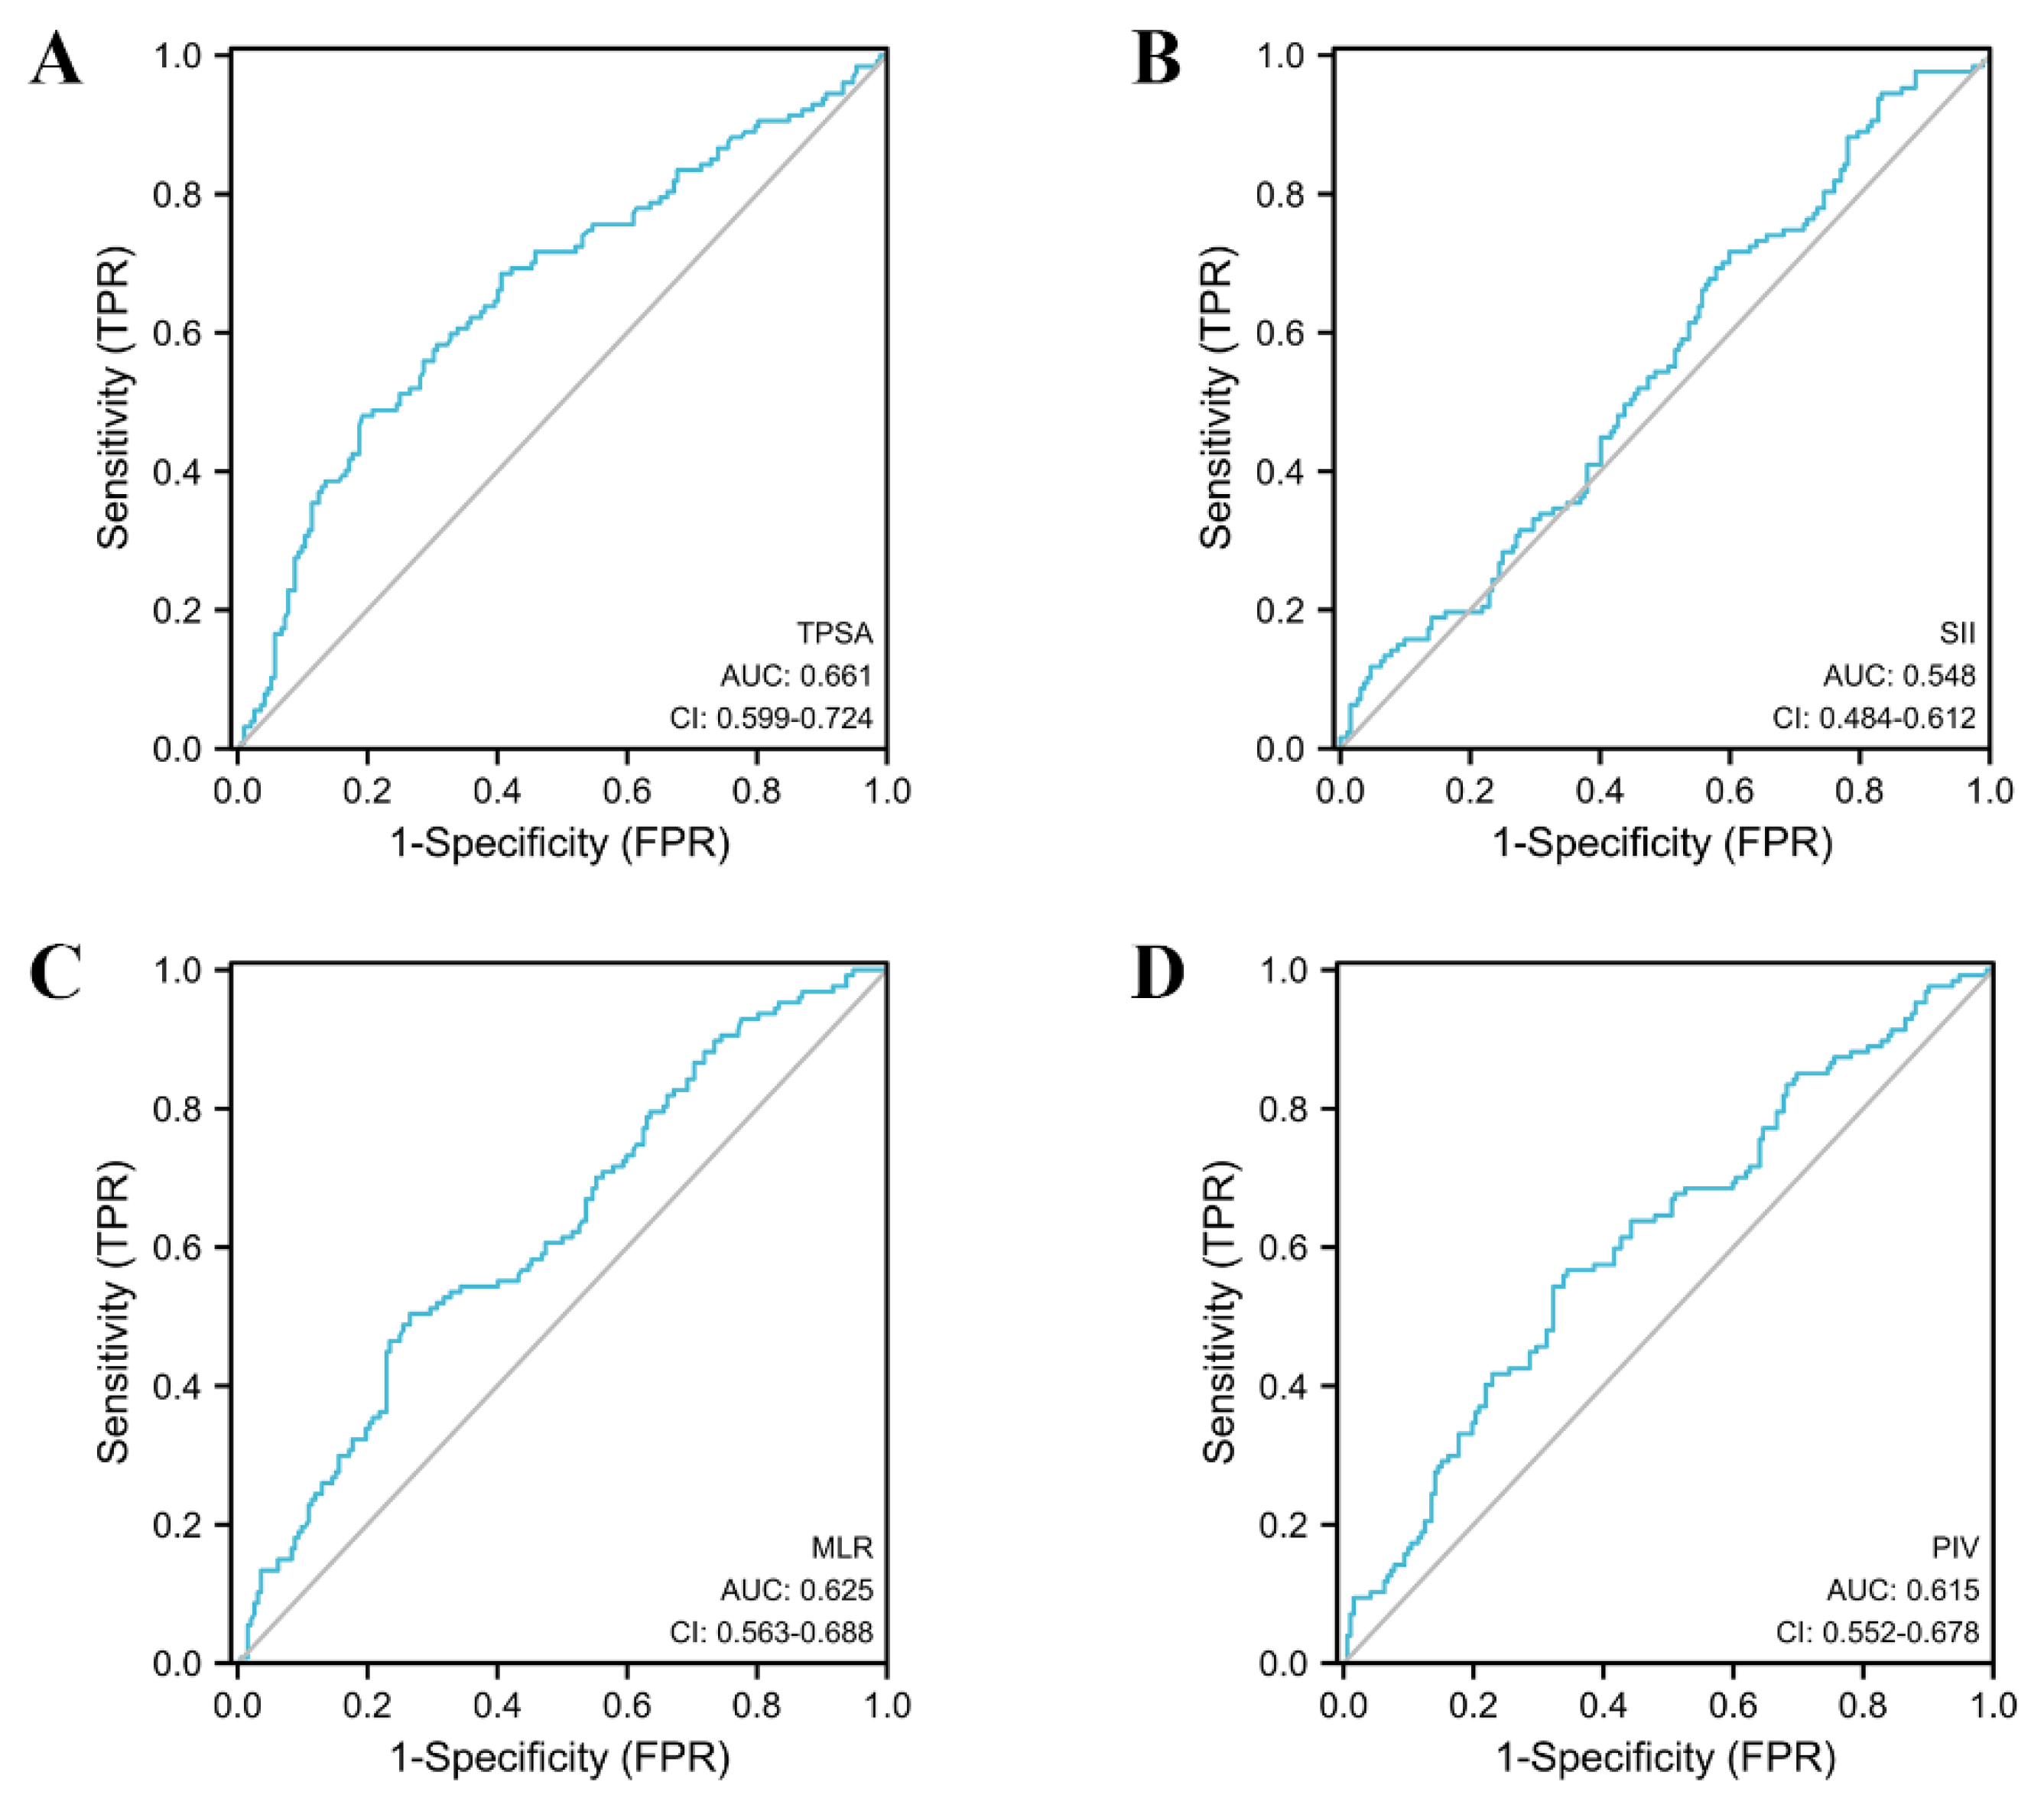
3.4. ROC Curve Analysis of Variables
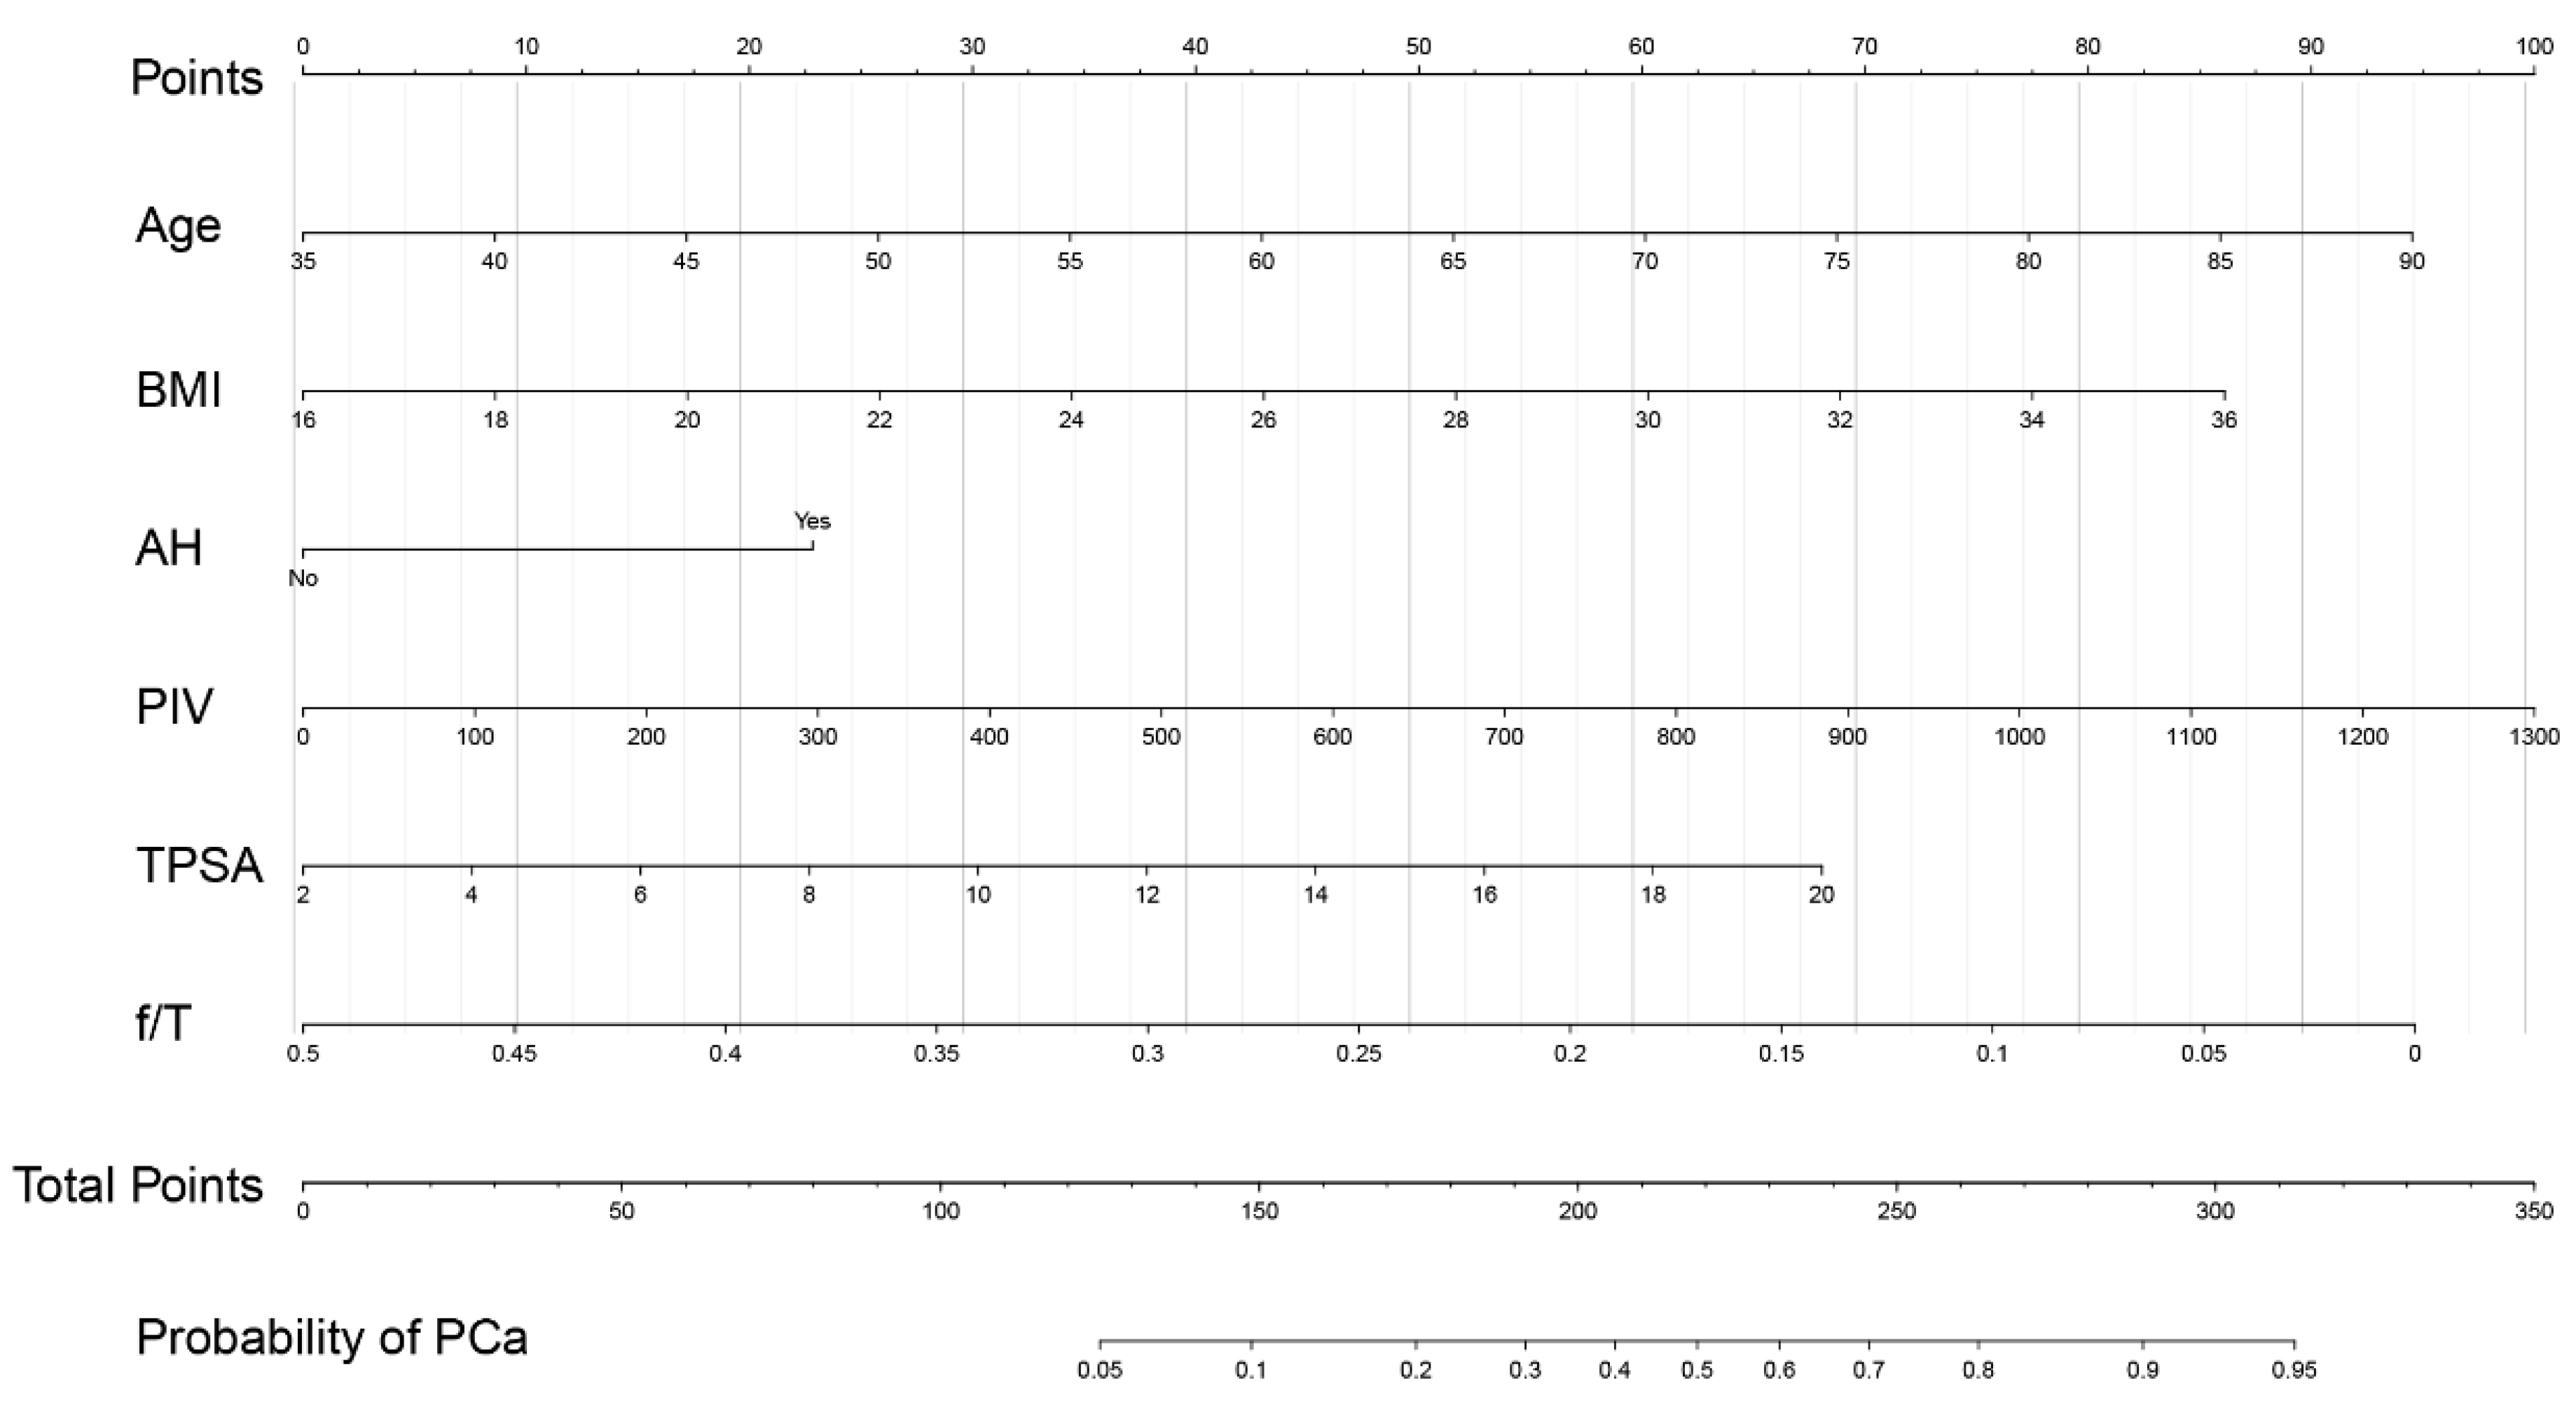
3.5. Development of a Nomogram for PCa Prediction
4. Discussion
5. Conclusions
Supplementary Materials
Author Contributions
Funding
Institutional Review Board Statement
Informed Consent Statement
Data Availability Statement
Conflicts of Interest
References
- Kang, Y.; Song, P.; Fang, K.; Yang, B.; Yang, L.; Zhou, J.; Wang, L.; Dong, Q. Survival outcomes of low prostate-specific antigen levels and T stages in patients with high-grade prostate cancer: A population-matched study. J. Cancer 2020, 11, 6484–6490. [Google Scholar] [CrossRef] [PubMed]
- Humphrey, P.A.; Andriole, G.L. Prostate cancer diagnosis. Mo. Med. 2010, 107, 107–112. [Google Scholar]
- Ried, K.; Tamanna, T.; Matthews, S.; Eng, P.; Sali, A. New Screening Test Improves Detection of Prostate Cancer Using Circulating Tumor Cells and Prostate-Specific Markers. Front. Oncol. 2020, 10, 582. [Google Scholar] [CrossRef] [PubMed] [Green Version]
- Brikun, I.; Nusskern, D.; Decatus, A.; Harvey, E.; Li, L.; Freije, D. A panel of DNA methylation markers for the detection of prostate cancer from FV and DRE urine DNA. Clin. Epigenet. 2018, 10, 91. [Google Scholar] [CrossRef] [PubMed] [Green Version]
- Nevo, A.; Navaratnam, A.; Andrews, P. Prostate cancer and the role of biomarkers. Abdom. Radiol. 2020, 45, 2120–2132. [Google Scholar] [CrossRef] [PubMed]
- Xie, H.; Ruan, G.; Ge, Y.; Zhang, Q.; Zhang, H.; Lin, S.; Song, M.; Zhang, X.; Liu, X.; Li, X.; et al. Inflammatory burden as a prognostic biomarker for cancer. Clin. Nutr. 2022, 41, 1236–1243. [Google Scholar] [CrossRef]
- Mullally, W.J.; Greene, J.; Jordan, E.J.; Horgan, A.M.; O’Connor, M.; Calvert, P.M. The prognostic value of the derived neutrophil-to-lymphocyte ratio (dNLR) in patients treated with immune checkpoint inhibitors. Ir. J. Med. Sci. 2022. [Google Scholar] [CrossRef] [PubMed]
- Guven, D.C.; Sahin, T.K.; Erul, E.; Kilickap, S.; Gambichler, T.; Aksoy, S. The Association between the Pan-Immune-Inflammation Value and Cancer Prognosis: A Systematic Review and Meta-Analysis. Cancers 2022, 14, 2675. [Google Scholar] [CrossRef]
- Barakzai, M.A. Prostatic Adenocarcinoma: A Grading from Gleason to the New Grade-Group System: A Historical and Critical Review. Asian Pac. J. Cancer Prev. 2019, 20, 661–666. [Google Scholar] [CrossRef]
- Mantovani, A.; Allavena, P.; Sica, A.; Balkwill, F. Cancer-related inflammation. Nature 2008, 454, 436–444. [Google Scholar] [CrossRef]
- Coussens, L.M.; Zitvogel, L.; Palucka, A.K. Neutralizing tumor-promoting chronic inflammation: A magic bullet? Science 2013, 339, 286–291. [Google Scholar] [CrossRef] [PubMed]
- Powell, D.R.; Huttenlocher, A. Neutrophils in the Tumor Microenvironment. Trends Immunol. 2016, 37, 41–52. [Google Scholar] [CrossRef] [PubMed] [Green Version]
- Engblom, C.; Pfirschke, C.; Pittet, M.J. The role of myeloid cells in cancer therapies. Nat. Rev. Cancer 2016, 16, 447–462. [Google Scholar] [CrossRef] [PubMed]
- Haemmerle, M.; Stone, R.L.; Menter, D.G.; Afshar-Kharghan, V.; Sood, A.K. The Platelet Lifeline to Cancer: Challenges and Opportunities. Cancer Cell 2018, 33, 965–983. [Google Scholar] [CrossRef] [Green Version]
- Ray-Coquard, I.; Cropet, C.; Van Glabbeke, M.; Sebban, C.; Le Cesne, A.; Judson, I.; Tredan, O.; Verweij, J.; Biron, P.; Labidi, I.; et al. Lymphopenia as a prognostic factor for overall survival in advanced carcinomas, sarcomas, and lymphomas. Cancer Res. 2009, 69, 5383–5391. [Google Scholar] [CrossRef] [PubMed] [Green Version]
- Rajwa, P.; Huebner, N.A.; Hostermann, D.I.; Grossmann, N.C.; Schuettfort, V.M.; Korn, S.; Quhal, F.; König, F.; Mostafaei, H.; Laukhtina, E.; et al. Evaluation of the Predictive Role of Blood-Based Biomarkers in the Context of Suspicious Prostate MRI in Patients Undergoing Prostate Biopsy. J. Pers. Med. 2021, 11, 1231. [Google Scholar] [CrossRef]
- Cho, M.C.; Yoo, S.; Choo, M.S.; Son, H.; Jeong, H. Lymphocyte-to-monocyte ratio is a predictor of clinically significant prostate cancer at prostate biopsy. Prostate 2021, 81, 1278–1286. [Google Scholar] [CrossRef]
- Caglayan, V.; Onen, E.; Avci, S.; Sambel, M.; Kilic, M.; Oner, S.; Aydos, M.M.; Yıldız, H.E. Lymphocyte-to-monocyte ratio is a valuable marker to predict prostate cancer in patients with prostate specific antigen between 4 and 10 ng/dl. Arch. Ital. Urol. Androl. 2019, 90, 270–275. [Google Scholar] [CrossRef] [Green Version]
- Hou, G.-D.; Zheng, Y.; Zheng, W.-X.; Gao, M.; Zhang, L.; Hou, N.-N.; Yuan, J.R.; Wei, D.; Ju, D.E.; Dun, X.L.; et al. A novel nomogram predicting the risk of positive biopsy for patients in the diagnostic gray area of prostate cancer. Sci. Rep. 2020, 10, 17675. [Google Scholar] [CrossRef]
- Zhou, Z.H.; Liu, F.; Wang, W.J.; Liu, X.; Sun, L.J.; Zhu, Y.; Ye, D.W.; Zhang, G.M. Development and validation of a nomogram including lymphocyte-to-monocyte ratio for initial prostate biopsy: A double-center retrospective study. Asian J. Androl. 2021, 23, 41–46. [Google Scholar] [CrossRef]
- Jethwani, D.L.; Sivamoorthy, L.L.; Toh, C.C.; Malek, R. Predicting the diagnosis of prostate cancer with a scoring system based on novel biomarkers. BMC Urol. 2022, 22, 13. [Google Scholar] [CrossRef] [PubMed]
- Masuda, H.; Mikami, K.; Otsuka, K.; Hou, K.; Suyama, T.; Araki, K.; Kojima, S.; Naya, Y. Validation of the Effectiveness of Neutrophil-to-lymphocyte Ratio (NLR) as a Predictive Factor in Patients Undergoing Prostate Biopsy With Prostate Specific Antigen (PSA) Between 4.0 and 10.0 ng/mL. In Vivo 2021, 35, 1641–1646. [Google Scholar] [CrossRef]
- Du, J.; Lim, E.J.; Huang, H.H.; Lau, W.K.O. Predictive value of neutrophil-to-lymphocyte ratio in diagnosis of early prostate cancer among men who underwent robotic transperineal prostate biopsy. Medicine 2021, 100, e28007. [Google Scholar] [CrossRef] [PubMed]
- Sonmez, G.; Demirtas, T.; Tombul, S.T.; Akgun, H.; Demirtas, A. Diagnostic efficiency of systemic immune-inflammation index in fusion prostate biopsy. Actas Urol. Esp. Engl. Ed. 2021, 45, 359–365. [Google Scholar] [CrossRef] [PubMed]
- Adhyatma, K.P.; Warli, S.M. Diagnostic Value of Platelet-To-Lymphocyte Ratio in Prostate Cancer. Open Access Maced. J. Med. Sci. 2019, 7, 1093–1096. [Google Scholar] [CrossRef] [Green Version]
- Lee, J.W.; Jeong, H.; Son, H.; Cho, M.C. Platelet-to-lymphocyte ratio is not a predictor of clinically significant prostate cancer at the prostate biopsy: A large cohort study. Sci. Rep. 2021, 11, 14240. [Google Scholar] [CrossRef]
- Murray, N.P.; Fuentealba, C.; Salazar, A.; Reyes, E. Platelet-to-lymphocyte ratio and systemic immune-inflammation index versus circulating prostate cells to predict significant prostate cancer at first biopsy. Turk. J. Urol. 2020, 46, 115–122. [Google Scholar] [CrossRef]
- Huang, D.; Yang, X.; Wu, Y.; Lin, X.; Xu, D.; Na, R.; Xu, J. Cost-Effectiveness Analysis of Prostate Health Index in Decision Making for Initial Prostate Biopsy. Front. Oncol. 2020, 10, 565382. [Google Scholar] [CrossRef]
- Chen, N.; Rong, M.; Shao, X.; Zhang, H.; Liu, S.; Dong, B.; Xue, W.; Wang, T.; Li, T.; Pan, J. Surface-enhanced Raman spectroscopy of serum accurately detects prostate cancer in patients with prostate-specific antigen levels of 4-10 ng/mL. Int. J. Nanomed. 2017, 12, 5399–5407. [Google Scholar] [CrossRef] [Green Version]
- Perez-Cornago, A.; Appleby, P.N.; Pischon, T.; Tsilidis, K.K.; Tjonneland, A.; Olsen, A.; Overvad, K.; Kaaks, R.; Kühn, T.; Boeing, H.; et al. Tall height and obesity are associated with an increased risk of aggressive prostate cancer: Results from the EPIC cohort study. BMC Med. 2017, 15, 115. [Google Scholar] [CrossRef] [Green Version]
- Bray, F.; Ferlay, J.; Soerjomataram, I.; Siegel, R.L.; Torre, L.A.; Jemal, A. Global cancer statistics 2018: GLOBOCAN estimates of incidence and mortality worldwide for 36 cancers in 185 countries. CA Cancer J. Clin. 2018, 68, 394–424. [Google Scholar] [CrossRef] [PubMed]
- Bagnardi, V.; Rota, M.; Botteri, E.; Tramacere, I.; Islami, F.; Fedirko, V.; Scotti, L.; Jenab, M.; Turati, F.; Pasquali, E.; et al. Alcohol consumption and site-specific cancer risk: A comprehensive dose-response meta-analysis. Br. J. Cancer 2015, 112, 580–593. [Google Scholar] [CrossRef] [PubMed]


| Variable | Overall (n = 319) | Non-PCa (n = 171) | PCa (n = 148) | p Value | Non-CSPCa (n = 192) | CSPCa (n = 127) | p Value |
|---|---|---|---|---|---|---|---|
| Age, year | 66.00 (61.00–72.00) | 65.00 (59.00–71.00) | 67.00 (62.00–73.00) | 0.011 | 66 (60–72) | 66 (62–73) | 0.285 |
| BMI, kg/m2 | 24.80 (22.99–26.57) | 24.57 (22.78–26.12) | 25.02 (23.54–27.03) | 0.064 | 24.57 (22.78–26.12) | 25.10 (23.56–27.06) | 0.025 |
| SH (%) | 0.191 | 0.189 | |||||
| Y | 90 (28.2) | 43 (25.1) | 47 (31.8) | 49 (25.5) | 41 (32.3) | ||
| N | 229 (71.8) | 128 (74.9) | 101 (68.2) | 143 (74.5) | 86 (67.7) | ||
| AH (%) | 0.015 | 0.016 | |||||
| Y | 87 (27.3) | 37 (21.6) | 50 (33.8) | 43 (22.4) | 44 (34.6) | ||
| N | 232 (72.7) | 134 (78.4) | 98 (66.2) | 149 (77.6) | 83 (65.4) | ||
| NLR | 1.90 (1.52–2.48) | 1.88 (1.44–2.58) | 1.93 (1.59–2.47) | 0.171 | 1.89 (1.44–2.51) | 1.93 (1.58–2.48) | 0.244 |
| dNLR | 1.37 (1.10–1.76) | 1.40 (1.09–1.86) | 1.36 (1.12–1.72) | 0.679 | 1.40 (1.09–1.78) | 1.35 (1.11–1.73) | 0.720 |
| MLR | 0.27 (0.22–0.34) | 0.25 (0.20–0.30) | 0.30 (0.23–0.39) | <0.001 | 0.26 (0.20–0.31) | 0.30 (0.23–0.39) | <0.001 |
| PLR | 122.98 (98.58–150.50) | 120 (96.11–143.86) | 132.30 (101.16–153.20) | 0.053 | 121.10 (96.34–144.56) | 132.54 (100.00–153.21) | 0.099 |
| SII, 109 | 411.79 (316.84–531.05) | 393.89 (293.30–501.92) | 427.26 (339.28–544.45) | 0.030 | 402.14 (305.01–521.53) | 423.77 (328.05–531.39) | 0.145 |
| PIV, 1018 | 197.04 (134.56–289.76) | 171.54 (123.48–244.10) | 229.62 (152.47–329.29) | <0.001 | 181.04 (125.45–251.83) | 228.49 (151.17–325.61) | 0.001 |
| Hb, g/L | 147 (138–154) | 148 (139–155) | 147 (137–154) | 0.448 | 148 (139–155) | 147 (137–154) | 0.484 |
| TPSA, ng/mL | 9.23 (6.71–12.53) | 8.40 (6.07–10.93) | 10.76 (7.65–14.27) | <0.001 | 8.40 (6.10–11.07) | 11.05 (8.01–14.52) | <0.001 |
| fPSA, ng/mL | 1.20 (0.82–1.74) | 1.22 (0.86–1.76) | 1.14 (0.79–1.66) | 0.792 | 1.23 (0.85–1.78) | 1.14 (0.80–1.60) | 0.609 |
| f/T | 0.14 (0.10–0.18) | 0.15 (0.11–0.19) | 0.12 (0.79–1.66) | <0.001 | 0.15 (0.11–0.19) | 0.11 (0.09–0.16) | <0.001 |
| PCa | Univariable Regression Analysis | Multivariable Regression Analysis | CSPCa | Univariable Regression Analysis | Multivariable Regression Analysis | ||||
|---|---|---|---|---|---|---|---|---|---|
| OR (95% CI) | p Value | OR (95% CI) | p Value | OR (95% CI) | p Value | OR (95% CI) | p Value | ||
| Age | 1.035 (1.008–1.064) | 0.012 | 1.046 (1.014–1.079) | 0.005 | Age | 1.015 (0.988–1.042) | 0.284 | ||
| BMI | 1.075 (0.995–1.160) | 0.066 | BMI | 1.090 (1.007–1.179) | 0.032 | 1.114 (1.021–1.217) | 0.016 | ||
| SH | SH | ||||||||
| Y | 1.385 (0.849–2.259) | 0.192 | Y | 1.391 (0.849–2.279) | 0.190 | ||||
| N | 1 | N | 1 | ||||||
| AH | AH | ||||||||
| Y | 1.848 (1.122–3.042) | 0.016 | 1.975 (1.141–3.416) | 0.015 | Y | 1.837 (1.116–3.025) | 0.017 | 1.706 (0.989–2.940) | 0.055 |
| N | 1 | 1 | N | 1 | 1 | ||||
| NLR | 1.234 (0.936–1.629) | 0.136 | NLR | 1.192 (0.903–1.574) | 0.216 | ||||
| dNLR | 0.849 (0.636–1.134) | 0.268 | dNLR | 0.862 (0.642–1.158) | 0.324 | ||||
| MLR | 52.028 (7.377–366.922) | <0.001 | 16.513 (1.091–249.847) | 0.043 | MLR | 27.469 (4.298–175.552) | <0.001 | 19.473 (1.557–243.616) | 0.021 |
| PLR | 1.003 (0.998–1.008) | 0.188 | PLR | 1.003 (0.998–1.007) | 0.299 | ||||
| SII | 1.001 (1.000–1.002) | 0.028 | 1.000 (0.998–1.002) | 0.731 | SII | 1.001 (1.000–1.002) | 0.053 | ||
| PIV | 1.003 (1.001–1.004) | 0.001 | 1.002 (0.998–1.005) | 0.324 | PIV | 1.002 (1.001–1.003) | 0.002 | 1.001 (0.999–1.003) | 0.406 |
| Hb | 0.997 (0.983–1.011) | 0.684 | Hb | 0.998 (0.984–1.013) | 0.814 | ||||
| TPSA | 1.163 (1.094–1.236) | <0.001 | 1.138 (1.063–1.217) | <0.001 | TPSA | 1.158 (1.090–1.231) | <0.001 | 1.140 (1.067–1.218) | <0.001 |
| fPSA | 1.076 (0.794–1.459) | 0.635 | fPSA | 0.941 (0.689–1.286) | 0.704 | ||||
| f/T | 0.003 (0.000–0.096) | 0.001 | 0.006 (0.000–0.413) | 0.018 | f/T | 0.001 (0.000–0.028) | <0.001 | 0.004 (0.000–0.278) | 0.010 |
| PCa | Model A | Model B | Model C | |||
|---|---|---|---|---|---|---|
| OR (95% CI) | p Value | OR (95% CI) | p Value | OR (95% CI) | p Value | |
| Age | 1.048 (1.016–1.081) | 0.003 | 1.056 (1.023–1.089) | 0.001 | 1.055 (1.023–1.089) | 0.001 |
| BMI | 1.106 (1.014–1.207) | 0.023 | 1.111 (1.019–1.212) | 0.017 | 1.110 (1.017–1.211) | 0.019 |
| AH | 0.031 | 0.029 | 0.032 | |||
| Y | 1.841 (1.059–3.200) | 1.841 (1.063–3.188) | 1.832 (1.054–3.186) | |||
| N | 1 | 1 | 1 | |||
| MLR | 59.057 (7.385–472.306) | <0.001 | / | / | ||
| SII | / | 1.001 (1.000–1.003) | 0.008 | / | ||
| PIV | / | / | 1.003 (1.001–1.004) | 0.001 | ||
| TPSA | 1.143 (1.068–1.223) | <0.001 | 1.138 (1.064–1.217) | <0.001 | 1.134 (1.061–1.213) | <0.001 |
| f/T | 0.004 (0.000–0.260) | 0.009 | 0.003 (0.000–0.215) | 0.007 | 0.004 (0.000–0.238) | 0.008 |
| AUC (95% CI) | 0.750 (0.697–0.804) | 0.745 (0.701–0.808) | 0.754 (0.701–0.808) | |||
| CSPCa | ||||||
| Age | 1.025 (0.994–1.058) | 0.111 | 1.033 (1.002–1.065) | 0.040 | 1.032 (1.001–1.064) | 0.045 |
| BMI | 1.119 (1.024–1.222) | 0.013 | 1.123 (1.028–1.226) | 0.010 | 1.122 (1.027–1.226) | 0.011 |
| AH | 0.049 | 0.050 | 0.055 | |||
| Y | 1.732 (1.002–2.996) | 1.721 (1.000–1.226) | 1.706 (0.988–2.945) | |||
| N | 1 | 1 | 1 | |||
| MLR | 34.010 (4.624–250.170) | 0.001 | / | / | ||
| SII | / | 1.001 (1.000–1.002) | 0.021 | / | ||
| PIV | / | / | 1.002 (1.001–1.004) | 0.003 | ||
| TPSA | 1.135 (1.062–1.213) | <0.001 | 1.131 (1.059–1.208) | <0.001 | 1.126 (1.054–1.203) | <0.001 |
| f/T | 0.002 (0.000–0.122) | 0.004 | 0.001 (0.000–0.100) | 0.003 | 0.001 (0.000–0.104) | 0.003 |
| AUC (95% CI) | 0.750 (0.696–0.804) | 0.742 (0.686–0.798) | 0.751 (0.696–0.806) | |||
| Variables | AUC (95% CI) | Cut-Off | Sensitivity | Specificity | PPV | NPV | Youden Index |
|---|---|---|---|---|---|---|---|
| PCa | |||||||
| MLR | 0.636 (0.576–0.697) | 0.302 | 0.493 | 0.754 | 0.635 | 0.632 | 0.248 |
| SII | 0.570 (0.508–0.633) | 374.674 | 0.703 | 0.444 | 0.523 | 0.633 | 0.147 |
| PIV | 0.639 (0.578–0.700) | 219.616 | 0.547 | 0.708 | 0.618 | 0.644 | 0.255 |
| TPSA | 0.657 (0.596–0.717) | 11.577 | 0.453 | 0.819 | 0.684 | 0.633 | 0.271 |
| Model A | 0.750 (0.697–0.804) | 0.382 | 0.709 | 0.684 | 0.660 | 0.731 | 0.394 |
| Model B | 0.745 (0.690–0.800) | 0.425 | 0.649 | 0.772 | 0.711 | 0.717 | 0.421 |
| Model C | 0.754 (0.701–0.808) | 0.402 | 0.703 | 0.719 | 0.684 | 0.737 | 0.422 |
| CSPCa | |||||||
| MLR | 0.625 (0.563–0.688) | 0.302 | 0.504 | 0.734 | 0.557 | 0.691 | 0.238 |
| SII | 0.548 (0.484–0.612) | 365.367 | 0.717 | 0.401 | 0.442 | 0.681 | 0.118 |
| PIV | 0.615 (0.552–0.678) | 210.291 | 0.567 | 0.656 | 0.522 | 0.696 | 0.223 |
| TPSA | 0.661 (0.599–0.724) | 11.577 | 0.480 | 0.807 | 0.622 | 0.701 | 0.288 |
| Model A | 0.750 (0.696–0.804) | 0.362 | 0.772 | 0.625 | 0.576 | 0.805 | 0.397 |
| Model B | 0.742 (0.685–0.798) | 0.399 | 0.724 | 0.693 | 0.609 | 0.792 | 0.417 |
| Model C | 0.751 (0.696–0.806) | 0.428 | 0.669 | 0.750 | 0.639 | 0.774 | 0.419 |
Disclaimer/Publisher’s Note: The statements, opinions and data contained in all publications are solely those of the individual author(s) and contributor(s) and not of MDPI and/or the editor(s). MDPI and/or the editor(s) disclaim responsibility for any injury to people or property resulting from any ideas, methods, instructions or products referred to in the content. |
© 2023 by the authors. Licensee MDPI, Basel, Switzerland. This article is an open access article distributed under the terms and conditions of the Creative Commons Attribution (CC BY) license (https://creativecommons.org/licenses/by/4.0/).
Share and Cite
Zhu, M.; Zhou, Y.; Liu, Z.; Jiang, Z.; Qi, W.; Chen, S.; Wang, W.; Shi, B.; Zhu, Y. Diagnostic Efficiency of Pan-Immune-Inflammation Value to Predict Prostate Cancer in Patients with Prostate-Specific Antigen between 4 and 20 ng/mL. J. Clin. Med. 2023, 12, 820. https://doi.org/10.3390/jcm12030820
Zhu M, Zhou Y, Liu Z, Jiang Z, Qi W, Chen S, Wang W, Shi B, Zhu Y. Diagnostic Efficiency of Pan-Immune-Inflammation Value to Predict Prostate Cancer in Patients with Prostate-Specific Antigen between 4 and 20 ng/mL. Journal of Clinical Medicine. 2023; 12(3):820. https://doi.org/10.3390/jcm12030820
Chicago/Turabian StyleZhu, Meikai, Yongheng Zhou, Zhifeng Liu, Zhiwen Jiang, Wenqiang Qi, Shouzhen Chen, Wenfu Wang, Benkang Shi, and Yaofeng Zhu. 2023. "Diagnostic Efficiency of Pan-Immune-Inflammation Value to Predict Prostate Cancer in Patients with Prostate-Specific Antigen between 4 and 20 ng/mL" Journal of Clinical Medicine 12, no. 3: 820. https://doi.org/10.3390/jcm12030820
APA StyleZhu, M., Zhou, Y., Liu, Z., Jiang, Z., Qi, W., Chen, S., Wang, W., Shi, B., & Zhu, Y. (2023). Diagnostic Efficiency of Pan-Immune-Inflammation Value to Predict Prostate Cancer in Patients with Prostate-Specific Antigen between 4 and 20 ng/mL. Journal of Clinical Medicine, 12(3), 820. https://doi.org/10.3390/jcm12030820