

Global, Regional, and National Incidence and Disability-Adjusted Life-Years for Urolithiasis in 195 Countries and Territories, 1990–2019: Results from the Global Burden of Disease Study 2019
Abstract
1. Introduction
2. Methods
2.1. Data Sources
2.2. Modeling
2.3. The Socio-Demographic Index
2.4. Statistical Analysis
3. Results
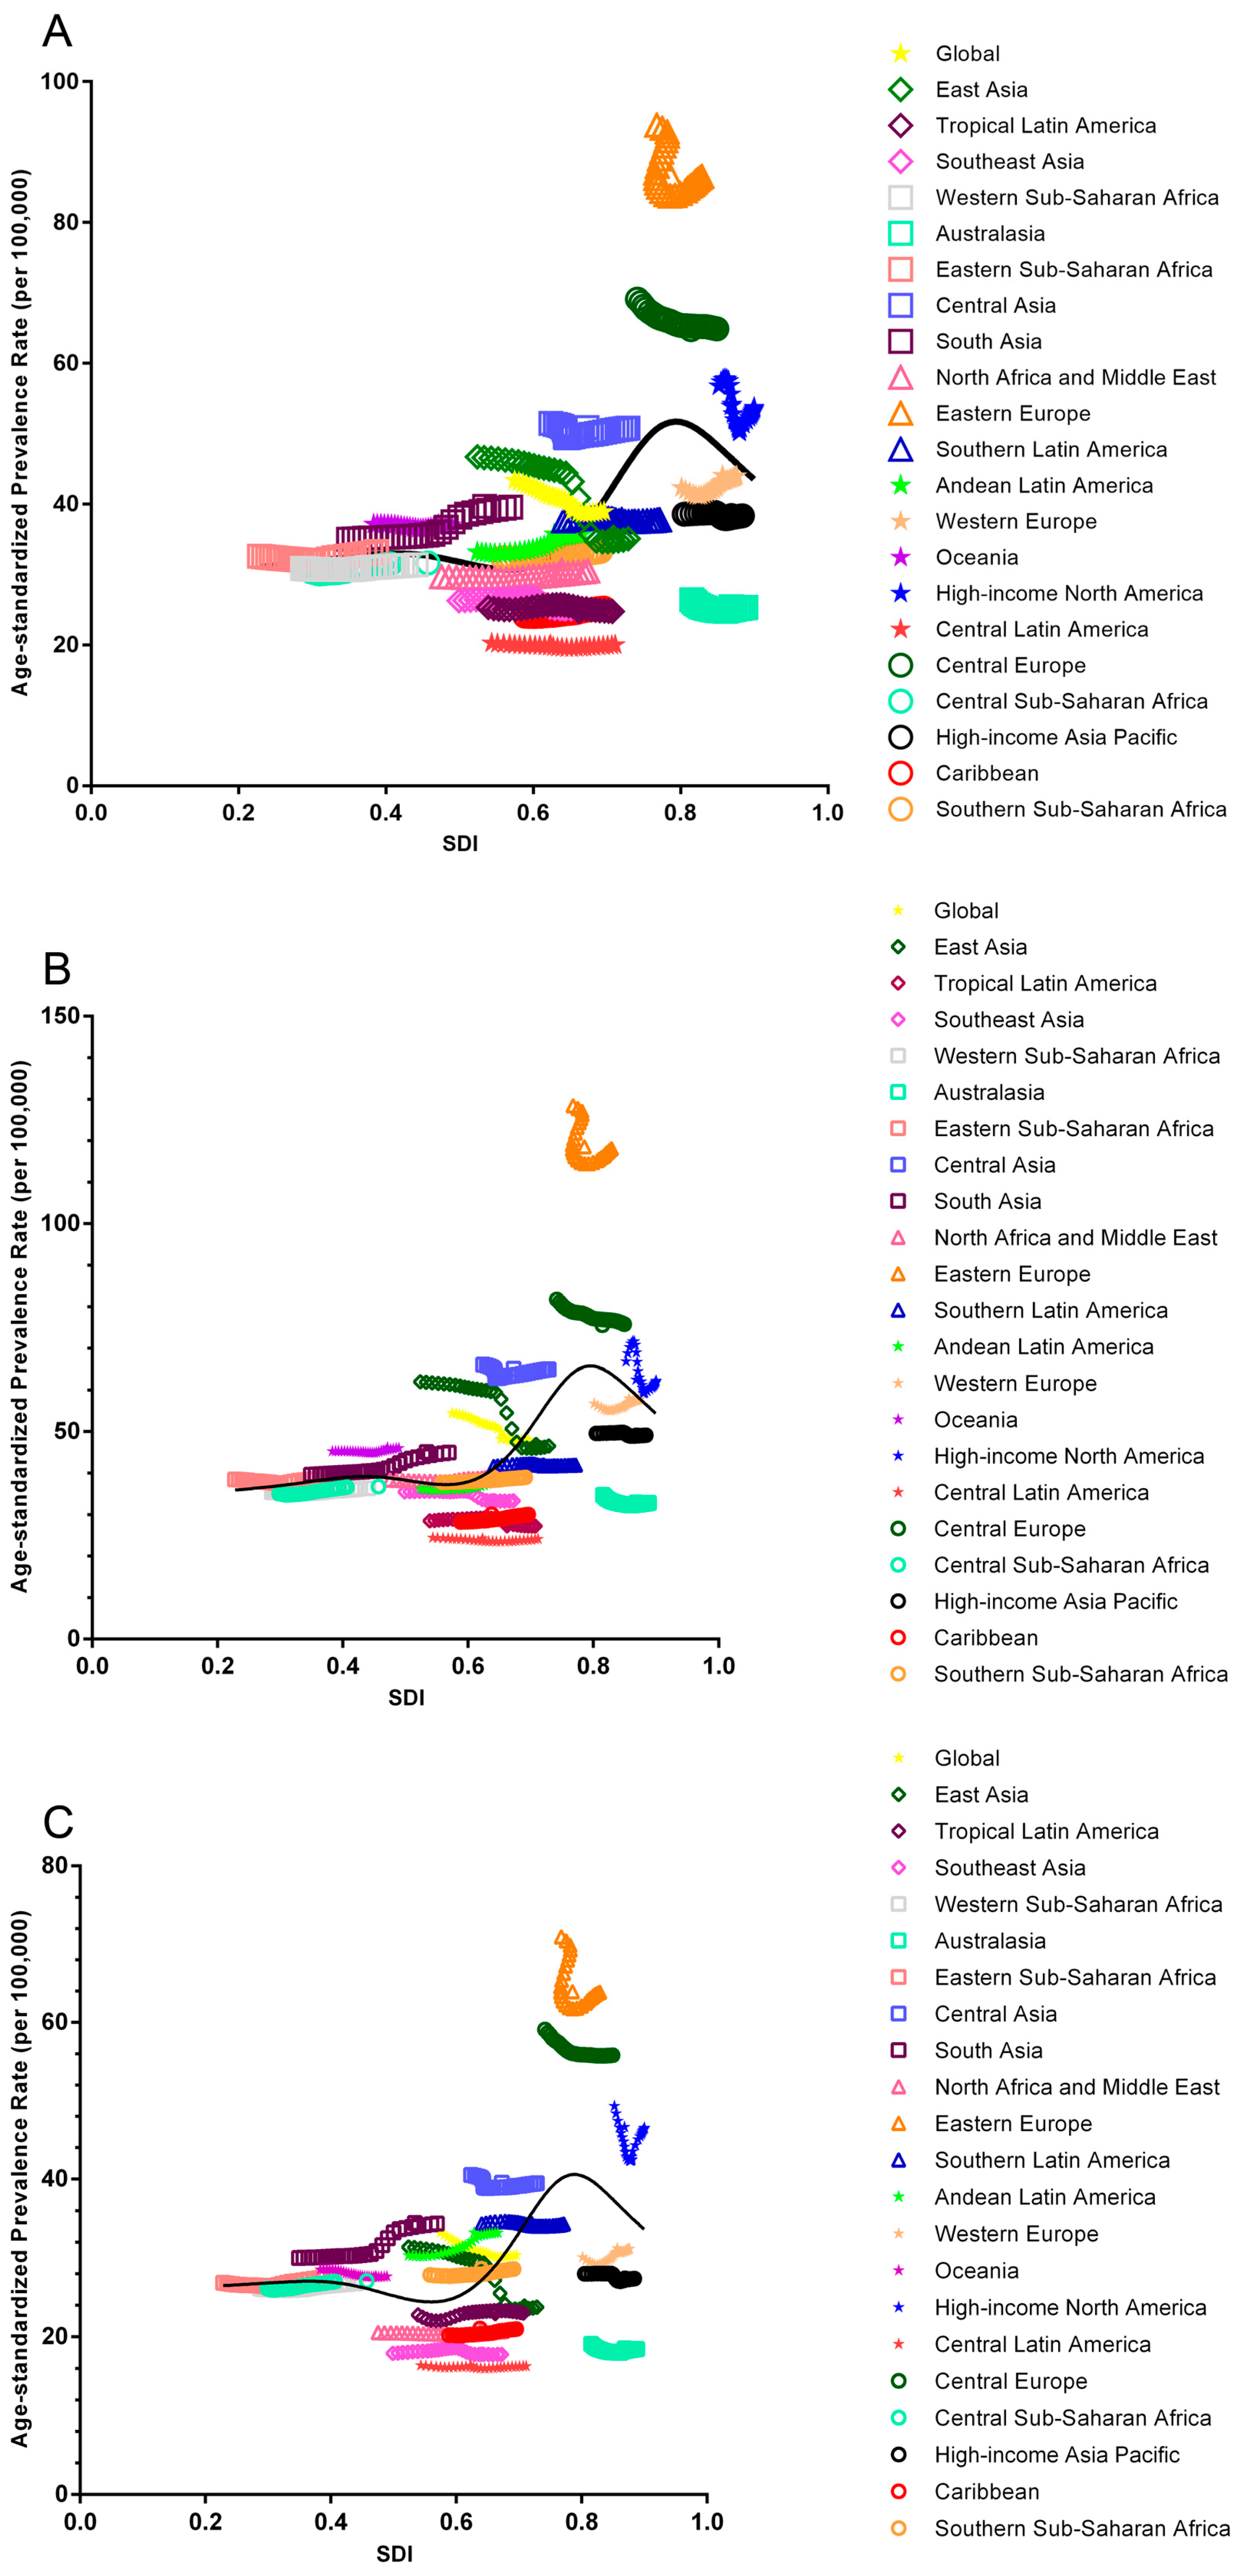
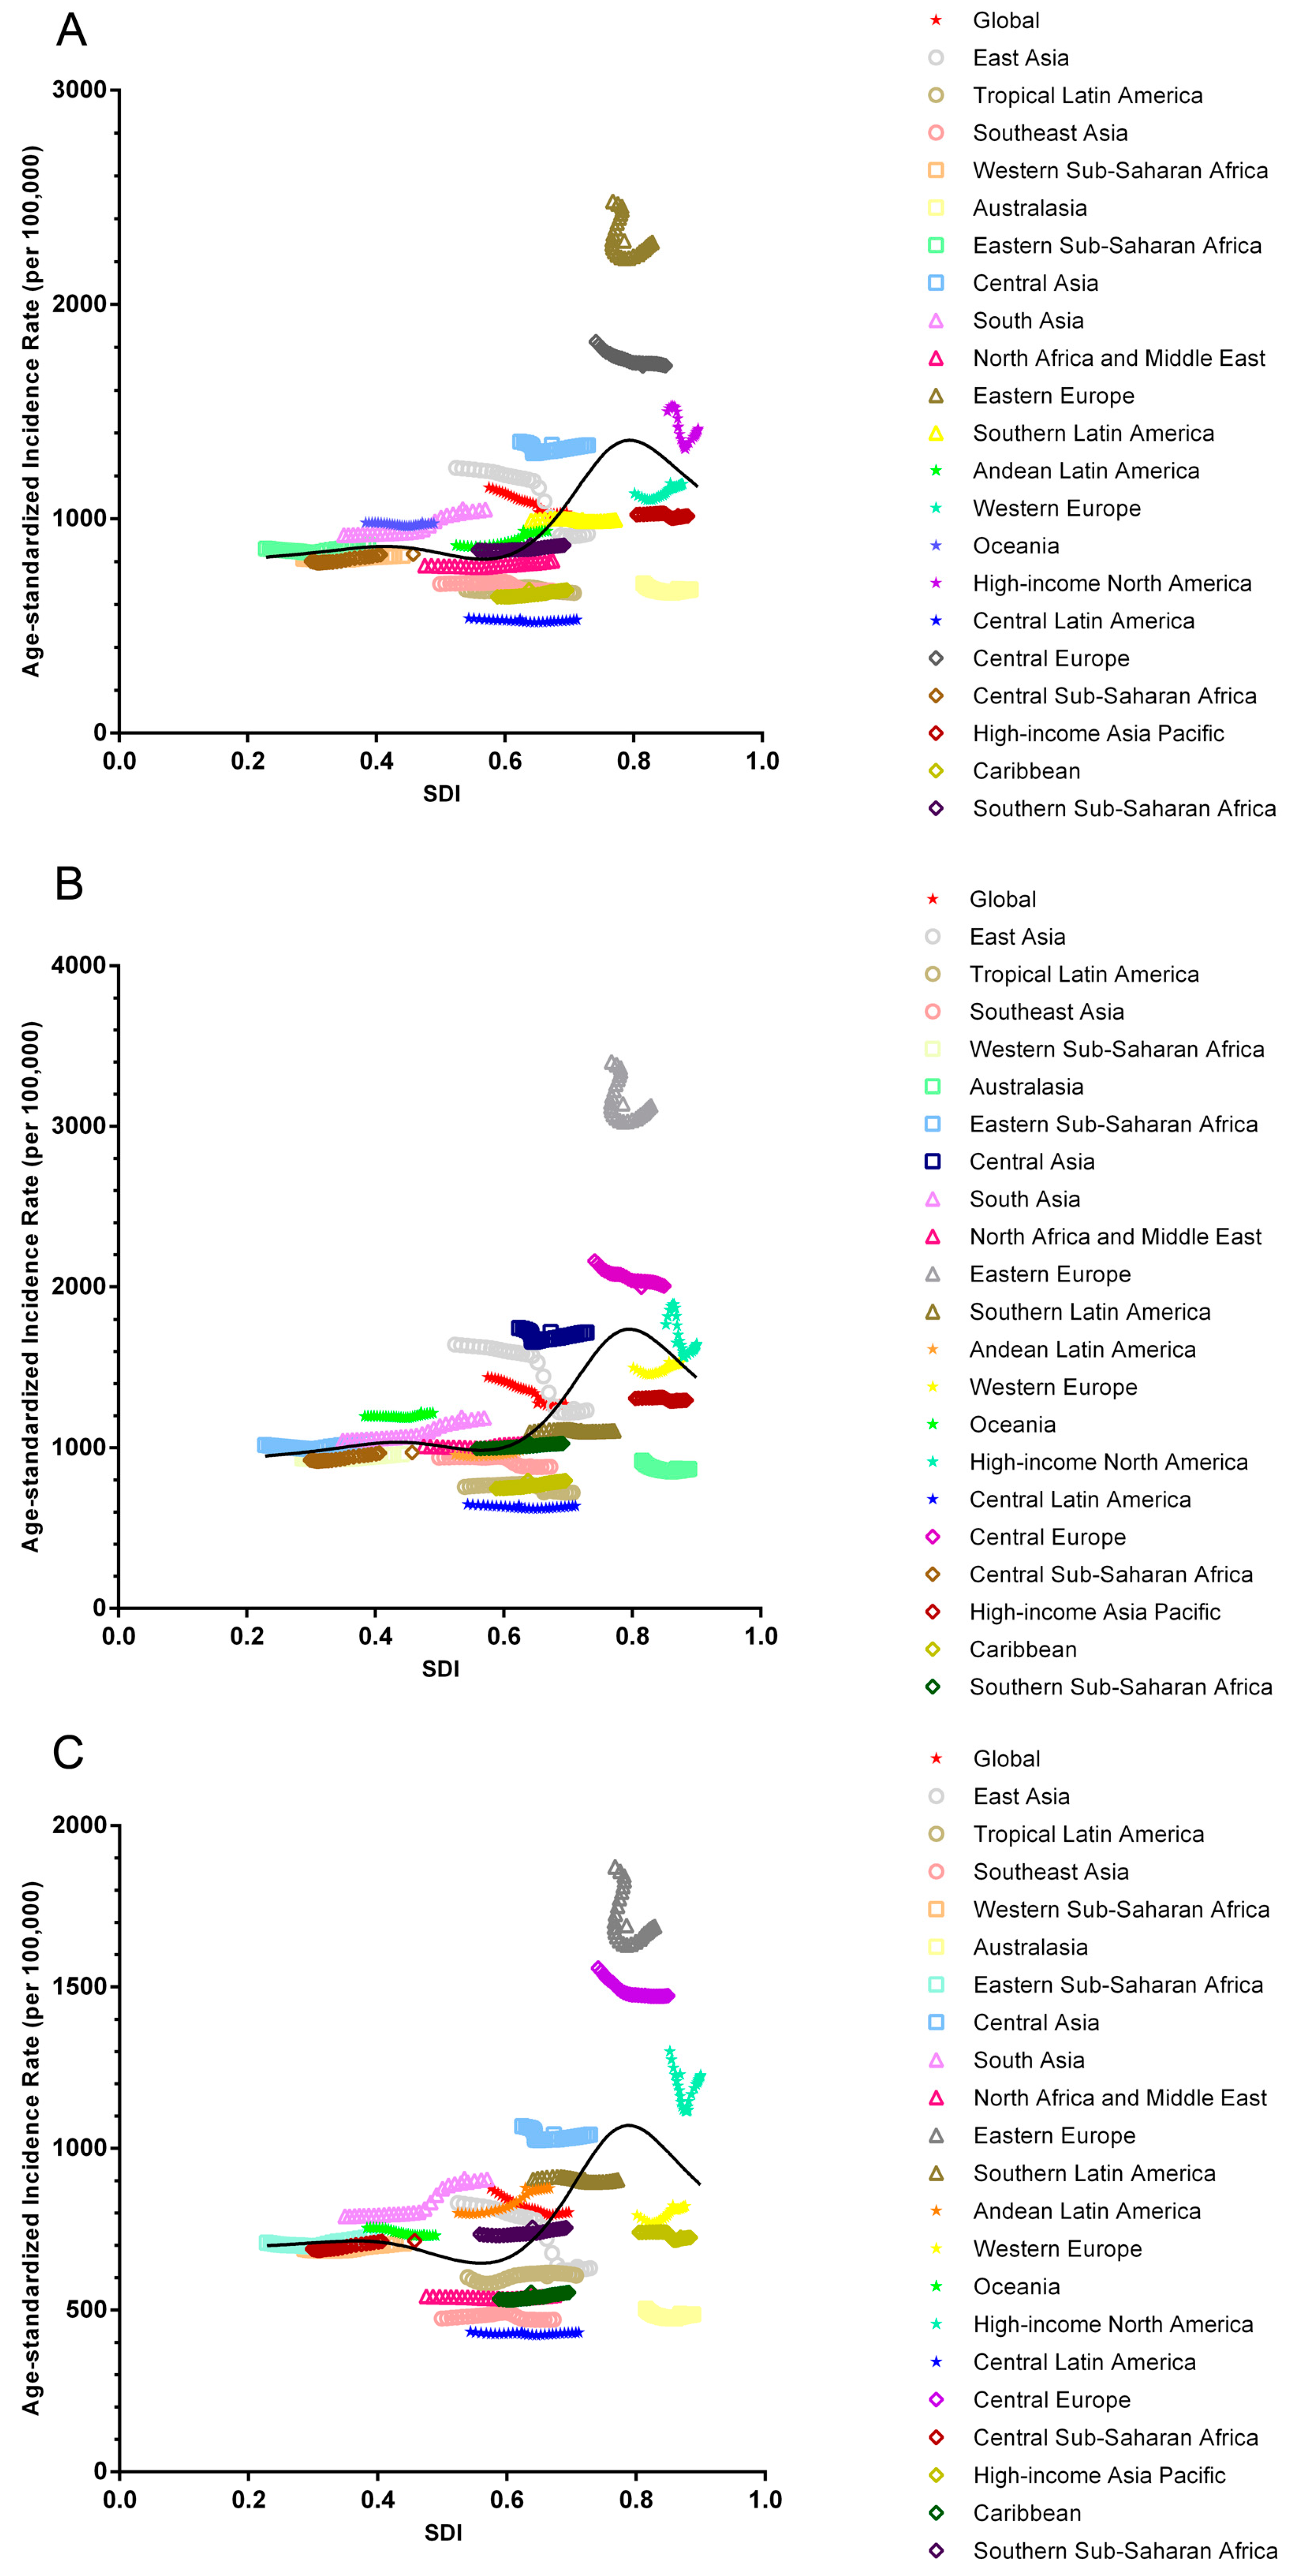
3.1. Age Standardized Incidence Rate (ASIR) of Urolithiasis
3.2. Disability Adjusted Life Years (DALYs) of Urolithiasis
4. Discussion
5. Conclusions
Supplementary Materials
Author Contributions
Funding
Institutional Review Board Statement
Informed Consent Statement
Data Availability Statement
Acknowledgments
Conflicts of Interest
References
- Trinchieri, A.; Curhan, G.; Karlsen, S.; Jun, W.K. Epidemiology. In Stone Disease; Segura, J., Conort, P., Khoury, S., Eds.; ICUD: Paris, France, 2003; Distributed by Editions 21. [Google Scholar]
- Croppi, E.; Ferraro, P.M.; Taddei, L.; Gambaro, G.; GEA Firenze Study Group. Prevalence of renal stones in an Italian urban population: A general practice-based study. Urol. Res. 2012, 40, 517–522. [Google Scholar] [CrossRef]
- Hesse, A.; Brändle, E.; Wilbert, D.; Köhrmann, K.-U.; Alken, P. Study on the prevalence and incidence of urolithiasis in Germany comparing the years 1979 vs. 2000. Eur. Urol. 2003, 44, 709–713. [Google Scholar] [CrossRef]
- Keoghane, S.; Walmsley, B.; Hodgson, D. The natural history of untreated renal tract calculi. BJU Int. 2010, 105, 1627–1629. [Google Scholar] [CrossRef]
- Sorokin, I.; Mamoulakis, C.; Miyazawa, K.; Rodgers, A.; Talati, J.; Lotan, Y. Epidemiology of stone disease across the world. World J. Urol. 2017, 35, 1301–1320. [Google Scholar] [CrossRef]
- Sanchez-Martin, F.M.; Martínez-Rodríguez, R. Incidence and prevalence of published studies about urolithiasis in Spain. A review. Actas Urol. Esp. 2007, 31, 511–520. [Google Scholar]
- Stamatelou, K.K.; Francis, M.E.; Jones, C.A.; Nyberg, L.M., Jr.; Curhan, G.C. Time trends in reported prevalence of kidney stones in the United States: 1976–1994. Kidney Int. 2003, 63, 1817–1823. [Google Scholar] [CrossRef]
- Yasui, T.; Iguchi, M.; Suzuki, S.; Kohri, K. Prevalence and epidemiological characteristics of urolithiasis in Japan: National trends between 1965 and 2005. Urology 2008, 71, 209–213. [Google Scholar] [CrossRef]
- Boyce, W.H.; Garvey, F.K.; Strawcutter, H.E. Incidence of urinary calculi among patients in general hospitals, 1948 to 1952. J. Am. Med. Assoc. 1956, 161, 1437–1442. [Google Scholar] [CrossRef]
- Roth, G.A.; Abate, D.; Abate, K.H.; Abay, S.M.; Abbafati, C.; Abbasi, N.; Abbastabar, H.; Abd-Allah, F.; Abdela, J.; Abdelalim, A.; et al. Global, regional, and national age-sex-specific mortality for 282 causes of death in 195 countries and territories, 1980–2017: A systematic analysis for the Global Burden of Disease Study 2017. Lancet 2018, 392, 1736–1788. [Google Scholar] [CrossRef]
- Qian, X.; Wan, J.; Xu, J.; Liu, C.; Zhong, M.; Zhang, J.; Zhang, Y.; Wang, S. Epidemiological Trends of Urolithiasis at the Global, Regional, and National Levels: A Population-Based Study. Int. J. Clin. Pract. 2022, 2022, 6807203. [Google Scholar] [CrossRef]
- Li, S.; Huang, X.; Liu, J.; Yue, S.; Hou, X.; Hu, L.; Wu, J. Trends in the Incidence and DALYs of Urolithiasis From 1990 to 2019: Results From the Global Burden of Disease Study 2019. Front. Public Health 2022, 10, 825541. [Google Scholar] [CrossRef]
- Lang, J.; Narendrula, A.; El-Zawahry, A.; Sindhwani, P.; Ekwenna, O. Global Trends in Incidence and Burden of Urolithiasis from 1990 to 2019: An Analysis of Global Burden of Disease Study Data. Eur. Urol. Open Sci. 2022, 35, 37–46. [Google Scholar] [CrossRef]
- James, S.L.; Abate, D.; Abate, K.H.; Abay, S.M.; Abbafati, C.; Abbasi, N.; Abbastabar, H.; Abd-Allah, F.; Abdela, J.; Abdelalim, A.; et al. Global, regional, and national incidence, prevalence, and years lived with disability for 354 diseases and injuries for 195 countries and territories, 1990–2017: A systematic analysis for the Global Burden of Disease Study 2017. Lancet 2018, 392, 1789–1858. [Google Scholar] [CrossRef]
- Stanaway, J.D.; Afshin, A.; Gakidou, E.; Lim, S.S.; Abate, D.; Abate, K.H.; Abbafati, C.; Abbasi, N.; Abbastabar, H.; Abd-Allah, F.; et al. Global, regional, and national comparative risk assessment of 84 behavioural, environmental and occupational, and metabolic risks or clusters of risks for 195 countries and territories, 1990–2017: A systematic analysis for the Global Burden of Disease Study 2017. Lancet 2018, 392, 1923–1994. [Google Scholar]
- Kyu, H.H.; Abate, D.; Abate, K.H.; Abay, S.M.; Abbafati, C.; Abbasi, N.; Abbastabar, H.; Abd-Allah, F.; Abdela, J.; Abdelalim, A.; et al. Global, regional, and national disability-adjusted life-years (DALYs) for 359 diseases and injuries and healthy life expectancy (HALE) for 195 countries and territories, 1990–2017: A systematic analysis for the Global Burden of Disease Study 2017. Lancet 2018, 392, 1859–1922. [Google Scholar] [CrossRef] [PubMed]
- Hassan, B.; Ahmed, R.; Li, B.; Noor, A.; Hassan, Z.U. A comprehensive study capturing vision loss burden in Pakistan (1990–2025): Findings from the Global Burden of Disease (GBD) 2017 study. PLoS ONE 2019, 14, e0216492. [Google Scholar] [CrossRef] [PubMed]
- Mokdad, A.H.; Ballestros, K.; Echko, M.; Glenn, S.; Olsen, H.E.; Mullany, E.; Lee, A.; Khan, A.R.; Ahmadi, A.; Ferrari, A.J.; et al. The State of US Health, 1990–2016: Burden of Diseases, Injuries, and Risk Factors Among US States. JAMA 2018, 319, 1444–1472. [Google Scholar]
- McKee, S. Rethinking Development and Health: Findings from the Global Burden of Disease Study; Institute for Health Metrics and Evaluation: Seattle, WA, USA, 2016. [Google Scholar]
- Hankey, B.F.; Ries, L.A.; Kosary, C.L.; Feuer, E.J.; Merrill, R.M.; Clegg, L.X.; Edwards, B.K. Partitioning linear trends in age-adjusted rates. Cancer Causes Control 2000, 11, 31–35. [Google Scholar] [CrossRef]
- Liu, Z.; Jiang, Y.; Yuan, H.; Fang, Q.; Cai, N.; Suo, C.; Jin, L.; Zhang, T.; Chen, X. The trends in incidence of primary liver cancer caused by specific etiologies: Results from the Global Burden of Disease Study 2016 and implications for liver cancer prevention. J. Hepatol. 2019, 70, 674–683. [Google Scholar] [CrossRef]
- Feigin, V.L.; Nichols, E.; Alam, T.; Bannick, M.S.; Beghi, E.; Blake, N.; Culpepper, W.J.; Dorsey, E.R.; Elbaz, A.; Ellenbogen, R.G.; et al. Global, regional, and national burden of neurological disorders, 1990–2016: A systematic analysis for the Global Burden of Disease Study 2016. Lancet Neurol. 2019, 18, 459–480. [Google Scholar] [CrossRef]
- Lieske, J.C.; De La Vega, L.S.P.; Slezak, J.M.; Bergstralh, E.J.; Leibson, C.L.; Ho, K.L.; Gettman, M.T. Renal stone epidemiology in Rochester, Minnesota: An update. Kidney Int. 2006, 69, 760–764. [Google Scholar] [CrossRef] [PubMed]
- Du, J.; Johnston, R.; Rice, M. Temporal trends of acute nephrolithiasis in Auckland, New Zealand. N. Z. Med. J. 2009, 122, 13–20. [Google Scholar] [PubMed]
- Trinchieri, A.; Coppi, F.; Montanari, E.; Del Nero, A.; Zanetti, G.; Pisani, E. Increase in the prevalence of symptomatic upper urinary tract stones during the last ten years. Eur. Urol. 2000, 37, 23–25. [Google Scholar] [CrossRef]
- Shuster, J.; Scheaffer, R.L. Economic impact of kidney stones in white male adults. Urology 1984, 24, 327–331. [Google Scholar] [CrossRef]
- Türk, C.; Petřík, A.; Sarica, K.; Seitz, C.; Skolarikos, A.; Straub, M.; Knoll, T. EAU Guidelines on Interventional Treatment for Urolithiasis. Eur. Urol. 2016, 69, 475–482. [Google Scholar] [CrossRef] [PubMed]
- Türk, C.; Petřík, A.; Sarica, K.; Seitz, C.; Skolarikos, A.; Straub, M.; Knoll, T. EAU Guidelines on Diagnosis and Conservative Management of Urolithiasis. Eur. Urol. 2016, 69, 468–474. [Google Scholar] [CrossRef]
- Xiao, Y.; Su, C.; Ouyang, Y.; Zhang, B. Trends of vegetables and fruits consumption among Chinese adults aged 18 to 44 years old from 1991 to 2011. Zhonghua Liu Xing Bing Xue Za Zhi 2015, 36, 232–236. [Google Scholar]
- Liu, Y.; Chen, Y.; Liao, B.; Luo, D.; Wang, K.; Li, H.; Zeng, G. Epidemiology of urolithiasis in Asia. Asian J. Urol. 2018, 5, 205–214. [Google Scholar] [CrossRef]
- Krieger, N.; Williams, D.R.; Moss, N.E. Measuring social class in US public health research: Concepts, methodologies, and guidelines. Annu. Rev. Public Health 1997, 18, 341–378. [Google Scholar] [CrossRef]
- Razi, S.; Ghoncheh, M.; Mohammadian-Hafshejani, A.; Aziznejhad, H.; Mohammadian, M.; Salehiniya, H. The Incidence and Mortality of Ovarian Cancer and Their Relationship. Ecancermedicalscience 2016, 10, 628. [Google Scholar] [CrossRef]
- Weiderpass, E.; Oh, J.-K.; Algeri, S.; Bellocco, R. Socioeconomic status and epithelial ovarian cancer survival in Sweden. Cancer Causes Control 2014, 25, 1063–1073. [Google Scholar] [CrossRef] [PubMed]
- Ginsburg, O.; Bray, F.; Coleman, M.P.; Vanderpuye, V.; Eniu, A.; Kotha, S.R.; Sarker, M.; Huong, T.T.; Allemani, C.; Dvaladze, A.; et al. The global burden of women’s cancers: A grand challenge in global health. Lancet 2017, 389, 847–860. [Google Scholar] [CrossRef]
- Kaufman, J.; Vicedo-Cabrera, A.M.; Tam, V.; Song, L.; Coffel, E.; Tasian, G. The impact of heat on kidney stone presentations in South Carolina under two climate change scenarios. Sci. Rep. 2022, 12, 369. [Google Scholar] [CrossRef] [PubMed]
- Khan, M.M.H.; Havukainen, J.; Horttanainen, M. Impact of utilizing solid recovered fuel on the global warming potential of cement production and waste management system: A life cycle assessment approach. Waste Manag. Res. 2021, 39, 561–572. [Google Scholar] [CrossRef] [PubMed]
- Llanos, A.; Warner, W.A.; Luciani, S.; Lee, T.Y.; Bajracharya, S.; Slovacek, S.; Roach, V.; Lamont-Greene, M. Gynecologic cancer mortality in Trinidad and Tobago and comparisons of mortality-to-incidence rate ratios across global regions. Cancer Causes Control 2017, 28, 1251–1263. [Google Scholar] [CrossRef]
- Robertson, W.G. Renal stones in the tropics. Semin. Nephrol. 2003, 23, 77–87. [Google Scholar] [CrossRef]
- Ali, S.H.; Rifat, U.N. Etiological and clinical patterns of childhood urolithiasis in Iraq. Pediatr. Nephrol. 2005, 20, 1453–1457. [Google Scholar] [CrossRef]
- Fitzmaurice, C.; Abate, D.; Abbasi, N.; Abbastabar, H.; Abd-Allah, F.; Abdel-Rahman, O.; Abdelalim, A.; Abdoli, A.; Abdollahpour, I.; Abdulle, A.S.M.; et al. Global, Regional, and National Cancer Incidence, Mortality, Years of Life Lost, Years Lived with Disability, and Disability-Adjusted Life-Years for 29 Cancer Groups, 1990 to 2016: A Systematic Analysis for the Global Burden of Disease Study. JAMA Oncol. 2018, 4, 1553–1568. [Google Scholar]
- Ahern, R.M.; Lozano, R.; Naghavi, M.; Foreman, K.; Gakidou, E.; Murray, C.J. Improving the public health utility of global cardiovascular mortality data: The rise of ischemic heart disease. Popul. Health Metr. 2011, 9, 8. [Google Scholar] [CrossRef]
- Global Burden of Disease Study 2019 (GBD 2019) Data Input Sources Tool; Institute for Health Metrics and Evaluation: Seattle, WA, USA, 2019; Available online: https://ghdx.healthdata.org/gbd-2019/data-input-sources (accessed on 1 December 2022).
- Das Gupta, P. Standardization and Decomposition of Rates: A User’s Manual; U.S. Department of Commerce, Economics and Statistics Administration, Bureau of the Census: Washington, DC, USA, 1993; pp. 19–36. [Google Scholar]
- Das Gupta, P. Standardization and Decomposition of Rates from Cross-Classified Data. Genus 1994, 50, 171–196. [Google Scholar] [PubMed]
- Chevan, A.; Sutherland, M. Revisiting Das Gupta: Refinement and extension of standardization and decomposition. Demography 2009, 46, 429–449. [Google Scholar] [CrossRef]
- Bowe, B.; Xie, Y.; Li, T.; Xian, H.; Al-Aly, Z. Particulate Matter Air Pollution and the Risk of Incident CKD and Progression to ESRD. J. Am. Soc. Nephrol. 2018, 29, 218–230. [Google Scholar] [CrossRef] [PubMed]


| ASIR | DALYs | |||||
|---|---|---|---|---|---|---|
| Year | Both Male and Female | Male | Female | Both Male and Female | Male | Female |
| 1990 | 1146.047641 | 1440.793066 | 875.8114857 | 9.427001255 | 11.18863773 | 7.973054209 |
| 1991 | 1140.911218 | 1436.61929 | 868.5097849 | 9.39061477 | 11.16270689 | 7.922430885 |
| 1992 | 1135.762233 | 1431.9645 | 861.7192101 | 9.36658052 | 11.09585561 | 7.930221913 |
| 1993 | 1130.191462 | 1426.5021 | 855.0269892 | 9.299745192 | 10.99529361 | 7.881904971 |
| 1994 | 1124.645275 | 1420.736097 | 848.901434 | 9.053485315 | 10.73258633 | 7.638401684 |
| 1995 | 1119.436554 | 1415.011279 | 843.6554232 | 8.692092247 | 10.34541661 | 7.285534651 |
| 1996 | 1113.859253 | 1408.393382 | 838.7490017 | 8.282838434 | 9.869189374 | 6.923735513 |
| 1997 | 1107.69147 | 1400.543025 | 833.931449 | 8.005927994 | 9.625529321 | 6.606542967 |
| 1998 | 1101.155628 | 1392.024039 | 829.1017686 | 7.757849186 | 9.323976626 | 6.39918849 |
| 1999 | 1095.041447 | 1383.898419 | 824.7663553 | 7.603703949 | 9.1440201 | 6.264852915 |
| 2000 | 1090.020906 | 1377.162259 | 821.2682917 | 7.442599032 | 9.012731993 | 6.06963117 |
| 2001 | 1086.013963 | 1371.772109 | 818.4771954 | 7.251061201 | 8.859252356 | 5.842025802 |
| 2002 | 1082.627938 | 1367.045562 | 816.2512963 | 7.081799647 | 8.698538836 | 5.660230101 |
| 2003 | 1079.422137 | 1362.43179 | 814.2720769 | 6.912126255 | 8.540729982 | 5.476002512 |
| 2004 | 1076.408171 | 1357.917612 | 812.5774435 | 6.759182321 | 8.378038779 | 5.326008996 |
| 2005 | 1073.399559 | 1353.298749 | 811.0104047 | 6.640680704 | 8.23488217 | 5.222382904 |
| 2006 | 1065.985207 | 1341.19763 | 808.1331063 | 6.449663697 | 8.005666955 | 5.061498996 |
| 2007 | 1052.913051 | 1319.364923 | 803.6658621 | 6.303375455 | 7.810608222 | 4.956258738 |
| 2008 | 1038.240731 | 1294.641594 | 798.9102725 | 6.233267481 | 7.704416674 | 4.917888338 |
| 2009 | 1026.320337 | 1274.275091 | 795.3064952 | 6.124649977 | 7.531218857 | 4.867998357 |
| 2010 | 1021.561136 | 1265.710553 | 794.3282972 | 6.079312489 | 7.433786439 | 4.868709668 |
| 2011 | 1021.931662 | 1265.637737 | 795.1469297 | 6.009475453 | 7.325908862 | 4.830072279 |
| 2012 | 1022.798159 | 1266.314351 | 796.2151329 | 5.979276847 | 7.270361007 | 4.819140076 |
| 2013 | 1024.003667 | 1267.443282 | 797.5020103 | 5.98219769 | 7.238329177 | 4.851921944 |
| 2014 | 1025.494809 | 1268.944095 | 798.9300114 | 6.027458681 | 7.259450318 | 4.917627711 |
| 2015 | 1027.278721 | 1270.930727 | 800.47074 | 6.09657588 | 7.317248455 | 4.995490077 |
| 2016 | 1029.251288 | 1273.264415 | 802.0485335 | 6.113928135 | 7.331595153 | 5.015602337 |
| 2017 | 1029.342488 | 1274.353335 | 802.1264334 | 6.124817645 | 7.330605333 | 5.014520307 |
| 2018 | 1030.366188 | 1275.154675 | 803.4326121 | 6.163431149 | 7.286751188 | 4.953148863 |
| 2019 | 1031.497187 | 1276.066795 | 803.7609031 | 6.046272099 | 7.267762028 | 4.946559974 |
| Both Male and Female | Male | Female | |||||||||||||
|---|---|---|---|---|---|---|---|---|---|---|---|---|---|---|---|
| PC | APC | 95%CI | 95%CI | p-Value | PC | APC | 95%CI | 95%CI | p-Value | PC | APC | 95%CI | 95%CI | p-Value | |
| Central Asia | −1.065 | −0.006 | −0.063 | 0.050 | 0.818 | −1.530 | −0.010 | −0.080 | 0.060 | 0.772 | −2.341 | −0.076 | −0.127 | −0.025 | 0.005 |
| Eastern Asia | −24.330 | −1.396 | −1.653 | −1.138 | <0.001 | −24.363 | −1.402 | −1.675 | −1.130 | <0.001 | −23.715 | −1.335 | −1.557 | −1.114 | <0.001 |
| High-income Asia Pacific | −0.485 | −0.062 | −0.091 | −0.033 | <0.001 | −0.854 | −0.066 | −0.087 | −0.045 | <0.001 | −2.032 | −0.130 | −0.171 | −0.088 | <0.001 |
| South Asia | 13.301 | 0.568 | 0.481 | 0.656 | <0.001 | 13.904 | 0.564 | 0.490 | 0.638 | <0.001 | 14.777 | 0.660 | 0.550 | 0.770 | <0.001 |
| Southeast Asia | −4.006 | −0.253 | −0.329 | −0.177 | <0.001 | −5.788 | −0.336 | −0.413 | −0.259 | <0.001 | −0.610 | −0.099 | −0.173 | −0.026 | 0.010 |
| Central Europe | −6.216 | −0.196 | −0.229 | −0.162 | <0.001 | −7.562 | −0.237 | −0.263 | −0.210 | <0.001 | −5.417 | −0.182 | −0.226 | −0.137 | <0.001 |
| Eastern Europe | −7.412 | −0.317 | −0.434 | −0.200 | <0.001 | −7.647 | −0.336 | −0.454 | −0.217 | <0.001 | −9.720 | −0.393 | −0.529 | −0.257 | <0.001 |
| Western Europe | 4.148 | 0.262 | 0.219 | 0.304 | <0.001 | 2.298 | 0.188 | 0.148 | 0.229 | <0.001 | 3.852 | 0.263 | 0.212 | 0.314 | <0.001 |
| Andean Latin America | 7.773 | 0.382 | 0.340 | 0.424 | <0.001 | 6.184 | 0.317 | 0.275 | 0.358 | <0.001 | 9.655 | 0.456 | 0.411 | 0.501 | <0.001 |
| Central Latin America | −1.064 | −0.029 | −0.074 | 0.017 | 0.205 | −0.919 | −0.038 | −0.096 | 0.020 | 0.193 | −0.571 | 0.011 | −0.019 | 0.041 | 0.464 |
| Southern Latin America | 0.496 | −0.032 | −0.052 | −0.013 | 0.002 | 0.874 | −0.016 | −0.035 | 0.003 | 0.098 | 0.102 | −0.051 | −0.073 | −0.028 | <0.001 |
| Tropical Latin America | −2.436 | −0.084 | −0.142 | −0.025 | 0.007 | −4.542 | −0.285 | −0.368 | −0.202 | <0.001 | 0.489 | 0.157 | 0.094 | 0.221 | <0.001 |
| High-income North America | −5.087 | −0.305 | −0.491 | −0.120 | 0.002 | −6.431 | −0.572 | −0.779 | −0.365 | <0.001 | −5.464 | 0.001 | −0.207 | 0.209 | 0.992 |
| Central Sub-Saharan Africa | 4.118 | 0.194 | 0.154 | 0.234 | <0.001 | 4.962 | 0.225 | 0.179 | 0.270 | <0.001 | 3.656 | 0.169 | 0.140 | 0.197 | <0.001 |
| Eastern Sub-Saharan Africa | 2.022 | 0.094 | 0.042 | 0.146 | 0.001 | 2.130 | 0.097 | 0.039 | 0.155 | 0.002 | 2.891 | 0.136 | 0.088 | 0.184 | <0.001 |
| Southern Sub-Saharan Africa | 2.884 | 0.127 | 0.109 | 0.144 | <0.001 | 3.415 | 0.135 | 0.129 | 0.141 | <0.001 | 2.876 | 0.135 | 0.116 | 0.154 | <0.001 |
| Western Sub-Saharan Africa | 1.653 | 0.078 | 0.055 | 0.101 | <0.001 | 2.655 | 0.111 | 0.080 | 0.142 | <0.001 | 2.451 | 0.124 | 0.095 | 0.154 | <0.001 |
| North Africa and Middle East | 3.135 | 0.140 | 0.110 | 0.169 | <0.001 | 3.475 | 0.163 | 0.136 | 0.191 | <0.001 | 1.180 | 0.037 | 0.007 | 0.067 | 0.016 |
| Oceania | −0.158 | −0.013 | −0.041 | 0.015 | 0.363 | 1.933 | 0.070 | 0.039 | 0.101 | <0.001 | −3.025 | −0.143 | −0.166 | −0.120 | <0.001 |
| Australasia | −3.774 | −0.067 | −0.136 | 0.001 | 0.054 | −5.276 | −0.127 | −0.200 | −0.054 | 0.001 | −3.053 | −0.035 | −0.106 | 0.036 | 0.315 |
| Caribbean | 5.131 | 0.216 | 0.197 | 0.235 | <0.001 | 6.675 | 0.268 | 0.248 | 0.288 | <0.001 | 4.064 | 0.176 | 0.158 | 0.195 | <0.001 |
| Both Male and Female | Male | Female | ||||||||||||||
|---|---|---|---|---|---|---|---|---|---|---|---|---|---|---|---|---|
| Number | Countries and Territories | PC | APC | 95%CI | 95%CI | p-Value | PC | APC | 95%CI | 95%CI | p-Value | PC | APC | 95%CI | 95%CI | p-Value |
| 1 | Afghanistan | 2.105 | 0.106 | 0.078 | 0.134 | <0.001 | 2.540 | 0.116 | 0.092 | 0.140 | <0.001 | 2.374 | 0.094 | 0.075 | 0.114 | <0.001 |
| 2 | Albania | 1.031 | 0.057 | 0.034 | 0.080 | <0.001 | 0.925 | 0.066 | 0.034 | 0.098 | <0.001 | 2.053 | 0.079 | 0.064 | 0.093 | <0.001 |
| 3 | Algeria | 2.295 | 0.098 | 0.087 | 0.108 | <0.001 | 1.942 | 0.089 | 0.077 | 0.102 | <0.001 | 2.043 | 0.077 | 0.068 | 0.086 | <0.001 |
| 4 | American Samoa | −10.603 | −0.520 | −0.573 | −0.466 | <0.001 | −8.667 | −0.430 | −0.484 | −0.376 | <0.001 | −11.115 | −0.548 | −0.590 | −0.506 | <0.001 |
| 5 | Andorra | 0.186 | −0.037 | −0.052 | −0.022 | <0.001 | 0.859 | 0.006 | −0.012 | 0.024 | 0.491 | 2.008 | 0.047 | 0.035 | 0.060 | <0.001 |
| 6 | Angola | 2.561 | 0.131 | 0.105 | 0.158 | <0.001 | 4.465 | 0.200 | 0.173 | 0.227 | <0.001 | 3.386 | 0.162 | 0.136 | 0.188 | <0.001 |
| 7 | Antigua and Barbuda | 6.458 | 0.244 | 0.232 | 0.256 | <0.001 | 5.941 | 0.226 | 0.213 | 0.238 | <0.001 | 5.040 | 0.195 | 0.189 | 0.202 | <0.001 |
| 8 | Argentina | 2.269 | 0.087 | 0.073 | 0.101 | <0.001 | 2.539 | 0.097 | 0.085 | 0.109 | <0.001 | 2.059 | 0.077 | 0.064 | 0.090 | <0.001 |
| 9 | Armenia | −5.537 | −0.208 | −0.280 | −0.136 | <0.001 | −4.310 | −0.145 | −0.218 | −0.071 | <0.001 | −7.671 | −0.332 | −0.393 | −0.272 | <0.001 |
| 10 | Australia | −0.339 | 0.028 | −0.009 | 0.064 | 0.129 | −2.071 | −0.035 | −0.083 | 0.012 | 0.140 | 0.518 | 0.059 | 0.032 | 0.087 | <0.001 |
| 11 | Austria | 6.372 | 0.277 | 0.012 | 0.541 | 0.041 | 7.061 | 0.295 | −0.080 | 0.671 | 0.118 | −0.339 | −0.002 | −0.080 | 0.076 | 0.954 |
| 12 | Azerbaijan | 5.502 | 0.280 | 0.207 | 0.352 | <0.001 | 4.577 | 0.254 | 0.148 | 0.360 | <0.001 | 3.702 | 0.200 | 0.144 | 0.257 | <0.001 |
| 13 | Bahrain | 3.254 | 0.175 | 0.154 | 0.196 | <0.001 | 2.001 | 0.090 | 0.083 | 0.096 | <0.001 | 1.285 | 0.038 | 0.033 | 0.042 | <0.001 |
| 14 | Bangladesh | 8.883 | 0.327 | 0.296 | 0.359 | <0.001 | 11.902 | 0.436 | 0.390 | 0.483 | <0.001 | 6.904 | 0.267 | 0.235 | 0.299 | <0.001 |
| 15 | Barbados | 2.702 | 0.140 | 0.126 | 0.154 | <0.001 | 0.566 | 0.083 | 0.050 | 0.116 | <0.001 | 2.920 | 0.134 | 0.117 | 0.151 | <0.001 |
| 16 | Belarus | 5.666 | 0.227 | 0.128 | 0.326 | <0.001 | 7.651 | 0.299 | 0.199 | 0.399 | <0.001 | 2.929 | 0.145 | 0.031 | 0.258 | 0.014 |
| 17 | Belgium | 17.111 | 0.891 | 0.628 | 1.155 | <0.001 | 17.327 | 0.912 | 0.626 | 1.198 | <0.001 | 13.416 | 0.731 | 0.515 | 0.947 | <0.001 |
| 18 | Belize | 6.754 | 0.249 | 0.243 | 0.254 | <0.001 | 7.918 | 0.285 | 0.275 | 0.294 | <0.001 | 4.740 | 0.179 | 0.158 | 0.200 | <0.001 |
| 19 | Benin | 2.202 | 0.097 | 0.070 | 0.123 | <0.001 | 1.602 | 0.060 | 0.042 | 0.079 | <0.001 | 2.936 | 0.139 | 0.110 | 0.167 | <0.001 |
| 20 | Bermuda | 3.960 | 0.179 | 0.165 | 0.193 | <0.001 | 5.262 | 0.216 | 0.201 | 0.231 | <0.001 | 1.910 | 0.104 | 0.087 | 0.121 | <0.001 |
| 21 | Bhutan | 8.416 | 0.309 | 0.287 | 0.331 | <0.001 | 8.959 | 0.342 | 0.311 | 0.372 | <0.001 | 6.192 | 0.235 | 0.216 | 0.254 | <0.001 |
| 22 | Bolivia | 2.084 | 0.098 | 0.084 | 0.112 | <0.001 | 1.169 | 0.069 | 0.053 | 0.084 | <0.001 | 2.885 | 0.128 | 0.114 | 0.141 | <0.001 |
| 23 | Bosnia and Herzegovina | 4.153 | 0.165 | 0.154 | 0.176 | <0.001 | 4.099 | 0.174 | 0.161 | 0.188 | <0.001 | 3.308 | 0.126 | 0.119 | 0.133 | <0.001 |
| 24 | Botswana | 3.260 | 0.133 | 0.107 | 0.159 | <0.001 | 3.197 | 0.126 | 0.104 | 0.148 | <0.001 | 2.787 | 0.120 | 0.100 | 0.140 | <0.001 |
| 25 | Brazil | −2.582 | −0.089 | −0.149 | −0.029 | 0.005 | −4.772 | −0.298 | −0.383 | −0.212 | <0.001 | 0.438 | 0.159 | 0.094 | 0.224 | <0.001 |
| 26 | Brunei | −3.843 | −0.153 | −0.175 | −0.131 | <0.001 | −4.072 | −0.174 | −0.183 | −0.165 | <0.001 | 1.050 | 0.047 | 0.038 | 0.056 | <0.001 |
| 27 | Bulgaria | −15.062 | −0.616 | −0.754 | −0.478 | <0.001 | −16.907 | −0.715 | −0.859 | −0.570 | <0.001 | −12.332 | −0.488 | −0.610 | −0.366 | <0.001 |
| 28 | Burkina Faso | 1.022 | 0.050 | 0.038 | 0.062 | <0.001 | 0.922 | 0.041 | 0.026 | 0.055 | <0.001 | 1.711 | 0.089 | 0.070 | 0.109 | <0.001 |
| 29 | Burundi | 3.680 | 0.139 | 0.085 | 0.192 | <0.001 | 0.447 | 0.005 | −0.058 | 0.068 | 0.873 | 2.964 | 0.125 | 0.078 | 0.171 | <0.001 |
| 30 | Cambodia | 5.173 | 0.211 | 0.165 | 0.256 | <0.001 | 4.426 | 0.189 | 0.135 | 0.243 | <0.001 | 4.206 | 0.161 | 0.132 | 0.190 | <0.001 |
| 31 | Cameroon | 1.129 | 0.060 | 0.037 | 0.083 | <0.001 | 1.012 | 0.045 | 0.027 | 0.063 | <0.001 | 1.037 | 0.066 | 0.036 | 0.097 | <0.001 |
| 32 | Canada | 2.296 | 0.105 | 0.097 | 0.114 | <0.001 | 1.780 | 0.091 | 0.082 | 0.099 | <0.001 | 1.498 | 0.068 | 0.057 | 0.079 | <0.001 |
| 33 | Cape Verde | 4.380 | 0.183 | 0.152 | 0.214 | <0.001 | 3.366 | 0.149 | 0.118 | 0.180 | <0.001 | 2.315 | 0.106 | 0.083 | 0.129 | <0.001 |
| 34 | Central African Republic | 4.741 | 0.199 | 0.167 | 0.231 | <0.001 | 5.124 | 0.204 | 0.171 | 0.236 | <0.001 | 3.754 | 0.166 | 0.136 | 0.195 | <0.001 |
| 35 | Chad | 4.400 | 0.183 | 0.156 | 0.210 | <0.001 | 2.836 | 0.111 | 0.085 | 0.138 | <0.001 | 3.213 | 0.151 | 0.119 | 0.183 | <0.001 |
| 36 | Chile | −4.029 | −0.326 | −0.383 | −0.269 | <0.001 | −3.394 | −0.291 | −0.347 | −0.236 | <0.001 | −4.931 | −0.373 | −0.436 | −0.310 | <0.001 |
| 37 | China | −26.411 | −1.492 | −1.764 | −1.220 | <0.001 | −26.565 | −1.500 | −1.787 | −1.213 | <0.001 | −25.503 | −1.424 | −1.656 | −1.191 | <0.001 |
| 38 | Colombia | 3.242 | 0.123 | 0.100 | 0.146 | <0.001 | 3.749 | 0.144 | 0.122 | 0.166 | <0.001 | 3.511 | 0.129 | 0.109 | 0.150 | <0.001 |
| 39 | Comoros | 1.315 | 0.057 | 0.011 | 0.103 | 0.018 | 1.757 | 0.071 | 0.022 | 0.121 | 0.006 | 2.113 | 0.084 | 0.046 | 0.121 | <0.001 |
| 40 | Congo | 4.186 | 0.179 | 0.154 | 0.204 | <0.001 | 3.259 | 0.134 | 0.108 | 0.160 | <0.001 | 3.137 | 0.144 | 0.124 | 0.165 | <0.001 |
| 41 | Costa Rica | 1.848 | 0.073 | 0.054 | 0.093 | <0.001 | 2.726 | 0.106 | 0.086 | 0.127 | <0.001 | 2.157 | 0.085 | 0.061 | 0.109 | <0.001 |
| 42 | Cote d’Ivoire | 1.304 | 0.053 | 0.027 | 0.078 | <0.001 | 1.317 | 0.034 | 0.011 | 0.057 | 0.005 | 1.942 | 0.092 | 0.069 | 0.115 | <0.001 |
| 43 | Croatia | −11.731 | −0.605 | −0.711 | −0.499 | <0.001 | −15.729 | −0.749 | −0.947 | −0.551 | <0.001 | −8.157 | −0.480 | −0.541 | −0.419 | <0.001 |
| 44 | Cuba | 5.371 | 0.221 | 0.192 | 0.251 | <0.001 | 7.643 | 0.291 | 0.263 | 0.319 | <0.001 | 3.718 | 0.169 | 0.141 | 0.198 | <0.001 |
| 45 | Cyprus | −1.128 | −0.162 | −0.246 | −0.077 | 0.001 | 1.872 | 0.027 | 0.004 | 0.050 | 0.021 | −7.131 | −0.546 | −0.765 | −0.327 | <0.001 |
| 46 | Czech Republic | −9.462 | −0.288 | −0.381 | −0.196 | <0.001 | −10.369 | −0.258 | −0.383 | −0.132 | <0.001 | −11.376 | −0.457 | −0.528 | −0.385 | <0.001 |
| 47 | Democratic Republic of the Congo | 4.480 | 0.210 | 0.162 | 0.257 | <0.001 | 5.193 | 0.238 | 0.183 | 0.294 | <0.001 | 3.770 | 0.172 | 0.141 | 0.203 | <0.001 |
| 48 | Denmark | 1.823 | −0.039 | −0.118 | 0.041 | 0.325 | 0.480 | −0.123 | −0.238 | −0.008 | 0.037 | 1.210 | −0.001 | −0.022 | 0.020 | 0.901 |
| 49 | Djibouti | 0.180 | −0.011 | −0.029 | 0.008 | 0.257 | −0.960 | −0.050 | −0.073 | −0.028 | <0.001 | 0.373 | 0.013 | −0.012 | 0.039 | 0.287 |
| 50 | Dominica | 7.734 | 0.301 | 0.288 | 0.315 | <0.001 | 6.972 | 0.273 | 0.249 | 0.296 | <0.001 | 4.330 | 0.173 | 0.157 | 0.190 | <0.001 |
| 51 | Dominican Republic | 5.455 | 0.229 | 0.208 | 0.249 | <0.001 | 6.870 | 0.277 | 0.250 | 0.305 | <0.001 | 4.285 | 0.170 | 0.157 | 0.183 | <0.001 |
| 52 | Ecuador | 20.409 | 1.006 | 0.889 | 1.124 | <0.001 | 15.411 | 0.829 | 0.721 | 0.936 | <0.001 | 26.535 | 1.209 | 1.076 | 1.342 | <0.001 |
| 53 | Egypt | 2.670 | 0.103 | 0.090 | 0.117 | <0.001 | 2.474 | 0.100 | 0.088 | 0.113 | <0.001 | 1.959 | 0.072 | 0.060 | 0.083 | <0.001 |
| 54 | El Salvador | 3.046 | 0.116 | 0.094 | 0.138 | <0.001 | 5.040 | 0.182 | 0.161 | 0.204 | <0.001 | 2.796 | 0.116 | 0.095 | 0.138 | <0.001 |
| 55 | Equatorial Guinea | 7.297 | 0.321 | 0.284 | 0.359 | <0.001 | 8.401 | 0.346 | 0.288 | 0.404 | <0.001 | 5.772 | 0.262 | 0.233 | 0.291 | <0.001 |
| 56 | Eritrea | 2.160 | 0.039 | 0.012 | 0.066 | 0.006 | 1.512 | −0.033 | −0.071 | 0.006 | 0.097 | 3.915 | 0.144 | 0.118 | 0.169 | <0.001 |
| 57 | Estonia | −3.388 | −0.165 | −0.265 | −0.064 | 0.002 | −6.013 | −0.303 | −0.384 | −0.222 | <0.001 | −4.609 | −0.174 | −0.295 | −0.053 | 0.006 |
| 58 | Ethiopia | −0.327 | 0.031 | −0.062 | 0.123 | 0.501 | −2.463 | −0.039 | −0.156 | 0.079 | 0.506 | 2.128 | 0.133 | 0.055 | 0.210 | 0.002 |
| 59 | Federated States of Micronesia | −3.597 | −0.158 | −0.169 | −0.146 | <0.001 | 1.147 | 0.034 | 0.006 | 0.062 | 0.019 | −9.703 | −0.418 | −0.453 | −0.384 | <0.001 |
| 60 | Fiji | 1.621 | 0.073 | 0.054 | 0.092 | <0.001 | 2.101 | 0.085 | 0.067 | 0.103 | <0.001 | 1.702 | 0.070 | 0.051 | 0.089 | <0.001 |
| 61 | Finland | −6.480 | −0.242 | −0.593 | 0.110 | 0.169 | −8.061 | −0.334 | −0.655 | −0.011 | 0.043 | −8.630 | −0.292 | −0.683 | 0.101 | 0.139 |
| 62 | France | 2.136 | 0.058 | 0.037 | 0.079 | <0.001 | 0.697 | 0.011 | −0.018 | 0.040 | 0.448 | 2.543 | 0.072 | 0.061 | 0.082 | <0.001 |
| 63 | Gabon | 2.436 | 0.098 | 0.093 | 0.103 | <0.001 | 1.942 | 0.068 | 0.060 | 0.075 | <0.001 | 2.201 | 0.099 | 0.088 | 0.109 | <0.001 |
| 64 | Georgia | −5.470 | −0.295 | −0.355 | −0.234 | <0.001 | −7.376 | −0.386 | −0.457 | −0.315 | <0.001 | −5.282 | −0.275 | −0.323 | −0.228 | <0.001 |
| 65 | Germany | 17.760 | 0.833 | 0.722 | 0.944 | <0.001 | 16.550 | 0.805 | 0.681 | 0.929 | <0.001 | 13.405 | 0.667 | 0.568 | 0.766 | <0.001 |
| 66 | Ghana | 1.944 | 0.072 | 0.058 | 0.085 | <0.001 | 2.850 | 0.094 | 0.082 | 0.107 | <0.001 | 3.080 | 0.142 | 0.116 | 0.169 | <0.001 |
| 67 | Greece | 1.826 | 0.033 | 0.018 | 0.047 | <0.001 | 1.508 | 0.017 | −0.003 | 0.037 | 0.100 | 1.587 | 0.031 | 0.021 | 0.040 | <0.001 |
| 68 | Greenland | 2.691 | 0.104 | 0.093 | 0.114 | <0.001 | −0.371 | −0.026 | −0.049 | −0.003 | 0.031 | 1.222 | 0.049 | 0.038 | 0.060 | <0.001 |
| 69 | Grenada | 5.659 | 0.249 | 0.194 | 0.304 | <0.001 | 0.707 | 0.063 | −0.059 | 0.186 | 0.299 | 4.733 | 0.187 | 0.168 | 0.206 | <0.001 |
| 70 | Guam | −5.518 | −0.258 | −0.306 | −0.209 | <0.001 | −2.170 | −0.110 | −0.137 | −0.082 | <0.001 | −9.831 | −0.462 | −0.513 | −0.410 | <0.001 |
| 71 | Guatemala | 3.224 | 0.137 | 0.106 | 0.168 | <0.001 | 4.964 | 0.200 | 0.172 | 0.228 | <0.001 | 3.287 | 0.140 | 0.113 | 0.166 | <0.001 |
| 72 | Guinea | 3.424 | 0.147 | 0.111 | 0.183 | <0.001 | 3.898 | 0.154 | 0.116 | 0.191 | <0.001 | 2.672 | 0.120 | 0.088 | 0.152 | <0.001 |
| 73 | Guinea-Bissau | −0.253 | −0.019 | −0.048 | 0.010 | 0.196 | −0.373 | −0.033 | −0.054 | −0.013 | 0.003 | 1.255 | 0.044 | 0.010 | 0.077 | 0.012 |
| 74 | Guyana | 6.636 | 0.248 | 0.230 | 0.266 | <0.001 | 8.053 | 0.307 | 0.281 | 0.334 | <0.001 | 5.779 | 0.206 | 0.203 | 0.208 | <0.001 |
| 75 | Haiti | 5.985 | 0.243 | 0.218 | 0.267 | <0.001 | 7.402 | 0.296 | 0.262 | 0.329 | <0.001 | 5.623 | 0.236 | 0.208 | 0.263 | <0.001 |
| 76 | Honduras | 4.862 | 0.156 | 0.145 | 0.167 | <0.001 | 5.446 | 0.168 | 0.155 | 0.182 | <0.001 | 4.933 | 0.176 | 0.171 | 0.180 | <0.001 |
| 77 | Hungary | −16.069 | −0.543 | −0.615 | −0.471 | <0.001 | −17.486 | −0.590 | −0.665 | −0.514 | <0.001 | −15.098 | −0.512 | −0.580 | −0.445 | <0.001 |
| 78 | Iceland | −5.340 | −0.314 | −0.385 | −0.243 | <0.001 | −8.058 | −0.461 | −0.559 | −0.363 | <0.001 | −1.580 | −0.098 | −0.128 | −0.068 | <0.001 |
| 79 | India | 14.709 | 0.638 | 0.534 | 0.742 | <0.001 | 14.550 | 0.603 | 0.519 | 0.687 | <0.001 | 17.276 | 0.775 | 0.641 | 0.908 | <0.001 |
| 80 | Indonesia | −16.520 | −0.900 | −1.050 | −0.749 | <0.001 | −19.533 | −1.044 | −1.197 | −0.891 | <0.001 | −10.651 | −0.628 | −0.772 | −0.485 | <0.001 |
| 81 | Iran | 3.079 | 0.019 | −0.116 | 0.155 | 0.772 | 3.550 | 0.045 | −0.101 | 0.191 | 0.534 | 3.182 | 0.030 | −0.092 | 0.151 | 0.617 |
| 82 | Iraq | −0.311 | −0.002 | −0.013 | 0.009 | 0.703 | −0.717 | −0.017 | −0.031 | −0.002 | 0.024 | −0.374 | −0.003 | −0.015 | 0.009 | 0.587 |
| 83 | Ireland | 2.518 | 0.068 | 0.053 | 0.083 | <0.001 | 1.935 | 0.041 | 0.019 | 0.063 | 0.001 | 2.448 | 0.055 | 0.042 | 0.069 | <0.001 |
| 84 | Israel | 3.152 | 0.088 | 0.076 | 0.100 | <0.001 | 2.727 | 0.067 | 0.053 | 0.081 | <0.001 | 2.628 | 0.061 | 0.049 | 0.073 | <0.001 |
| 85 | Italy | −13.545 | −0.665 | −0.861 | −0.469 | <0.001 | −17.931 | −0.893 | −1.026 | −0.760 | <0.001 | −8.570 | −0.400 | −0.714 | −0.086 | 0.015 |
| 86 | Jamaica | 6.283 | 0.244 | 0.236 | 0.252 | <0.001 | 7.186 | 0.265 | 0.258 | 0.272 | <0.001 | 4.290 | 0.177 | 0.161 | 0.193 | <0.001 |
| 87 | Japan | −1.348 | −0.108 | −0.141 | −0.074 | <0.001 | −1.209 | −0.088 | −0.112 | −0.064 | <0.001 | −3.429 | −0.209 | −0.262 | −0.156 | <0.001 |
| 88 | Jordan | 2.986 | 0.127 | 0.100 | 0.154 | <0.001 | 2.265 | 0.100 | 0.089 | 0.111 | <0.001 | 1.462 | 0.060 | 0.045 | 0.075 | <0.001 |
| 89 | Kazakhstan | −8.764 | −0.328 | −0.360 | −0.297 | <0.001 | −8.258 | −0.256 | −0.298 | −0.213 | <0.001 | −11.232 | −0.480 | −0.521 | −0.439 | <0.001 |
| 90 | Kenya | 3.821 | 0.143 | 0.110 | 0.176 | <0.001 | 5.110 | 0.182 | 0.155 | 0.210 | <0.001 | 3.298 | 0.126 | 0.090 | 0.162 | <0.001 |
| 91 | Kiribati | −0.710 | −0.024 | −0.053 | 0.004 | 0.084 | −0.320 | −0.001 | −0.040 | 0.038 | 0.966 | 0.481 | 0.008 | −0.001 | 0.016 | 0.083 |
| 92 | Kuwait | −1.278 | −0.064 | −0.096 | −0.032 | <0.001 | 1.975 | 0.080 | 0.072 | 0.088 | <0.001 | 1.540 | 0.069 | 0.064 | 0.073 | <0.001 |
| 93 | Kyrgyzstan | −3.843 | −0.104 | −0.159 | −0.049 | 0.001 | −7.849 | −0.280 | −0.338 | −0.222 | <0.001 | 0.452 | 0.096 | 0.021 | 0.172 | 0.015 |
| 94 | Laos | 6.147 | 0.237 | 0.192 | 0.282 | <0.001 | 6.120 | 0.242 | 0.181 | 0.303 | <0.001 | 4.152 | 0.154 | 0.129 | 0.180 | <0.001 |
| 95 | Latvia | −8.826 | −0.395 | −0.497 | −0.294 | <0.001 | −9.813 | −0.484 | −0.576 | −0.392 | <0.001 | −10.211 | −0.427 | −0.550 | −0.304 | <0.001 |
| 96 | Lebanon | 2.910 | 0.116 | 0.104 | 0.128 | <0.001 | 2.385 | 0.098 | 0.087 | 0.109 | <0.001 | 1.853 | 0.077 | 0.065 | 0.088 | <0.001 |
| 97 | Lesotho | 3.328 | 0.129 | 0.102 | 0.156 | <0.001 | 4.882 | 0.186 | 0.159 | 0.212 | <0.001 | 3.377 | 0.136 | 0.106 | 0.166 | <0.001 |
| 98 | Liberia | 2.544 | 0.153 | 0.105 | 0.200 | <0.001 | 3.396 | 0.186 | 0.136 | 0.237 | <0.001 | 3.004 | 0.162 | 0.123 | 0.200 | <0.001 |
| 99 | Libya | −0.126 | 0.032 | 0.011 | 0.053 | 0.004 | 1.969 | 0.083 | 0.074 | 0.092 | <0.001 | 1.688 | 0.071 | 0.062 | 0.081 | <0.001 |
| 100 | Lithuania | −10.033 | −0.408 | −0.512 | −0.304 | <0.001 | −11.906 | −0.480 | −0.556 | −0.404 | <0.001 | −7.838 | −0.304 | −0.427 | −0.182 | <0.001 |
| 101 | Luxembourg | 10.205 | 0.182 | −0.066 | 0.430 | 0.144 | 6.913 | 0.025 | −0.218 | 0.268 | 0.835 | 10.308 | 0.276 | 0.010 | 0.542 | 0.043 |
| 102 | Macedonia | 1.776 | 0.073 | 0.057 | 0.089 | <0.001 | 2.013 | 0.084 | 0.071 | 0.098 | <0.001 | 1.728 | 0.065 | 0.053 | 0.077 | <0.001 |
| 103 | Madagascar | 2.832 | 0.118 | 0.072 | 0.165 | <0.001 | 4.177 | 0.161 | 0.111 | 0.211 | <0.001 | 2.615 | 0.121 | 0.083 | 0.160 | <0.001 |
| 104 | Malawi | 3.150 | 0.111 | 0.079 | 0.144 | <0.001 | 4.413 | 0.159 | 0.121 | 0.197 | <0.001 | 3.530 | 0.149 | 0.108 | 0.190 | <0.001 |
| 105 | Malaysia | 5.510 | 0.189 | 0.168 | 0.211 | <0.001 | 4.894 | 0.170 | 0.140 | 0.201 | <0.001 | 4.000 | 0.126 | 0.113 | 0.138 | <0.001 |
| 106 | Maldives | 5.354 | 0.219 | 0.144 | 0.295 | <0.001 | 5.877 | 0.235 | 0.195 | 0.276 | <0.001 | 2.305 | 0.096 | 0.072 | 0.121 | <0.001 |
| 107 | Mali | 3.341 | 0.144 | 0.111 | 0.177 | <0.001 | 3.259 | 0.136 | 0.098 | 0.173 | <0.001 | 2.476 | 0.121 | 0.088 | 0.154 | <0.001 |
| 108 | Malta | 11.694 | 0.634 | 0.494 | 0.774 | <0.001 | 8.636 | 0.548 | 0.389 | 0.708 | <0.001 | 11.539 | 0.562 | 0.462 | 0.661 | <0.001 |
| 109 | Marshall Islands | −3.624 | −0.187 | −0.209 | −0.164 | <0.001 | −1.073 | −0.051 | −0.083 | −0.020 | 0.002 | −7.890 | −0.408 | −0.498 | −0.318 | <0.001 |
| 110 | Mauritania | −0.273 | −0.008 | −0.037 | 0.021 | 0.592 | 0.142 | 0.006 | −0.032 | 0.044 | 0.748 | −1.533 | −0.049 | −0.074 | −0.025 | <0.001 |
| 111 | Mauritius | 3.926 | 0.128 | 0.112 | 0.144 | <0.001 | 3.850 | 0.122 | 0.108 | 0.136 | <0.001 | 3.107 | 0.100 | 0.083 | 0.117 | <0.001 |
| 112 | Mexico | −4.399 | −0.156 | −0.222 | −0.090 | <0.001 | −4.791 | −0.200 | −0.293 | −0.108 | <0.001 | −3.403 | −0.076 | −0.115 | −0.037 | <0.001 |
| 113 | Moldova | 5.635 | 0.286 | 0.161 | 0.411 | <0.001 | 5.921 | 0.297 | 0.158 | 0.437 | <0.001 | 4.767 | 0.257 | 0.140 | 0.374 | <0.001 |
| 114 | Mongolia | −0.587 | 0.019 | −0.062 | 0.100 | 0.637 | 5.854 | 0.312 | 0.220 | 0.404 | <0.001 | −6.690 | −0.297 | −0.375 | −0.219 | <0.001 |
| 115 | Montenegro | 2.168 | 0.088 | 0.074 | 0.101 | <0.001 | 2.149 | 0.088 | 0.072 | 0.105 | <0.001 | 1.444 | 0.063 | 0.052 | 0.075 | <0.001 |
| 116 | Morocco | 2.288 | 0.089 | 0.066 | 0.112 | <0.001 | 2.144 | 0.090 | 0.075 | 0.104 | <0.001 | 1.932 | 0.069 | 0.056 | 0.082 | <0.001 |
| 117 | Mozambique | 4.829 | 0.216 | 0.190 | 0.242 | <0.001 | 6.813 | 0.284 | 0.264 | 0.304 | <0.001 | 4.307 | 0.193 | 0.159 | 0.228 | <0.001 |
| 118 | Myanmar | 4.117 | 0.176 | 0.137 | 0.215 | <0.001 | 6.740 | 0.283 | 0.233 | 0.332 | <0.001 | 4.326 | 0.170 | 0.140 | 0.199 | <0.001 |
| 119 | Namibia | 1.929 | 0.094 | 0.071 | 0.116 | <0.001 | 2.887 | 0.117 | 0.096 | 0.139 | <0.001 | 2.259 | 0.117 | 0.091 | 0.143 | <0.001 |
| 120 | Nepal | 8.460 | 0.321 | 0.287 | 0.354 | <0.001 | 11.222 | 0.415 | 0.365 | 0.465 | <0.001 | 7.660 | 0.285 | 0.257 | 0.313 | <0.001 |
| 121 | Netherlands | −2.467 | −0.098 | −0.123 | −0.074 | <0.001 | −4.608 | −0.179 | −0.205 | −0.152 | <0.001 | −2.554 | −0.106 | −0.127 | −0.085 | <0.001 |
| 122 | New Zealand | −21.001 | −0.673 | −0.915 | −0.430 | <0.001 | −21.187 | −0.693 | −0.903 | −0.482 | <0.001 | −21.354 | −0.674 | −0.984 | −0.364 | <0.001 |
| 123 | Nicaragua | 4.133 | 0.161 | 0.135 | 0.186 | <0.001 | 4.729 | 0.184 | 0.156 | 0.211 | <0.001 | 3.051 | 0.126 | 0.103 | 0.148 | <0.001 |
| 124 | Niger | 1.941 | 0.097 | 0.055 | 0.139 | <0.001 | 2.650 | 0.117 | 0.071 | 0.163 | <0.001 | 2.833 | 0.146 | 0.107 | 0.186 | <0.001 |
| 125 | Nigeria | 1.185 | 0.064 | 0.045 | 0.083 | <0.001 | 3.089 | 0.134 | 0.097 | 0.170 | <0.001 | 2.587 | 0.136 | 0.107 | 0.166 | <0.001 |
| 126 | North Korea | 6.919 | 0.294 | 0.243 | 0.346 | <0.001 | 5.019 | 0.249 | 0.184 | 0.314 | <0.001 | 3.930 | 0.161 | 0.136 | 0.185 | <0.001 |
| 127 | Northern Mariana Islands | −8.478 | −0.340 | −0.372 | −0.309 | <0.001 | −0.985 | −0.047 | −0.071 | −0.022 | 0.001 | −15.525 | −0.683 | −0.706 | −0.660 | <0.001 |
| 128 | Norway | 9.477 | 0.515 | 0.412 | 0.619 | <0.001 | 13.009 | 0.731 | 0.562 | 0.899 | <0.001 | −3.009 | −0.138 | −0.162 | −0.115 | <0.001 |
| 129 | Oman | 4.436 | 0.193 | 0.123 | 0.264 | <0.001 | 2.002 | 0.084 | 0.075 | 0.093 | <0.001 | 1.755 | 0.074 | 0.068 | 0.080 | <0.001 |
| 130 | Pakistan | 8.496 | 0.316 | 0.289 | 0.344 | <0.001 | 10.865 | 0.389 | 0.355 | 0.422 | <0.001 | 6.605 | 0.260 | 0.235 | 0.284 | <0.001 |
| 131 | Palestine | 4.429 | 0.156 | 0.147 | 0.166 | <0.001 | 2.835 | 0.114 | 0.104 | 0.125 | <0.001 | 2.512 | 0.099 | 0.081 | 0.117 | <0.001 |
| 132 | Panama | 2.655 | 0.102 | 0.078 | 0.126 | <0.001 | 2.990 | 0.112 | 0.087 | 0.137 | <0.001 | 2.965 | 0.118 | 0.096 | 0.140 | <0.001 |
| 133 | Papua New Guinea | 0.270 | 0.005 | −0.026 | 0.037 | 0.727 | 2.446 | 0.089 | 0.055 | 0.123 | <0.001 | −3.156 | −0.147 | −0.175 | −0.119 | <0.001 |
| 134 | Paraguay | 3.015 | 0.118 | 0.110 | 0.126 | <0.001 | 2.968 | 0.120 | 0.108 | 0.133 | <0.001 | 3.077 | 0.122 | 0.114 | 0.130 | <0.001 |
| 135 | Peru | 3.332 | 0.141 | 0.120 | 0.161 | <0.001 | 3.272 | 0.135 | 0.110 | 0.161 | <0.001 | 3.377 | 0.143 | 0.127 | 0.160 | <0.001 |
| 136 | Philippines | 3.481 | −0.019 | −0.367 | 0.330 | 0.911 | 2.955 | −0.060 | −0.442 | 0.323 | 0.750 | 6.341 | 0.144 | −0.140 | 0.428 | 0.308 |
| 137 | Poland | −6.833 | −0.193 | −0.223 | −0.163 | <0.001 | −9.146 | −0.273 | −0.338 | −0.208 | <0.001 | −4.978 | −0.139 | −0.198 | −0.080 | <0.001 |
| 138 | Portugal | −1.138 | −0.114 | −0.156 | −0.073 | <0.001 | −5.605 | −0.342 | −0.426 | −0.258 | <0.001 | 5.214 | 0.211 | 0.176 | 0.247 | <0.001 |
| 139 | Puerto Rico | 4.651 | 0.186 | 0.167 | 0.206 | <0.001 | 5.721 | 0.231 | 0.210 | 0.251 | <0.001 | 4.282 | 0.164 | 0.152 | 0.175 | <0.001 |
| 140 | Qatar | 4.731 | 0.248 | 0.214 | 0.282 | <0.001 | 1.720 | 0.081 | 0.076 | 0.087 | <0.001 | 1.492 | 0.049 | 0.046 | 0.051 | <0.001 |
| 141 | Romania | 1.995 | 0.088 | 0.075 | 0.102 | <0.001 | 1.982 | 0.089 | 0.078 | 0.100 | <0.001 | 1.776 | 0.074 | 0.062 | 0.085 | <0.001 |
| 142 | Russian Federation | −8.925 | −0.360 | −0.462 | −0.257 | <0.001 | −10.881 | −0.449 | −0.555 | −0.343 | <0.001 | −10.095 | −0.383 | −0.504 | −0.262 | <0.001 |
| 143 | Rwanda | 2.390 | 0.121 | 0.064 | 0.179 | <0.001 | 3.382 | 0.149 | 0.094 | 0.205 | <0.001 | 3.113 | 0.152 | 0.109 | 0.196 | <0.001 |
| 144 | Saint Lucia | 6.169 | 0.229 | 0.221 | 0.238 | <0.001 | 6.504 | 0.260 | 0.234 | 0.285 | <0.001 | 3.317 | 0.110 | 0.066 | 0.155 | <0.001 |
| 145 | Saint Vincent and the Grenadines | 6.514 | 0.241 | 0.227 | 0.255 | <0.001 | 3.842 | 0.137 | 0.119 | 0.154 | <0.001 | 4.552 | 0.183 | 0.169 | 0.197 | <0.001 |
| 146 | Samoa | −0.597 | −0.049 | −0.066 | −0.031 | <0.001 | 1.906 | 0.068 | 0.046 | 0.090 | <0.001 | −4.237 | −0.229 | −0.251 | −0.206 | <0.001 |
| 147 | Sao Tome and Principe | 3.755 | 0.167 | 0.133 | 0.201 | <0.001 | 3.768 | 0.165 | 0.132 | 0.199 | <0.001 | 2.984 | 0.138 | 0.110 | 0.166 | <0.001 |
| 148 | Saudi Arabia | 1.690 | 0.079 | 0.059 | 0.100 | <0.001 | 1.999 | 0.088 | 0.080 | 0.096 | <0.001 | 1.981 | 0.073 | 0.063 | 0.084 | <0.001 |
| 149 | Senegal | 1.543 | 0.067 | 0.032 | 0.102 | 0.001 | 1.471 | 0.050 | 0.011 | 0.089 | 0.014 | 2.566 | 0.119 | 0.088 | 0.150 | <0.001 |
| 150 | Serbia | −0.273 | −0.020 | −0.043 | 0.002 | 0.077 | −4.874 | −0.264 | −0.328 | −0.201 | <0.001 | 5.046 | 0.251 | 0.215 | 0.288 | <0.001 |
| 151 | Seychelles | 5.307 | 0.186 | 0.159 | 0.214 | <0.001 | 3.868 | 0.117 | 0.096 | 0.137 | <0.001 | 3.272 | 0.112 | 0.099 | 0.124 | <0.001 |
| 152 | Sierra Leone | 2.899 | 0.125 | 0.079 | 0.171 | <0.001 | 2.973 | 0.115 | 0.073 | 0.158 | <0.001 | 2.857 | 0.134 | 0.098 | 0.170 | <0.001 |
| 153 | Singapore | −1.730 | −0.049 | −0.080 | −0.018 | 0.003 | −1.903 | −0.048 | −0.083 | −0.013 | 0.010 | −0.040 | 0.002 | −0.023 | 0.027 | 0.894 |
| 154 | Slovakia | −3.070 | −0.224 | −0.272 | −0.176 | <0.001 | 1.384 | −0.057 | −0.140 | 0.027 | 0.178 | −9.854 | −0.512 | −0.564 | −0.459 | <0.001 |
| 155 | Slovenia | −7.616 | −0.382 | −0.470 | −0.294 | <0.001 | −8.886 | −0.439 | −0.536 | −0.342 | <0.001 | −8.851 | −0.432 | −0.509 | −0.356 | <0.001 |
| 156 | Solomon Islands | −1.853 | −0.082 | −0.115 | −0.048 | <0.001 | 2.609 | 0.108 | 0.068 | 0.147 | <0.001 | −5.460 | −0.260 | −0.289 | −0.230 | <0.001 |
| 157 | Somalia | 2.097 | 0.085 | 0.036 | 0.135 | 0.002 | 1.969 | 0.062 | 0.016 | 0.108 | 0.010 | 3.425 | 0.157 | 0.106 | 0.207 | <0.001 |
| 158 | South Africa | 3.120 | 0.142 | 0.123 | 0.162 | <0.001 | 3.408 | 0.143 | 0.132 | 0.153 | <0.001 | 2.860 | 0.138 | 0.120 | 0.157 | <0.001 |
| 159 | South Korea | 3.072 | 0.095 | 0.075 | 0.115 | <0.001 | 1.573 | 0.026 | 0.012 | 0.040 | 0.001 | 2.073 | 0.082 | 0.067 | 0.097 | <0.001 |
| 160 | South Sudan | −2.323 | −0.095 | −0.106 | −0.083 | <0.001 | −1.567 | −0.061 | −0.071 | −0.051 | <0.001 | −0.358 | −0.003 | −0.028 | 0.022 | 0.807 |
| 161 | Spain | 3.496 | 0.106 | 0.093 | 0.119 | <0.001 | 2.607 | 0.071 | 0.048 | 0.094 | <0.001 | 2.779 | 0.071 | 0.059 | 0.084 | <0.001 |
| 162 | Sri Lanka | 0.963 | 0.030 | −0.007 | 0.067 | 0.104 | 3.962 | 0.145 | 0.113 | 0.178 | <0.001 | 2.776 | 0.091 | 0.071 | 0.111 | <0.001 |
| 163 | Sudan | 2.728 | 0.110 | 0.101 | 0.118 | <0.001 | 2.480 | 0.106 | 0.091 | 0.121 | <0.001 | 2.177 | 0.091 | 0.074 | 0.108 | <0.001 |
| 164 | Suriname | 1.372 | 0.110 | 0.041 | 0.179 | 0.003 | 0.124 | 0.104 | −0.016 | 0.224 | 0.086 | 4.912 | 0.197 | 0.183 | 0.212 | <0.001 |
| 165 | Swaziland | 2.746 | 0.107 | 0.097 | 0.118 | <0.001 | 3.137 | 0.114 | 0.108 | 0.121 | <0.001 | 3.013 | 0.123 | 0.104 | 0.143 | <0.001 |
| 166 | Sweden | −2.233 | −0.071 | −0.237 | 0.094 | 0.384 | −5.924 | −0.176 | −0.383 | 0.031 | 0.093 | 1.160 | −0.002 | −0.101 | 0.097 | 0.967 |
| 167 | Switzerland | 7.571 | 0.149 | 0.021 | 0.276 | 0.024 | 8.179 | 0.163 | 0.014 | 0.312 | 0.034 | 2.701 | −0.015 | −0.108 | 0.079 | 0.749 |
| 168 | Syria | 2.343 | 0.108 | 0.097 | 0.119 | <0.001 | 2.499 | 0.112 | 0.100 | 0.124 | <0.001 | 2.447 | 0.098 | 0.086 | 0.110 | <0.001 |
| 169 | Taiwan | 50.579 | 1.208 | 0.738 | 1.681 | <0.001 | 63.051 | 1.482 | 0.937 | 2.029 | <0.001 | 36.035 | 0.908 | 0.585 | 1.232 | <0.001 |
| 170 | Tajikistan | 3.941 | 0.222 | 0.130 | 0.314 | <0.001 | 2.512 | 0.177 | 0.057 | 0.296 | 0.005 | 3.401 | 0.188 | 0.120 | 0.257 | <0.001 |
| 171 | Tanzania | 3.344 | 0.143 | 0.102 | 0.184 | <0.001 | 3.792 | 0.150 | 0.105 | 0.194 | <0.001 | 3.318 | 0.151 | 0.113 | 0.188 | <0.001 |
| 172 | Thailand | −7.106 | −0.369 | −0.417 | −0.320 | <0.001 | −11.754 | −0.606 | −0.695 | −0.517 | <0.001 | 2.379 | 0.053 | 0.015 | 0.091 | 0.009 |
| 173 | The Bahamas | 4.776 | 0.203 | 0.183 | 0.224 | <0.001 | 5.729 | 0.225 | 0.209 | 0.241 | <0.001 | 2.392 | 0.126 | 0.105 | 0.146 | <0.001 |
| 174 | The Gambia | 0.712 | 0.036 | −0.001 | 0.073 | 0.056 | 1.403 | 0.057 | 0.024 | 0.091 | 0.001 | 2.278 | 0.110 | 0.078 | 0.142 | <0.001 |
| 175 | Timor-Leste | 5.936 | 0.226 | 0.181 | 0.271 | <0.001 | 7.670 | 0.281 | 0.228 | 0.335 | <0.001 | 4.081 | 0.161 | 0.133 | 0.189 | <0.001 |
| 176 | Togo | 1.686 | 0.072 | 0.039 | 0.105 | <0.001 | 2.294 | 0.086 | 0.057 | 0.116 | <0.001 | 2.818 | 0.133 | 0.099 | 0.167 | <0.001 |
| 177 | Tonga | 1.981 | 0.065 | 0.048 | 0.083 | <0.001 | 1.507 | 0.046 | 0.024 | 0.068 | <0.001 | 1.879 | 0.068 | 0.047 | 0.089 | <0.001 |
| 178 | Trinidad and Tobago | 1.874 | 0.169 | 0.098 | 0.239 | <0.001 | 0.735 | 0.129 | 0.060 | 0.199 | 0.001 | 2.794 | 0.203 | 0.137 | 0.270 | <0.001 |
| 179 | Tunisia | 1.239 | 0.053 | 0.038 | 0.067 | <0.001 | 2.256 | 0.091 | 0.078 | 0.104 | <0.001 | 1.538 | 0.069 | 0.057 | 0.081 | <0.001 |
| 180 | Turkey | 7.071 | 0.407 | 0.331 | 0.482 | <0.001 | 11.530 | 0.613 | 0.498 | 0.728 | <0.001 | −0.535 | 0.015 | −0.009 | 0.039 | 0.205 |
| 181 | Turkmenistan | 6.083 | 0.302 | 0.212 | 0.391 | <0.001 | 5.477 | 0.292 | 0.182 | 0.403 | <0.001 | 3.725 | 0.193 | 0.132 | 0.255 | <0.001 |
| 182 | Uganda | 3.251 | 0.142 | 0.101 | 0.183 | <0.001 | 5.502 | 0.225 | 0.182 | 0.267 | <0.001 | 3.935 | 0.166 | 0.128 | 0.203 | <0.001 |
| 183 | Ukraine | −6.342 | −0.353 | −0.523 | −0.182 | <0.001 | −2.580 | −0.212 | −0.382 | −0.042 | 0.016 | −12.187 | −0.597 | −0.790 | −0.404 | <0.001 |
| 184 | United Arab Emirates | 3.938 | 0.168 | 0.147 | 0.190 | <0.001 | 2.124 | 0.094 | 0.087 | 0.101 | <0.001 | 1.717 | 0.061 | 0.055 | 0.067 | <0.001 |
| 185 | United Kingdom | 4.643 | 0.747 | 0.508 | 0.987 | <0.001 | 1.631 | 0.551 | 0.356 | 0.747 | <0.001 | 6.956 | 0.974 | 0.657 | 1.293 | <0.001 |
| 186 | United States | −5.819 | −0.352 | −0.559 | −0.145 | 0.002 | −7.233 | −0.646 | −0.877 | −0.415 | <0.001 | −6.156 | −0.007 | −0.238 | 0.224 | 0.949 |
| 187 | Uruguay | 2.431 | 0.088 | 0.080 | 0.096 | <0.001 | 3.258 | 0.120 | 0.116 | 0.124 | <0.001 | 1.927 | 0.068 | 0.058 | 0.078 | <0.001 |
| 188 | Uzbekistan | 4.127 | 0.228 | 0.157 | 0.300 | <0.001 | 4.048 | 0.237 | 0.142 | 0.332 | <0.001 | 2.801 | 0.163 | 0.108 | 0.219 | <0.001 |
| 189 | Vanuatu | 0.745 | 0.034 | −0.001 | 0.069 | 0.058 | 2.526 | 0.104 | 0.076 | 0.131 | <0.001 | 0.375 | 0.021 | −0.012 | 0.054 | 0.207 |
| 190 | Venezuela | 1.662 | 0.067 | 0.041 | 0.093 | <0.001 | 2.580 | 0.089 | 0.064 | 0.114 | <0.001 | 0.355 | 0.024 | −0.002 | 0.051 | 0.073 |
| 191 | Vietnam | 7.532 | 0.299 | 0.259 | 0.338 | <0.001 | 7.540 | 0.309 | 0.257 | 0.361 | <0.001 | 4.169 | 0.158 | 0.134 | 0.183 | <0.001 |
| 192 | Virgin Islands, U.S. | 1.292 | 0.065 | −0.021 | 0.151 | 0.134 | 6.349 | 0.246 | 0.118 | 0.375 | 0.001 | −3.586 | −0.132 | −0.172 | −0.092 | <0.001 |
| 193 | Yemen | 2.381 | 0.089 | 0.080 | 0.098 | <0.001 | 2.507 | 0.102 | 0.089 | 0.115 | <0.001 | 2.189 | 0.088 | 0.073 | 0.103 | <0.001 |
| 194 | Zambia | −0.354 | −0.019 | −0.050 | 0.012 | 0.214 | 0.639 | 0.023 | 0.007 | 0.038 | 0.007 | 0.674 | 0.035 | −0.013 | 0.083 | 0.146 |
| 195 | Zimbabwe | 1.296 | 0.032 | 0.021 | 0.043 | <0.001 | 2.546 | 0.062 | 0.045 | 0.079 | <0.001 | 2.560 | 0.101 | 0.075 | 0.127 | <0.001 |
| Both Male and Female | Male | Female | |||||||||||||
|---|---|---|---|---|---|---|---|---|---|---|---|---|---|---|---|
| PC | APC | 95%CI | 95%CI | p-Value | PC | APC | 95%CI | 95%CI | p-Value | PC | APC | 95%CI | 95%CI | p-Value | |
| Global | −9.995 | −0.459 | −0.506 | −0.411 | <0.001 | −11.433 | −0.557 | −0.615 | −0.499 | <0.001 | −8.227 | −0.312 | −0.367 | −0.258 | <0.001 |
| Low SDI | 7.620 | 0.335 | 0.268 | 0.403 | <0.001 | 9.028 | 0.375 | 0.307 | 0.443 | <0.001 | 7.492 | 0.352 | 0.280 | 0.423 | <0.001 |
| Low-middle SDI | 2.899 | 0.121 | 0.094 | 0.147 | <0.001 | 3.145 | 0.107 | 0.089 | 0.126 | <0.001 | 4.540 | 0.221 | 0.174 | 0.268 | <0.001 |
| Middle SDI | −11.840 | −0.625 | −0.731 | −0.520 | <0.001 | −14.600 | −0.783 | −0.920 | −0.646 | <0.001 | −5.982 | −0.309 | −0.363 | −0.254 | <0.001 |
| High-middle SDI | −23.757 | −1.165 | −1.255 | −1.074 | <0.001 | −24.098 | −1.204 | −1.311 | −1.096 | <0.001 | −25.151 | −1.195 | −1.271 | −1.120 | <0.001 |
| High SDI | −1.774 | −0.103 | −0.174 | −0.033 | 0.006 | −3.155 | −0.218 | −0.293 | −0.143 | <0.001 | −2.358 | −0.009 | −0.096 | 0.079 | 0.840 |
| Both Male and Female | Male | Female | |||||||||||||
|---|---|---|---|---|---|---|---|---|---|---|---|---|---|---|---|
| PC | APC | 95%CI | 95%CI | p-Value | PC | APC | 95%CI | 95%CI | p-Value | PC | APC | 95%CI | 95%CI | p-Value | |
| Central Asia | −18.427 | −1.325 | −1.663 | −0.986 | <0.001 | −15.861 | −1.145 | −1.439 | −0.849 | <0.001 | −23.294 | −1.646 | −2.061 | −1.230 | <0.001 |
| Eastern Asia | −65.808 | −4.678 | −4.953 | −4.403 | <0.001 | −62.349 | −4.110 | −4.352 | −3.867 | <0.001 | −71.220 | −5.633 | −6.046 | −5.218 | <0.001 |
| High-income Asia Pacific | 13.003 | 0.670 | 0.577 | 0.762 | <0.001 | 4.323 | 0.270 | 0.200 | 0.341 | <0.001 | 22.671 | 1.092 | 0.964 | 1.221 | <0.001 |
| South Asia | −11.841 | −0.459 | −0.562 | −0.355 | <0.001 | −10.493 | −0.343 | −0.425 | −0.261 | <0.001 | −10.347 | −0.477 | −0.659 | −0.295 | <0.001 |
| Southeast Asia | 3.713 | −0.284 | −0.517 | −0.050 | 0.019 | −5.895 | −0.742 | −0.989 | −0.494 | <0.001 | 30.817 | 0.765 | 0.470 | 1.060 | <0.001 |
| Central Europe | −53.614 | −2.776 | −3.305 | −2.245 | <0.001 | −52.706 | −2.678 | −3.177 | −2.176 | <0.001 | −55.245 | −2.947 | −3.509 | −2.382 | <0.001 |
| Eastern Europe | −28.217 | −1.768 | −2.177 | −1.357 | <0.001 | −29.962 | −1.845 | −2.239 | −1.451 | <0.001 | −30.651 | −1.918 | −2.369 | −1.465 | <0.001 |
| Western Europe | −10.909 | −0.137 | −0.318 | 0.044 | 0.132 | −11.504 | −0.168 | −0.346 | 0.010 | 0.063 | −12.669 | −0.199 | −0.398 | <0.001 | 0.050 |
| Andean Latin America | −10.561 | −0.323 | −0.406 | −0.240 | <0.001 | −12.678 | −0.359 | −0.442 | −0.276 | <0.001 | −7.983 | −0.280 | −0.383 | −0.176 | <0.001 |
| Central Latin America | 3.083 | 0.172 | −0.127 | 0.471 | 0.249 | −4.440 | −0.057 | −0.328 | 0.214 | 0.668 | 12.273 | 0.420 | 0.082 | 0.760 | 0.017 |
| Southern Latin America | −2.953 | −0.181 | −0.229 | −0.134 | <0.001 | −2.691 | −0.129 | −0.206 | −0.052 | 0.002 | −3.069 | −0.226 | −0.296 | −0.156 | <0.001 |
| Tropical Latin America | 115.258 | 3.248 | 3.142 | 3.354 | <0.001 | 89.802 | 2.770 | 2.649 | 2.892 | <0.001 | 141.624 | 3.668 | 3.549 | 3.788 | <0.001 |
| High-income North America | −2.392 | 0.022 | −0.168 | 0.212 | 0.815 | −7.531 | −0.391 | −0.584 | −0.197 | <0.001 | 1.858 | 0.454 | 0.223 | 0.687 | <0.001 |
| Central Sub-Saharan Africa | −3.961 | −0.254 | −0.318 | −0.190 | <0.001 | −1.286 | −0.165 | −0.228 | −0.101 | <0.001 | −4.459 | −0.275 | −0.336 | −0.214 | <0.001 |
| Eastern Sub-Saharan Africa | −21.744 | −1.194 | −1.319 | −1.069 | <0.001 | −19.306 | −1.049 | −1.160 | −0.938 | <0.001 | −23.094 | −1.288 | −1.440 | −1.137 | <0.001 |
| Southern Sub-Saharan Africa | −2.270 | −0.264 | −0.789 | 0.263 | 0.312 | 5.779 | −0.005 | −0.523 | 0.516 | 0.984 | −11.691 | −0.614 | −1.195 | −0.029 | 0.040 |
| Western Sub-Saharan Africa | −17.285 | −0.993 | −1.146 | −0.839 | <0.001 | −15.489 | −0.978 | −1.166 | −0.790 | <0.001 | −19.677 | −1.002 | −1.119 | −0.885 | <0.001 |
| North Africa and Middle East | 0.932 | 0.035 | −0.036 | 0.106 | 0.322 | 3.794 | 0.206 | 0.143 | 0.268 | <0.001 | −4.249 | −0.274 | −0.381 | −0.167 | <0.001 |
| Oceania | −29.103 | −1.420 | −1.555 | −1.284 | <0.001 | −22.757 | −1.021 | −1.195 | −0.848 | <0.001 | −33.942 | −1.724 | −1.837 | −1.611 | <0.001 |
| Australasia | −34.669 | −1.304 | −1.686 | −0.920 | <0.001 | −37.597 | −1.509 | −1.890 | −1.127 | <0.001 | −33.330 | −1.185 | −1.584 | −0.784 | <0.001 |
| Caribbean | 25.854 | 1.133 | 0.986 | 1.280 | <0.001 | 38.205 | 1.401 | 1.284 | 1.518 | <0.001 | 14.286 | 0.832 | 0.572 | 1.093 | <0.001 |
| Both Male and Female | Male | Female | ||||||||||||||
|---|---|---|---|---|---|---|---|---|---|---|---|---|---|---|---|---|
| Number | Countries and Territories | PC | APC | 95%CI | 95%CI | p-Value | PC | APC | 95%CI | 95%CI | p-Value | PC | APC | 95%CI | 95%CI | p-Value |
| 1 | Afghanistan | 15.058 | 0.712 | 0.610 | 0.813 | <0.001 | 12.701 | 0.588 | 0.494 | 0.682 | <0.001 | 20.151 | 0.927 | 0.809 | 1.046 | <0.001 |
| 2 | Albania | −23.995 | −0.891 | −1.161 | −0.620 | <0.001 | −37.147 | −1.568 | −2.023 | −1.110 | <0.001 | 0.662 | −0.016 | −0.041 | 0.008 | 0.182 |
| 3 | Algeria | 5.555 | 0.249 | 0.228 | 0.270 | <0.001 | 3.006 | 0.132 | 0.114 | 0.150 | <0.001 | 9.369 | 0.422 | 0.386 | 0.459 | <0.001 |
| 4 | American Samoa | −57.879 | −4.974 | −6.065 | −3.871 | <0.001 | −63.640 | −5.687 | −6.894 | −4.463 | <0.001 | −49.481 | −4.080 | −5.072 | −3.078 | <0.001 |
| 5 | Andorra | −8.383 | −0.309 | −0.421 | −0.198 | <0.001 | −10.128 | −0.345 | −0.413 | −0.276 | <0.001 | −4.363 | −0.158 | −0.361 | 0.045 | 0.121 |
| 6 | Angola | −6.882 | −0.471 | −0.562 | −0.381 | <0.001 | −3.606 | −0.353 | −0.449 | −0.256 | <0.001 | −5.742 | −0.409 | −0.497 | −0.320 | <0.001 |
| 7 | Antigua and Barbuda | 28.971 | 1.047 | 0.839 | 1.256 | <0.001 | 9.861 | 0.373 | 0.262 | 0.485 | <0.001 | 44.867 | 1.578 | 1.246 | 1.910 | <0.001 |
| 8 | Argentina | −1.901 | −0.007 | −0.112 | 0.097 | 0.889 | −5.406 | −0.163 | −0.320 | −0.005 | 0.044 | 1.871 | 0.151 | 0.083 | 0.218 | <0.001 |
| 9 | Armenia | 50.908 | 1.995 | 1.279 | 2.716 | <0.001 | 61.061 | 2.221 | 1.585 | 2.860 | <0.001 | 39.743 | 1.669 | 0.877 | 2.467 | <0.001 |
| 10 | Australia | −35.315 | −1.425 | −1.752 | −1.098 | <0.001 | −39.554 | −1.654 | −1.993 | −1.313 | <0.001 | −32.122 | −1.275 | −1.602 | −0.946 | <0.001 |
| 11 | Austria | −50.089 | −1.786 | −2.365 | −1.203 | <0.001 | −40.020 | −0.955 | −1.356 | −0.552 | <0.001 | −59.048 | −2.804 | −3.593 | −2.007 | <0.001 |
| 12 | Azerbaijan | 23.858 | 0.821 | 0.638 | 1.003 | <0.001 | 10.600 | 0.414 | 0.373 | 0.454 | <0.001 | 32.914 | 1.083 | 0.770 | 1.396 | <0.001 |
| 13 | Bahrain | 5.745 | −0.134 | −0.361 | 0.093 | 0.235 | 4.565 | 0.143 | 0.101 | 0.186 | <0.001 | 2.802 | −0.805 | −1.339 | −0.268 | 0.005 |
| 14 | Bangladesh | −16.943 | −0.491 | −0.615 | −0.367 | <0.001 | −6.171 | 0.045 | −0.129 | 0.218 | 0.601 | −29.580 | −1.239 | −1.341 | −1.138 | <0.001 |
| 15 | Barbados | −4.192 | 0.201 | 0.055 | 0.347 | 0.009 | −4.387 | 0.078 | −0.053 | 0.209 | 0.234 | −6.469 | 0.252 | −0.079 | 0.584 | 0.130 |
| 16 | Belarus | −31.658 | −1.956 | −2.133 | −1.779 | <0.001 | −20.341 | −1.298 | −1.449 | −1.147 | <0.001 | −41.282 | −2.606 | −2.816 | −2.396 | <0.001 |
| 17 | Belgium | 28.074 | 1.353 | 1.041 | 1.665 | <0.001 | 27.147 | 1.251 | 0.944 | 1.559 | <0.001 | 27.233 | 1.404 | 1.086 | 1.722 | <0.001 |
| 18 | Belize | 41.679 | 1.259 | 1.023 | 1.495 | <0.001 | 47.698 | 1.181 | 0.892 | 1.472 | <0.001 | 35.897 | 1.269 | 1.012 | 1.526 | <0.001 |
| 19 | Benin | −17.242 | −1.019 | −1.178 | −0.860 | <0.001 | −20.757 | −1.373 | −1.610 | −1.136 | <0.001 | −9.717 | −0.421 | −0.494 | −0.347 | <0.001 |
| 20 | Bermuda | −6.617 | −0.057 | −0.235 | 0.122 | 0.521 | 1.328 | 0.316 | 0.232 | 0.401 | <0.001 | −12.465 | −0.349 | −0.643 | −0.054 | 0.022 |
| 21 | Bhutan | −20.917 | −0.897 | −0.931 | −0.863 | <0.001 | −19.047 | −0.699 | −0.762 | −0.635 | <0.001 | −24.403 | −1.193 | −1.257 | −1.129 | <0.001 |
| 22 | Bolivia | −21.064 | −0.619 | −0.781 | −0.457 | <0.001 | −23.808 | −0.697 | −0.856 | −0.538 | <0.001 | −17.851 | −0.523 | −0.699 | −0.347 | <0.001 |
| 23 | Bosnia and Herzegovina | −22.795 | −1.381 | −1.636 | −1.126 | <0.001 | −23.227 | −1.377 | −1.639 | −1.114 | <0.001 | −24.058 | −1.500 | −1.763 | −1.237 | <0.001 |
| 24 | Botswana | −3.975 | −0.072 | −0.220 | 0.075 | 0.321 | −17.143 | −0.848 | −0.910 | −0.786 | <0.001 | 15.300 | 0.932 | 0.655 | 1.209 | <0.001 |
| 25 | Brazil | 116.654 | 3.279 | 3.170 | 3.387 | <0.001 | 91.467 | 2.815 | 2.689 | 2.941 | <0.001 | 142.686 | 3.686 | 3.565 | 3.808 | <0.001 |
| 26 | Brunei | −23.121 | −1.015 | −1.279 | −0.750 | <0.001 | −24.840 | −1.126 | −1.421 | −0.830 | <0.001 | 0.425 | 0.020 | −0.050 | 0.089 | 0.564 |
| 27 | Bulgaria | −75.459 | −6.073 | −7.056 | −5.080 | <0.001 | −76.813 | −6.330 | −7.323 | −5.326 | <0.001 | −73.777 | −5.784 | −6.760 | −4.799 | <0.001 |
| 28 | Burkina Faso | −13.408 | −0.692 | −0.827 | −0.557 | <0.001 | −14.846 | −0.880 | −1.083 | −0.676 | <0.001 | −8.763 | −0.328 | −0.386 | −0.271 | <0.001 |
| 29 | Burundi | −24.946 | −1.398 | −1.569 | −1.228 | <0.001 | −29.735 | −1.651 | −1.828 | −1.474 | <0.001 | −25.138 | −1.403 | −1.575 | −1.231 | <0.001 |
| 30 | Cambodia | −23.372 | −0.995 | −1.090 | −0.901 | <0.001 | −21.376 | −0.830 | −0.945 | −0.715 | <0.001 | −24.158 | −1.160 | −1.245 | −1.075 | <0.001 |
| 31 | Cameroon | −22.199 | −1.383 | −1.593 | −1.172 | <0.001 | −14.109 | −1.106 | −1.354 | −0.857 | <0.001 | −30.550 | −1.724 | −1.904 | −1.544 | <0.001 |
| 32 | Canada | 8.418 | 0.633 | 0.496 | 0.771 | <0.001 | 7.003 | 0.580 | 0.443 | 0.718 | <0.001 | 8.398 | 0.639 | 0.491 | 0.788 | <0.001 |
| 33 | Cape Verde | 6.343 | 0.233 | 0.200 | 0.265 | <0.001 | 5.101 | 0.147 | 0.125 | 0.169 | <0.001 | 5.483 | 0.237 | 0.180 | 0.293 | <0.001 |
| 34 | Central African Republic | 2.214 | 0.054 | −0.014 | 0.122 | 0.115 | 5.567 | 0.127 | 0.045 | 0.210 | 0.004 | −2.899 | −0.073 | −0.143 | −0.002 | 0.044 |
| 35 | Chad | −17.860 | −1.071 | −1.270 | −0.872 | <0.001 | −19.333 | −1.272 | −1.537 | −1.005 | <0.001 | −19.760 | −0.988 | −1.125 | −0.851 | <0.001 |
| 36 | Chile | −12.798 | −0.870 | −1.069 | −0.670 | <0.001 | −5.288 | −0.471 | −0.663 | −0.279 | <0.001 | −18.618 | −1.207 | −1.453 | −0.960 | <0.001 |
| 37 | China | −66.979 | −4.811 | −5.084 | −4.538 | <0.001 | −63.542 | −4.229 | −4.472 | −3.985 | <0.001 | −72.305 | −5.788 | −6.200 | −5.374 | <0.001 |
| 38 | Colombia | 25.487 | 1.495 | 1.064 | 1.928 | <0.001 | 13.824 | 1.114 | 0.713 | 1.516 | <0.001 | 39.262 | 1.896 | 1.419 | 2.376 | <0.001 |
| 39 | Comoros | −15.419 | −0.813 | −0.969 | −0.657 | <0.001 | −13.760 | −0.746 | −0.947 | −0.545 | <0.001 | −14.269 | −0.760 | −0.869 | −0.650 | <0.001 |
| 40 | Congo | −6.931 | −0.410 | −0.500 | −0.320 | <0.001 | −11.980 | −0.634 | −0.748 | −0.519 | <0.001 | −2.571 | −0.239 | −0.342 | −0.136 | <0.001 |
| 41 | Costa Rica | 43.455 | 1.843 | 1.609 | 2.078 | <0.001 | 13.993 | 0.591 | 0.525 | 0.657 | <0.001 | 81.502 | 3.173 | 2.741 | 3.606 | <0.001 |
| 42 | Cote d’Ivoire | −15.270 | −0.974 | −1.168 | −0.780 | <0.001 | −14.881 | −1.092 | −1.328 | −0.856 | <0.001 | −14.963 | −0.756 | −0.937 | −0.574 | <0.001 |
| 43 | Croatia | −6.659 | 0.145 | −0.264 | 0.555 | 0.474 | −18.495 | −0.620 | −1.021 | −0.217 | 0.004 | 4.232 | 0.771 | 0.357 | 1.187 | 0.001 |
| 44 | Cuba | 26.970 | 1.134 | 0.791 | 1.479 | <0.001 | 47.845 | 1.511 | 1.189 | 1.833 | <0.001 | 10.222 | 0.729 | 0.263 | 1.197 | 0.003 |
| 45 | Cyprus | −5.585 | −0.379 | −0.473 | −0.286 | <0.001 | −11.608 | −0.702 | −0.914 | −0.490 | <0.001 | 2.182 | 0.028 | −0.099 | 0.156 | 0.651 |
| 46 | Czech Republic | −71.761 | −4.669 | −5.529 | −3.801 | <0.001 | −73.941 | −4.850 | −5.775 | −3.915 | <0.001 | −70.806 | −4.668 | −5.480 | −3.849 | <0.001 |
| 47 | Democratic Republic of the Congo | −3.776 | −0.224 | −0.304 | −0.144 | <0.001 | −0.375 | −0.101 | −0.167 | −0.035 | 0.004 | −4.935 | −0.286 | −0.372 | −0.201 | <0.001 |
| 48 | Denmark | −2.850 | 0.091 | −0.174 | 0.357 | 0.486 | 11.165 | 0.555 | 0.258 | 0.853 | 0.001 | −19.951 | −0.587 | −0.903 | −0.270 | 0.001 |
| 49 | Djibouti | 0.286 | −0.376 | −0.521 | −0.232 | <0.001 | −2.195 | −0.479 | −0.620 | −0.338 | <0.001 | 1.441 | −0.285 | −0.435 | −0.134 | 0.001 |
| 50 | Dominica | 40.114 | 1.326 | 1.256 | 1.397 | <0.001 | 37.017 | 1.210 | 1.119 | 1.302 | <0.001 | 33.026 | 1.136 | 1.045 | 1.227 | <0.001 |
| 51 | Dominican Republic | 1.664 | −0.073 | −0.337 | 0.191 | 0.573 | −1.139 | −0.212 | −0.690 | 0.269 | 0.373 | 6.721 | 0.111 | −0.041 | 0.264 | 0.145 |
| 52 | Ecuador | 9.434 | 0.691 | 0.442 | 0.941 | <0.001 | 8.115 | 0.687 | 0.450 | 0.925 | <0.001 | 11.862 | 0.713 | 0.391 | 1.036 | <0.001 |
| 53 | Egypt | 8.930 | 0.390 | 0.356 | 0.424 | <0.001 | 6.212 | 0.287 | 0.256 | 0.319 | <0.001 | 13.391 | 0.557 | 0.512 | 0.602 | <0.001 |
| 54 | El Salvador | 1.623 | −0.119 | −0.306 | 0.069 | 0.205 | −7.075 | −0.568 | −0.890 | −0.244 | 0.001 | 15.091 | 0.440 | 0.350 | 0.530 | <0.001 |
| 55 | Equatorial Guinea | −10.710 | −0.510 | −0.651 | −0.368 | <0.001 | −19.258 | −1.013 | −1.273 | −0.752 | <0.001 | 3.719 | 0.148 | 0.086 | 0.210 | <0.001 |
| 56 | Eritrea | −15.875 | −1.047 | −1.186 | −0.908 | <0.001 | −20.252 | −1.339 | −1.529 | −1.148 | <0.001 | −4.624 | −0.374 | −0.444 | −0.303 | <0.001 |
| 57 | Estonia | −61.106 | −4.732 | −5.227 | −4.234 | <0.001 | −59.551 | −4.761 | −5.354 | −4.164 | <0.001 | −64.200 | −4.875 | −5.344 | −4.403 | <0.001 |
| 58 | Ethiopia | −44.034 | −2.491 | −2.662 | −2.319 | <0.001 | −47.116 | −2.668 | −2.873 | −2.464 | <0.001 | −39.946 | −2.255 | −2.415 | −2.096 | <0.001 |
| 59 | Federated States of Micronesia | −34.393 | −1.723 | −1.849 | −1.597 | <0.001 | −26.199 | −1.289 | −1.410 | −1.168 | <0.001 | −40.328 | −2.056 | −2.231 | −1.881 | <0.001 |
| 60 | Fiji | 25.048 | 1.178 | 0.967 | 1.390 | <0.001 | 27.600 | 1.216 | 1.016 | 1.416 | <0.001 | 24.654 | 1.230 | 0.885 | 1.576 | <0.001 |
| 61 | Finland | −11.289 | −0.444 | −0.667 | −0.221 | <0.001 | 1.896 | 0.212 | 0.036 | 0.388 | 0.020 | −23.446 | −1.133 | −1.407 | −0.859 | <0.001 |
| 62 | France | −12.134 | −0.400 | −0.458 | −0.341 | <0.001 | −18.534 | −0.654 | −0.793 | −0.514 | <0.001 | −5.881 | −0.179 | −0.281 | −0.077 | 0.001 |
| 63 | Gabon | 4.662 | 0.103 | −0.018 | 0.223 | 0.091 | 6.645 | 0.146 | 0.065 | 0.228 | 0.001 | −0.965 | −0.069 | −0.257 | 0.118 | 0.454 |
| 64 | Georgia | 14.420 | 0.541 | 0.272 | 0.810 | <0.001 | 9.658 | 0.355 | 0.126 | 0.585 | 0.004 | 18.756 | 0.717 | 0.385 | 1.050 | <0.001 |
| 65 | Germany | 1.008 | 0.469 | 0.246 | 0.693 | <0.001 | 8.277 | 0.650 | 0.474 | 0.827 | <0.001 | −9.405 | 0.106 | −0.187 | 0.400 | 0.462 |
| 66 | Ghana | −3.956 | −0.350 | −0.477 | −0.223 | <0.001 | −1.070 | −0.299 | −0.457 | −0.140 | 0.001 | 2.449 | 0.057 | 0.009 | 0.105 | 0.022 |
| 67 | Greece | 1.048 | 0.050 | −0.014 | 0.114 | 0.123 | 0.799 | 0.019 | −0.045 | 0.084 | 0.542 | 0.761 | 0.073 | 0.002 | 0.145 | 0.046 |
| 68 | Greenland | −6.682 | −0.370 | −0.476 | −0.265 | <0.001 | −20.369 | −1.109 | −1.340 | −0.878 | <0.001 | 3.067 | 0.129 | 0.108 | 0.149 | <0.001 |
| 69 | Grenada | 27.548 | 1.232 | 1.029 | 1.435 | <0.001 | 3.555 | 0.458 | 0.075 | 0.843 | 0.021 | 83.321 | 2.577 | 1.900 | 3.258 | <0.001 |
| 70 | Guam | −45.456 | −3.492 | −4.224 | −2.754 | <0.001 | −33.399 | −2.084 | −2.531 | −1.634 | <0.001 | −55.967 | −4.844 | −5.853 | −3.824 | <0.001 |
| 71 | Guatemala | −30.566 | −2.093 | −2.535 | −1.650 | <0.001 | −21.607 | −1.362 | −1.723 | −0.999 | <0.001 | −37.111 | −2.654 | −3.181 | −2.124 | <0.001 |
| 72 | Guinea | −5.443 | −0.339 | −0.475 | −0.204 | <0.001 | −1.498 | −0.231 | −0.374 | −0.089 | 0.003 | −10.203 | −0.488 | −0.622 | −0.355 | <0.001 |
| 73 | Guinea-Bissau | −29.523 | −1.596 | −1.783 | −1.410 | <0.001 | −29.331 | −1.667 | −1.878 | −1.457 | <0.001 | −26.518 | −1.341 | −1.498 | −1.183 | <0.001 |
| 74 | Guyana | 37.366 | 1.355 | 1.046 | 1.665 | <0.001 | 36.173 | 1.443 | 1.048 | 1.839 | <0.001 | 39.750 | 1.254 | 0.940 | 1.569 | <0.001 |
| 75 | Haiti | 19.893 | 0.842 | 0.744 | 0.940 | <0.001 | 23.367 | 1.013 | 0.866 | 1.160 | <0.001 | 17.824 | 0.707 | 0.646 | 0.768 | <0.001 |
| 76 | Honduras | 13.799 | 0.080 | −0.198 | 0.359 | 0.559 | −0.859 | −0.265 | −0.475 | −0.055 | 0.016 | 36.640 | 0.484 | 0.108 | 0.861 | 0.014 |
| 77 | Hungary | −66.925 | −4.065 | −4.742 | −3.382 | <0.001 | −64.592 | −3.837 | −4.430 | −3.240 | <0.001 | −68.963 | −4.292 | −5.042 | −3.535 | <0.001 |
| 78 | Iceland | −32.983 | −1.057 | −1.175 | −0.939 | <0.001 | −29.684 | −1.017 | −1.178 | −0.856 | <0.001 | −37.661 | −1.115 | −1.280 | −0.950 | <0.001 |
| 79 | India | −13.762 | −0.536 | −0.660 | −0.412 | <0.001 | −13.901 | −0.475 | −0.571 | −0.379 | <0.001 | −10.155 | −0.469 | −0.679 | −0.259 | <0.001 |
| 80 | Indonesia | −39.727 | −1.912 | −2.058 | −1.766 | <0.001 | −41.372 | −2.014 | −2.187 | −1.840 | <0.001 | −31.422 | −1.414 | −1.503 | −1.324 | <0.001 |
| 81 | Iran | 13.478 | 0.546 | 0.295 | 0.797 | <0.001 | 12.096 | 0.509 | 0.279 | 0.740 | <0.001 | 16.618 | 0.652 | 0.366 | 0.939 | <0.001 |
| 82 | Iraq | −47.971 | −3.087 | −3.377 | −2.796 | <0.001 | −43.436 | −2.759 | −3.018 | −2.499 | <0.001 | −54.267 | −3.554 | −3.911 | −3.195 | <0.001 |
| 83 | Ireland | −15.086 | −0.565 | −0.761 | −0.370 | <0.001 | −26.184 | −1.091 | −1.453 | −0.729 | <0.001 | 4.495 | 0.130 | −0.018 | 0.278 | 0.084 |
| 84 | Israel | 29.734 | 0.356 | −0.096 | 0.811 | 0.118 | 29.298 | 0.493 | 0.115 | 0.873 | 0.012 | 30.053 | 0.155 | −0.457 | 0.771 | 0.608 |
| 85 | Italy | −37.806 | −1.542 | −1.795 | −1.288 | <0.001 | −42.264 | −1.914 | −2.177 | −1.651 | <0.001 | −33.939 | −1.182 | −1.454 | −0.909 | <0.001 |
| 86 | Jamaica | 49.334 | 1.658 | 1.343 | 1.973 | <0.001 | 65.546 | 1.873 | 1.334 | 2.414 | <0.001 | 24.847 | 1.166 | 0.899 | 1.434 | <0.001 |
| 87 | Japan | 18.230 | 0.921 | 0.817 | 1.024 | <0.001 | 10.197 | 0.579 | 0.507 | 0.651 | <0.001 | 27.160 | 1.295 | 1.147 | 1.444 | <0.001 |
| 88 | Jordan | −13.413 | −0.912 | −1.121 | −0.703 | <0.001 | −0.877 | −0.029 | −0.051 | −0.007 | 0.012 | −28.806 | −2.061 | −2.540 | −1.580 | <0.001 |
| 89 | Kazakhstan | −48.206 | −3.577 | −4.094 | −3.058 | <0.001 | −46.692 | −3.373 | −3.850 | −2.893 | <0.001 | −52.573 | −4.008 | −4.572 | −3.442 | <0.001 |
| 90 | Kenya | 1.419 | −0.086 | −0.233 | 0.061 | 0.238 | 12.178 | 0.355 | 0.183 | 0.527 | <0.001 | −8.524 | −0.563 | −0.703 | −0.422 | <0.001 |
| 91 | Kiribati | −14.146 | −0.598 | −0.670 | −0.526 | <0.001 | −24.167 | −0.993 | −1.117 | −0.870 | <0.001 | −1.074 | −0.196 | −0.432 | 0.040 | 0.100 |
| 92 | Kuwait | −4.534 | −0.061 | −0.117 | −0.006 | 0.032 | 2.149 | 0.207 | 0.118 | 0.297 | <0.001 | −11.842 | −0.360 | −0.556 | −0.165 | 0.001 |
| 93 | Kyrgyzstan | −47.085 | −2.382 | −2.751 | −2.012 | <0.001 | −40.727 | −1.931 | −2.261 | −1.600 | <0.001 | −58.852 | −3.359 | −3.874 | −2.841 | <0.001 |
| 94 | Laos | −32.871 | −1.584 | −1.701 | −1.466 | <0.001 | −33.167 | −1.573 | −1.679 | −1.466 | <0.001 | −33.025 | −1.653 | −1.802 | −1.505 | <0.001 |
| 95 | Latvia | −41.423 | −2.890 | −3.303 | −2.475 | <0.001 | −31.099 | −2.611 | −3.192 | −2.027 | <0.001 | −49.674 | −3.279 | −3.671 | −2.887 | <0.001 |
| 96 | Lebanon | 8.621 | 0.396 | 0.361 | 0.431 | <0.001 | 6.520 | 0.323 | 0.284 | 0.361 | <0.001 | 10.250 | 0.457 | 0.418 | 0.496 | <0.001 |
| 97 | Lesotho | 12.904 | 0.670 | 0.578 | 0.763 | <0.001 | 16.230 | 0.729 | 0.579 | 0.879 | <0.001 | 11.289 | 0.703 | 0.576 | 0.831 | <0.001 |
| 98 | Liberia | −17.119 | −0.828 | −1.035 | −0.620 | <0.001 | −18.339 | −0.959 | −1.170 | −0.747 | <0.001 | −13.551 | −0.543 | −0.747 | −0.339 | <0.001 |
| 99 | Libya | 17.284 | 0.741 | 0.673 | 0.809 | <0.001 | 11.056 | 0.444 | 0.411 | 0.478 | <0.001 | 33.826 | 1.332 | 1.233 | 1.432 | <0.001 |
| 100 | Lithuania | −47.842 | −3.349 | −3.858 | −2.838 | <0.001 | −48.493 | −3.631 | −4.157 | −3.102 | <0.001 | −48.086 | −3.148 | −3.675 | −2.618 | <0.001 |
| 101 | Luxembourg | −6.809 | −0.215 | −0.327 | −0.103 | 0.001 | −10.999 | −0.432 | −0.540 | −0.323 | <0.001 | −5.709 | −0.077 | −0.196 | 0.043 | 0.201 |
| 102 | Macedonia | −0.982 | −0.008 | −0.047 | 0.031 | 0.678 | −0.244 | 0.008 | −0.030 | 0.045 | 0.679 | −1.651 | −0.021 | −0.061 | 0.019 | 0.283 |
| 103 | Madagascar | −12.057 | −0.596 | −0.672 | −0.521 | <0.001 | −7.941 | −0.360 | −0.415 | −0.305 | <0.001 | −14.583 | −0.784 | −0.890 | −0.678 | <0.001 |
| 104 | Malawi | 0.153 | −0.418 | −0.647 | −0.189 | 0.001 | 14.368 | 0.144 | −0.083 | 0.372 | 0.203 | −13.592 | −1.049 | −1.298 | −0.798 | <0.001 |
| 105 | Malaysia | 16.685 | 0.449 | 0.339 | 0.559 | <0.001 | 3.164 | 0.018 | −0.172 | 0.208 | 0.847 | 35.040 | 0.974 | 0.783 | 1.166 | <0.001 |
| 106 | Maldives | −40.651 | −2.037 | −2.250 | −1.824 | <0.001 | −33.213 | −1.556 | −1.715 | −1.396 | <0.001 | −50.703 | −2.815 | −3.057 | −2.573 | <0.001 |
| 107 | Mali | −28.485 | −1.442 | −1.659 | −1.225 | <0.001 | −26.824 | −1.353 | −1.602 | −1.105 | <0.001 | −30.630 | −1.545 | −1.734 | −1.355 | <0.001 |
| 108 | Malta | −12.206 | −0.148 | −0.363 | 0.068 | 0.170 | −14.035 | −0.211 | −0.385 | −0.038 | 0.019 | −12.604 | −0.204 | −0.494 | 0.087 | 0.161 |
| 109 | Marshall Islands | −22.149 | −1.361 | −1.567 | −1.155 | <0.001 | −32.532 | −1.686 | −1.822 | −1.549 | <0.001 | −16.266 | −1.231 | −1.557 | −0.905 | <0.001 |
| 110 | Mauritania | −35.008 | −1.965 | −2.156 | −1.774 | <0.001 | −33.062 | −1.911 | −2.155 | −1.666 | <0.001 | −37.553 | −2.064 | −2.217 | −1.911 | <0.001 |
| 111 | Mauritius | −5.955 | <0.001 | −0.295 | 0.295 | 0.999 | −14.964 | −0.360 | −0.704 | −0.014 | 0.042 | 7.802 | 0.489 | 0.188 | 0.791 | 0.003 |
| 112 | Mexico | 4.368 | 0.326 | −0.043 | 0.696 | 0.081 | −6.273 | −0.036 | −0.407 | 0.336 | 0.843 | 17.910 | 0.713 | 0.336 | 1.093 | 0.001 |
| 113 | Moldova | −6.416 | 0.074 | −0.336 | 0.486 | 0.714 | −13.379 | −0.478 | −0.836 | −0.120 | 0.011 | 1.525 | 0.685 | 0.138 | 1.235 | 0.016 |
| 114 | Mongolia | −53.422 | −4.520 | −5.291 | −3.743 | <0.001 | −14.020 | −1.099 | −1.330 | −0.868 | <0.001 | −69.981 | −6.773 | −7.858 | −5.675 | <0.001 |
| 115 | Montenegro | 1.741 | 0.069 | 0.056 | 0.082 | <0.001 | 1.878 | 0.063 | 0.044 | 0.082 | <0.001 | 0.881 | 0.053 | 0.039 | 0.068 | <0.001 |
| 116 | Morocco | 9.513 | 0.431 | 0.393 | 0.468 | <0.001 | 5.685 | 0.267 | 0.240 | 0.294 | <0.001 | 15.483 | 0.681 | 0.620 | 0.742 | <0.001 |
| 117 | Mozambique | 15.313 | 0.529 | 0.411 | 0.647 | <0.001 | 17.373 | 0.648 | 0.535 | 0.760 | <0.001 | 19.983 | 0.577 | 0.433 | 0.722 | <0.001 |
| 118 | Myanmar | −23.528 | −0.869 | −0.944 | −0.793 | <0.001 | −21.745 | −0.787 | −0.865 | −0.709 | <0.001 | −22.179 | −0.808 | −0.886 | −0.730 | <0.001 |
| 119 | Namibia | −10.046 | −0.631 | −0.809 | −0.452 | <0.001 | −8.798 | −0.583 | −0.757 | −0.409 | <0.001 | −8.622 | −0.570 | −0.757 | −0.382 | <0.001 |
| 120 | Nepal | −3.278 | 0.056 | −0.262 | 0.376 | 0.719 | 2.461 | 0.288 | −0.028 | 0.606 | 0.073 | −7.507 | −0.145 | −0.491 | 0.202 | 0.397 |
| 121 | Netherlands | −31.996 | −1.599 | −1.764 | −1.435 | <0.001 | −28.690 | −1.203 | −1.321 | −1.085 | <0.001 | −36.399 | −2.067 | −2.303 | −1.829 | <0.001 |
| 122 | New Zealand | −31.326 | −0.822 | −1.421 | −0.219 | 0.009 | −27.960 | −0.849 | −1.436 | −0.259 | 0.007 | −35.417 | −0.890 | −1.535 | −0.242 | 0.009 |
| 123 | Nicaragua | −3.632 | −0.228 | −0.409 | −0.046 | 0.016 | −10.879 | −0.767 | −0.964 | −0.570 | <0.001 | 4.232 | 0.366 | 0.061 | 0.672 | 0.020 |
| 124 | Niger | −28.859 | −1.614 | −1.832 | −1.395 | <0.001 | −30.570 | −1.758 | −2.010 | −1.505 | <0.001 | −26.264 | −1.345 | −1.518 | −1.172 | <0.001 |
| 125 | Nigeria | −19.199 | −1.143 | −1.318 | −0.968 | <0.001 | −17.416 | −1.109 | −1.307 | −0.911 | <0.001 | −21.918 | −1.194 | −1.372 | −1.015 | <0.001 |
| 126 | North Korea | −6.676 | −0.287 | −0.341 | −0.233 | <0.001 | −9.133 | −0.378 | −0.424 | −0.333 | <0.001 | −10.659 | −0.498 | −0.571 | −0.424 | <0.001 |
| 127 | Northern Mariana Islands | −55.683 | −4.148 | −4.922 | −3.368 | <0.001 | −16.670 | −0.981 | −1.260 | −0.701 | <0.001 | −70.243 | −5.838 | −6.832 | −4.833 | <0.001 |
| 128 | Norway | −16.129 | −0.384 | −0.596 | −0.172 | 0.001 | −14.935 | −0.277 | −0.510 | −0.042 | 0.022 | −23.330 | −0.827 | −1.019 | −0.634 | <0.001 |
| 129 | Oman | 4.628 | 0.205 | 0.124 | 0.287 | <0.001 | 2.123 | 0.101 | 0.076 | 0.125 | <0.001 | 2.420 | 0.103 | 0.055 | 0.151 | <0.001 |
| 130 | Pakistan | 13.588 | 0.260 | 0.147 | 0.374 | <0.001 | 17.216 | 0.418 | 0.300 | 0.537 | <0.001 | 11.256 | 0.093 | −0.023 | 0.209 | 0.110 |
| 131 | Palestine | −6.057 | −0.206 | −0.238 | −0.174 | <0.001 | −3.489 | −0.128 | −0.150 | −0.107 | <0.001 | −12.683 | −0.422 | −0.499 | −0.344 | <0.001 |
| 132 | Panama | 9.629 | 0.448 | 0.169 | 0.728 | 0.003 | 12.047 | 0.583 | 0.423 | 0.744 | <0.001 | 7.124 | 0.302 | −0.180 | 0.786 | 0.209 |
| 133 | Papua New Guinea | −33.681 | −1.629 | −1.746 | −1.512 | <0.001 | −26.695 | −1.206 | −1.364 | −1.047 | <0.001 | −38.621 | −1.935 | −2.016 | −1.854 | <0.001 |
| 134 | Paraguay | 48.563 | 1.575 | 1.354 | 1.797 | <0.001 | 15.725 | 0.346 | 0.121 | 0.572 | 0.004 | 88.890 | 2.749 | 2.413 | 3.085 | <0.001 |
| 135 | Peru | −16.371 | −0.781 | −0.953 | −0.609 | <0.001 | −18.986 | −0.858 | −0.988 | −0.728 | <0.001 | −13.357 | −0.700 | −0.919 | −0.481 | <0.001 |
| 136 | Philippines | 190.856 | 1.316 | 0.107 | 2.539 | 0.034 | 175.645 | 1.039 | −0.179 | 2.273 | 0.092 | 241.267 | 2.107 | 0.889 | 3.340 | 0.001 |
| 137 | Poland | −47.909 | −2.451 | −2.856 | −2.044 | <0.001 | −42.002 | −2.023 | −2.351 | −1.693 | <0.001 | −53.679 | −2.958 | −3.446 | −2.468 | <0.001 |
| 138 | Portugal | 8.691 | 0.631 | 0.335 | 0.928 | <0.001 | −5.501 | 0.033 | −0.300 | 0.368 | 0.838 | 27.336 | 1.307 | 1.022 | 1.592 | <0.001 |
| 139 | Puerto Rico | 23.834 | 0.761 | 0.614 | 0.908 | <0.001 | 29.975 | 1.209 | 1.061 | 1.356 | <0.001 | 18.493 | 0.333 | 0.053 | 0.615 | 0.022 |
| 140 | Qatar | −0.915 | −0.049 | −0.074 | −0.024 | <0.001 | −2.979 | −0.127 | −0.151 | −0.102 | <0.001 | −2.666 | −0.322 | −0.416 | −0.228 | <0.001 |
| 141 | Romania | −2.319 | −0.084 | −0.143 | −0.026 | 0.006 | 2.075 | 0.102 | 0.076 | 0.127 | <0.001 | −7.684 | −0.329 | −0.429 | −0.229 | <0.001 |
| 142 | Russian Federation | −26.499 | −1.568 | −2.014 | −1.120 | <0.001 | −33.817 | −1.941 | −2.383 | −1.497 | <0.001 | −25.272 | −1.521 | −2.007 | −1.032 | <0.001 |
| 143 | Rwanda | −27.563 | −1.702 | −1.942 | −1.461 | <0.001 | −24.589 | −1.594 | −1.830 | −1.358 | <0.001 | −27.309 | −1.609 | −1.889 | −1.328 | <0.001 |
| 144 | Saint Lucia | 26.887 | 0.713 | 0.503 | 0.925 | <0.001 | 9.420 | 0.280 | 0.221 | 0.338 | <0.001 | 37.191 | 0.973 | 0.707 | 1.240 | <0.001 |
| 145 | Saint Vincent and the Grenadines | 10.513 | 0.744 | 0.418 | 1.072 | <0.001 | 2.150 | 0.533 | 0.159 | 0.909 | 0.007 | 3.426 | 0.119 | −0.058 | 0.296 | 0.179 |
| 146 | Samoa | −29.618 | −1.749 | −1.933 | −1.566 | <0.001 | −21.364 | −1.101 | −1.251 | −0.952 | <0.001 | −34.408 | −2.152 | −2.368 | −1.935 | <0.001 |
| 147 | Sao Tome and Principe | 5.229 | 0.064 | −0.003 | 0.132 | 0.061 | −1.076 | −0.032 | −0.134 | 0.070 | 0.524 | 10.786 | 0.131 | <0.001 | 0.262 | 0.050 |
| 148 | Saudi Arabia | 3.974 | 0.205 | 0.184 | 0.226 | <0.001 | 2.717 | 0.146 | 0.122 | 0.170 | <0.001 | 8.682 | 0.399 | 0.365 | 0.434 | <0.001 |
| 149 | Senegal | −24.148 | −1.349 | −1.573 | −1.124 | <0.001 | −25.833 | −1.486 | −1.747 | −1.225 | <0.001 | −19.669 | −1.084 | −1.260 | −0.909 | <0.001 |
| 150 | Serbia | −1.160 | −0.086 | −0.146 | −0.026 | 0.007 | −10.382 | −0.606 | −0.731 | −0.481 | <0.001 | 8.550 | 0.417 | 0.324 | 0.511 | <0.001 |
| 151 | Seychelles | 21.264 | 0.523 | 0.414 | 0.632 | <0.001 | 13.555 | 0.110 | −0.063 | 0.282 | 0.203 | 30.352 | 1.029 | 0.929 | 1.129 | <0.001 |
| 152 | Sierra Leone | −13.421 | −0.749 | −0.872 | −0.627 | <0.001 | −18.198 | −1.069 | −1.242 | −0.896 | <0.001 | −5.769 | −0.288 | −0.376 | −0.200 | <0.001 |
| 153 | Singapore | −38.987 | −1.374 | −1.787 | −0.959 | <0.001 | −30.130 | −1.010 | −1.523 | −0.495 | <0.001 | −48.980 | −1.891 | −2.239 | −1.542 | <0.001 |
| 154 | Slovakia | −37.259 | −1.915 | −2.121 | −1.709 | <0.001 | −30.151 | −1.486 | −1.609 | −1.363 | <0.001 | −43.955 | −2.396 | −2.698 | −2.093 | <0.001 |
| 155 | Slovenia | −32.461 | −1.609 | −1.776 | −1.441 | <0.001 | −29.799 | −1.437 | −1.749 | −1.123 | <0.001 | −35.433 | −1.739 | −1.922 | −1.556 | <0.001 |
| 156 | Solomon Islands | −33.033 | −1.705 | −1.795 | −1.616 | <0.001 | −26.227 | −1.193 | −1.304 | −1.081 | <0.001 | −38.303 | −2.091 | −2.241 | −1.940 | <0.001 |
| 157 | Somalia | −10.495 | −0.820 | −0.981 | −0.658 | <0.001 | −4.693 | −0.637 | −0.809 | −0.464 | <0.001 | −17.587 | −1.021 | −1.179 | −0.862 | <0.001 |
| 158 | South Africa | −9.211 | −0.577 | −1.145 | −0.006 | 0.048 | −2.765 | −0.357 | −0.842 | 0.130 | 0.144 | −15.556 | −0.805 | −1.514 | −0.091 | 0.029 |
| 159 | South Korea | 3.609 | −0.322 | −0.648 | 0.005 | 0.053 | −13.445 | −1.326 | −1.791 | −0.859 | <0.001 | 20.322 | 0.435 | 0.145 | 0.725 | 0.005 |
| 160 | South Sudan | −11.502 | −0.778 | −0.916 | −0.639 | <0.001 | −6.562 | −0.587 | −0.734 | −0.439 | <0.001 | −18.410 | −1.030 | −1.148 | −0.912 | <0.001 |
| 161 | Spain | −9.064 | −0.240 | −0.351 | −0.130 | <0.001 | −9.884 | −0.275 | −0.377 | −0.174 | <0.001 | −9.827 | −0.273 | −0.410 | −0.136 | <0.001 |
| 162 | Sri Lanka | 3.644 | 0.134 | 0.054 | 0.213 | 0.002 | 1.927 | −0.049 | −0.141 | 0.043 | 0.284 | 14.376 | 0.666 | 0.431 | 0.902 | <0.001 |
| 163 | Sudan | 14.619 | 0.668 | 0.604 | 0.733 | <0.001 | 11.517 | 0.561 | 0.505 | 0.617 | <0.001 | 18.767 | 0.812 | 0.727 | 0.896 | <0.001 |
| 164 | Suriname | 44.523 | 1.363 | 1.170 | 1.556 | <0.001 | 51.903 | 1.487 | 1.264 | 1.712 | <0.001 | 31.581 | 1.233 | 1.068 | 1.399 | <0.001 |
| 165 | Swaziland | 2.024 | 0.050 | −0.271 | 0.373 | 0.751 | 8.815 | 0.210 | −0.146 | 0.567 | 0.236 | −5.086 | −0.129 | −0.428 | 0.170 | 0.382 |
| 166 | Sweden | −21.578 | −0.570 | −0.923 | −0.216 | 0.003 | −22.929 | −0.605 | −0.971 | −0.237 | 0.002 | −22.721 | −0.663 | −1.009 | −0.315 | 0.001 |
| 167 | Switzerland | −7.694 | −0.314 | −0.372 | −0.257 | <0.001 | 5.803 | 0.132 | −0.015 | 0.279 | 0.076 | −23.675 | −1.010 | −1.131 | −0.889 | <0.001 |
| 168 | Syria | −9.702 | −0.601 | −0.734 | −0.468 | <0.001 | −11.364 | −0.710 | −0.853 | −0.567 | <0.001 | −5.874 | −0.379 | −0.505 | −0.253 | <0.001 |
| 169 | Taiwan | 28.380 | 1.310 | 0.703 | 1.920 | <0.001 | 32.427 | 1.394 | 0.711 | 2.082 | <0.001 | 25.861 | 1.294 | 0.790 | 1.801 | <0.001 |
| 170 | Tajikistan | 20.951 | 0.268 | 0.069 | 0.468 | 0.010 | 19.429 | 0.188 | −0.034 | 0.411 | 0.094 | 17.959 | 0.236 | 0.051 | 0.421 | 0.014 |
| 171 | Tanzania | −10.783 | −0.742 | −0.966 | −0.519 | <0.001 | −10.671 | −0.760 | −0.956 | −0.563 | <0.001 | −9.031 | −0.631 | −0.905 | −0.356 | <0.001 |
| 172 | Thailand | −23.780 | −1.923 | −2.601 | −1.239 | <0.001 | −36.433 | −2.975 | −3.868 | −2.073 | <0.001 | 23.666 | 0.511 | 0.302 | 0.720 | <0.001 |
| 173 | The Bahamas | −5.994 | 0.063 | −0.207 | 0.333 | 0.636 | 0.425 | 0.191 | 0.099 | 0.284 | <0.001 | −10.400 | −0.060 | −0.469 | 0.351 | 0.767 |
| 174 | The Gambia | −22.084 | −1.192 | −1.351 | −1.033 | <0.001 | −22.031 | −1.272 | −1.475 | −1.068 | <0.001 | −20.764 | −1.028 | −1.135 | −0.921 | <0.001 |
| 175 | Timor-Leste | −8.322 | −0.318 | −0.455 | −0.181 | <0.001 | −2.333 | −0.027 | −0.182 | 0.128 | 0.723 | −16.726 | −0.746 | −0.887 | −0.604 | <0.001 |
| 176 | Togo | −17.189 | −0.952 | −1.109 | −0.794 | <0.001 | −14.130 | −0.967 | −1.172 | −0.760 | <0.001 | −15.614 | −0.612 | −0.777 | −0.448 | <0.001 |
| 177 | Tonga | −13.978 | −0.675 | −0.735 | −0.615 | <0.001 | −12.523 | −0.559 | −0.613 | −0.505 | <0.001 | −13.946 | −0.761 | −0.852 | −0.670 | <0.001 |
| 178 | Trinidad and Tobago | 73.595 | 3.217 | 2.522 | 3.916 | <0.001 | 89.509 | 3.420 | 2.728 | 4.115 | <0.001 | 49.287 | 2.817 | 2.004 | 3.636 | <0.001 |
| 179 | Tunisia | 4.453 | 0.183 | 0.167 | 0.199 | <0.001 | 4.510 | 0.180 | 0.160 | 0.199 | <0.001 | 6.291 | 0.266 | 0.249 | 0.283 | <0.001 |
| 180 | Turkey | −4.198 | −0.117 | −0.273 | 0.039 | 0.135 | 13.771 | 0.784 | 0.609 | 0.960 | <0.001 | −23.465 | −1.305 | −1.579 | −1.029 | <0.001 |
| 181 | Turkmenistan | 49.829 | 1.866 | 1.660 | 2.073 | <0.001 | 41.404 | 1.594 | 1.358 | 1.830 | <0.001 | 58.536 | 2.136 | 1.939 | 2.334 | <0.001 |
| 182 | Uganda | 7.245 | −0.036 | −0.236 | 0.164 | 0.711 | 30.255 | 0.743 | 0.511 | 0.976 | <0.001 | −13.041 | −0.894 | −1.085 | −0.703 | <0.001 |
| 183 | Ukraine | −32.710 | −2.339 | −2.761 | −1.914 | <0.001 | −19.735 | −1.613 | −2.016 | −1.209 | <0.001 | −44.467 | −3.128 | −3.580 | −2.673 | <0.001 |
| 184 | United Arab Emirates | 33.989 | 1.320 | 1.228 | 1.411 | <0.001 | 28.952 | 1.175 | 1.098 | 1.252 | <0.001 | 46.874 | 1.674 | 1.512 | 1.836 | <0.001 |
| 185 | United Kingdom | 11.018 | 0.893 | 0.635 | 1.152 | <0.001 | 9.065 | 0.908 | 0.641 | 1.177 | <0.001 | 11.624 | 0.837 | 0.576 | 1.098 | <0.001 |
| 186 | United States | −3.427 | −0.046 | −0.247 | 0.156 | 0.645 | −9.073 | −0.507 | −0.718 | −0.295 | <0.001 | 1.354 | 0.438 | 0.196 | 0.682 | 0.001 |
| 187 | Uruguay | 14.666 | 0.597 | 0.477 | 0.718 | <0.001 | 20.629 | 0.935 | 0.766 | 1.104 | <0.001 | 10.553 | 0.346 | 0.167 | 0.525 | 0.001 |
| 188 | Uzbekistan | 5.954 | 0.277 | 0.220 | 0.333 | <0.001 | 6.659 | 0.336 | 0.245 | 0.426 | <0.001 | 4.335 | 0.178 | 0.145 | 0.211 | <0.001 |
| 189 | Vanuatu | −24.385 | −1.178 | −1.343 | −1.013 | <0.001 | −15.132 | −0.592 | −0.723 | −0.461 | <0.001 | −32.431 | −1.737 | −1.948 | −1.525 | <0.001 |
| 190 | Venezuela | −5.479 | −0.839 | −1.222 | −0.455 | <0.001 | 1.209 | −0.587 | −0.994 | −0.177 | 0.007 | −11.266 | −1.097 | −1.560 | −0.633 | <0.001 |
| 191 | Vietnam | −5.790 | −0.072 | −0.206 | 0.063 | 0.281 | −7.583 | −0.181 | −0.298 | −0.063 | 0.004 | −6.086 | −0.043 | −0.203 | 0.116 | 0.582 |
| 192 | Virgin Islands, U.S. | 58.206 | 1.935 | 1.618 | 2.253 | <0.001 | 130.464 | 2.954 | 2.217 | 3.695 | <0.001 | 17.516 | 0.875 | 0.709 | 1.041 | <0.001 |
| 193 | Yemen | 11.817 | 0.498 | 0.461 | 0.535 | <0.001 | 10.135 | 0.452 | 0.413 | 0.492 | <0.001 | 14.898 | 0.598 | 0.556 | 0.639 | <0.001 |
| 194 | Zambia | −18.643 | −1.413 | −1.683 | −1.142 | <0.001 | −4.385 | −0.808 | −1.071 | −0.544 | <0.001 | −33.386 | −2.181 | −2.691 | −1.669 | <0.001 |
| 195 | Zimbabwe | 24.168 | 0.786 | 0.218 | 1.358 | 0.009 | 37.611 | 1.146 | 0.412 | 1.886 | 0.003 | 4.828 | 0.174 | 0.050 | 0.298 | 0.008 |
| Both Male and Female | Male | Female | |||||||||||||
|---|---|---|---|---|---|---|---|---|---|---|---|---|---|---|---|
| PC | APC | 95%CI | 95%CI | p-Value | PC | APC | 95%CI | 95%CI | p-Value | PC | APC | 95%CI | 95%CI | p-Value | |
| Global | −35.862 | −1.898 | −2.117 | −1.679 | <0.001 | −35.043 | −1.812 | −1.973 | −1.650 | <0.001 | −37.959 | −2.078 | −2.383 | −1.773 | <0.001 |
| Low SDI | −16.723 | −0.720 | −0.851 | −0.589 | <0.001 | −14.591 | −0.569 | −0.677 | −0.461 | <0.001 | −17.297 | −0.821 | −1.013 | −0.629 | <0.001 |
| Low-middle SDI | −22.509 | −1.053 | −1.166 | −0.940 | <0.001 | −20.969 | −0.898 | −0.985 | −0.812 | <0.001 | −22.656 | −1.185 | −1.370 | −0.999 | <0.001 |
| Middle SDI | −43.070 | −2.494 | −2.705 | −2.283 | <0.001 | −42.137 | −2.376 | −2.535 | −2.216 | <0.001 | −44.517 | −2.679 | −3.004 | −2.352 | <0.001 |
| High-middle SDI | −50.297 | −3.096 | −3.413 | −2.777 | <0.001 | −50.098 | −3.004 | −3.254 | −2.753 | <0.001 | −52.281 | −3.343 | −3.748 | −2.936 | <0.001 |
| High SDI | −15.837 | −0.480 | −0.694 | −0.266 | <0.001 | −17.428 | −0.628 | −0.821 | −0.435 | <0.001 | −16.001 | −0.381 | −0.635 | −0.127 | 0.005 |
Disclaimer/Publisher’s Note: The statements, opinions and data contained in all publications are solely those of the individual author(s) and contributor(s) and not of MDPI and/or the editor(s). MDPI and/or the editor(s) disclaim responsibility for any injury to people or property resulting from any ideas, methods, instructions or products referred to in the content. |
© 2023 by the authors. Licensee MDPI, Basel, Switzerland. This article is an open access article distributed under the terms and conditions of the Creative Commons Attribution (CC BY) license (https://creativecommons.org/licenses/by/4.0/).
Share and Cite
Li, J.; Zhao, Y.; Xiong, Z.; Yang, G. Global, Regional, and National Incidence and Disability-Adjusted Life-Years for Urolithiasis in 195 Countries and Territories, 1990–2019: Results from the Global Burden of Disease Study 2019. J. Clin. Med. 2023, 12, 1048. https://doi.org/10.3390/jcm12031048
Li J, Zhao Y, Xiong Z, Yang G. Global, Regional, and National Incidence and Disability-Adjusted Life-Years for Urolithiasis in 195 Countries and Territories, 1990–2019: Results from the Global Burden of Disease Study 2019. Journal of Clinical Medicine. 2023; 12(3):1048. https://doi.org/10.3390/jcm12031048
Chicago/Turabian StyleLi, Juan, Yue Zhao, Zhuang Xiong, and Guoqiang Yang. 2023. "Global, Regional, and National Incidence and Disability-Adjusted Life-Years for Urolithiasis in 195 Countries and Territories, 1990–2019: Results from the Global Burden of Disease Study 2019" Journal of Clinical Medicine 12, no. 3: 1048. https://doi.org/10.3390/jcm12031048
APA StyleLi, J., Zhao, Y., Xiong, Z., & Yang, G. (2023). Global, Regional, and National Incidence and Disability-Adjusted Life-Years for Urolithiasis in 195 Countries and Territories, 1990–2019: Results from the Global Burden of Disease Study 2019. Journal of Clinical Medicine, 12(3), 1048. https://doi.org/10.3390/jcm12031048