
Topographical Correlation between Structural and Functional Impairment of the Macular Inner Retinal Layers in Multiple Sclerosis Eyes with a History of Optic Neuropathy
 , ,
, , 
Abstract
1. Introduction
2. Materials and Methods
2.1. Study Design and Participants
- –
- Age between 30 and 55 years;
- –
- Diagnosis of relapsing remitting MS according to the validated 2010 McDonald criteria [19];
- –
- MS disease duration estimated as the number of years from onset to the most recent assessment of disability, ranging from 5 to 15 years;
- –
- –
- Treatment with disease-modifying therapies currently approved for preventing MS relapses, including interferon-β-1a, interferon-β-1b, peginterferon beta-1a, glatiramer acetate, natalizumab, dimethyl fumarate, and teriflunomide [22];
- –
- A single episode of ON treated exclusively with steroid regimen following the recommendations of the Optic Neuritis Treatment Trial [23];
- –
- At least 12 months (ranging from 13 to 20 months) of time elapsed between the onset of ON and inclusion in the study. This criterion was chosen as it is known that retrograde degeneration following ON occurs over a period of 6 months [24].
- –
- Mean refractive error (when present) between −3.00 and +3.00 spherical equivalent;
- –
- Intraocular pressure less than 18 mmHg;
- –
- High-contrast BCVA of 0.0 LogMAR for the ETDRS charts.
- –
- Presence of central scotoma or square-wave jerks, saccadic intrusions, and nystagmus in the primary position of gaze that can influence the ability to maintain a stable fixation during the mfPhNR recordings (see below);
- –
- Presence of other systemic diseases (i.e., diabetes, systemic hypertension, rheumatologic disorders) that may influence retinal function;
- –
- Presence of glaucoma or other diseases involving the cornea, lens (lens opacity classification system, LOCS III, stage < 1), uvea, or retina.
- –
- Mean refractive error (when present) between −3.00 and +3.00 spherical equivalent;
- –
- Intraocular pressure less than 18 mmHg;
- –
- High-contrast BCVA of 0.0 LogMAR for the ETDRS charts;
- –
- Presence of central scotoma or square-wave jerks, saccadic intrusions, and nystagmus in the primary position of gaze that can influence the ability to maintain a stable fixation during the mfPhNR recordings (see below);
- –
- Presence of other systemic diseases (i.e., diabetes, systemic hypertension, rheumatologic disorders) that may influence the retinal function;
- –
- Presence of glaucoma or other diseases involving the cornea, lens (lens opacity classification system, LOCS III, stage < 1), uvea, or retina.
2.2. Optical Coherence Tomography
- (1)
- Ring analysis: the 1 mm central area (named as Area 1), the parafoveal 1–3 mm ring (named as Area 2, as a mean value of 4 averaged sectors), and the perifoveal 3–6 mm ring (named as Area 3, as a mean value of 4 averaged sectors);
- (2)
- ETDRS Sectors analysis: a 3D model of the retina was computed automatically, and the GCL+ thickness (GCL+-T) was assessed for each of the subfields (within 1, 3, and 6 mm, respectively) as defined by the Early Treatment Diabetic Retinopathy Study (ETDRS). The mean values of GCL+ from ETDRS regions between 1 and 3 mm (Area 2) and between 3 and 6 mm (Area 3) were calculated, averaging the superior (sup), nasal (nas), inferior (inf), and temporal (temp) values separately.
2.3. Multifocal Photopic Negative Responses Recordings
- (1)
- Ring analysis: We used the same analysis proposed in other reports for mfERG responses [26,27,28]. This is composed of five concentric annular areas (rings, R) with increasing eccentricity from the fovea. The first one analyzed is a 5° radius circular area centered on the fovea (Ring 1, R1), the second one analyzed is the annular area enclosed between 5° and 10° (Ring 2, R2), the third one analyzed is the annular area enclosed between 10° and 15° (Ring 3, R3), the fourth one analyzed is the more external annular area between 15° and 20° (ring 4, R4), and the fifth one analyzed the outermost area between 20° and 25° (ring 5, R5);
- (2)
- Sector analysis: Following the SS-OCT analysis of the macula [29], we studied the mfPhNR signals from localized areas corresponding to the ETDRS map configuration [30]. It consists of nine sectors, and the central one analyzes the 5° radius circular area centered on the fovea, corresponding to the R1 of the ring analysis. Other external sectors specifically analyze the superior (sup), nasal (nas), inferior (inf), and temporal (temp) areas within 5° and 10° (R2) from the foveal center. The outermost sectors analyze sup, nas, temp, and inf areas within 10° and 20° (R3 + R4) from the foveal center.
2.4. Statistical Analysis
3. Results

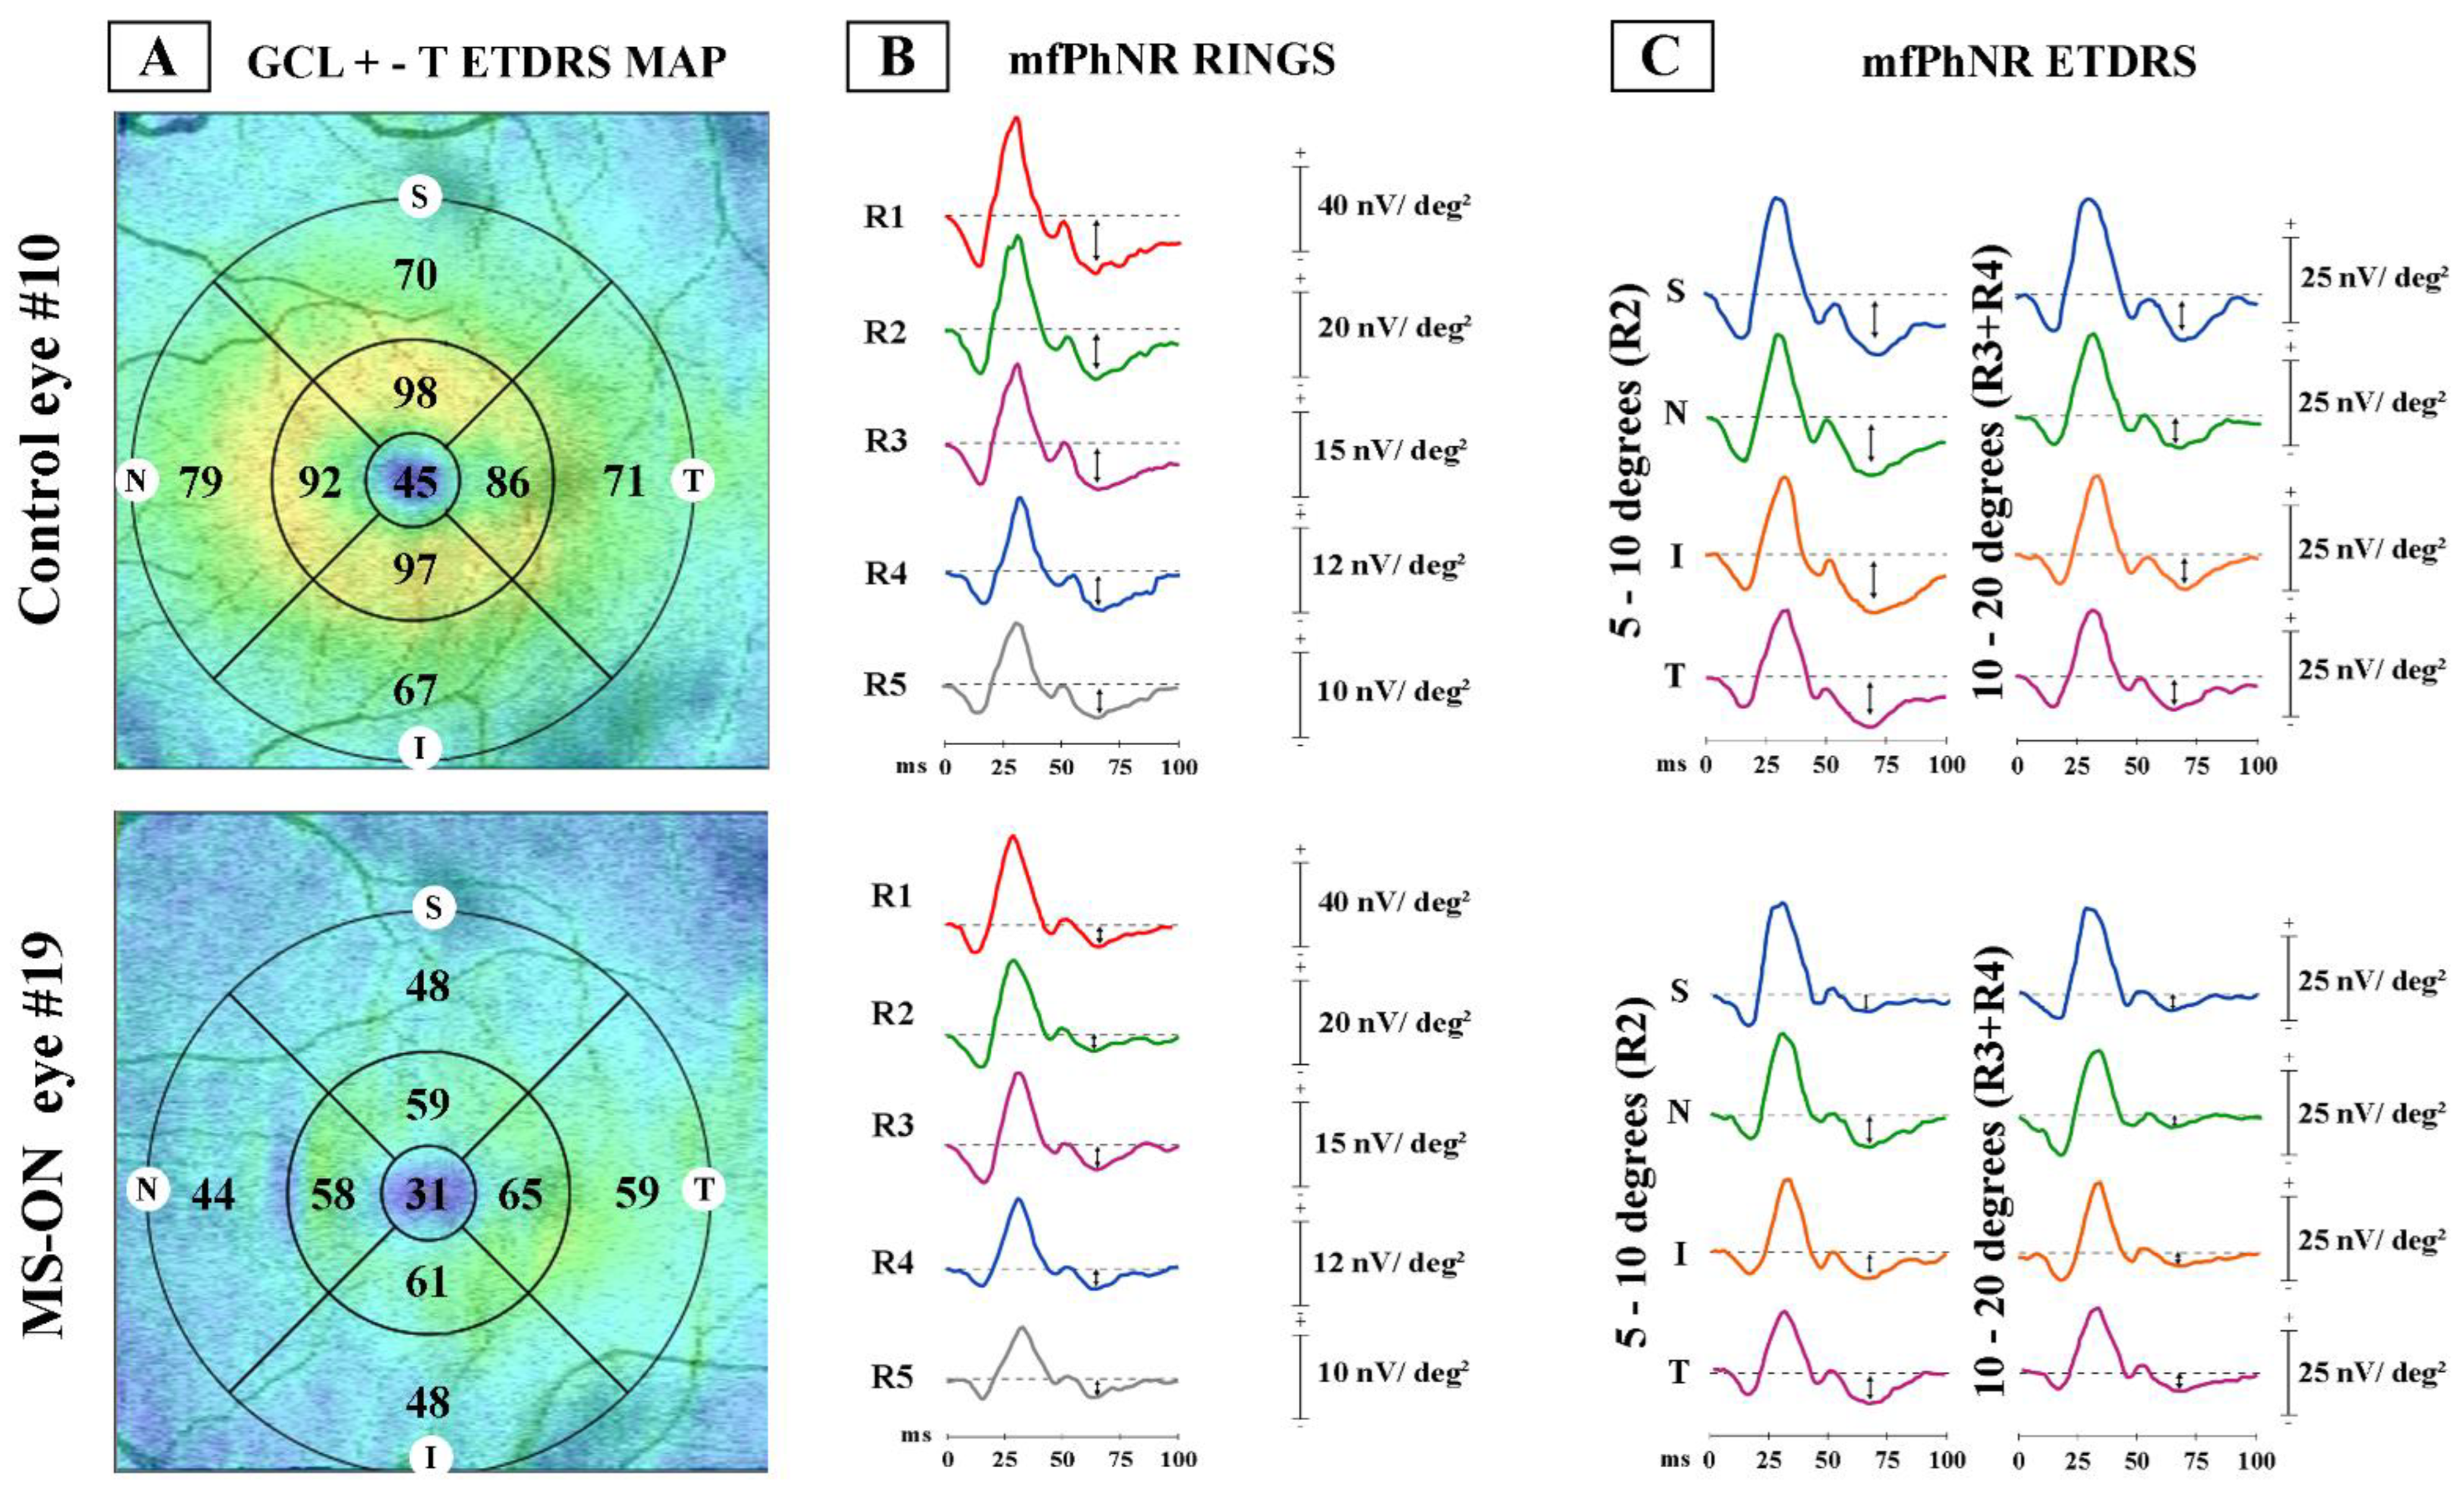
- (A)
- GCL+-T data obtained in the ETDRS map configuration: The central area corresponds to Area 1 (1 mm from the fovea), the annular parafoveal area corresponds to Area 2 (from 1 mm to 3 mm from the fovea), and the annular perifoveal area corresponds to Area 3 (from 3 mm to 6 mm from the fovea). In Area 1 it is reported the central GCL+-T value (micron), in Area 2 and Area 3 are reported 4 values of 4 different sectors (superior, S; nasal, N; inferior, I and temporal, T). By calculating the average of the sectors values, the CGL+-T measure of the entire annular Area 2 and Area 3 is obtained, which is reported in Table 2 for MS-ON eye #19;
- (B)
- MfPhNR response amplitude density [measured in nanoV/degree2 (nV/deg2) as a baseline to trough with an implicit time ranging between 50 and 90 milliseconds (ms) from the stimulus onset and indicated by an arrow (↕)] ring analysis of averaged traces obtained from five circular areas covering 0–25° from the foveal center. In red are depicted the traces derived from a 5° radius circular area centered on the fovea [Ring 1 (R1)]; in green from an annular area enclosed between 5° and 10° centered on the fovea [Ring 2 (R2)]; in purple from an annular area enclosed between 10° and 15° centered on the fovea [Ring 3 (R3)]; in blue from an annular area enclosed between 15° and 20° centered on the fovea [Ring 4 (R4)]; and in grey from an annular area enclosed between 20° and 25° centered on the fovea [Ring 5 (R5)]. In MS-ON eyes, the mfPhNR RAD of R1 was correlated with the GCL+-T of Area 1 (see Figure 2A), the mfPhNR RAD of R2 was correlated with the GCL+-T of Area 2 (see Figure 2B), and the averaged mfPhNR RAD of R3 + R4 was correlated with the GCL+-T of Area 3 (see Figure 2C);
- (C)
- MfPhNR response amplitude density, measured in nanoV/degree2 (nV/deg2), averaged traces following the Early Treatment Diabetic Retinopathy Study (ETDRS) analysis obtained from four sectors covering 5–10° (R2) and for four sectors covering 10–20° (R3 + R4) from the foveal center. For R2 and R3 + R4, in blue are shown the mfPhNR ETDRS superior (S) sectors; in green are shown the ETDRS nasal (N) sectors; in orange are shown the ETDRS inferior (I) sectors; and in purple are shown the ETDRS temporal (T) sectors. In MS-ON eyes, the mfPhNR RAD of the R2 and R3 + R4 sectors were correlated with the GCL+-T measures from corresponding sectors of Area 2 and Area 3, respectively (see Figure 3 and Figure 4).
3.1. RGCs Morphological Data: SS-OCT GCL+-T Ring Analysis
3.2. RGCs Morphological Data: SS-OCT GCL+-T ETDRS Sector Analysis
3.3. RGCs Functional Data: mfPhNR Rings Analysis
3.4. RGCs Functional Data: mfPhNR ETDRS Sectors Analysis
3.5. Morpho-Functional Correlations in MS-ON Eyes for Almost Superimposable Areas
4. Discussion
4.1. Morphological Changes
4.2. Functional Changes
4.3. Morpho-Functional Correlations
5. Conclusions
Supplementary Materials
Author Contributions
Institutional Review Board Statement
Informed Consent Statement
Data Availability Statement
Acknowledgments
Conflicts of Interest
Abbreviations
| MS | Multiple sclerosis |
| ON | Optic neuritis |
| MS-ON | Multiple sclerosis patients with optic neuritis followed by good recovery of best-corrected visual acuity |
| RGCs | Retinal ganglion cells |
| GCC | Ganglion cells complex |
| SS-OCT | Swept-source optical coherence tomography |
| RNFL | Retinal nerve fiber layer |
| FERG | Focal electroretinogram |
| PERG | Pattern electroretinogram |
| mfPhNR | Multifocal photopic negative response |
| mfPERG | Multifocal pattern electroretinogram |
| BCVA | Best-corrected visual acuity |
| RAD | Response amplitude density |
| GCL+-T | Ganglion cells layer thickness |
| IPL | Inner plexiform layer |
| INL | Inner nuclear layer |
| ETDRS | Early Treatment Diabetic Retinopathy Study |
| SD | One standard deviation of the mean |
| N | Number of eyes of each group |
| ANOVA | One-way analysis of variance |
| R | Ring |
| sup | Superior sector |
| nas | Nasal sector |
| inf | Inferior sector |
| temp | Temporal sector |
References
- Graham, S.L.; Klistorner, A. Afferent visual pathways in multiple sclerosis: A review. Clin. Exp. Ophthalmol. 2017, 45, 62–72. [Google Scholar] [CrossRef] [PubMed]
- Britze, J.; Pihl-Jensen, G.; Frederiksen, J.L. Retinal ganglion cell analysis in multiple sclerosis and optic neuritis: A systematic review and meta-analysis. J. Neurol. 2017, 264, 1837–1853. [Google Scholar] [CrossRef]
- Petzold, A.; Balcer, L.J.; Calabresi, P.A.; Costello, F.; Frohman, T.C.; Frohman, E.M.; Zimmermann, H. Retinal layer segmentation in multiple sclerosis: A systematic review and meta-analysis. Lancet Neurol. 2017, 16, 797–812. [Google Scholar] [CrossRef] [PubMed]
- Bsteh, G.; Berek, K.; Hegen, H.; Altmann, P.; Wurth, S.; Auer, M.; Zinganell, A.; Di Pauli, F.; Rommer, P.; Leutmezer, F.; et al. Macular ganglion cell-inner plexiform layer thinning as a biomarker of disability progression in relapsing multiple sclerosis. Mult. Scler. 2021, 27, 684–694. [Google Scholar] [CrossRef] [PubMed]
- Kaushik, M.; Wang, C.Y.; Barnett, M.H.; Garrick, R.; Parratt, J.; Graham, S.L.; Sriram, P.; Yiannikas, C.; Klistorner, A. Inner nuclear layer thickening is inversley proportional to retinal ganglion cell loss in optic neuritis. PLoS ONE 2013, 8, e78341. [Google Scholar] [CrossRef]
- Torbus, M.; Niewiadomska, E.; Dobrakowski, P.; Papuć, E.; Rybus-Kalinowska, B.; Szlacheta, P.; Korzonek-Szlacheta, I.; Kubicka-Bączyk, K.; Łabuz-Roszak, B. The Usefulness of Optical Coherence Tomography in Disease Progression Monitoring in Younger Patients with Relapsing-Remitting Multiple Sclerosis: A Single-Centre Study. J. Clin. Med. 2022, 12, 93. [Google Scholar] [CrossRef] [PubMed]
- Falsini, B.; Bardocci, A.; Porciatti, V.; Bolzani, R.; Piccardi, M. Macular dysfunction in multiple sclerosis revealed by steady-state flicker and pattern ERGs. Electroencephalogr. Clin. Neurophysiol. 1992, 82, 53–59. [Google Scholar] [CrossRef] [PubMed]
- Janáky, M.; Jánossy, Á.; Horváth, G.; Benedek, G.; Braunitzer, G. VEP and PERG in patients with multiple sclerosis, with and without a history of optic neuritis. Doc. Ophthalmol. 2017, 134, 185–193. [Google Scholar] [CrossRef]
- Parisi, V.; Miglior, S.; Manni, G.; Centofanti, M.; Bucci, M.G. Clinical ability of pattern electroretinograms and visual evoked potentials in detecting visual dysfunction in ocular hypertension and glaucoma. Ophthalmology 2006, 113, 216–228. [Google Scholar] [CrossRef]
- Parisi, V.; Pierelli, F.; Fattapposta, F.; Bianco, F.; Parisi, L.; Restuccia, R.; Malandrini, A.; Ferrari, M.; Carrera, P. Early visual function impairment in CADASIL. Neurology 2003, 60, 2008–2010. [Google Scholar] [CrossRef]
- Parisi, V.; Restuccia, R.; Fattapposta, F.; Mina, C.; Bucci, M.G.; Pierelli, F. Morphological and functional retinal impairment in Alzheimer’s disease patients. Clin. Neurophysiol. 2001, 112, 1860–1867. [Google Scholar] [CrossRef]
- Rodriguez-Mena, D.; Almarcegui, C.; Dolz, I.; Herrero, R.; Bambo, M.P.; Fernandez, J.; Pablo, L.E.; Garcia-Martin, E. Electropysiologic evaluation of the visual pathway in patients with multiple sclerosis. J. Clin. Neurophysiol. 2013, 30, 376–381. [Google Scholar] [CrossRef] [PubMed]
- Stefano, E.; Cupini, L.M.; Rizzo, P.; Pierelli, F.; Rizzo, P.A. Simultaneous recording of pattern electroretinogram (PERG) and visual evoked potential (VEP) in multiple sclerosis. Acta Neurol. Belg. 1991, 91, 20–28. [Google Scholar] [PubMed]
- Hokazono, K.; Raza, A.S.; Oyamada, M.K.; Hood, D.C.; Monteiro, M.L. Pattern electroretinogram in neuromyelitis optica and multiple sclerosis with or without optic neuritis and its correlation with FD-OCT and perimetry. Doc. Ophthalmol. 2013, 127, 201–215. [Google Scholar] [CrossRef]
- Bach, M.; Cuno, A.K.; Hoffmann, M.B. Retinal conduction speed analysis reveals different origins of the P50 and N95 components of the (multifocal) pattern electroretinogram. Exp. Eye Res. 2018, 169, 48–53. [Google Scholar] [CrossRef] [PubMed]
- Machida, S. Clinical applications of the photopic negative response to optic nerve and retinal diseases. J. Ophthalmol. 2012, 2012, 397178. [Google Scholar] [CrossRef]
- Al-Nosairy, K.O.; Horbrügger, M.; Schippling, S.; Wagner, M.; Haghikia, A.; Pawlitzki, M.; Hoffmann, M.B. Structure-Function Relationship of Retinal Ganglion Cells in Multiple Sclerosis. Int. J. Mol. Sci. 2021, 22, 3419. [Google Scholar] [CrossRef] [PubMed]
- Barbano, L.; Ziccardi, L.; Antonelli, G.; Nicoletti, C.G.; Landi, D.; Mataluni, G.; Falsini, B.; Marfia, G.A.; Centonze, D.; Parisi, V. Multifocal Electroretinogram Photopic Negative Response: A Reliable Paradigm to Detect Localized Retinal Ganglion Cells’ Impairment in Retrobulbar Optic Neuritis Due to Multiple Sclerosis as a Model of Retinal Neurodegeneration. Diagnostics 2022, 12, 1156. [Google Scholar] [CrossRef]
- Polman, C.H.; Reingold, S.C.; Banwell, B.; Clanet, M.; Cohen, J.A.; Filippi, M.; Fujihara, K.; Havrdova, E.; Hutchinson, M.; Kappos, L.; et al. Diagnostic criteria for multiple sclerosis: 2010 revisions to the McDonald criteria. Ann. Neurol. 2011, 69, 292–302. [Google Scholar] [CrossRef]
- Kurtzke, J.F. Rating neurologic impairment in multiple sclerosis: An Expanded Disability Status Scale (EDSS). Neurology 1983, 33, 1444–1452. [Google Scholar] [CrossRef]
- Neurostatus.net. Available online: http://www.neurostatus.net/index.php?file=start (accessed on 6 July 2020).
- Williams, U.E.; Oparah, S.K.; Philip-Ephraim, E.E. Disease Modifying Therapy in Multiple Sclerosis. Int. Sch. Res. Not. 2014, 2014, 307064. [Google Scholar] [CrossRef]
- Optic Neuritis Study Group. Multiple sclerosis risk after optic neuritis: Final optic neuritis treatment trial follow-up. Arch. Neurol. 2008, 65, 727–732. [Google Scholar]
- Huang-Link, Y.M.; Al-Hawasi, A.; Lindehammar, H. Acute optic neuritis: Retinal ganglion cell loss precedes retinal nerve fiber thinning. Neurol. Sci. 2015, 36, 617–620. [Google Scholar] [CrossRef] [PubMed]
- Cruz-Herranz, A.; Balk, L.J.; Oberwahrenbrock, T.; Saidha, S.; Martinez-Lapiscina, E.H.; Lagreze, W.A.; Schuman, J.S.; Villoslada, P.; Calabresi, P.; Balcer, L.; et al. The APOSTEL recommendations for reporting quantitative optical coherence tomography studies. Neurology 2016, 86, 2303–2309. [Google Scholar] [CrossRef]
- Ziccardi, L.; Barbano, L.; Boffa, L.; Albanese, M.; Nicoletti, C.G.; Landi, D.; Grzybowski, A.; Falsini, B.; Marfia, G.A.; Centonze, D.; et al. Functional Assessment of Outer and Middle Macular Layers in Multiple Sclerosis. J. Clin. Med. 2020, 9, 3766. [Google Scholar] [CrossRef] [PubMed]
- Ziccardi, L.; Cioffi, E.; Barbano, L.; Gioiosa, V.; Falsini, B.; Casali, C.; Parisi, V. Macular Morpho-Functional and Visual Pathways Functional Assessment in Patients with Spinocerebellar Type 1 Ataxia with or without Neurological Signs. J. Clin. Med. 2021, 10, 5271. [Google Scholar] [CrossRef] [PubMed]
- Barbano, L.; Ziccardi, L.; Landi, D.; Nicoletti, C.G.; Mataluni, G.; Falsini, B.; Centonze, D.; Marfia, G.A.; Quaranta, L.; Parisi, V. Assessment of Macular Function by Multifocal Electroretinogram in Patients with Multiple Sclerosis Treated with Fingolimod. Adv. Ther. 2021, 38, 3986–3996. [Google Scholar] [CrossRef]
- Huang, J.; Liu, X.; Wu, Z.; Guo, X.; Xu, H.; Dustin, L.; Sadda, S. Macular and retinal nerve fiber layer thickness measurements in normal eyes with the Stratus OCT, the Cirrus HD-OCT, and the Topcon 3D OCT-1000. J. Glaucoma. 2011, 20, 118–125. [Google Scholar] [CrossRef] [PubMed]
- Adhi, M.; Aziz, S.; Muhammad, K.; Adhi, M.I. Macular thickness by age and gender in healthy eyes using spectral domain optical coherence tomography. PLoS ONE 2012, 7, e37638. [Google Scholar] [CrossRef]
- Costello, F.; Burton, J.M. Retinal imaging with optical coherence tomography: A biomarker in multiple sclerosis? Eye Brain 2018, 10, 47–63. [Google Scholar] [CrossRef]
- Özbilen, K.T.; Gündüz, T.; Kartal, S.N.Ç.; Ceylan, N.A.; Eraksoy, M.; Kürtüncü, M. Detailed Evaluation of Macular Ganglion Cell Complex in Patients with Multiple Sclerosis. Noro Psikiyatr. Ars. 2021, 58, 176–183. [Google Scholar] [CrossRef] [PubMed]
- Saidha, S.; Syc, S.B.; Durbin, M.K.; Eckstein, C.; Oakley, J.D.; Meyer, S.A.; Conger, A.; Frohman, T.C.; Newsome, S.; Ratchford, J.N.; et al. Visual dysfunction in multiple sclerosis correlates better with optical coherence tomography derived estimates of macular ganglion cell layer thickness than peripapillary retinal nerve fiber layer thickness. Mult. Scler. 2011, 17, 1449–1463. [Google Scholar] [CrossRef] [PubMed]
- Garcia-Martin, E.; Jarauta, L.; Vilades, E.; Ara, J.R.; Martin, J.; Polo, V.; Larrosa, J.M.; Pablo, L.E.; Satue, M. Ability of Swept-Source Optical Coherence Tomography to Detect Retinal and Choroidal Changes in Patients with Multiple Sclerosis. J. Ophthalmol. 2018, 2018, 7361212. [Google Scholar] [CrossRef] [PubMed]
- Hu, H.; Jiang, H.; Gameiro, G.R.; Hernandez, J.; Delgado, S.; Wang, J. Focal thickness reduction of the ganglion cell-inner plexiform layer best discriminatesprior optic neuritis in patients with multiple sclerosis. Investig. Ophthalmol. Vis. Sci. 2019, 60, 4257–4426. [Google Scholar] [CrossRef]
- Shao, Y.; Jiang, H.; Wei, Y.; Shi, Y.; Shi, C.; Wright, C.B.; Sun, X.; Vanner, E.A.; Rodriguez, A.D.; Lam, B.L.; et al. Visualization of Focal Thinning of the Ganglion Cell-Inner Plexiform Layer in Patients with Mild Cognitive Impairment and Alzheimer’s Disease. J. Alzheimers Dis. 2018, 64, 1261–1273. [Google Scholar] [CrossRef]
- Yum, H.R.; Park, S.H.; Park, H.Y.; Shin, S.Y. Macular Ganglion Cell Analysis Determined by Cirrus HD Optical Coherence Tomography for Early Detecting Chiasmal Compression. PLoS ONE 2016, 11, e0153064. [Google Scholar] [CrossRef]
- Lee, J.Y.; Choi, J.H.; Park, K.A.; Oh, S.Y. Ganglion Cell Layer and Inner Plexiform Layer as Predictors of Vision Recovery in Ethambutol-Induced Optic Neuropathy: A Longitudinal OCT Analysis. Investig. Ophthalmol. Vis. Sci. 2018, 59, 2104–2109. [Google Scholar] [CrossRef]
- Shin, J.W.; Sung, K.R.; Park, S.W. Patterns of Progressive Ganglion Cell-Inner Plexiform Layer Thinning in Glaucoma Detected by OCT. Ophthalmology 2018, 125, 1515–1525. [Google Scholar] [CrossRef]
- Balducci, N.; Savini, G.; Cascavilla, M.L.; La Morgia, C.; Triolo, G.; Giglio, R.; Carbonelli, M.; Parisi, V.; Sadun, A.A.; Bandello, F.; et al. Macular nerve fibre and ganglion cell layer changes in acute Leber’s hereditary optic neuropathy. Br. J. Ophthalmol. 2016, 100, 1232–1237. [Google Scholar] [CrossRef]
- Kremers, J.; Jertila, M.; Link, B.; Pangeni, G.; Horn, F.K. Spectral characteristics of the PhNR in the full-field flash electroretinogram of normals and glaucoma patients. Doc. Ophthalmol. 2012, 124, 79–90. [Google Scholar] [CrossRef]
- Frishman, L.; Sustar, M.; Kremers, J.; McAnany, J.J.; Sarossy, M.; Tzekov, R.; Viswanathan, S. ISCEV extended protocol for the photopic negative response (PhNR) of the full-field electroretinogram. Doc. Ophthalmol. 2018, 136, 207–211. [Google Scholar] [CrossRef] [PubMed]
- Wang, J.; Cheng, H.; Hu, Y.S.; Tang, R.A.; Frishman, L.J. The photopic negative response of the flash electroretinogram in multiple sclerosis. Investig. Ophthalmol. Vis. Sci. 2012, 53, 1315–1323. [Google Scholar] [CrossRef] [PubMed]
- Nakamura, H.; Miyamoto, K.; Yokota, S.; Ogino, K.; Yoshimura, N. Focal macular photopic negative response in patients with optic neuritis. Eye 2011, 25, 358–364. [Google Scholar] [CrossRef] [PubMed][Green Version]
- Lassmann, H.; Bruck, W.; Lucchinetti, C.F. The immunopathology of multiple sclerosis: An overview. Brain Pathol. 2007, 17, 210–218. [Google Scholar] [CrossRef] [PubMed]
- De Stefano, N.; Narayanan, S.; Francis, G.S.; Rozie Arnaoutelis, M.C.; Tartaglia, J.; PAntel, P.M.M.; Douglas, L.A. Evidence of axonal damage in the early stages of multiple sclerosis and its relevance to disability. Arch Neurol. 2001, 58, 65–70. [Google Scholar] [CrossRef]
- Viswanathan, S.; Frishman, L.J.; Robson, J.G.; Harwerth, R.S.; Smith, E.L., 3rd. The photopic negative response of the macaque electroretinogram: Reduction by experimental glaucoma. Investig. Ophthalmol. Vis. Sci. 1999, 40, 1124–1136. [Google Scholar]
- Thompson, D.A.; Feather, S.; Stanescu, H.C.; Freudenthal, B.; Zdebik, A.A.; Warth, R.; Ognjanovic, M.; Hulton, S.A.; Wassmer, E.; van’t Hoff, W.; et al. Altered electroretinograms in patients with KCNJ10 mutations and EAST syndrome. J. Physiol. 2011, 589, 1681–1689. [Google Scholar] [CrossRef]
- Machida, S.; Raz-Prag, D.; Fariss, R.N.; Sieving, P.A.; Bush, R.A. Photopic ERG negative response from amacrine cell signaling in RCS rat retinal degeneration. Investig. Ophthalmol. Vis. Sci. 2008, 49, 442–452. [Google Scholar] [CrossRef]
- Almarcegui, C.; Dolz, I.; Pueyo, V.; Garcia, E.; Fernandez, F.J.; Martin, J.; Ara, J.R.; Honrubia, F. Correlation between functional and structural assessments of the optic nerve and retina in multiple sclerosis patients. Neurophysiol. Clin. 2010, 40, 129–135. [Google Scholar] [CrossRef] [PubMed]
- Parisi, V.; Manni, G.; Spadaro, M.; Colacino, G.; Restuccia, R.; Marchi, S. Correlation between morphological and functional retinal impairment in multiple sclerosis patients. Investig. Ophthalmol. Vis. Sci. 1999, 40, 2520–2527. [Google Scholar]
- Curcio, C.A.; Allen, K.A. Topography of ganglion cells in human retina. J. Comp. Neurol. 1990, 300, 5–25. [Google Scholar] [CrossRef] [PubMed]


| Controls (N a = 30) | MS-ON b (N a = 19) | |||||
|---|---|---|---|---|---|---|
| Range | Mean | SD c | Range | Mean | SD c | |
| Age (years) | 30/55 | 45.09 | 5.08 | 30/55 | 44.16 | 4.66 |
| Intraocular pressure (mmHg) | 12/17 | 13.3 | 1.9 | 12/17 | 13.9 | 2.0 |
| BCVA d (LogMar) | 0/0 | 0 | 0 | 0 | 0 | 0 |
| Duration of disease (years) | ----------------- | 5-20 | 10.06 | 6.12 | ||
| EDSS e score | ---------------- | 0–3 | 1.54 | 1.43 | ||
| Rings/Areas | ETDRS a Area 2 | ETDRS a Area 3 | ||||||||||||||||||||
|---|---|---|---|---|---|---|---|---|---|---|---|---|---|---|---|---|---|---|---|---|---|---|
| R1 d/Area 1 | R2 d/Area 2 | R3+4 d/Area 3 | SUPERIOR | NASAL | TEMPORAL | INFERIOR | SUPERIOR | NASAL | TEMPORAL | INFERIOR | ||||||||||||
| PhNR b R1 d RAD e (nV/ deg2) g | GCL+ c T f (µ) h | PhNR b R2 d RAD e (nV/ deg2) g | GCL+ c T f (µ) h | PhNR b R3+R4 d RAD e (nV/ deg2) g | GCL+ c T f (µ) h | PhNR b R2 d RAD e (nV/ deg2) g | GCL+ c T f (µ) h | PhNR b R2 d RAD e (nV/ deg2) g | GCL+ c T f (µ) h | PhNR b R2 d RAD e (nV/ deg2) g | GCL+ c T f (µ) h | PhNR b R2 d RAD e (nV/ deg2) g | GCL+ c T f (µ) h | PhNR b R3+R4 d RAD e (nV /deg2) g | GCL+ c T f (µ) h | PhNR b R3+R4 d RAD e (nV/ deg2) g | GCL+ c T f (µ) h | PhNR b R3+R4 d RAD e (nV/ deg2) g | GCL+ c T f (µ) h | PhNR b R3+R4 d RAD e (nV/ deg2) g | GCL+ c T f (µ) h | |
| #1 | 15.2 | 44 | 8.3 | 81.5 | 3.5 | 48.24 | 6.6 | 85 | 5.9 | 80 | 9.4 | 81 | 7.9 | 80 | 4.9 | 64 | 4.2 | 66 | 2.3 | 64 | 1.9 | 57 |
| #2 | 17.8 | 45 | 2.3 | 80 | 4.4 | 60.75 | 4.1 | 84 | 7.9 | 82 | 7.1 | 75 | 4.9 | 79 | 3.4 | 62 | 4 | 63 | 3.1 | 61 | 3 | 57 |
| #3 | 20.6 | 39 | 4 | 55 | 7.3 | 62.46 | 2.8 | 57 | 5.5 | 73 | 8.4 | 60 | 5.6 | 55 | 5.1 | 50 | 3.9 | 48 | 4 | 55 | 1.8 | 47 |
| #4 | 16 | 62 | 8 | 84 | 7.1 | 59.75 | 8 | 92 | 14.9 | 96 | 6.7 | 62 | 9.5 | 86 | 3.8 | 59 | 4.5 | 64 | 4.4 | 62 | 4.6 | 59 |
| #5 | 10 | 27 | 1.4 | 62 | 1.2 | 54.25 | 1.3 | 48 | 10.2 | 56 | 2.8 | 64 | 4.1 | 62 | 1 | 52 | 1.4 | 53 | 1.1 | 57 | 1.8 | 53 |
| #6 | 18.1 | 32 | 13.2 | 88 | 3.4 | 53.75 | 9.8 | 66 | 6.8 | 59 | 6.9 | 66 | 6.2 | 61 | 1 | 53 | 1.9 | 52 | 2 | 60 | 1.1 | 52 |
| #7 | 14.2 | 40 | 8.1 | 65.5 | 1.6 | 50.75 | 13.3 | 94 | 11.5 | 78 | 9.1 | 80 | 10.5 | 81 | 2.8 | 52 | 1.2 | 57 | 1.2 | 58 | 3.1 | 54 |
| #8 | 29.4 | 65 | 10.5 | 79.25 | 1.5 | 55.25 | 1.6 | 51 | 9 | 65 | 5.2 | 64 | 8.9 | 70 | 2.4 | 47 | 3.6 | 54 | 1.8 | 51 | 2.5 | 51 |
| #9 | 19.8 | 33 | 4.3 | 57.5 | 0.9 | 41.3 | 4.9 | 60 | 2.5 | 54 | 3.3 | 57 | 6.9 | 59 | 2.1 | 55 | 1.1 | 44 | 0.4 | 51 | 1.3 | 46 |
| #10 | 5.9 | 30 | 5.2 | 54 | 2.2 | 45 | 5.3 | 53 | 6.9 | 52 | 7.7 | 53 | 6.7 | 58 | 3.5 | 46 | 2.1 | 43 | 3.9 | 62 | 1.3 | 41 |
| #11 | 22 | 39 | 8.5 | 74.5 | 6.3 | 59.25 | 3 | 74 | 8.8 | 77 | 2.1 | 51 | 7 | 77 | 4.7 | 60 | 3.8 | 60 | 3.4 | 60 | 3.2 | 57 |
| #12 | 2.6 | 40 | 3.3 | 73 | 1.2 | 57.75 | 5 | 77 | 3.9 | 73 | 2 | 50 | 3.3 | 49 | 0.8 | 39 | 2.6 | 60 | 0.8 | 55 | 4.2 | 58 |
| #13 | 4.3 | 33 | 2.6 | 53.75 | 1.3 | 51.5 | 5.6 | 58 | 1.9 | 52 | 4.8 | 49 | 3.7 | 56 | 1.2 | 50 | 1.8 | 53 | 1.2 | 53 | 1.1 | 50 |
| #14 | 17.6 | 54 | 2.4 | 52 | 3.2 | 60.75 | 3.6 | 84 | 9.8 | 86 | 9.2 | 81 | 8.8 | 85 | 4.9 | 60 | 2.6 | 62 | 3.7 | 65 | 2.2 | 56 |
| #15 | 19.2 | 54 | 6.3 | 84.25 | 8.4 | 60.25 | 4.1 | 81 | 11.3 | 87 | 8.9 | 82 | 8.4 | 87 | 3.3 | 60 | 4.7 | 68 | 3.9 | 63 | 3.7 | 57 |
| #16 | 11.9 | 31 | 6 | 63.75 | 6.6 | 62.44 | 8 | 61 | 7 | 60 | 5.2 | 66 | 6.1 | 68 | 2.1 | 39 | 1.1 | 40 | 2.2 | 58 | 2 | 44 |
| #17 | 12.6 | 35 | 6.6 | 67.25 | 3.7 | 46.5 | 5.7 | 64 | 6.8 | 60 | 5.7 | 73 | 6 | 72 | 1.1 | 40 | 3 | 44 | 2.3 | 58 | 2.1 | 44 |
| #18 | 8.6 | 30 | 8.3 | 60 | 6.1 | 52.28 | 13.8 | 96 | 8.3 | 63 | 6.5 | 58 | 7.2 | 60 | 2.6 | 49 | 2.1 | 53 | 4.7 | 63 | 2.9 | 46 |
| #19 | 9.5 | 31 | 2.8 | 60.75 | 3.8 | 49.75 | 4.9 | 59 | 9.9 | 58 | 9.2 | 65 | 6.9 | 61 | 3.9 | 48 | 3 | 44 | 4.7 | 59 | 2.7 | 48 |
| CL i | 23.43 | 45.62 | 10.46 | 91.36 | 7.36 | 63.69 | 12.61 | 93.47 | 13.96 | 91.36 | 15.57 | 87.44 | 11.01 | 92.38 | 5.27 | 61.28 | 4.91 | 67.10 | 6.49 | 65.59 | 5.07 | 60.25 |
| Controls (N a = 30) | MS-ON b (N a = 19) | Ab c | ANOVA d | |||||
|---|---|---|---|---|---|---|---|---|
| Mean | SD e | Mean | SD e | N a | % | f (1.48) | p | |
| Area 1 GCL+-T f (µ g) | 48.467 | 8.080 | 40.211 | 11.208 | 15 | 78.95% | 9.42 | 0.004 |
| Area 2 GCL+-T f (µ g) | 93.408 | 5.484 | 68.211 | 11.905 | 19 | 100.00% | 101.40 | <0.001 |
| Area 3 GCL+-T f (µ g) | 65.375 | 4.504 | 54.314 | 6.312 | 19 | 100.00% | 51.24 | <0.001 |
| ETRS h Area 2 sup i GCL+-T f (µ g) | 95.400 | 5.164 | 70.737 | 15.509 | 17 | 89.47% | 65.17 | <0.001 |
| ETRS h Area 2 nas j GCL+-T f (µ g) | 93.767 | 6.426 | 69.000 | 13.367 | 18 | 94.74% | 75.98 | <0.001 |
| ETRS h Area 2 inf k GCL+-T f (µ g) | 94.767 | 6.377 | 68.737 | 11.906 | 19 | 100.00% | 99.29 | <0.001 |
| ETRS h Area 2 temp l GCL+-T f (µ g) | 89.700 | 6.052 | 65.105 | 10.959 | 19 | 100.00% | 102.58 | <0.001 |
| ETRS h Area 3 sup i GCL+-T f (µ g) | 63.133 | 4.939 | 51.842 | 7.712 | 17 | 89.47% | 39.20 | <0.001 |
| ETRS h Area 3 nas j GCL+-T f (µ g) | 68.833 | 4.624 | 54.105 | 8.582 | 18 | 94.74% | 60.95 | <0.001 |
| ETRS h Area 3 inf k GCL+-T f (µ g) | 61.833 | 4.227 | 51.421 | 5.611 | 19 | 100.00% | 54.64 | <0.001 |
| ETRS h Area 3 temp l GCL+-T f (µ g) | 67.700 | 5.633 | 58.684 | 4.204 | 19 | 100.00% | 35.89 | <0.001 |
| R1 m mfPhNR n RAD o (nV/deg2) p | 26.274 | 7.267 | 14.489 | 6.716 | 18 | 94.74% | 32.40 | <0.001 |
| R2 q mfPhNR n RAD o (nV/deg2) p | 11.404 | 4.163 | 5.900 | 3.180 | 17 | 89.47% | 24.19 | <0.001 |
| R3 r mfPhNR n RAD o (nV/deg2) p | 8.163 | 2.346 | 3.879 | 2.420 | 18 | 94.74% | 37.86 | <0.001 |
| R4 s mfPhNR n RAD o (nV/deg2) p | 4.323 | 1.082 | 2.584 | 1.377 | 18 | 94.74% | 24.29 | <0.001 |
| R5 t mfPhNR n RAD o (nV/deg2) p | 3.728 | 0.873 | 1.263 | 0.893 | 19 | 100.00% | 91.13 | <0.001 |
| ETDRS h R2q sup i mfPhNR n RAD o (nV/deg2) p | 14.437 | 4.885 | 5.863 | 3.451 | 17 | 89.47% | 44.34 | <0.001 |
| ETDRS h R2 q nas j mfPhNR n RAD o (nV/deg2) p | 16.653 | 7.191 | 7.832 | 3.194 | 18 | 94.74% | 25.27 | <0.001 |
| ETDRS h R2 q inf k mfPhNR n RAD o (nV/deg2) p | 13.447 | 6.525 | 6.768 | 1.959 | 19 | 100.00% | 18.71 | <0.001 |
| ETDRS h R2 q temp l mfPhNR n RAD o (nV/deg2) p | 17.520 | 5.210 | 6.326 | 2.483 | 19 | 100.00% | 76.28 | <0.001 |
| ETDRS h R3+R4 u sup i mfPhNR n RAD o (nV/deg2) p | 5.983 | 1.906 | 2.874 | 1.454 | 19 | 100.00% | 36.85 | <0.001 |
| ETDRS h R3+R4 u nas j mfPhNR n RAD o (nV/deg2) p | 5.513 | 1.626 | 2.768 | 1.201 | 19 | 100.00% | 40.14 | <0.001 |
| ETDRS h R3+R4 u inf k mfPhNR n RAD o (nV/deg2) p | 5.710 | 1.705 | 2.447 | 1.017 | 19 | 100.00% | 56.56 | <0.001 |
| ETDRS h R3+R4 u temp l mfPhNR n RAD o (nV/deg2) p | 7.287 | 2.111 | 2.689 | 1.393 | 19 | 100.00% | 70.41 | <0.001 |
Disclaimer/Publisher’s Note: The statements, opinions and data contained in all publications are solely those of the individual author(s) and contributor(s) and not of MDPI and/or the editor(s). MDPI and/or the editor(s) disclaim responsibility for any injury to people or property resulting from any ideas, methods, instructions or products referred to in the content. |
© 2023 by the authors. Licensee MDPI, Basel, Switzerland. This article is an open access article distributed under the terms and conditions of the Creative Commons Attribution (CC BY) license (https://creativecommons.org/licenses/by/4.0/).
Share and Cite
Parisi, V.; Barbano, L.; Antonelli, G.; Nicoletti, C.G.; Landi, D.; Mataluni, G.; Di Renzo, A.; Buttari, F.; Marfia, G.A.; Centonze, D.; et al. Topographical Correlation between Structural and Functional Impairment of the Macular Inner Retinal Layers in Multiple Sclerosis Eyes with a History of Optic Neuropathy. J. Clin. Med. 2023, 12, 7175. https://doi.org/10.3390/jcm12227175
Parisi V, Barbano L, Antonelli G, Nicoletti CG, Landi D, Mataluni G, Di Renzo A, Buttari F, Marfia GA, Centonze D, et al. Topographical Correlation between Structural and Functional Impairment of the Macular Inner Retinal Layers in Multiple Sclerosis Eyes with a History of Optic Neuropathy. Journal of Clinical Medicine. 2023; 12(22):7175. https://doi.org/10.3390/jcm12227175
Chicago/Turabian StyleParisi, Vincenzo, Lucilla Barbano, Giulio Antonelli, Carolina Gabri Nicoletti, Doriana Landi, Giorgia Mataluni, Antonio Di Renzo, Fabio Buttari, Girolama Alessandra Marfia, Diego Centonze, and et al. 2023. "Topographical Correlation between Structural and Functional Impairment of the Macular Inner Retinal Layers in Multiple Sclerosis Eyes with a History of Optic Neuropathy" Journal of Clinical Medicine 12, no. 22: 7175. https://doi.org/10.3390/jcm12227175
APA StyleParisi, V., Barbano, L., Antonelli, G., Nicoletti, C. G., Landi, D., Mataluni, G., Di Renzo, A., Buttari, F., Marfia, G. A., Centonze, D., & Ziccardi, L. (2023). Topographical Correlation between Structural and Functional Impairment of the Macular Inner Retinal Layers in Multiple Sclerosis Eyes with a History of Optic Neuropathy. Journal of Clinical Medicine, 12(22), 7175. https://doi.org/10.3390/jcm12227175