
Body Mass Index, Quality of Life and Activity Limitation Trajectories over 2 Years in Patients with Knee or Hip Osteoarthritis: A Dual Trajectory Approach Based on 4265 Patients Included in the AktivA Quality Register

 ,
,
Abstract
:1. Introduction
2. Material and Methods
2.1. Study Design
2.1.1. Inclusion Criteria
2.1.2. The AktivA Implementation Program
2.2. Baseline Characteristics
2.3. Outcome Measures
2.4. Statistical Analysis
3. Results
4. Discussion
5. Conclusions
Supplementary Materials
Author Contributions
Funding
Institutional Review Board Statement
Informed Consent Statement
Data Availability Statement
Acknowledgments
Conflicts of Interest
References
- Allen, K.D.; Thoma, L.M.; Golightly, Y.M. Epidemiology of osteoarthritis. Osteoarthr. Cartil. 2022, 30, 184–195. [Google Scholar] [CrossRef] [PubMed]
- Bannuru, R.R.; Osani, M.C.; Vaysbrot, E.E.; Arden, N.K.; Bennell, K.; Bierma-Zeinstra, S.M.A.; Kraus, V.B.; Lohmander, L.S.; Abbott, J.H.; Bhandari, M.; et al. OARSI guidelines for the non-surgical management of knee, hip, and polyarticular osteoarthritis. Osteoarthr. Cartil. 2019, 27, 1578–1589. [Google Scholar] [CrossRef] [PubMed]
- Kolasinski, S.L.; Neogi, T.; Hochberg, M.C.; Oatis, C.; Guyatt, G.; Block, J.; Callahan, L.; Copenhaver, C.; Dodge, C.; Felson, D.; et al. 2019 American College of Rheumatology/Arthritis Foundation Guideline for the Management of Osteoarthritis of the Hand, Hip, and Knee. Arthritis Care Res. 2020, 72, 149–162. [Google Scholar] [CrossRef] [PubMed]
- Fransen, M.; McConnell, S.; Harmer, A.R.; Van der Esch, M.; Simic, M.; Bennell, K.L. Exercise for osteoarthritis of the knee: A Cochrane systematic review. Br. J. Sports Med. 2015, 49, 1554–1557. [Google Scholar] [CrossRef] [PubMed]
- Fransen, M.; McConnell, S.; Hernandez-Molina, G.; Reichenbach, S. Exercise for osteoarthritis of the hip. Cochrane Database Syst. Rev. 2014, 4, CD007912. [Google Scholar] [CrossRef] [PubMed]
- Salis, Z.; Sainsbury, A.; Keen, H.I.; Gallego, B.; Jin, X. Weight loss is associated with reduced risk of knee and hip replacement: A survival analysis using Osteoarthritis Initiative data. Int. J. Obes. 2022, 46, 874–884. [Google Scholar] [CrossRef] [PubMed]
- Hunter, D.J.; Bierma-Zeinstra, S. Osteoarthritis. Lancet 2019, 393, 1745–1759. [Google Scholar] [CrossRef] [PubMed]
- Reyes, C.; Leyland, K.M.; Peat, G.; Cooper, C.; Arden, N.K.; Prieto-Alhambra, D. Association Between Overweight and Obesity and Risk of Clinically Diagnosed Knee, Hip, and Hand Osteoarthritis: A Population-Based Cohort Study. Arthritis Rheumatol. 2016, 68, 1869–1875. [Google Scholar] [CrossRef]
- Murdock, D.J.; Wu, N.; Grimsby, J.S.; Calle, R.A.; Donahue, S.; Glass, D.J.; Sleeman, M.W.; Sanchez, R.J. The prevalence of low muscle mass associated with obesity in the USA. Skelet. Muscle 2022, 12, 26. [Google Scholar] [CrossRef]
- Lim, Y.Z.; Wong, J.; Hussain, S.M.; Estee, M.M.; Zolio, L.; Page, M.J.; Harrison, C.L.; Wluka, A.E.; Wang, Y.; Cicuttini, F.M. Recommendations for weight management in osteoarthritis: A systematic review of clinical practice guidelines. Osteoarthr. Cart. Open 2022, 4, 100298. [Google Scholar] [CrossRef]
- Gaesser, G.A.; Angadi, S.S. Obesity treatment: Weight loss versus increasing fitness and physical activity for reducing health risks. iScience 2021, 24, 102995. [Google Scholar] [CrossRef] [PubMed]
- Christensen, R.; Bartels, E.M.; Astrup, A.; Bliddal, H. Effect of weight reduction in obese patients diagnosed with knee osteoarthritis: A systematic review and meta-analysis. Ann. Rheum. Dis. 2007, 66, 433–439. [Google Scholar] [CrossRef] [PubMed]
- Solanki, P.; Hussain, S.M.; Abidi, J.; Cheng, J.; Fairley, J.L.; Page, M.J.; Cicuttini, F.M.; Wluka, A.E. Association between weight gain and knee osteoarthritis: A systematic review. Osteoarthr. Cartil. 2022, 31, 300–316. [Google Scholar] [CrossRef] [PubMed]
- Robson, E.K.; Hodder, R.K.; Kamper, S.J.; O’Brien, K.M.; Williams, A.; Lee, H.; Wolfenden, L.; Yoong, S.; Wiggers, J.; Barnett, C.; et al. Effectiveness of Weight-Loss Interventions for Reducing Pain and Disability in People With Common Musculoskeletal Disorders: A Systematic Review With Meta-Analysis. J. Orthop. Sports Phys. Ther. 2020, 50, 319–333. [Google Scholar] [CrossRef] [PubMed]
- Gibbs, A.J.; Gray, B.; Wallis, J.A.; Taylor, N.F.; Kemp, J.L.; Hunter, D.J.; Barton, C.J. Recommendations for the management of hip and knee osteoarthritis: A systematic review of clinical practice guidelines. Osteoarthr. Cartil. 2023, 31, 1280–1292. [Google Scholar] [CrossRef] [PubMed]
- Holden, M.A.; Hattle, M.; Runhaar, J. Moderators of the effect of therapeutic exercise for knee and hip osteoarthritis: A systematic review and individual participant data meta-analysis(vol 5, pg e386, 2023). Lancet Rheumatol. 2023, 5, E440. [Google Scholar] [CrossRef]
- Holm, I.; Pripp, A.H.; Risberg, M.A. The Active with OsteoArthritis(AktivA) Physiotherapy Implementation Model: A Patient Education, Supervised Exercise and Self-Management Program for Patients with Mild to Moderate Osteoarthritis of the Knee or Hip Joint. A National Register Study with a Two-Year Follow-Up. J. Clin. Med. 2020, 9, 3112. [Google Scholar] [CrossRef] [PubMed]
- Zhang, W.; Doherty, M.; Peat, G.; Bierma-Zeinstra, M.A.; Arden, N.K.; Bresnihan, B.; Herrero-Beaumont, G.; Kirschner, S.; Leeb, B.F.; Lohmander, L.S.; et al. EULAR evidence-based recommendations for the diagnosis of knee osteoarthritis. Ann. Rheum. Dis. 2010, 69, 483–489. [Google Scholar] [CrossRef]
- Obradovic, M.; Lal, A.; Liedgens, H. Validity and responsiveness of EuroQol-5 dimension(EQ-5D) versus Short Form-6 dimension(SF-6D) questionnaire in chronic pain. Health Qual. Life Outcomes 2013, 11, 110. [Google Scholar] [CrossRef]
- Nilsdotter, A.K.; Lohmander, L.S.; Klassbo, M.; Roos, E.M. Hip disability and osteoarthritis outcome score(HOOS)--validity and responsiveness in total hip replacement. BMC Musculoskelet. Disord. 2003, 4, 10. [Google Scholar] [CrossRef]
- Roos, E.M.; Roos, H.P.; Lohmander, L.S.; Ekdahl, C.; Beynnon, B.D. Knee Injury and Osteoarthritis Outcome Score (KOOS)—development of a self-administered outcome measure. J. Orthop. Sports Phys. Ther. 1998, 28, 88–96. [Google Scholar] [CrossRef] [PubMed]
- Chatman, A.B.; Hyams, S.P.; Neel, J.M.; Binkley, J.M.; Stratford, P.W.; Schomberg, A.; Stabler, M. The Patient-Specific Functional Scale: Measurement properties in patients with knee dysfunction. Phys. Ther. 1997, 77, 820–829. [Google Scholar] [CrossRef] [PubMed]
- Berghmans, D.D.; Lenssen, A.F.; van Rhijn, L.W.; de Bie, R.A. The Patient-Specific Functional Scale: Its Reliability and Responsiveness in Patients Undergoing a Total Knee Arthroplasty. J. Orthop. Sports Phys. Ther. 2015, 45, 550–556. [Google Scholar] [CrossRef]
- Nagin, D.S. Group-based trajectory modeling: An overview. Ann. Nutr. Metab. 2014, 65, 205–210. [Google Scholar] [CrossRef] [PubMed]
- Nagin, D.S.; Odgers, C.L. Group-based trajectory modeling in clinical research. Annu. Rev. Clin. Psychol. 2010, 6, 109–138. [Google Scholar] [CrossRef] [PubMed]
- Jones, B.L.; Nagin, D.S. A Note on a Stata Plugin for Estimating Group-based Trajectory Models. Sociol. Methods Res. 2013, 42, 608–613. [Google Scholar] [CrossRef]
- Radojcic, M.R.; Perera, R.S.; Chen, L.; Spector, T.D.; Hart, D.J.; Ferreira, M.L.; Arden, N.K. Specific body mass index trajectories were related to musculoskeletal pain and mortality: 19-year follow-up cohort. J. Clin. Epidemiol. 2022, 141, 54–63. [Google Scholar] [CrossRef] [PubMed]
- Winter, J.E.; MacInnis, R.J.; Nowson, C.A. The Influence of Age the BMI and All-Cause Mortality Association: A Meta-Analysis. J. Nutr. Health Aging 2017, 21, 1254–1258. [Google Scholar] [CrossRef]
- Visaria, A.; Setoguchi, S. Body mass index and all-cause mortality in a 21st century U.S. population: A National Health Interview Survey analysis. PLoS ONE 2023, 18, e0287218. [Google Scholar] [CrossRef]
- Lee, A.C.; Harvey, W.F.; Han, X.; Price, L.L.; Driban, J.B.; Bannuru, R.R.; Wang, C. Pain and functional trajectories in symptomatic knee osteoarthritis over up to 12 weeks of exercise exposure. Osteoarthr. Cartil. 2018, 26, 501–512. [Google Scholar] [CrossRef]
- Oliveira, A.; Ramos, E.; Lopes, C.; Barros, H. Self-reporting weight and height: Misclassification effect on the risk estimates for acute myocardial infarction. Eur. J. Public Health 2009, 19, 548–553. [Google Scholar] [CrossRef]
- Yoong, S.L.; Carey, M.L.; D’Este, C.; Sanson-Fisher, R.W. Agreement between self-reported and measured weight and height collected in general practice patients: A prospective study. BMC Med. Res. Methodol. 2013, 13, 38. [Google Scholar] [CrossRef]
- Meyer, V.M.; Benjamens, S.; Moumni, M.E.; Lange, J.F.M.; Pol, R.A. Global Overview of Response Rates in Patient and Health Care Professional Surveys in Surgery: A Systematic Review. Ann. Surg. 2022, 275, e75–e81. [Google Scholar] [CrossRef]
- Wu, M.; Zhao, K.; Fils-Aime, F. Response rates of online surveys in published research: A meta-analysis. Comput. Hum. Behav. Rep. 2022, 7, 11. [Google Scholar] [CrossRef]
- Thomas, M.J. Expanding and explaining symptoms in knee osteoarthritis trajectories: Fluctuations, flares and future directions. Osteoarthr. Cartil. 2023, 31, 725–726. [Google Scholar] [CrossRef]

| Total Population N = 4265 | |
|---|---|
| Age (SD 1) | 63 (9.4) |
| Female (%) | 74 |
| Body weight, kg (SD) | 82.2 (16.2) |
| BMI 2 (kg/m2) | 28.1 (4.9) |
| Hip/Knee OA (%) | 32/68 |
| Sick leave (%) | 18 |
| Pain NRS 3 (0–10) | 5.2 (1.8) |
| General health (EQ-5D VAS 4) | 64.4 (18.6) |
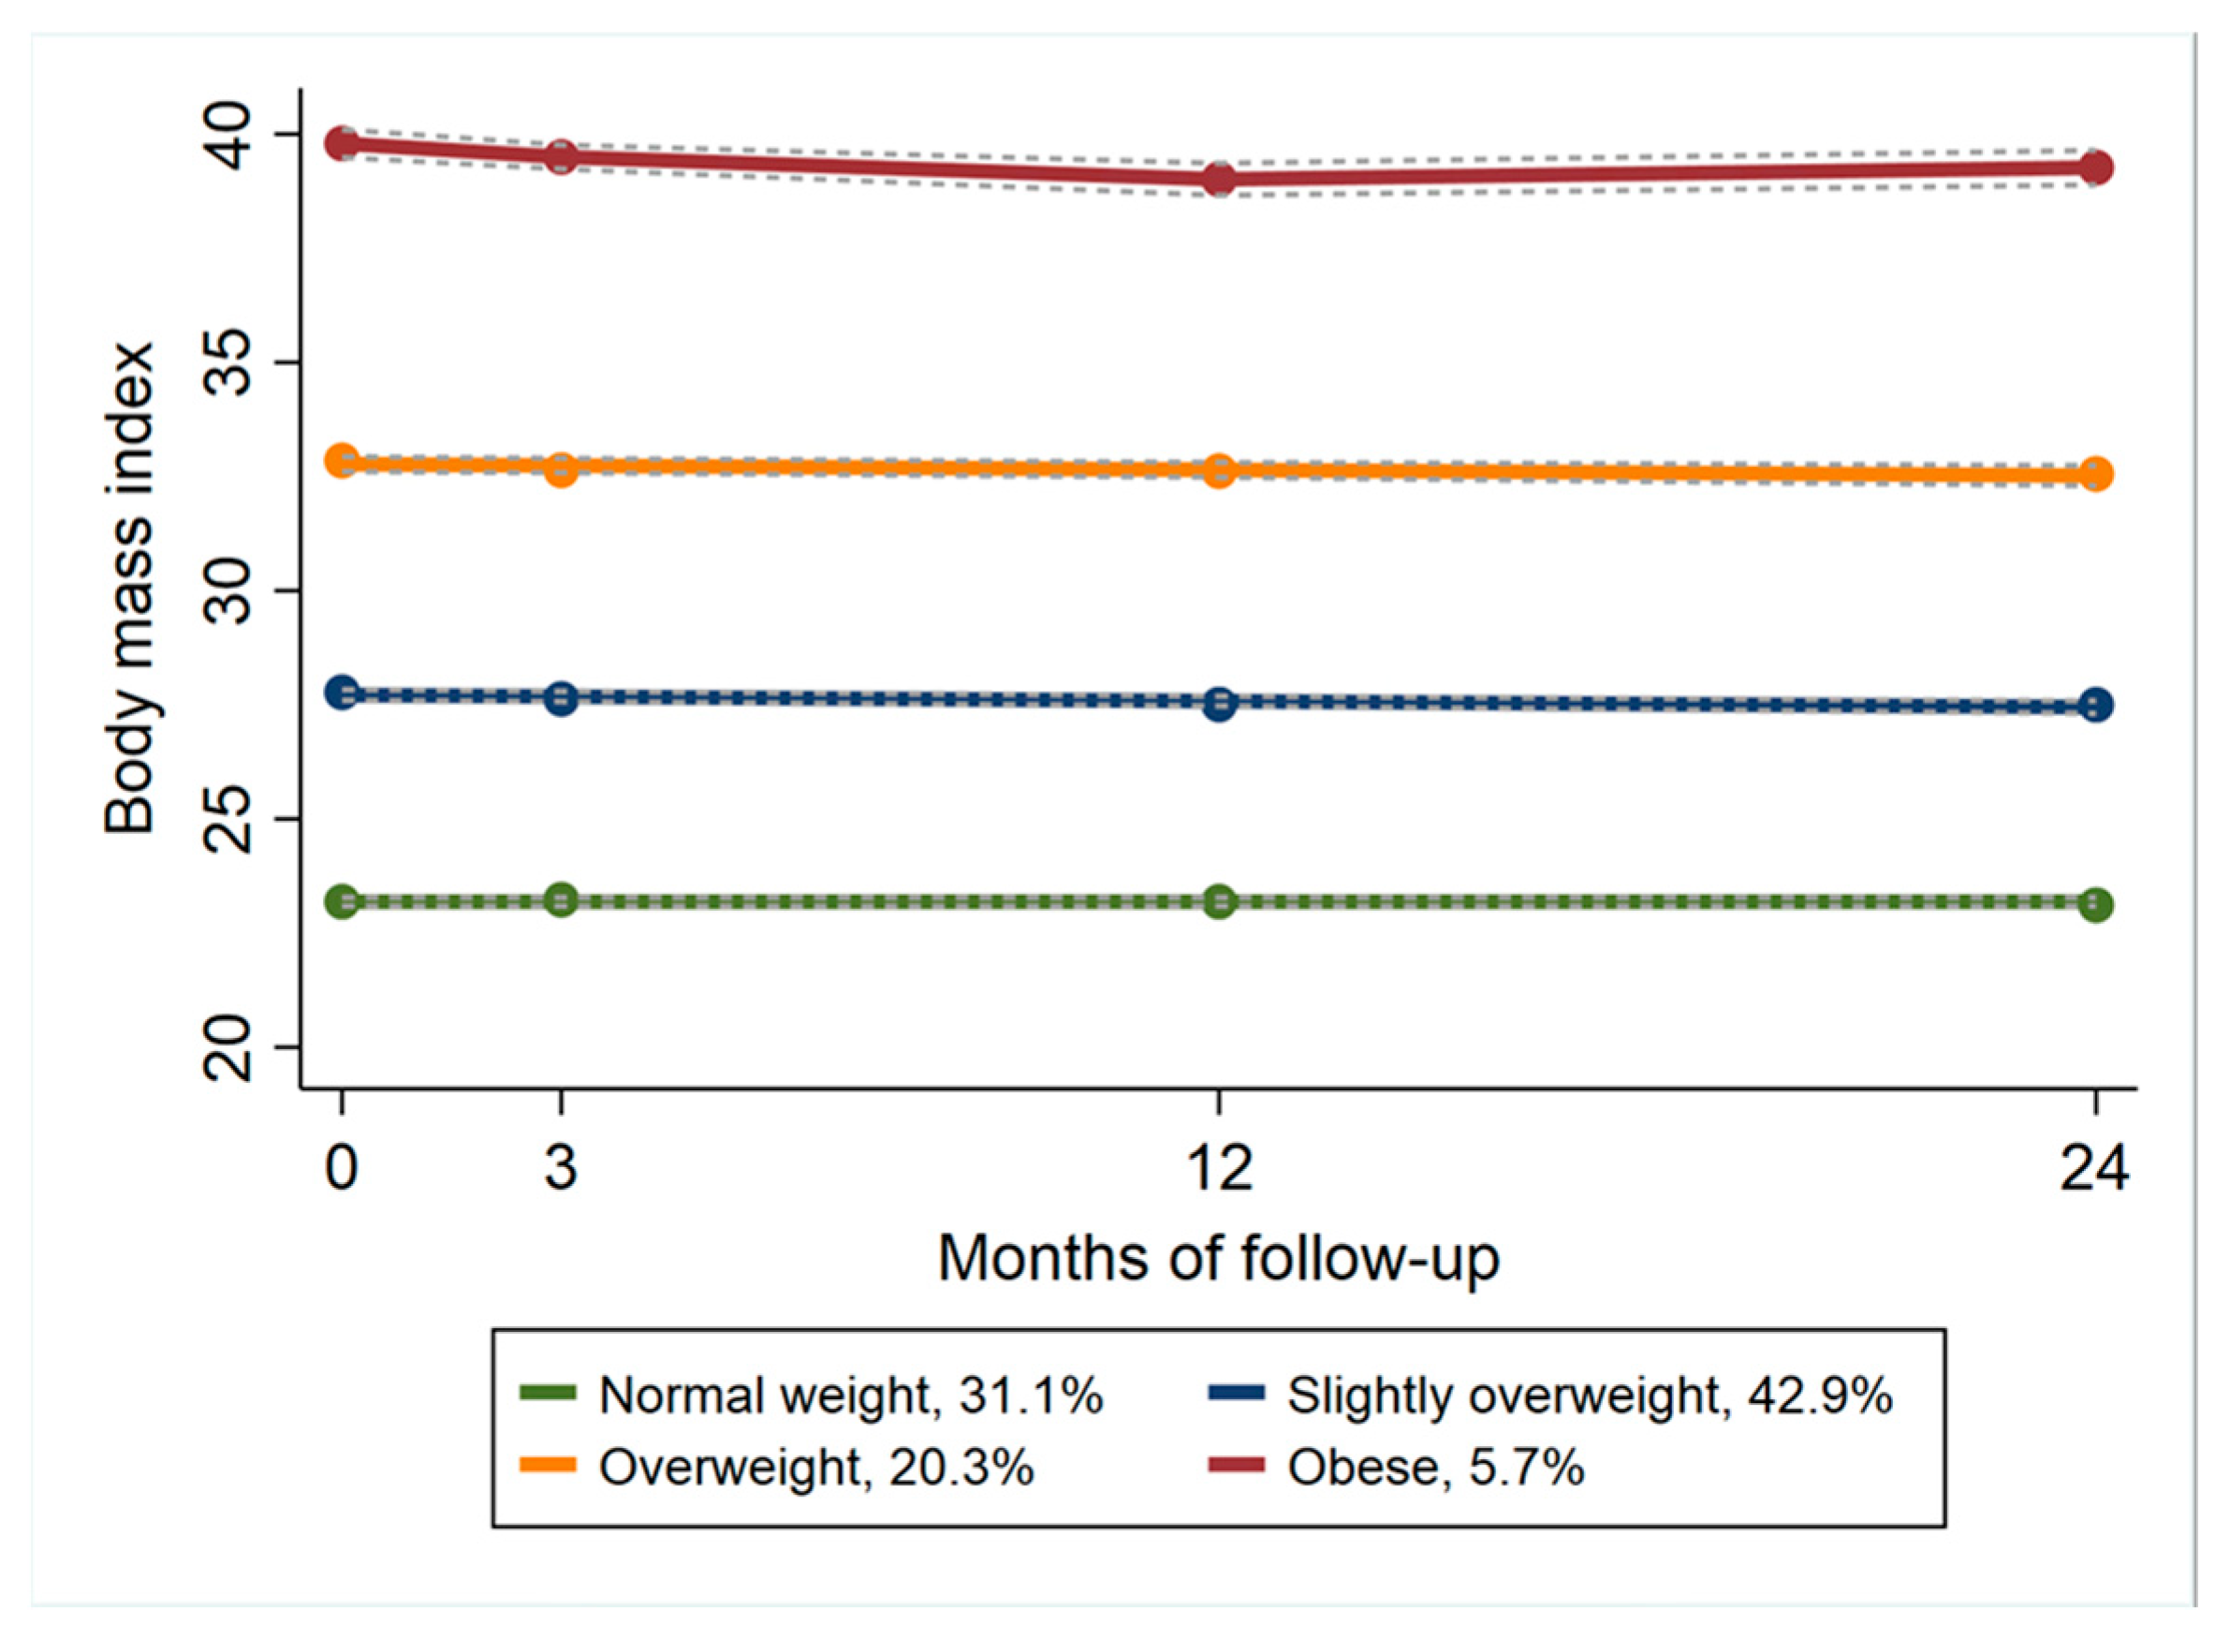
| Normal Weight | Slightly Overweight | Overweight | Obese | p-Value | |
|---|---|---|---|---|---|
| N (%) | 1327 (31) | 1830 (43) | 866 (20) | 242 (6) | |
| Age (SD 1) | 64.9 (9.7) | 63.4 (9.1) | 61.4 (9.1) | 57.7 (8.9) | <0.001 |
| Female% | 80 | 68 | 76 | 76 | |
| Body weight, kg (SD) | 67.4 (8.4) | 82.2 (9.8) | 95.7 (10.5) | 115 (13.9) | <0.001 |
| BMI 2 (kg/m2) | 23.1 (1.7) | 27.8 (1.6) | 32.9 (1.8) | 39.8 (3.2) | <0.001 |
| Hip/Knee% | 41/59 | 30/70 | 25/75 | 20/80 | |
| Sick leave% | 12 | 16 | 26 | 25 | |
| Pain (NRS 3 0–10) | 4.9 (1.8) | 5.2 (1.8) | 5.6 (1.8) | 6 (1.9) | <0.001 |
| General health (EQ-5D VAS 4) | 69.1 (17.4) | 65.1 (18.2) | 59 (18.5) | 53.3 (19.1) | <0.001 |
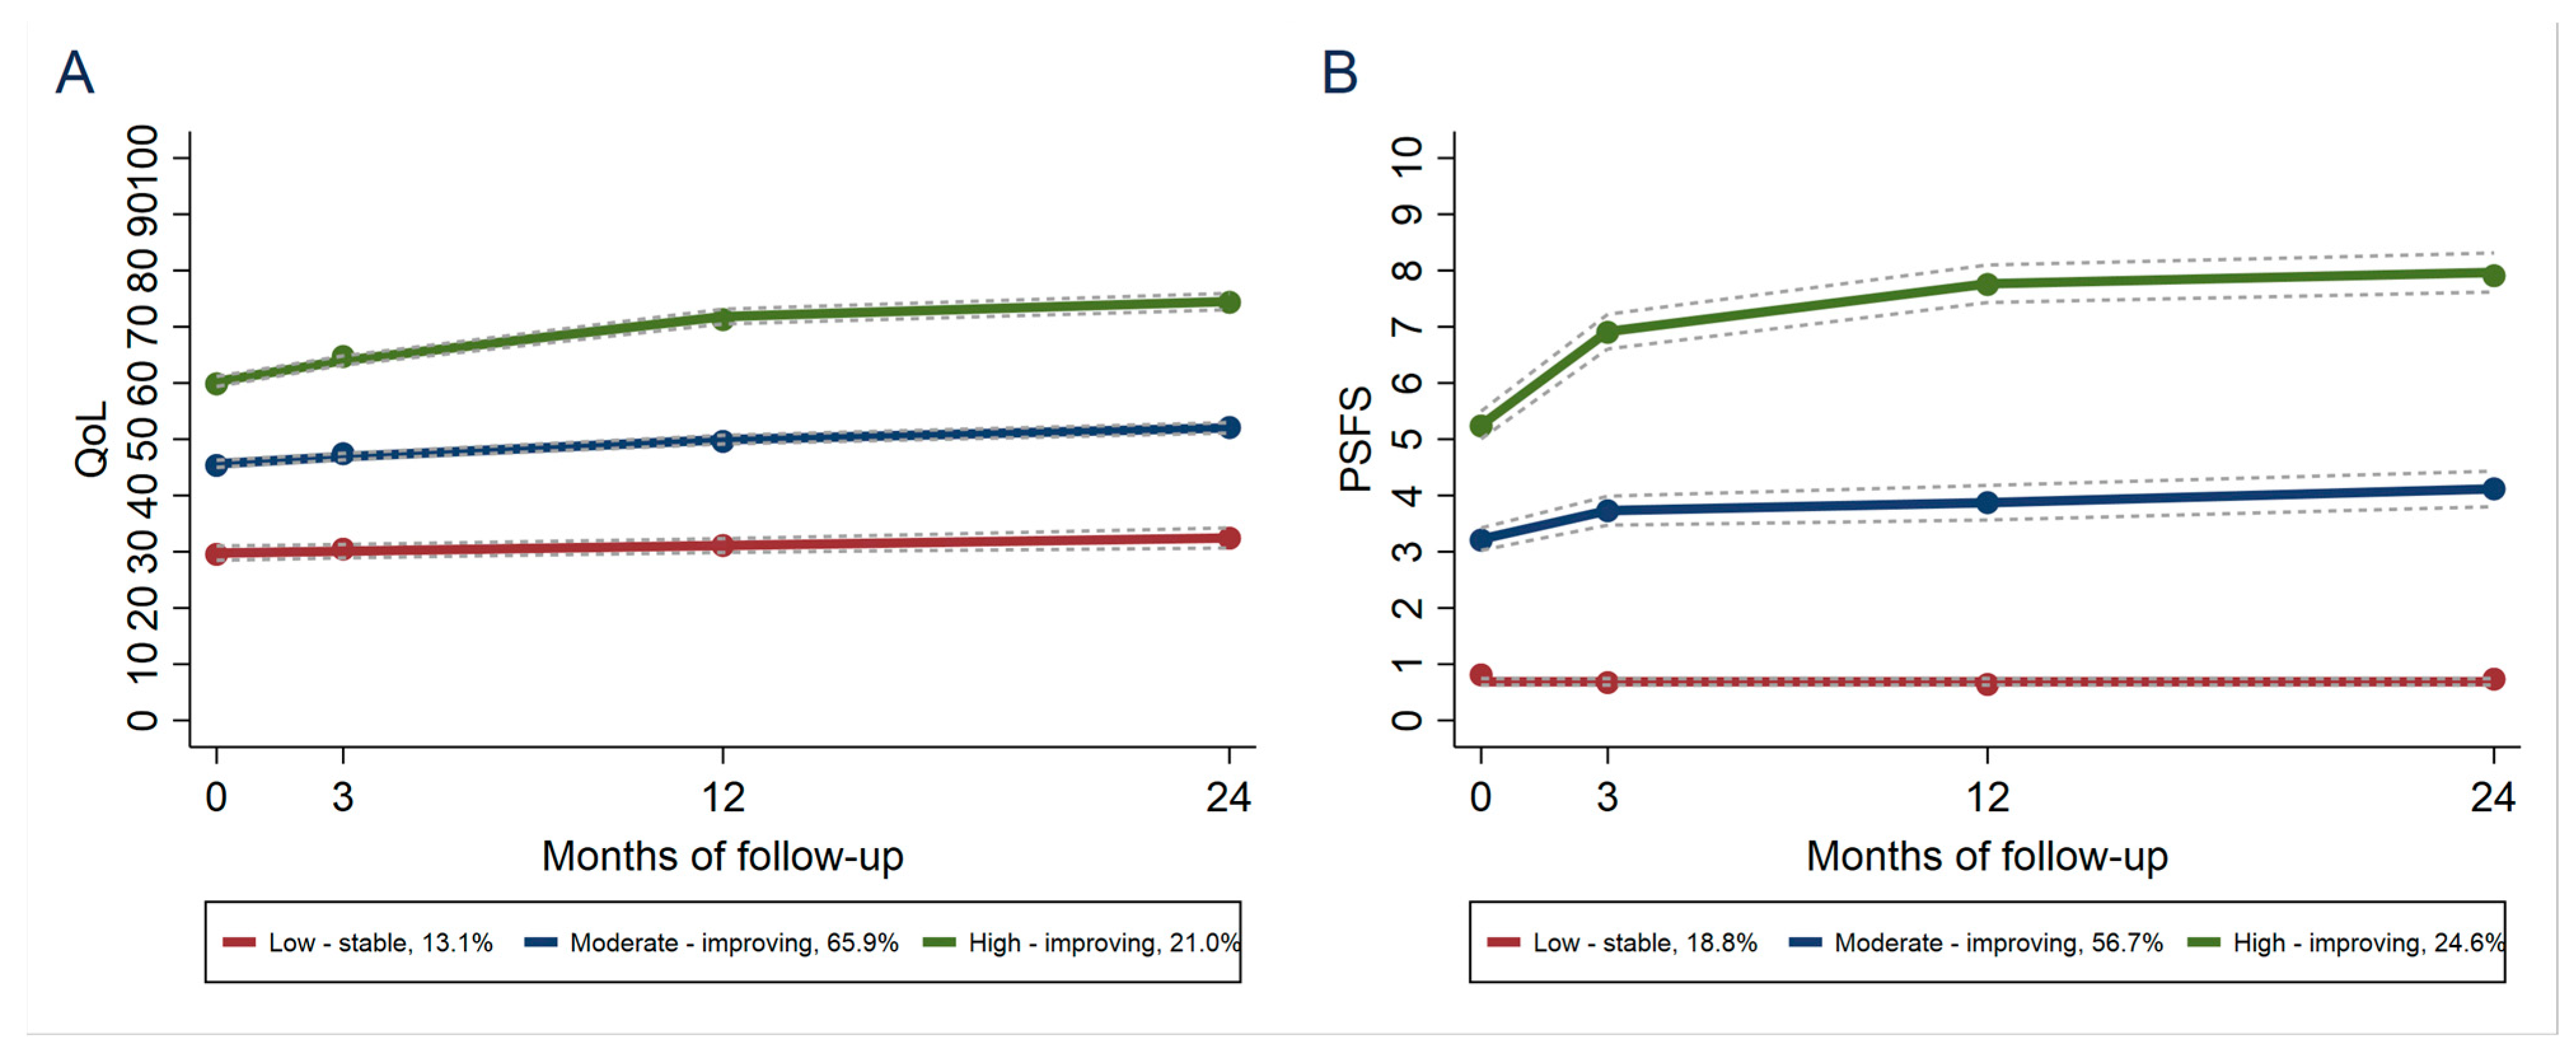
| A: QoL 1 Group | |||
|---|---|---|---|
| BMI 2 Group | Low-Stable | Moderate-Improving | High-Improving |
| Normal weight | 8.9 | 61.2 | 29.9 |
| Slightly overweight | 13.1 | 62.7 | 24.3 |
| Overweight | 24.8 | 62.3 | 12.9 |
| Obese | 35.9 | 51.5 | 12.6 |
| B: PSFS 3 Group | |||
| BMI Group | Low-Stable | Moderate-Improving | High-Improving |
| Normal weight | 16.8 | 48.5 | 34.7 |
| Slightly overweight | 18.2 | 54.6 | 27.2 |
| Overweight | 22.2 | 58.3 | 19.5 |
| Obese | 31.4 | 57.0 | 11.6 |
Disclaimer/Publisher’s Note: The statements, opinions and data contained in all publications are solely those of the individual author(s) and contributor(s) and not of MDPI and/or the editor(s). MDPI and/or the editor(s) disclaim responsibility for any injury to people or property resulting from any ideas, methods, instructions or products referred to in the content. |
© 2023 by the authors. Licensee MDPI, Basel, Switzerland. This article is an open access article distributed under the terms and conditions of the Creative Commons Attribution (CC BY) license (https://creativecommons.org/licenses/by/4.0/).
Share and Cite
Fosdahl, M.A.; Berg, B.; Risberg, M.A.; Øiestad, B.E.; Holm, I. Body Mass Index, Quality of Life and Activity Limitation Trajectories over 2 Years in Patients with Knee or Hip Osteoarthritis: A Dual Trajectory Approach Based on 4265 Patients Included in the AktivA Quality Register. J. Clin. Med. 2023, 12, 7094. https://doi.org/10.3390/jcm12227094
Fosdahl MA, Berg B, Risberg MA, Øiestad BE, Holm I. Body Mass Index, Quality of Life and Activity Limitation Trajectories over 2 Years in Patients with Knee or Hip Osteoarthritis: A Dual Trajectory Approach Based on 4265 Patients Included in the AktivA Quality Register. Journal of Clinical Medicine. 2023; 12(22):7094. https://doi.org/10.3390/jcm12227094
Chicago/Turabian StyleFosdahl, Merete Aarsland, Bjørnar Berg, May Arna Risberg, Britt Elin Øiestad, and Inger Holm. 2023. "Body Mass Index, Quality of Life and Activity Limitation Trajectories over 2 Years in Patients with Knee or Hip Osteoarthritis: A Dual Trajectory Approach Based on 4265 Patients Included in the AktivA Quality Register" Journal of Clinical Medicine 12, no. 22: 7094. https://doi.org/10.3390/jcm12227094
APA StyleFosdahl, M. A., Berg, B., Risberg, M. A., Øiestad, B. E., & Holm, I. (2023). Body Mass Index, Quality of Life and Activity Limitation Trajectories over 2 Years in Patients with Knee or Hip Osteoarthritis: A Dual Trajectory Approach Based on 4265 Patients Included in the AktivA Quality Register. Journal of Clinical Medicine, 12(22), 7094. https://doi.org/10.3390/jcm12227094