
Impact of the Body Composition on Knee Osteoarthritis Assessed Using Bioimpedance Analysis

 , , , , , ,
  ,
,
Abstract
:
1. Introduction
2. Materials and Methods
2.1. Selection of Patients
2.2. The Anthropometric Assessment
2.3. Sit-to-Stand Test
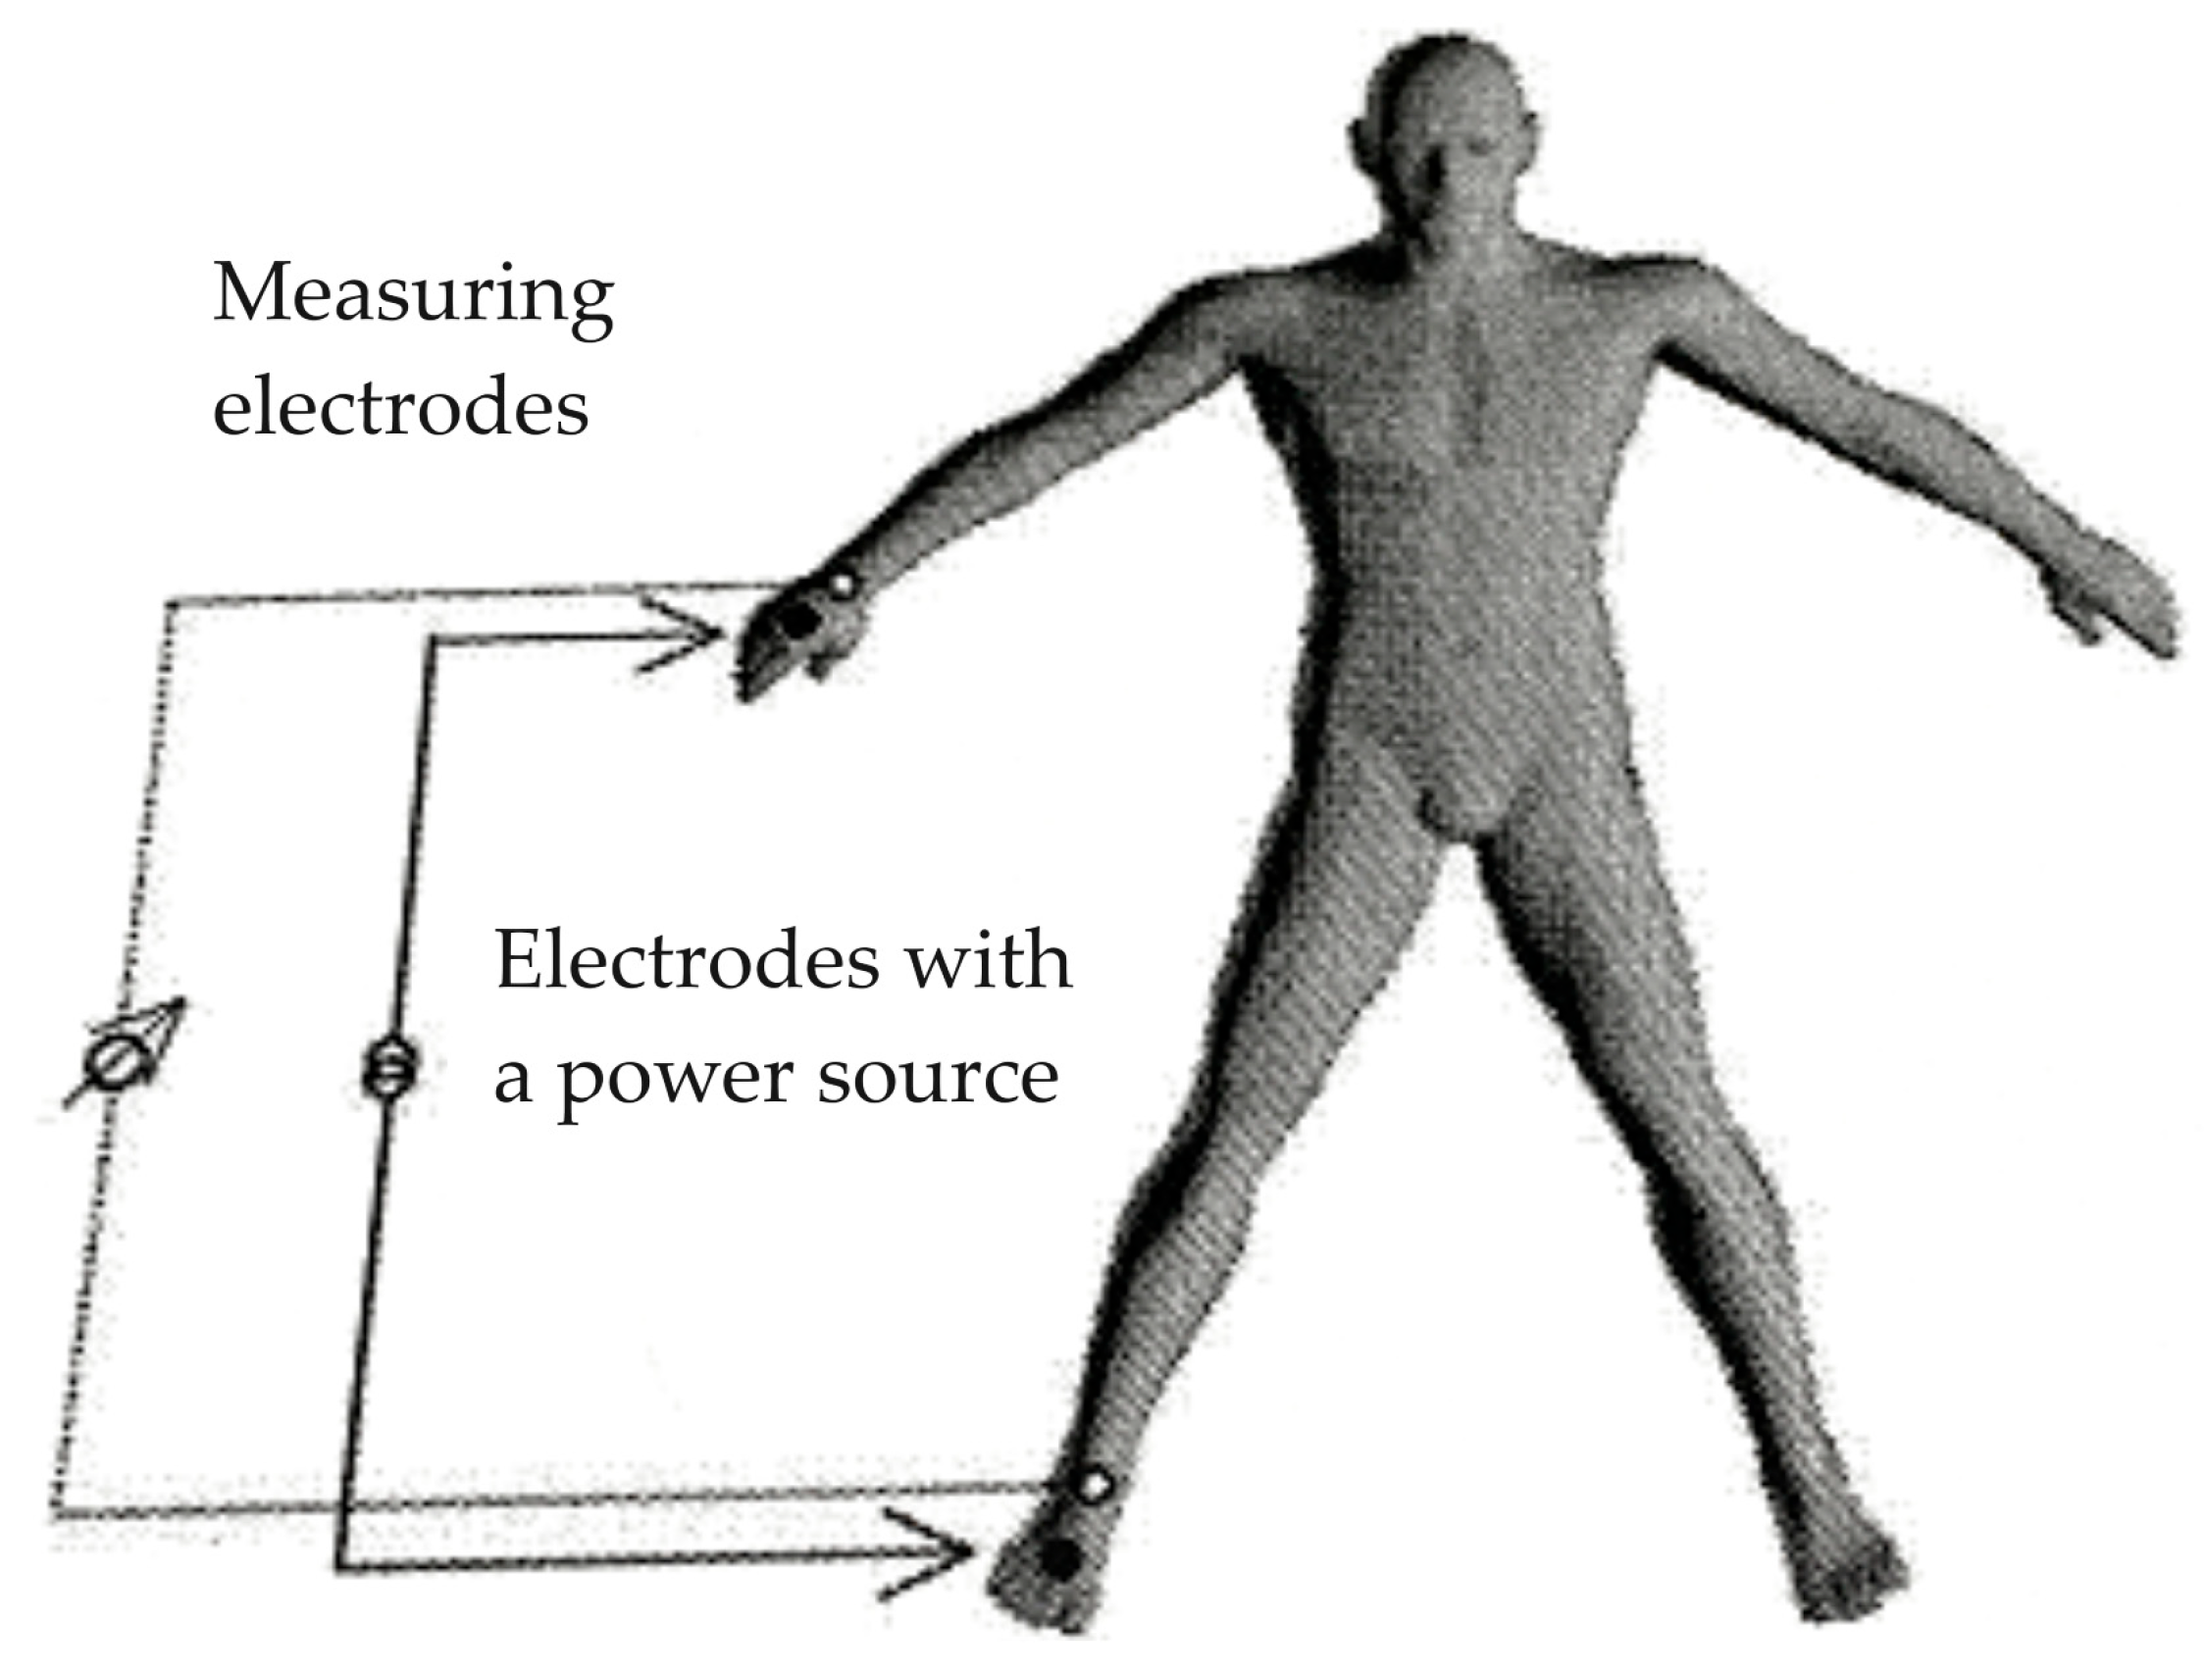
2.4. Electrical Bioimpedance Assessment
2.5. Statistical Analysis
3. Results
3.1. Characteristics of the Patients and Functional Tests
3.2. Electrical Bioimpedance Assessment
4. Discussion
5. Conclusions
Author Contributions
Funding
Institutional Review Board Statement
Informed Consent Statement
Data Availability Statement
Conflicts of Interest
References
- Jarecki, J.; Polkowska, I.; Kazimierczak, W.; Wójciak, M.; Sowa, I.; Dresler, S.; Blicharski, T. Assessment of the Impact of Physical Activity on the Musculoskeletal System in Early Degenerative Knee Joint Lesions in an Animal Model. Int. J. Mol. Sci. 2023, 24, 3540. [Google Scholar] [CrossRef]
- Jarecki, J.; Sobiech, M.; Turżańska, K.; Tomczyk-Warunek, A.; Jabłoński, M. A Kinesio Taping Method Applied in the Treatment of Postsurgical Knee Swelling after Primary Total Knee Arthroplasty. J. Clin. Med. 2021, 10, 2992. [Google Scholar] [CrossRef]
- Karpiński, R.; Krakowski, P.; Jonak, J.; Machrowska, A.; Maciejewski, M.; Nogalski, A. Diagnostics of Articular Cartilage Damage Based on Generated Acoustic Signals Using ANN—Part I: Femoral-Tibial Joint. Sensors 2022, 22, 2176. [Google Scholar] [CrossRef]
- Szponder, T.; Latalski, M.; Danielewicz, A.; Krać, K.; Kozera, A.; Drzewiecka, B.; Nguyen Ngoc, D.; Dobko, D.; Wessely-Szponder, J. Osteoarthritis: Pathogenesis, Animal Models, and New Regenerative Therapies. J. Clin. Med. 2022, 12, 5. [Google Scholar] [CrossRef]
- Ertürk, C.; Altay, M.A.; Sert, C.; Levent, A.; Yaptı, M.; Yüce, K. The Body Composition of Patients with Knee Osteoarthritis: Relationship with Clinical Parameters and Radiographic Severity. Aging Clin. Exp. Res. 2015, 27, 673–679. [Google Scholar] [CrossRef]
- Kiełbowski, K.; Herian, M.; Bakinowska, E.; Banach, B.; Sroczyński, T.; Pawlik, A. The Role of Genetics and Epigenetic Regulation in the Pathogenesis of Osteoarthritis. Int. J. Mol. Sci. 2023, 24, 11655. [Google Scholar] [CrossRef]
- Nur, H. The Relationship between Body Composition and Knee Osteoarthritis in Postmenopausal Women. Turk. J. Phys. Med. Rehabil. 2018, 64, 121–125. [Google Scholar] [CrossRef]
- Bennell, K.L.; Bowles, K.-A.; Wang, Y.; Cicuttini, F.; Davies-Tuck, M.; Hinman, R.S. Higher Dynamic Medial Knee Load Predicts Greater Cartilage Loss over 12 Months in Medial Knee Osteoarthritis. Ann. Rheum. Dis. 2011, 70, 1770–1774. [Google Scholar] [CrossRef]
- Hemmingsson, E.; Uddén, J.; Neovius, M. No Apparent Progress in Bioelectrical Impedance Accuracy: Validation Against Metabolic Risk and DXA. Obesity 2009, 17, 183–187. [Google Scholar] [CrossRef]
- Kahraman, A.; Hilsenbeck, J.; Nyga, M.; Ertle, J.; Wree, A.; Plauth, M.; Gerken, G.; Canbay, A.E. Bioelectrical Impedance Analysis in Clinical Practice: Implications for Hepatitis C Therapy BIA and Hepatitis C. Virol. J. 2010, 7, 191. [Google Scholar] [CrossRef]
- Kellgren, J.H.; Lawrence, J.S. Radiological Assessment of Osteo-Arthrosis. Ann. Rheum. Dis. 1957, 16, 494–502. [Google Scholar] [CrossRef]
- Jones, C.J.; Rikli, R.E.; Beam, W.C. A 30-s Chair-Stand Test as a Measure of Lower Body Strength in Community-Residing Older Adults. Res. Q. Exerc. Sport 1999, 70, 113–119. [Google Scholar] [CrossRef]
- Kyle, U. Bioelectrical Impedance Analysis? Part I: Review of Principles and Methods. Clin. Nutr. 2004, 23, 1226–1243. [Google Scholar] [CrossRef]
- Vina, E.R.; Kwoh, C.K. Epidemiology of Osteoarthritis: Literature Update. Curr. Opin. Rheumatol. 2018, 30, 160–167. [Google Scholar] [CrossRef]
- Azamar-Llamas, D.; Hernández-Molina, G.; Ramos-Ávalos, B.; Furuzawa-Carballeda, J. Adipokine Contribution to the Pathogenesis of Osteoarthritis. Mediat. Inflamm. 2017, 2017, 5468023. [Google Scholar] [CrossRef]
- Daghestani, H.N.; Kraus, V.B. Inflammatory Biomarkers in Osteoarthritis. Osteoarthr. Cartil. 2015, 23, 1890–1896. [Google Scholar] [CrossRef]
- Jarecki, J.; Małecka-Massalska, T.; Polkowska, I.; Potoczniak, B.; Kosior-Jarecka, E.; Szerb, I.; Tomaszewska, E.; Gutbier, M.; Dobrzyński, M.; Blicharski, T. Level of Adiponectin, Leptin and Selected Matrix Metalloproteinases in Female Overweight Patients with Primary Gonarthrosis. J. Clin. Med. 2021, 10, 1263. [Google Scholar] [CrossRef]
- Hu, P.; Bao, J.; Wu, L. The Emerging Role of Adipokines in Osteoarthritis: A Narrative Review. Mol. Biol. Rep. 2011, 38, 873–878. [Google Scholar] [CrossRef]
- Chang, J.; Liao, Z.; Lu, M.; Meng, T.; Han, W.; Ding, C. Systemic and Local Adipose Tissue in Knee Osteoarthritis. Osteoarthr. Cartil. 2018, 26, 864–871. [Google Scholar] [CrossRef]
- Collins, K.H.; Lenz, K.L.; Pollitt, E.N.; Ferguson, D.; Hutson, I.; Springer, L.E.; Oestreich, A.K.; Tang, R.; Choi, Y.-R.; Meyer, G.A.; et al. Adipose Tissue Is a Critical Regulator of Osteoarthritis. Proc. Natl. Acad. Sci. USA 2021, 118, e2021096118. [Google Scholar] [CrossRef]
- Thomas, S.; Browne, H.; Mobasheri, A.; Rayman, M.P. What Is the Evidence for a Role for Diet and Nutrition in Osteoarthritis? Rheumatology 2018, 57 (Suppl. S4), iv61–iv74. [Google Scholar] [CrossRef]
- Visser, A.W.; De Mutsert, R.; Le Cessie, S.; Den Heijer, M.; Rosendaal, F.R.; Kloppenburg, M. The Relative Contribution of Mechanical Stress and Systemic Processes in Different Types of Osteoarthritis: The NEO Study. Ann. Rheum. Dis. 2015, 74, 1842–1847. [Google Scholar] [CrossRef]
- Monira Hussain, S.; Wang, Y.; Cicuttini, F.M.; Simpson, J.A.; Giles, G.G.; Graves, S.; Wluka, A.E. Incidence of Total Knee and Hip Replacement for Osteoarthritis in Relation to the Metabolic Syndrome and Its Components: A Prospective Cohort Study. Semin. Arthritis Rheum. 2014, 43, 429–436. [Google Scholar] [CrossRef]
- Hart, D.J.; Doyle, D.V.; Spector, T.D. Association between Metabolic Factors and Knee Osteoarthritis in Women: The Chingford Study. J. Rheumatol. 1995, 22, 1118–1123. [Google Scholar]
- Tabas, I. Consequences of Cellular Cholesterol Accumulation: Basic Concepts and Physiological Implications. J. Clin. Investig. 2002, 110, 905–911. [Google Scholar] [CrossRef]
- Prasad, K.; Lee, P. Suppression of Oxidative Stress as a Mechanism of Reduction of Hypercholesterolemic Atherosclerosis by Aspirin. J. Cardiovasc. Pharmacol. Ther. 2003, 8, 61–69. [Google Scholar] [CrossRef]
- Cillero-Pastor, B.; Eijkel, G.; Kiss, A.; Blanco, F.J.; Heeren, R.M.A. Time-of-Flight Secondary Ion Mass Spectrometry-Based Molecular Distribution Distinguishing Healthy and Osteoarthritic Human Cartilage. Anal. Chem. 2012, 84, 8909–8916. [Google Scholar] [CrossRef]
- Tsezou, A.; Iliopoulos, D.; Malizos, K.N.; Simopoulou, T. Impaired Expression of Genes Regulating Cholesterol Efflux in Human Osteoarthritic Chondrocytes. J. Orthop. Res. 2010, 28, 1033–1039. [Google Scholar] [CrossRef]
- De Munter, W.; Van Der Kraan, P.M.; Van Den Berg, W.B.; Van Lent, P.L.E.M. High Systemic Levels of Low-Density Lipoprotein Cholesterol: Fuel to the Flames in Inflammatory Osteoarthritis? Rheumatology 2016, 55, 16–24. [Google Scholar] [CrossRef]
- Kadam, U.T.; Blagojevic, M.; Belcher, J. Statin Use and Clinical Osteoarthritis in the General Population: A Longitudinal Study. J. Gen. Intern. Med. 2013, 28, 943–949. [Google Scholar] [CrossRef]
- Davis, S.R.; Castelo-Branco, C.; Chedraui, P.; Lumsden, M.A.; Nappi, R.E.; Shah, D.; Villaseca, P.; as the Writing Group of the International Menopause Society for World Menopause Day 2012. Understanding Weight Gain at Menopause. Climacteric 2012, 15, 419–429. [Google Scholar] [CrossRef]
- Zuo, H.; Shi, Z.; Hu, X.; Wu, M.; Guo, Z.; Hussain, A. Prevalence of Metabolic Syndrome and Factors Associated with Its Components in Chinese Adults. Metabolism 2009, 58, 1102–1108. [Google Scholar] [CrossRef]
- Monteleone, P.; Mascagni, G.; Giannini, A.; Genazzani, A.R.; Simoncini, T. Symptoms of Menopause—Global Prevalence, Physiology and Implications. Nat. Rev. Endocrinol. 2018, 14, 199–215. [Google Scholar] [CrossRef]
- Marsh, M.L.; Oliveira, M.N.; Vieira-Potter, V.J. Adipocyte Metabolism and Health after the Menopause: The Role of Exercise. Nutrients 2023, 15, 444. [Google Scholar] [CrossRef]
- Brown, L.M.; Clegg, D.J. Central Effects of Estradiol in the Regulation of Food Intake, Body Weight, and Adiposity. J. Steroid Biochem. Mol. Biol. 2010, 122, 65–73. [Google Scholar] [CrossRef]
- Kuk, J.L.; Saunders, T.J.; Davidson, L.E.; Ross, R. Age-Related Changes in Total and Regional Fat Distribution. Ageing Res. Rev. 2009, 8, 339–348. [Google Scholar] [CrossRef]
- Pisoni, S.; Marrachelli, V.G.; Morales, J.M.; Maestrini, S.; Di Blasio, A.M.; Monleón, D. Sex Dimorphism in the Metabolome of Metabolic Syndrome in Morbidly Obese Individuals. Metabolites 2022, 12, 419. [Google Scholar] [CrossRef]
- Kapoor, E.; Collazo-Clavell, M.L.; Faubion, S.S. Weight Gain in Women at Midlife: A Concise Review of the Pathophysiology and Strategies for Management. Mayo Clin. Proc. 2017, 92, 1552–1558. [Google Scholar] [CrossRef]
- Torréns, J.I.; Sutton-Tyrrell, K.; Zhao, X.; Matthews, K.; Brockwell, S.; Sowers, M.; Santoro, N. Relative Androgen Excess during the Menopausal Transition Predicts Incident Metabolic Syndrome in Midlife Women: Study of Women’s Health across the Nation. Menopause 2009, 16, 257–264. [Google Scholar] [CrossRef]
- Funck-Brentano, T.; Nethander, M.; Movérare-Skrtic, S.; Richette, P.; Ohlsson, C. Causal Factors for Knee, Hip, and Hand Osteoarthritis: A Mendelian Randomization Study in the UK Biobank. Arthritis Rheumatol. 2019, 71, 1634–1641. [Google Scholar] [CrossRef]
- Lee, S.Y.; Ro, H.J.; Chung, S.G.; Kang, S.H.; Seo, K.M.; Kim, D.-K. Low Skeletal Muscle Mass in the Lower Limbs Is Independently Associated to Knee Osteoarthritis. PLoS ONE 2016, 11, e0166385. [Google Scholar] [CrossRef]
- Noehren, B.; Kosmac, K.; Walton, R.G.; Murach, K.A.; Lyles, M.F.; Loeser, R.F.; Peterson, C.A.; Messier, S.P. Alterations in Quadriceps Muscle Cellular and Molecular Properties in Adults with Moderate Knee Osteoarthritis. Osteoarthr. Cartil. 2018, 26, 1359–1368. [Google Scholar] [CrossRef]
- Rojas-Rodríguez, J.; Escobar-Linares, L.E.; Garcia-Carrasco, M.; Escárcega, R.O.; Fuentes-Alexandro, S.; Zamora-Ustaran, A. The Relationship between the Metabolic Syndrome and Energy-Utilization Deficit in the Pathogenesis of Obesity-Induced Osteoarthritis. Med. Hypotheses 2007, 69, 860–868. [Google Scholar] [CrossRef]
- Pisters, M.F.; Veenhof, C.; Van Dijk, G.M.; Dekker, J. Avoidance of Activity and Limitations in Activities in Patients with Osteoarthritis of the Hip or Knee: A 5 Year Follow-up Study on the Mediating Role of Reduced Muscle Strength. Osteoarthr. Cartil. 2014, 22, 171–177. [Google Scholar] [CrossRef]
- Rodosky, M.W.; Andriacchi, T.P.; Andersson, G.B.J. The Influence of Chair Height on Lower Limb Mechanics during Rising. J. Orthop. Res. 1989, 7, 266–271. [Google Scholar] [CrossRef]
- Turcot, K.; Armand, S.; Fritschy, D.; Hoffmeyer, P.; Suvà, D. Sit-to-Stand Alterations in Advanced Knee Osteoarthritis. Gait Posture 2012, 36, 68–72. [Google Scholar] [CrossRef]
- Su, F.C.; Lai, K.A.; Hong, W.H. Rising from Chair after Total Knee Arthroplasty. Clin. Biomech. 1998, 13, 176–181. [Google Scholar] [CrossRef]
- Petrella, M.; Selistre, L.F.A.; Serrão, P.R.M.S.; Lessi, G.C.; Gonçalves, G.H.; Mattiello, S.M. Kinetics, Kinematics, and Knee Muscle Activation during Sit to Stand Transition in Unilateral and Bilateral Knee Osteoarthritis. Gait Posture 2021, 86, 38–44. [Google Scholar] [CrossRef]
- Hooper, L.; Bunn, D.; Jimoh, F.O.; Fairweather-Tait, S.J. Water-Loss Dehydration and Aging. Mech. Ageing Dev. 2014, 136–137, 50–58. [Google Scholar] [CrossRef]
- Delbono, O. Expression and Regulation of Excitation-Contraction Coupling Proteins in Aging Skeletal Muscle. Curr. Aging Sci. 2011, 4, 248–259. [Google Scholar] [CrossRef]
- Ribeiro, S.M.L.; Kehayias, J.J. Sarcopenia and the Analysis of Body Composition. Adv. Nutr. 2014, 5, 260–267. [Google Scholar] [CrossRef]
- Keser, I.; Cvijetić, S.; Ilić, A.; Colić Barić, I.; Boschiero, D.; Ilich, J.Z. Assessment of Body Composition and Dietary Intake in Nursing-Home Residents: Could Lessons Learned from the COVID-19 Pandemic Be Used to Prevent Future Casualties in Older Individuals? Nutrients 2021, 13, 1510. [Google Scholar] [CrossRef]
- Mezhov, V.; Ciccutini, F.M.; Hanna, F.S.; Brennan, S.L.; Wang, Y.Y.; Urquhart, D.M.; Wluka, A.E. Does Obesity Affect Knee Cartilage? A Systematic Review of Magnetic Resonance Imaging Data: Obesity and Cartilage. Obes. Rev. 2014, 15, 143–157. [Google Scholar] [CrossRef]
- Sowers, M.F.; Yosef, M.; Jamadar, D.; Jacobson, J.; Karvonen-Gutierrez, C.; Jaffe, M. BMI vs. Body Composition and Radiographically Defined Osteoarthritis of the Knee in Women: A 4-Year Follow-up Study. Osteoarthr. Cartil. 2008, 16, 367–372. [Google Scholar] [CrossRef]
- Conroy, M.B.; Kwoh, C.K.; Krishnan, E.; Nevitt, M.C.; Boudreau, R.; Carbone, L.D.; Chen, H.; Harris, T.B.; Newman, A.B.; Goodpaster, B.H.; et al. Muscle Strength, Mass, and Quality in Older Men and Women with Knee Osteoarthritis. Arthritis Care Res. 2012, 64, 15–21. [Google Scholar] [CrossRef]
- Abbate, L.M.; Stevens, J.; Schwartz, T.A.; Renner, J.B.; Helmick, C.G.; Jordan, J.M. Anthropometric Measures, Body Composition, Body Fat Distribution, and Knee Osteoarthritis in Women*. Obesity 2006, 14, 1274–1281. [Google Scholar] [CrossRef]
- Davison, M.J.; Maly, M.R.; Adachi, J.D.; Noseworthy, M.D.; Beattie, K.A. Relationships between Fatty Infiltration in the Thigh and Calf in Women with Knee Osteoarthritis. Aging Clin. Exp. Res. 2017, 29, 291–299. [Google Scholar] [CrossRef]
- Visser, A.W.; De Mutsert, R.; Loef, M.; Le Cessie, S.; Den Heijer, M.; Bloem, J.L.; Reijnierse, M.; Rosendaal, F.R.; Kloppenburg, M. The Role of Fat Mass and Skeletal Muscle Mass in Knee Osteoarthritis Is Different for Men and Women: The NEO Study. Osteoarthr. Cartil. 2014, 22, 197–202. [Google Scholar] [CrossRef]
- Felson, D.T.; Zhang, Y.; Anthony, J.M.; Naimark, A.; Anderson, J.J. Weight Loss Reduces the Risk for Symptomatic Knee Osteoarthritis in Women: The Framingham Study. Ann. Intern. Med. 1992, 116, 535–539. [Google Scholar] [CrossRef]
- Toda, Y.; Toda, T.; Takemura, S.; Wada, T.; Morimoto, T.; Ogawa, R. Change in Body Fat, but Not Body Weight or Metabolic Correlates of Obesity, Is Related to Symptomatic Relief of Obese Patients with Knee Osteoarthritis after a Weight Control Program. J. Rheumatol. 1998, 25, 2181–2186. [Google Scholar]
- Henriksen, M.; Christensen, R.; Danneskiold-Samsøe, B.; Bliddal, H. Changes in Lower Extremity Muscle Mass and Muscle Strength after Weight Loss in Obese Patients with Knee Osteoarthritis: A Prospective Cohort Study. Arthritis Rheumatol. 2012, 64, 438–442. [Google Scholar] [CrossRef]
- Messier, S.P.; Resnik, A.E.; Beavers, D.P.; Mihalko, S.L.; Miller, G.D.; Nicklas, B.J.; deVita, P.; Hunter, D.J.; Lyles, M.F.; Eckstein, F.; et al. Intentional Weight Loss in Overweight and Obese Patients With Knee Osteoarthritis: Is More Better? Arthritis Care Res. 2018, 70, 1569–1575. [Google Scholar] [CrossRef]
- Beavers, D.P.; Beavers, K.M.; Loeser, R.F.; Walton, N.R.; Lyles, M.F.; Nicklas, B.J.; Shapses, S.A.; Newman, J.J.; Messier, S.P. The Independent and Combined Effects of Intensive Weight Loss and Exercise Training on Bone Mineral Density in Overweight and Obese Older Adults with Osteoarthritis. Osteoarthr. Cartil. 2014, 22, 726–733. [Google Scholar] [CrossRef]
- Vasan, S.K.; Karpe, F. Fat, yet Fit. Nat. Rev. Endocrinol. 2016, 12, 375–376. [Google Scholar] [CrossRef]
- Zamboni, M.; Mazzali, G.; Fantin, F.; Rossi, A.; Di Francesco, V. Sarcopenic Obesity: A New Category of Obesity in the Elderly. Nutr. Metab. Cardiovasc. Dis. 2008, 18, 388–395. [Google Scholar] [CrossRef]
- Vincent, H.K.; Heywood, K.; Connelly, J.; Hurley, R.W. Obesity and Weight Loss in the Treatment and Prevention of Osteoarthritis. PM&R 2012, 4, S59–S67. [Google Scholar] [CrossRef]
- Browning, R.C.; Kram, R. Effects of Obesity on the Biomechanics of Walking at Different Speeds. Med. Sci. Sports Exerc. 2007, 39, 1632–1641. [Google Scholar] [CrossRef]
- Vuolteenaho, K.; Koskinen, A.; Moilanen, E. Leptin—A Link between Obesity and Osteoarthritis. Applications for Prevention and Treatment. Basic Clin. Pharmacol. Toxicol. 2014, 114, 103–108. [Google Scholar] [CrossRef]
- Teichtahl, A.J.; Wluka, A.E.; Tanamas, S.K.; Wang, Y.; Strauss, B.J.; Proietto, J.; Dixon, J.B.; Jones, G.; Forbes, A.; Cicuttini, F.M. Weight Change and Change in Tibial Cartilage Volume and Symptoms in Obese Adults. Ann. Rheum. Dis. 2015, 74, 1024–1029. [Google Scholar] [CrossRef]

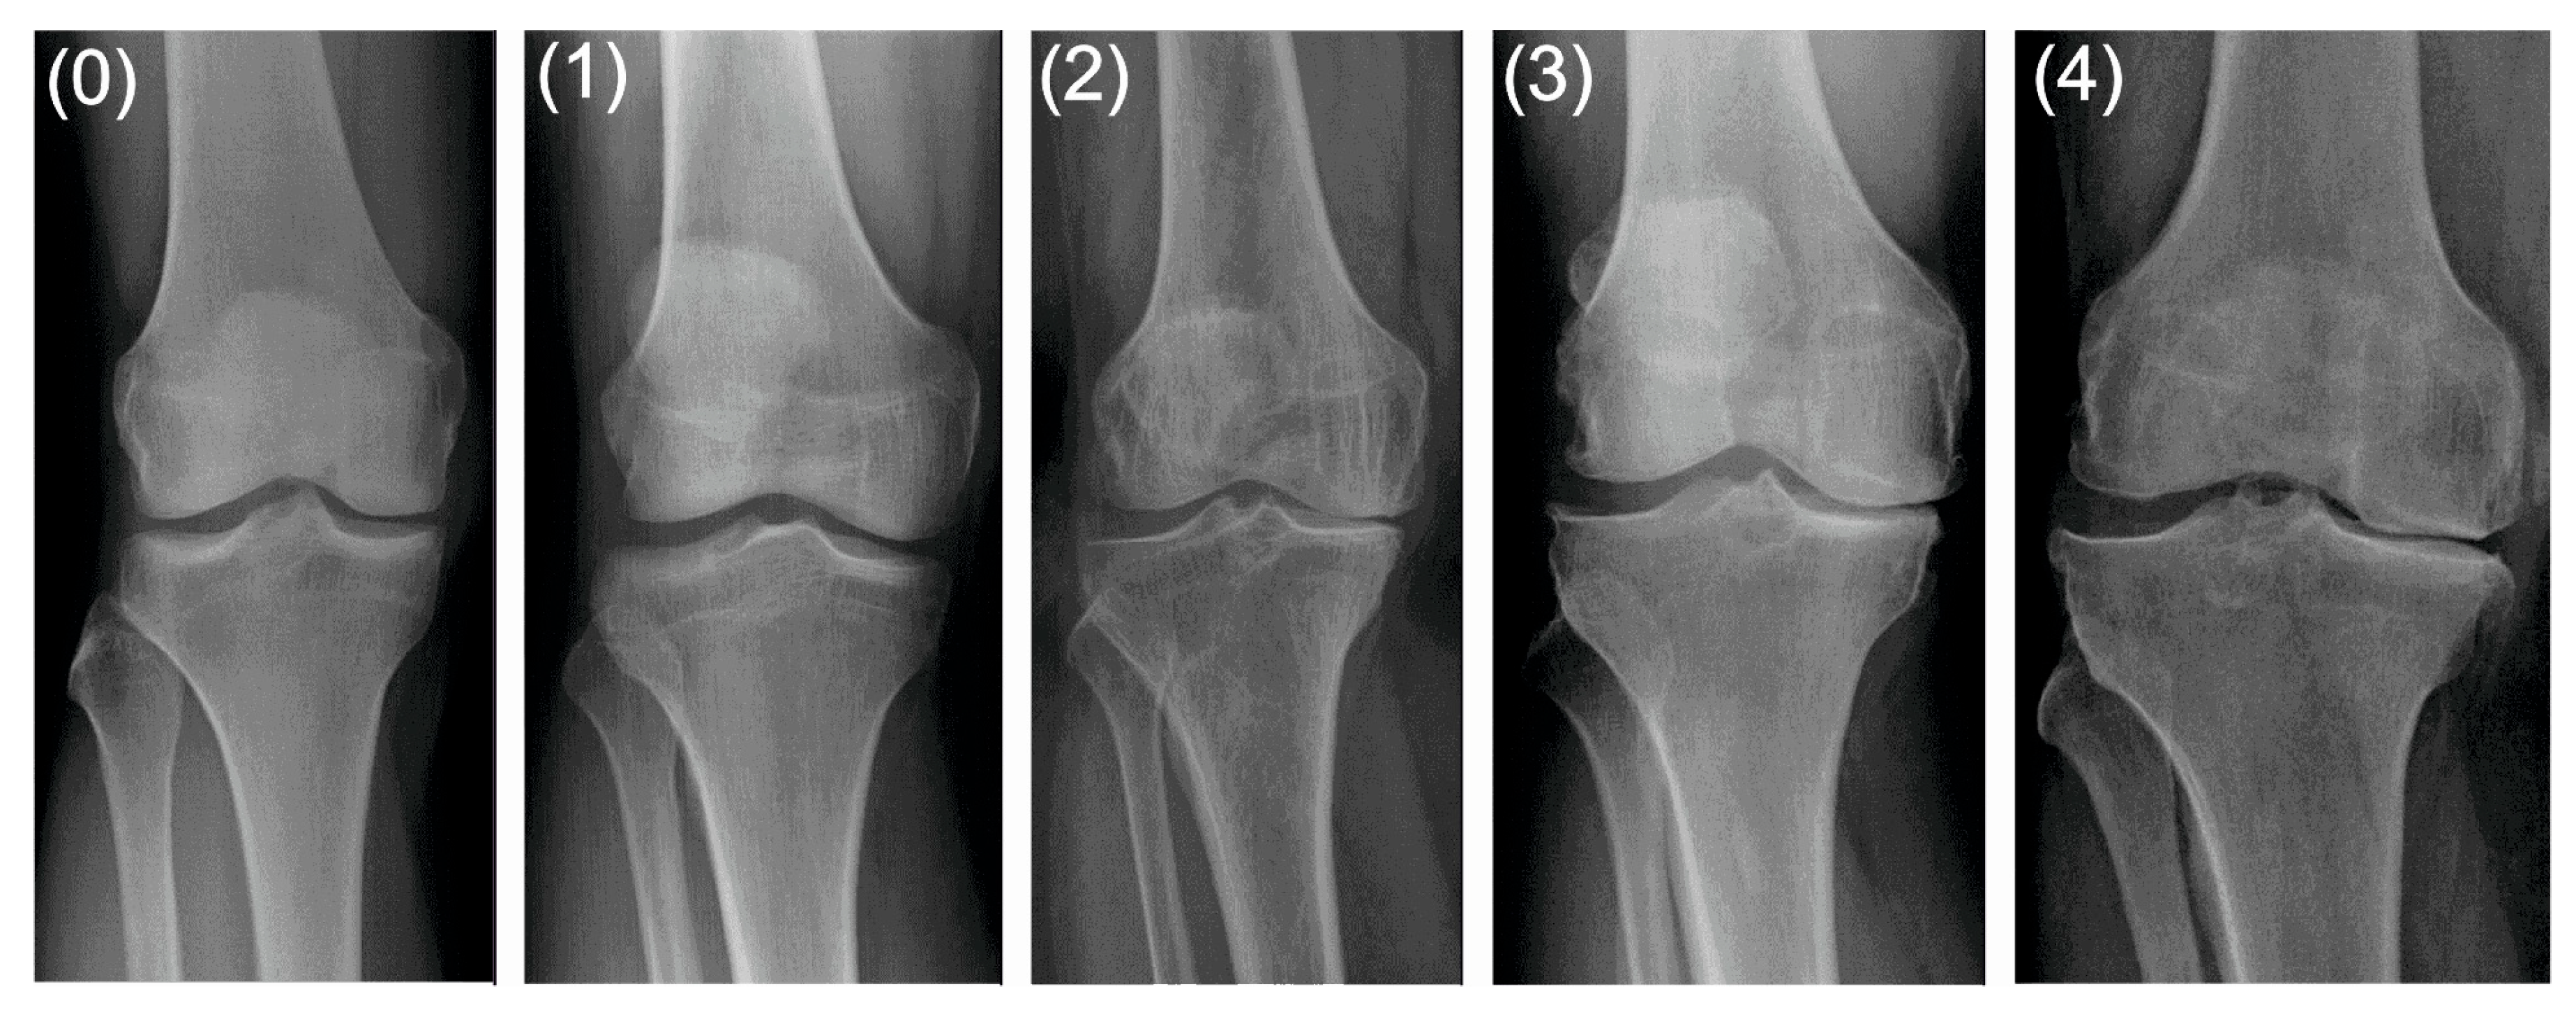
| grade 0 (none) | definite absence of X-ray changes of osteoarthritis |
| grade 1 (doubtful) | doubtful joint space narrowing and possible osteophytic lipping |
| grade 2 (minimal) | definite osteophytes and possible joint space narrowing |
| grade 3 (moderate) | moderate multiple osteophytes, definite narrowing of joint space and some sclerosis, and possible deformity of bone ends |
| grade 4 (severe) | large osteophytes, marked narrowing of joint space, severe sclerosis and definite deformity of bone ends. |
| Variable | Control n = 25 | KOA n = 58 | ||||||
|---|---|---|---|---|---|---|---|---|
| Mean | Minimum | Maximum | SD | Mean | Minimum | Maximum | SD | |
| age (years) | 50.8000 | 42.0000 | 60.0000 | 4.28174 | 68.7241 | 49.0000 | 84.0000 | 7.63370 |
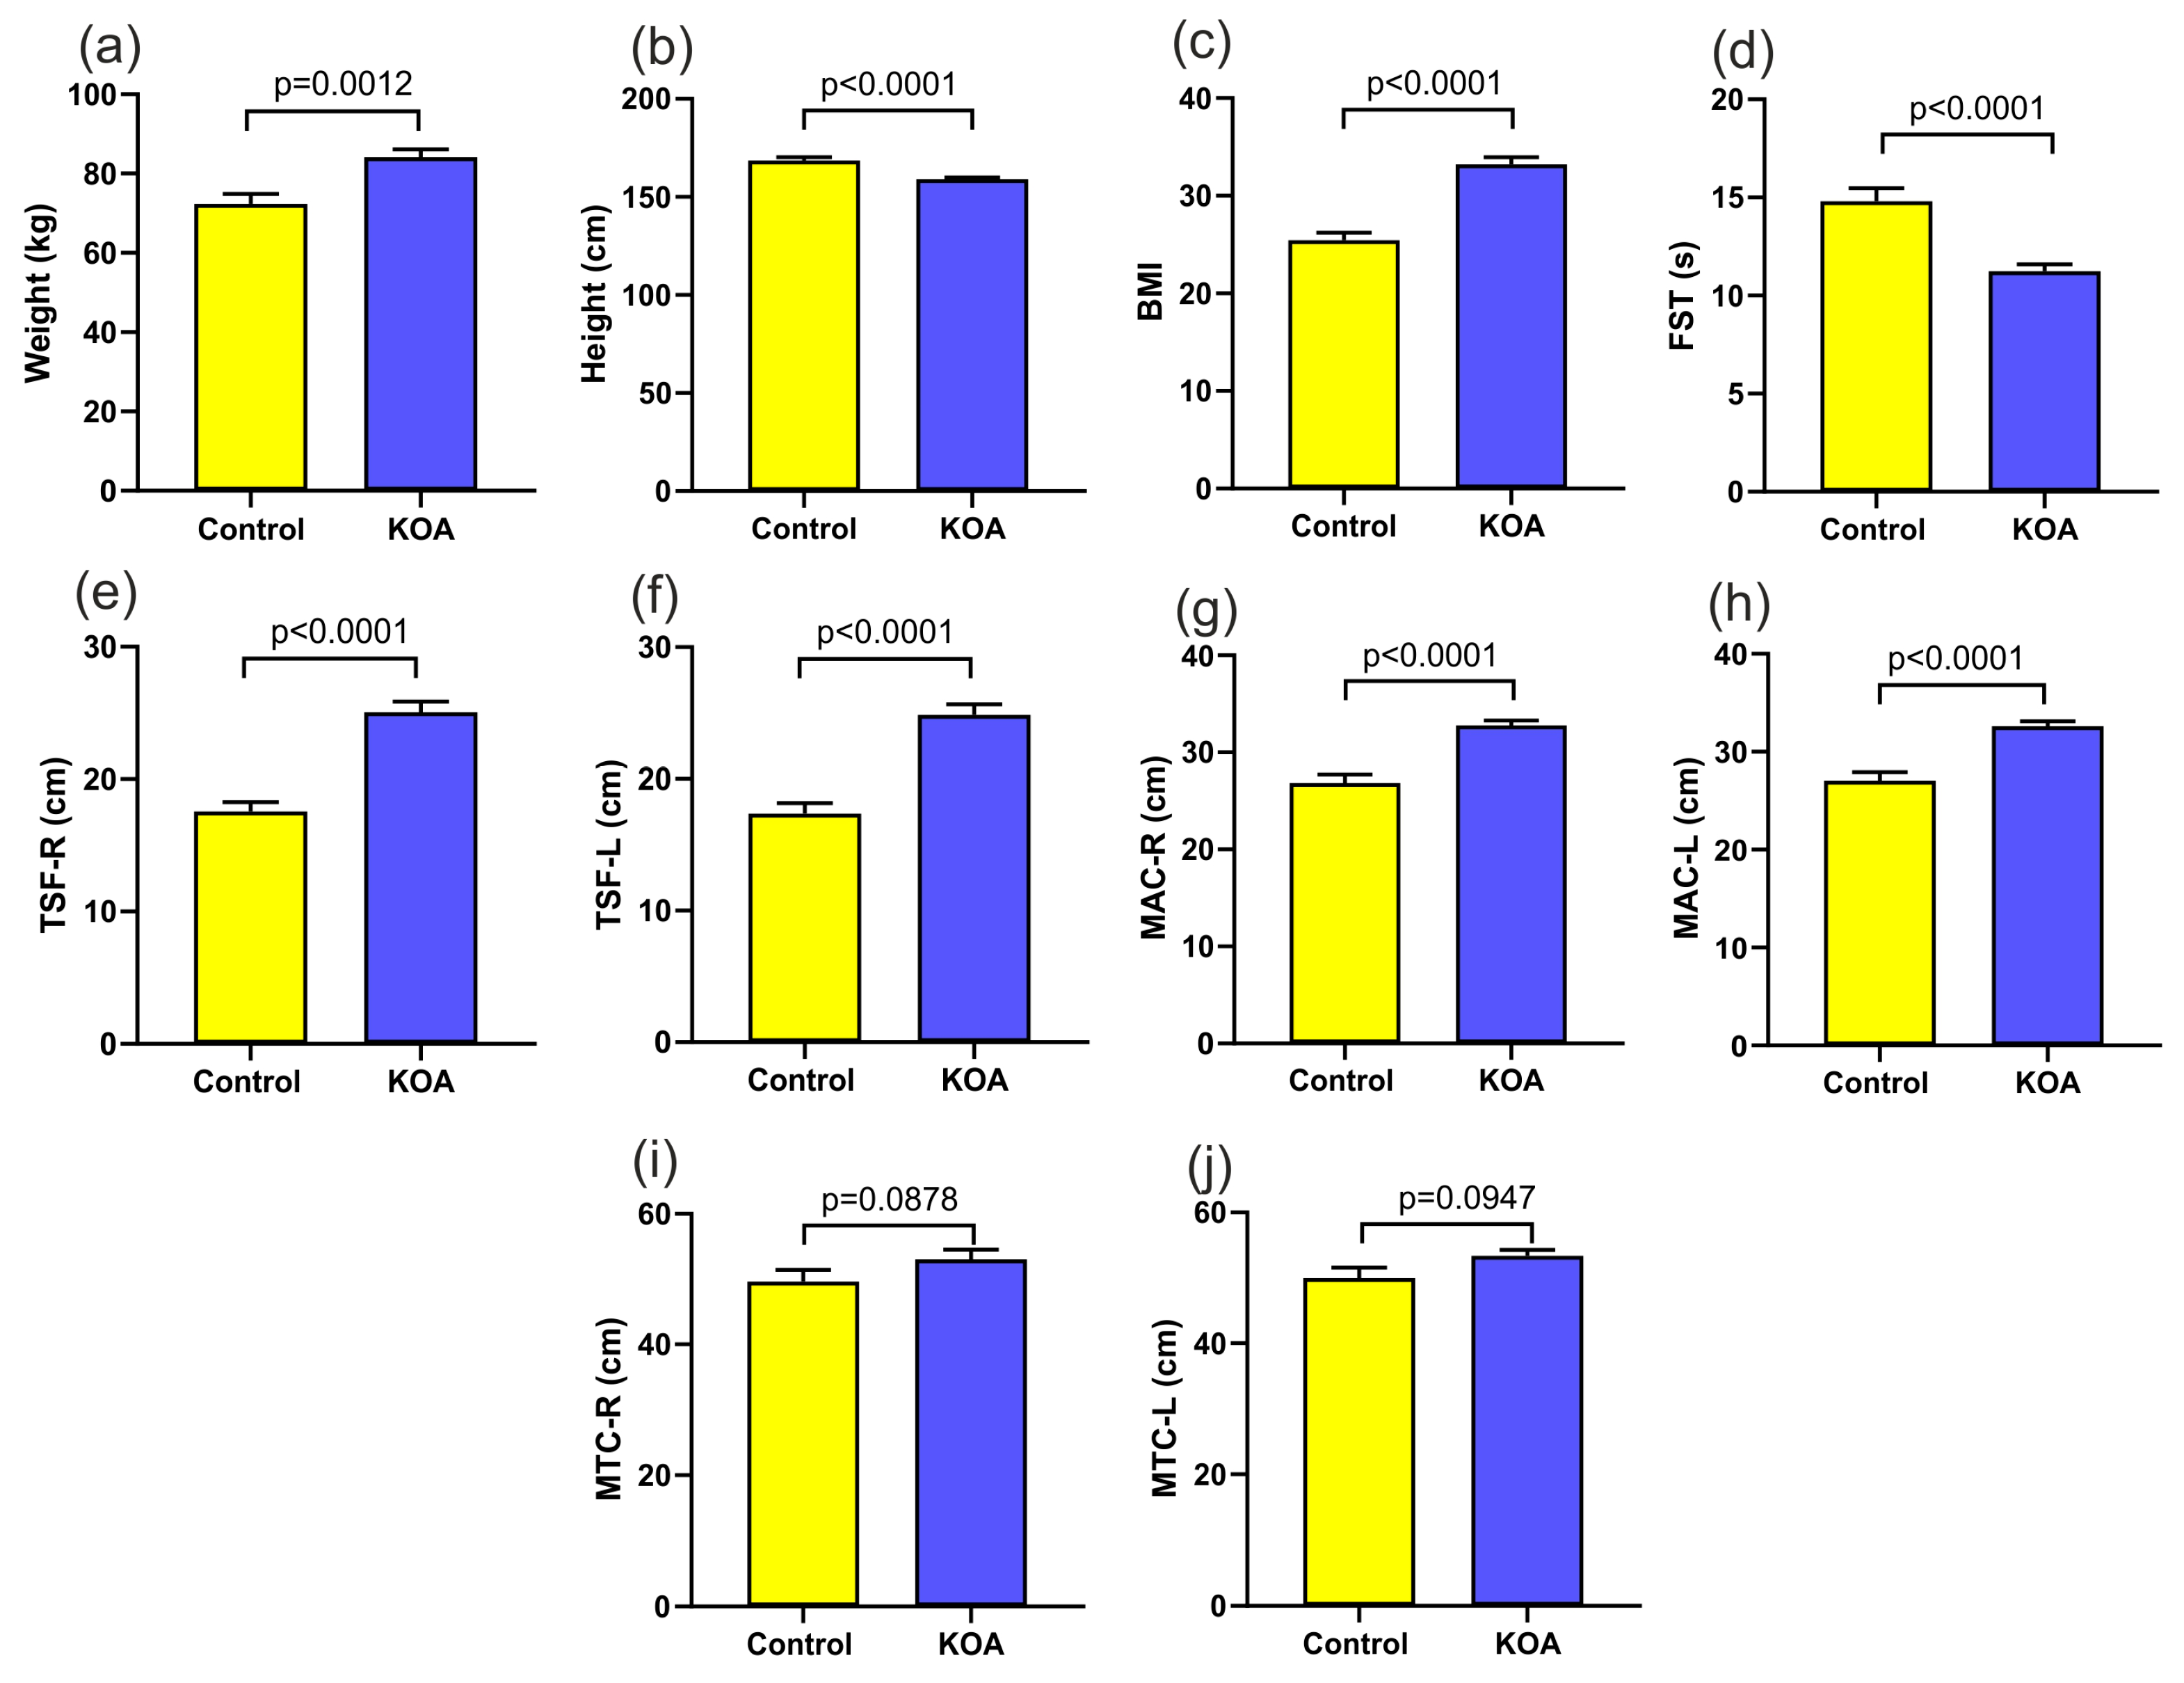
| body weight (kg) | 72.4000 | 52.0000 | 98.0000 | 12.52331 | 84.1379 | 53.0000 | 128.0000 | 15.39019 |
| height (cm) | 168.5200 | 150.0000 | 182.0000 | 8.87938 | 159.1034 | 147.0000 | 172.0000 | 5.86901 |
| BMI | 25.4564 | 20.2000 | 34.6400 | 3.82058 | 33.2153 | 21.2306 | 47.5907 | 5.70809 |
| 30 s sit-to-stand test | 14.8000 | 7.0000 | 20.0000 | 3.41565 | 11.2414 | 4.0000 | 16.0000 | 2.60438 |
| left triceps skin fold | 17.3600 | 11.0000 | 26.0000 | 3.99875 | 24.3448 | 10.0000 | 40.0000 | 6.45239 |
| right triceps skin fold | 17.5600 | 11.0000 | 24.0000 | 3.55996 | 24.5862 | 10.0000 | 38.0000 | 6.44010 |
| left arm circumference | 27.0400 | 21.0000 | 39.0000 | 4.42982 | 32.6207 | 23.0000 | 42.0000 | 3.88803 |
| right arm circumference | 26.8400 | 19.0000 | 38.0000 | 4.42229 | 32.7931 | 24.0000 | 43.0000 | 3.79639 |
| left thigh circumference | 49.9600 | 29.0000 | 60.0000 | 8.01810 | 52.6379 | 12.0000 | 89.0000 | 10.84289 |
| right thigh circumference | 49.6400 | 29.0000 | 65.0000 | 8.97626 | 53.0345 | 12.0000 | 89.0000 | 11.26704 |
| Variable | Control n = 25 | KOA n = 58 | |||||||
|---|---|---|---|---|---|---|---|---|---|
| Mean | Minimum | Maximum | SD | Mean | Minimum | Maximum | SD | p | |
| TBW (L) | 36.93346 | 26.19136 | 49.28473 | 5.67032 | 38.10232 | 26.19136 | 58.31367 | 6.16898 | 0.4199 |
| TBW (%) | 48.53787 | 36.55865 | 58.88215 | 5.97969 | 46.02176 | 34.35431 | 60.17147 | 5.74760 | 0.0743 |
| ECW (L) | 16.24664 | 11.05576 | 22.24771 | 2.54051 | 16.70618 | 11.05576 | 24.68876 | 2.47154 | 0.5555 |
| ECW (%) | 44.05256 | 36.26720 | 51.13032 | 3.16313 | 44.05635 | 35.75701 | 52.13185 | 3.40034 | 0.9962 |
| ICW (L) | 20.68682 | 15.13559 | 30.34301 | 3.57742 | 21.39613 | 14.60117 | 33.62491 | 4.15509 | 0.4646 |
| ICW (%) | 55.94744 | 48.86968 | 63.73280 | 3.16313 | 55.94365 | 47.86815 | 64.24300 | 3.40034 | 0.9962 |
| FM (kg) | 26.77406 | 13.91347 | 46.55254 | 10.15562 | 31.70627 | 12.45897 | 58.90535 | 10.37543 | 0.0489 * |
| FM (%) | 33.69143 | 19.55990 | 50.05649 | 8.16898 | 37.12874 | 17.79853 | 53.06788 | 7.85191 | 0.0244 * |
| FFM (kg) | 50.57554 | 35.78054 | 67.32887 | 7.89157 | 52.05235 | 35.78054 | 79.66349 | 8.42756 | 0.4457 |
| FFM (%) | 66.30857 | 49.94351 | 80.44010 | 8.16898 | 62.87126 | 46.93212 | 82.20147 | 7.85191 | 0.0746 |
| Variable | Control n = 25 | KOA n = 58 | |||||||
|---|---|---|---|---|---|---|---|---|---|
| Mean | Minimum | Maximum | SD | Mean | Minimum | Maximum | SD | p | |
| C membrane | 1.854 | 1.2365 | 4.111 | 0.6831 | 1.905 | 0.9029 | 6.085 | 0.9253 | 0.8061 |
| Z (5) | 542.568 | 410.3825 | 682.012 | 76.0506 | 551.540 | 388.2021 | 682.012 | 70.8498 | 0.6060 |
| phi (5) | 2.691 | 1.6245 | 4.932 | 0.8588 | 2.777 | 1.6245 | 5.228 | 0.7596 | 0.6494 |
| R5 | 541.989 | 410.1253 | 681.171 | 76.2156 | 550.831 | 387.8147 | 681.171 | 70.6674 | 0.6109 |
| Xc5 | 26.013 | 13.0737 | 56.190 | 10.8260 | 26.939 | 13.0737 | 56.190 | 8.8286 | 0.6838 |
| Z (50) | 480.946 | 371.0419 | 609,505 | 61.1055 | 486.395 | 344.3167 | 609.505 | 60.4426 | 0.7082 |
| phi (50) | 4.823 | 3.5952 | 7.724 | 0.9767 | 4.984 | 3.4007 | 7.944 | 0.9734 | 0.4895 |
| R50 | 479.527 | 354.8673 | 607.329 | 60.8928 | 484.494 | 342.8439 | 607.329 | 60.2713 | 0.7322 |
| Xc50 | 40.580 | 28.4855 | 69.314 | 10.3761 | 42.175 | 25.2161 | 69.314 | 9.3318 | 0.4918 |
| Z (100) | 459.260 | 354.7543 | 583.725 | 57.6525 | 463.829 | 327.5560 | 583.725 | 57.7581 | 0.7416 |
| phi (100) | 4.464 | 2.8827 | 7.171 | 0.8603 | 4.448 | 2.3019 | 8.191 | 1.0310 | 0.9455 |
| R100 | 457.813 | 353.7130 | 581.857 | 57.5310 | 462.358 | 326.3990 | 581.857 | 57.6929 | 0.7425 |
| Xc100 ohms | 35.673 | 21.2281 | 60.105 | 7.9104 | 35.813 | 16.4499 | 60.105 | 8.7250 | 0.9452 |
| Z (200) | 441.147 | 341.2459 | 562.079 | 55.9852 | 445,622 | 314.2859 | 562.079 | 56.2306 | 0.7399 |
| phi (200) | 2.718 | 0.1151 | 6.075 | 1.3409 | 2.558 | 0.1093 | 8.743 | 1.6813 | 0.6752 |
| R200 ohms | 440.537 | 340.8191 | 560.821 | 55.9809 | 444.975 | 313.6346 | 560.821 | 56.2907 | 0.7421 |
| Xc200 | 20.656 | 0.8208 | 48.060 | 10.5455 | 19.578 | 0.8208 | 56.785 | 12.7551 | 0.7117 |
| Z c | 488.040 | 369.9541 | 616.375 | 67.5612 | 495.728 | 348.5110 | 616.375 | 63.7676 | 0.6219 |
Disclaimer/Publisher’s Note: The statements, opinions and data contained in all publications are solely those of the individual author(s) and contributor(s) and not of MDPI and/or the editor(s). MDPI and/or the editor(s) disclaim responsibility for any injury to people or property resulting from any ideas, methods, instructions or products referred to in the content. |
© 2023 by the authors. Licensee MDPI, Basel, Switzerland. This article is an open access article distributed under the terms and conditions of the Creative Commons Attribution (CC BY) license (https://creativecommons.org/licenses/by/4.0/).
Share and Cite
Jarecki, J.; Potoczniak, B.; Dziedzic, A.; Małecka-Masalska, T.; Skrzypek, T.; Kazimierczak, W.; Skowronek, M.; Wójciak, M.; Dresler, S.; Waśko, M.; et al. Impact of the Body Composition on Knee Osteoarthritis Assessed Using Bioimpedance Analysis. J. Clin. Med. 2023, 12, 7037. https://doi.org/10.3390/jcm12227037
Jarecki J, Potoczniak B, Dziedzic A, Małecka-Masalska T, Skrzypek T, Kazimierczak W, Skowronek M, Wójciak M, Dresler S, Waśko M, et al. Impact of the Body Composition on Knee Osteoarthritis Assessed Using Bioimpedance Analysis. Journal of Clinical Medicine. 2023; 12(22):7037. https://doi.org/10.3390/jcm12227037
Chicago/Turabian StyleJarecki, Jaromir, Bartosz Potoczniak, Artur Dziedzic, Teresa Małecka-Masalska, Tomasz Skrzypek, Waldemar Kazimierczak, Marcin Skowronek, Magdalena Wójciak, Sławomir Dresler, Marcin Waśko, and et al. 2023. "Impact of the Body Composition on Knee Osteoarthritis Assessed Using Bioimpedance Analysis" Journal of Clinical Medicine 12, no. 22: 7037. https://doi.org/10.3390/jcm12227037
APA StyleJarecki, J., Potoczniak, B., Dziedzic, A., Małecka-Masalska, T., Skrzypek, T., Kazimierczak, W., Skowronek, M., Wójciak, M., Dresler, S., Waśko, M., & Sowa, I. (2023). Impact of the Body Composition on Knee Osteoarthritis Assessed Using Bioimpedance Analysis. Journal of Clinical Medicine, 12(22), 7037. https://doi.org/10.3390/jcm12227037