


Structural and Functional Retinal Changes in Patients with Mild Cognitive Impairment with and without Diabetes


 , ,
, ,
Abstract
:1. Introduction
2. Materials and Methods
2.1. Statistical Analyses
2.2. Ethical Considerations
3. Results
3.1. Demographic and Questionnaire Data
3.2. Visual Acuity Data
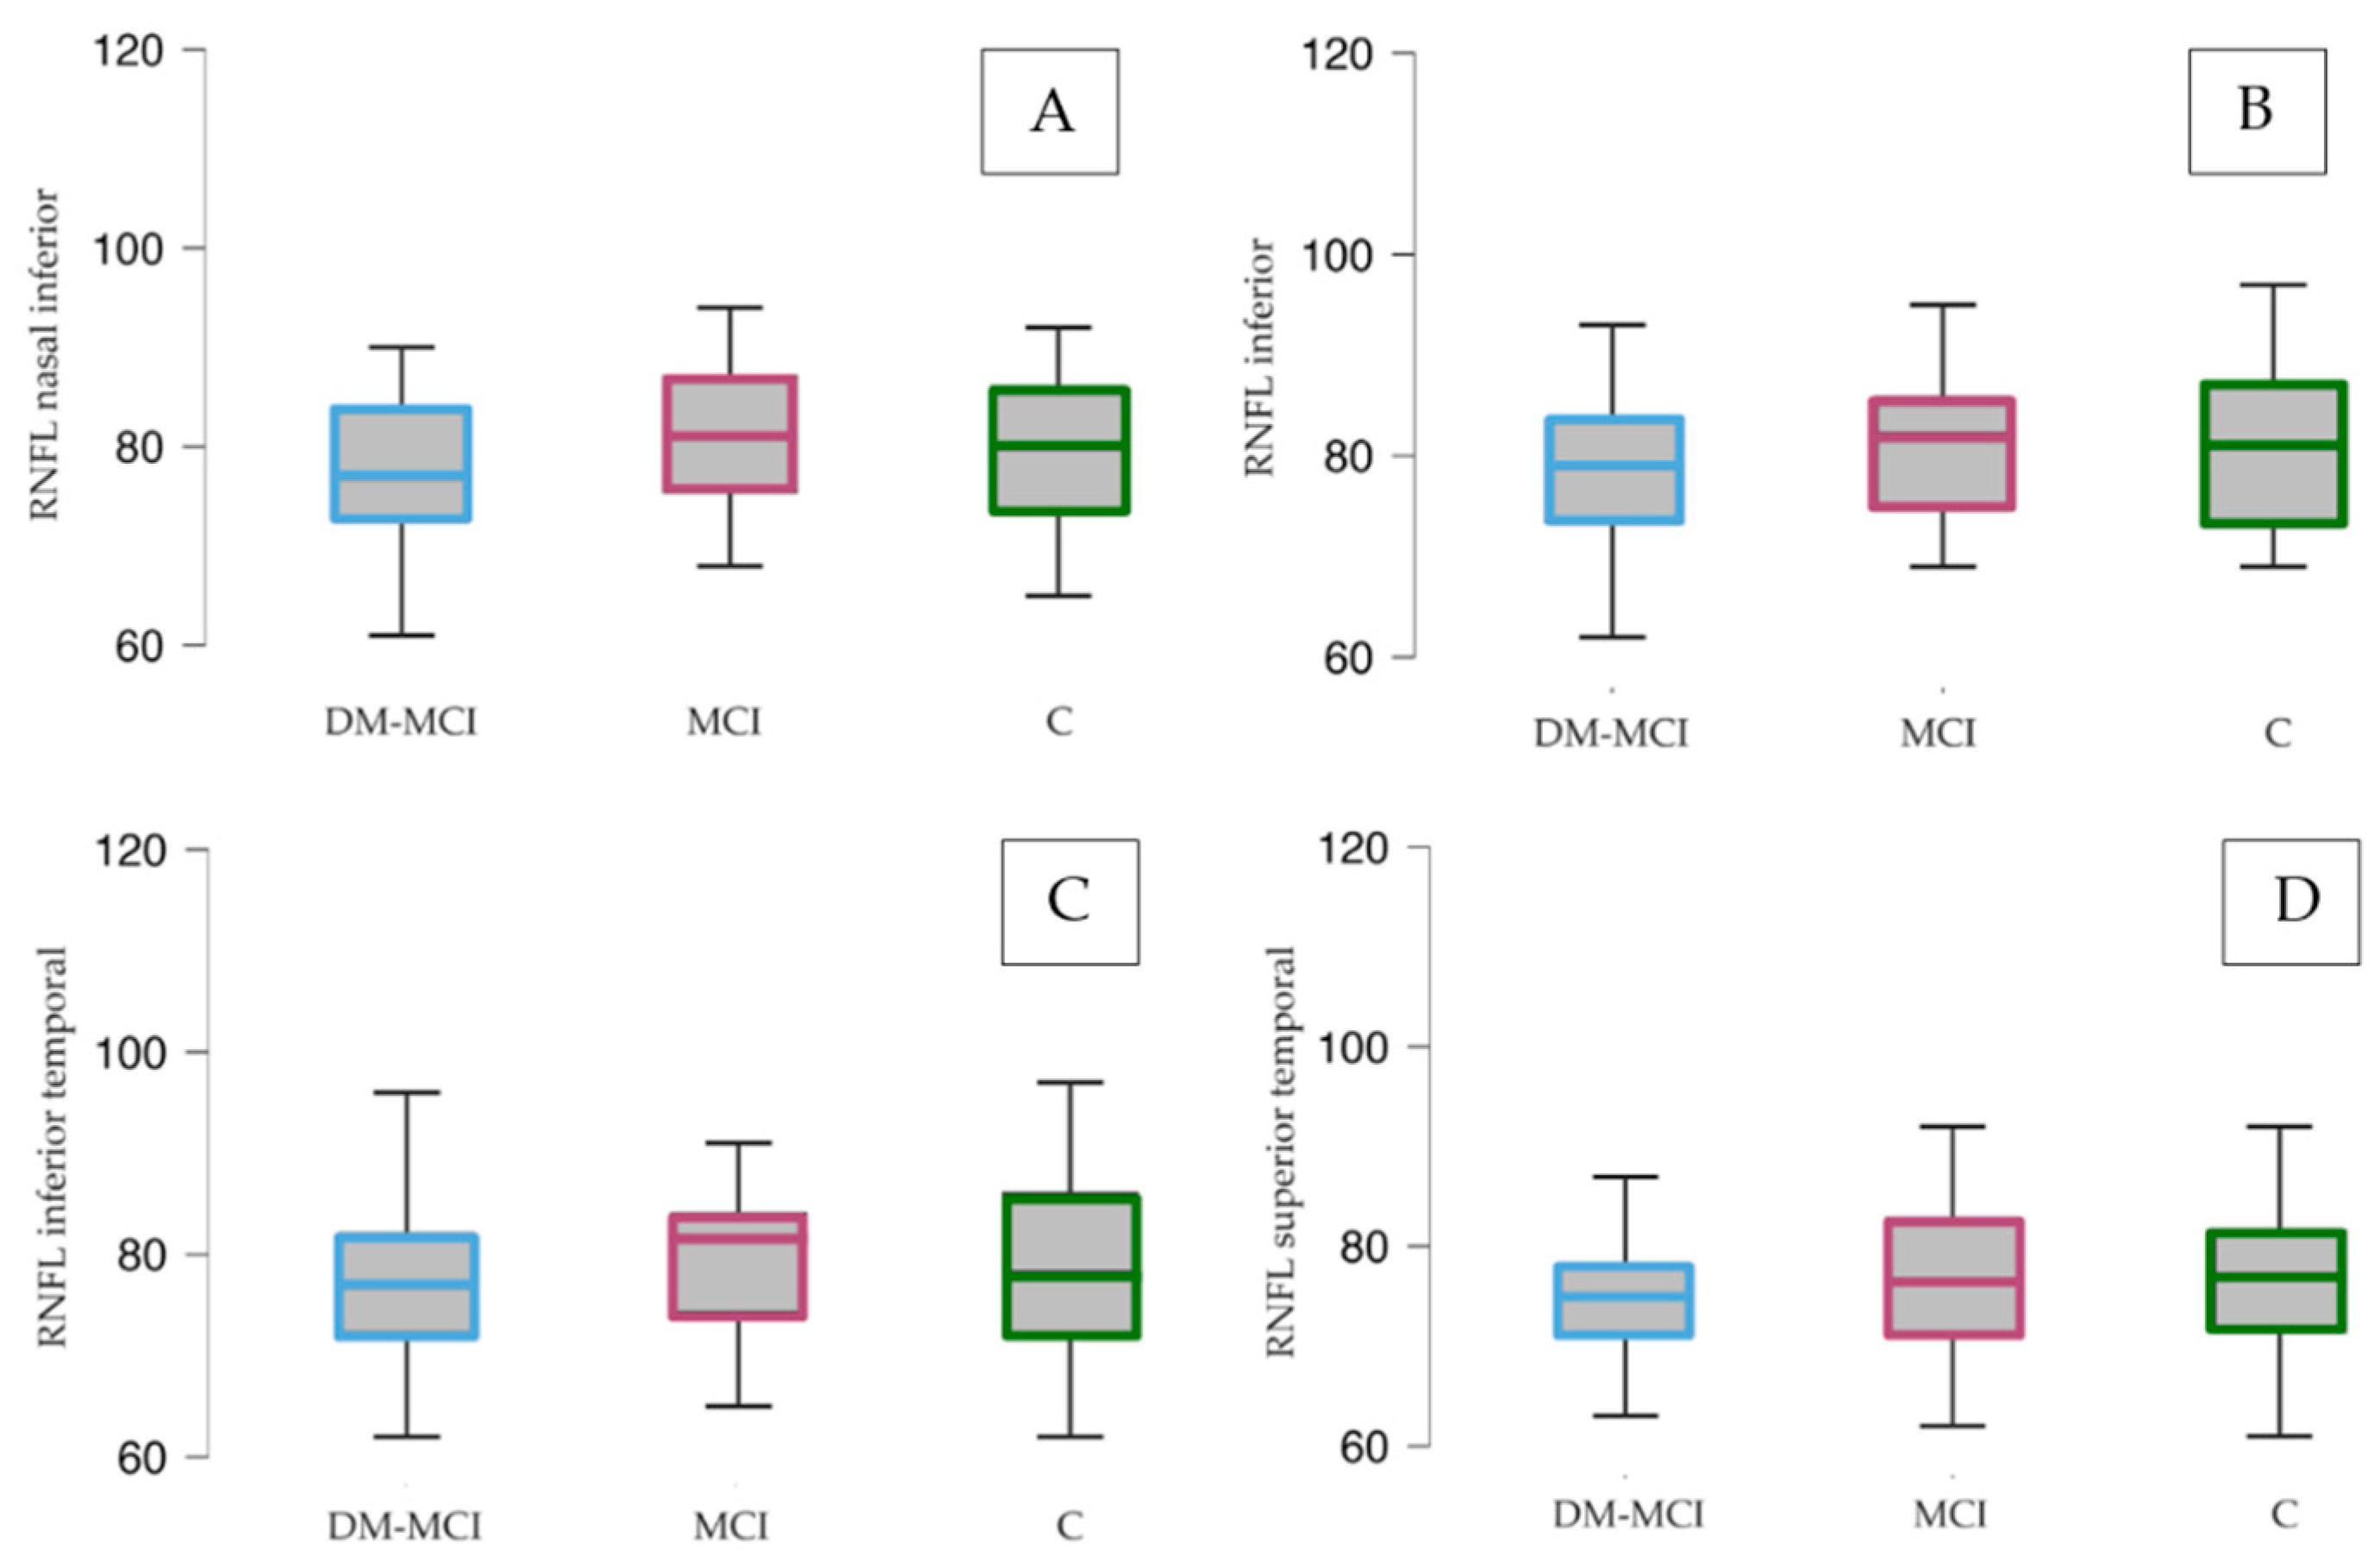
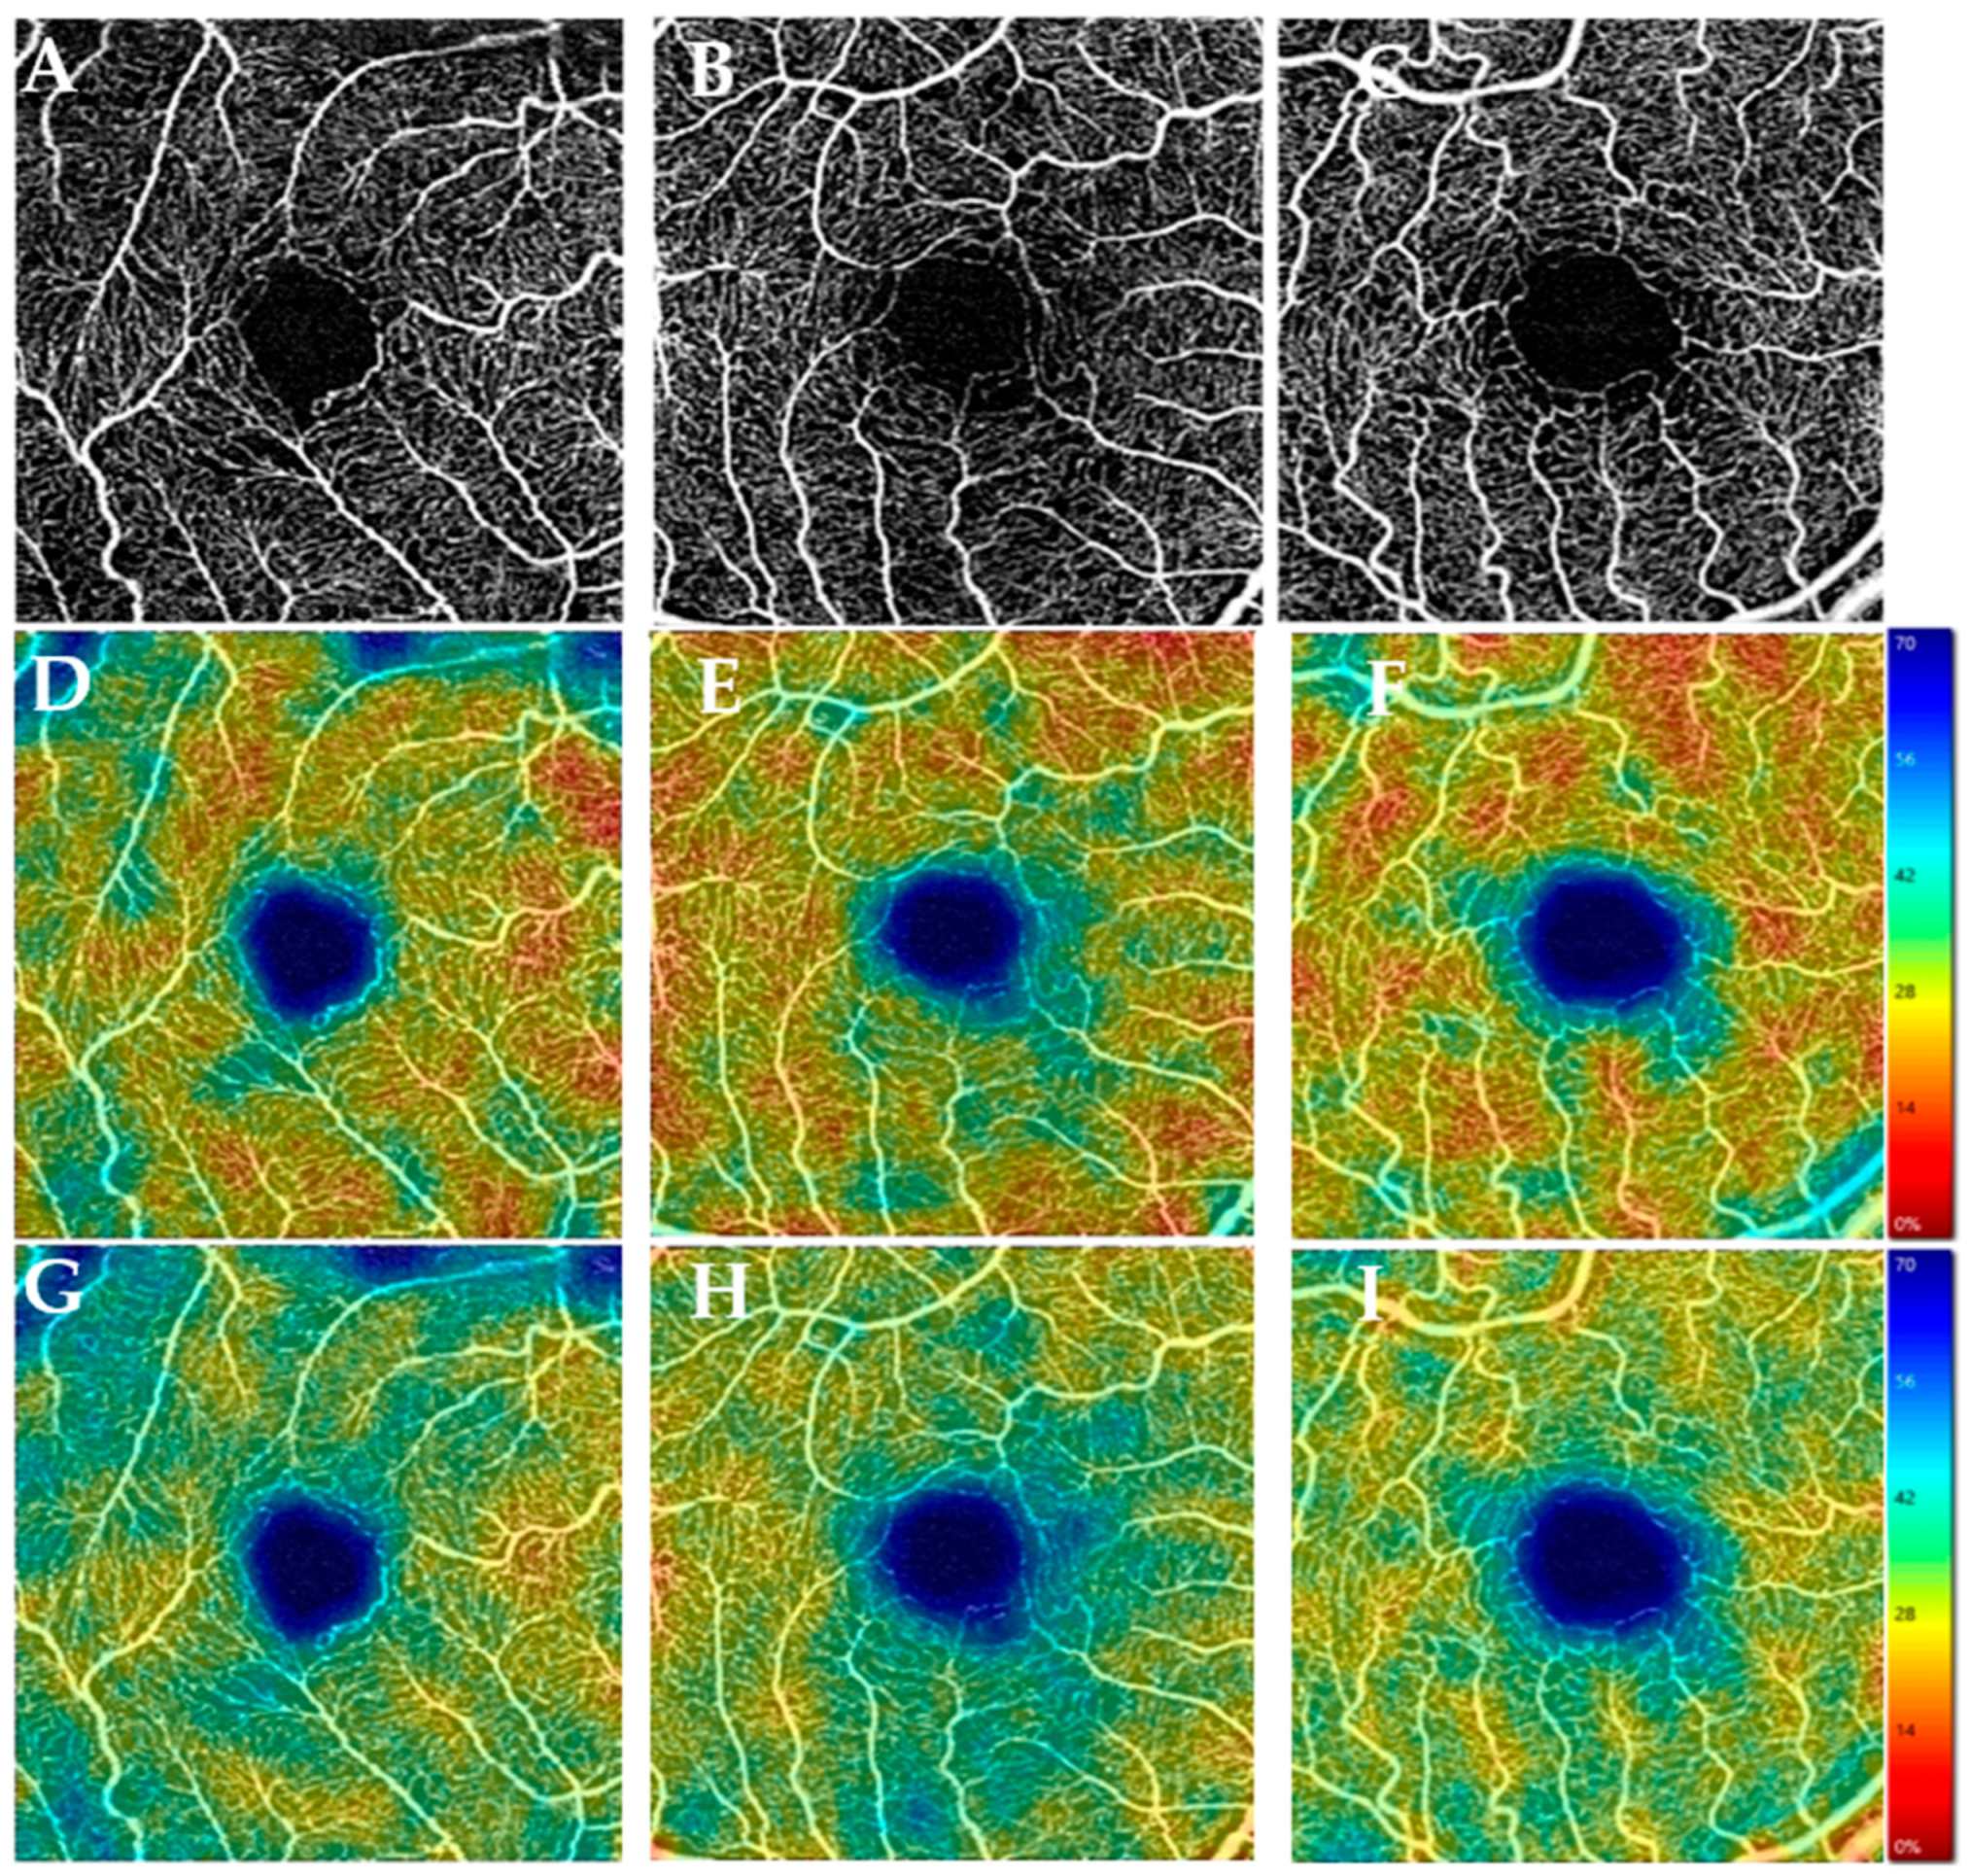
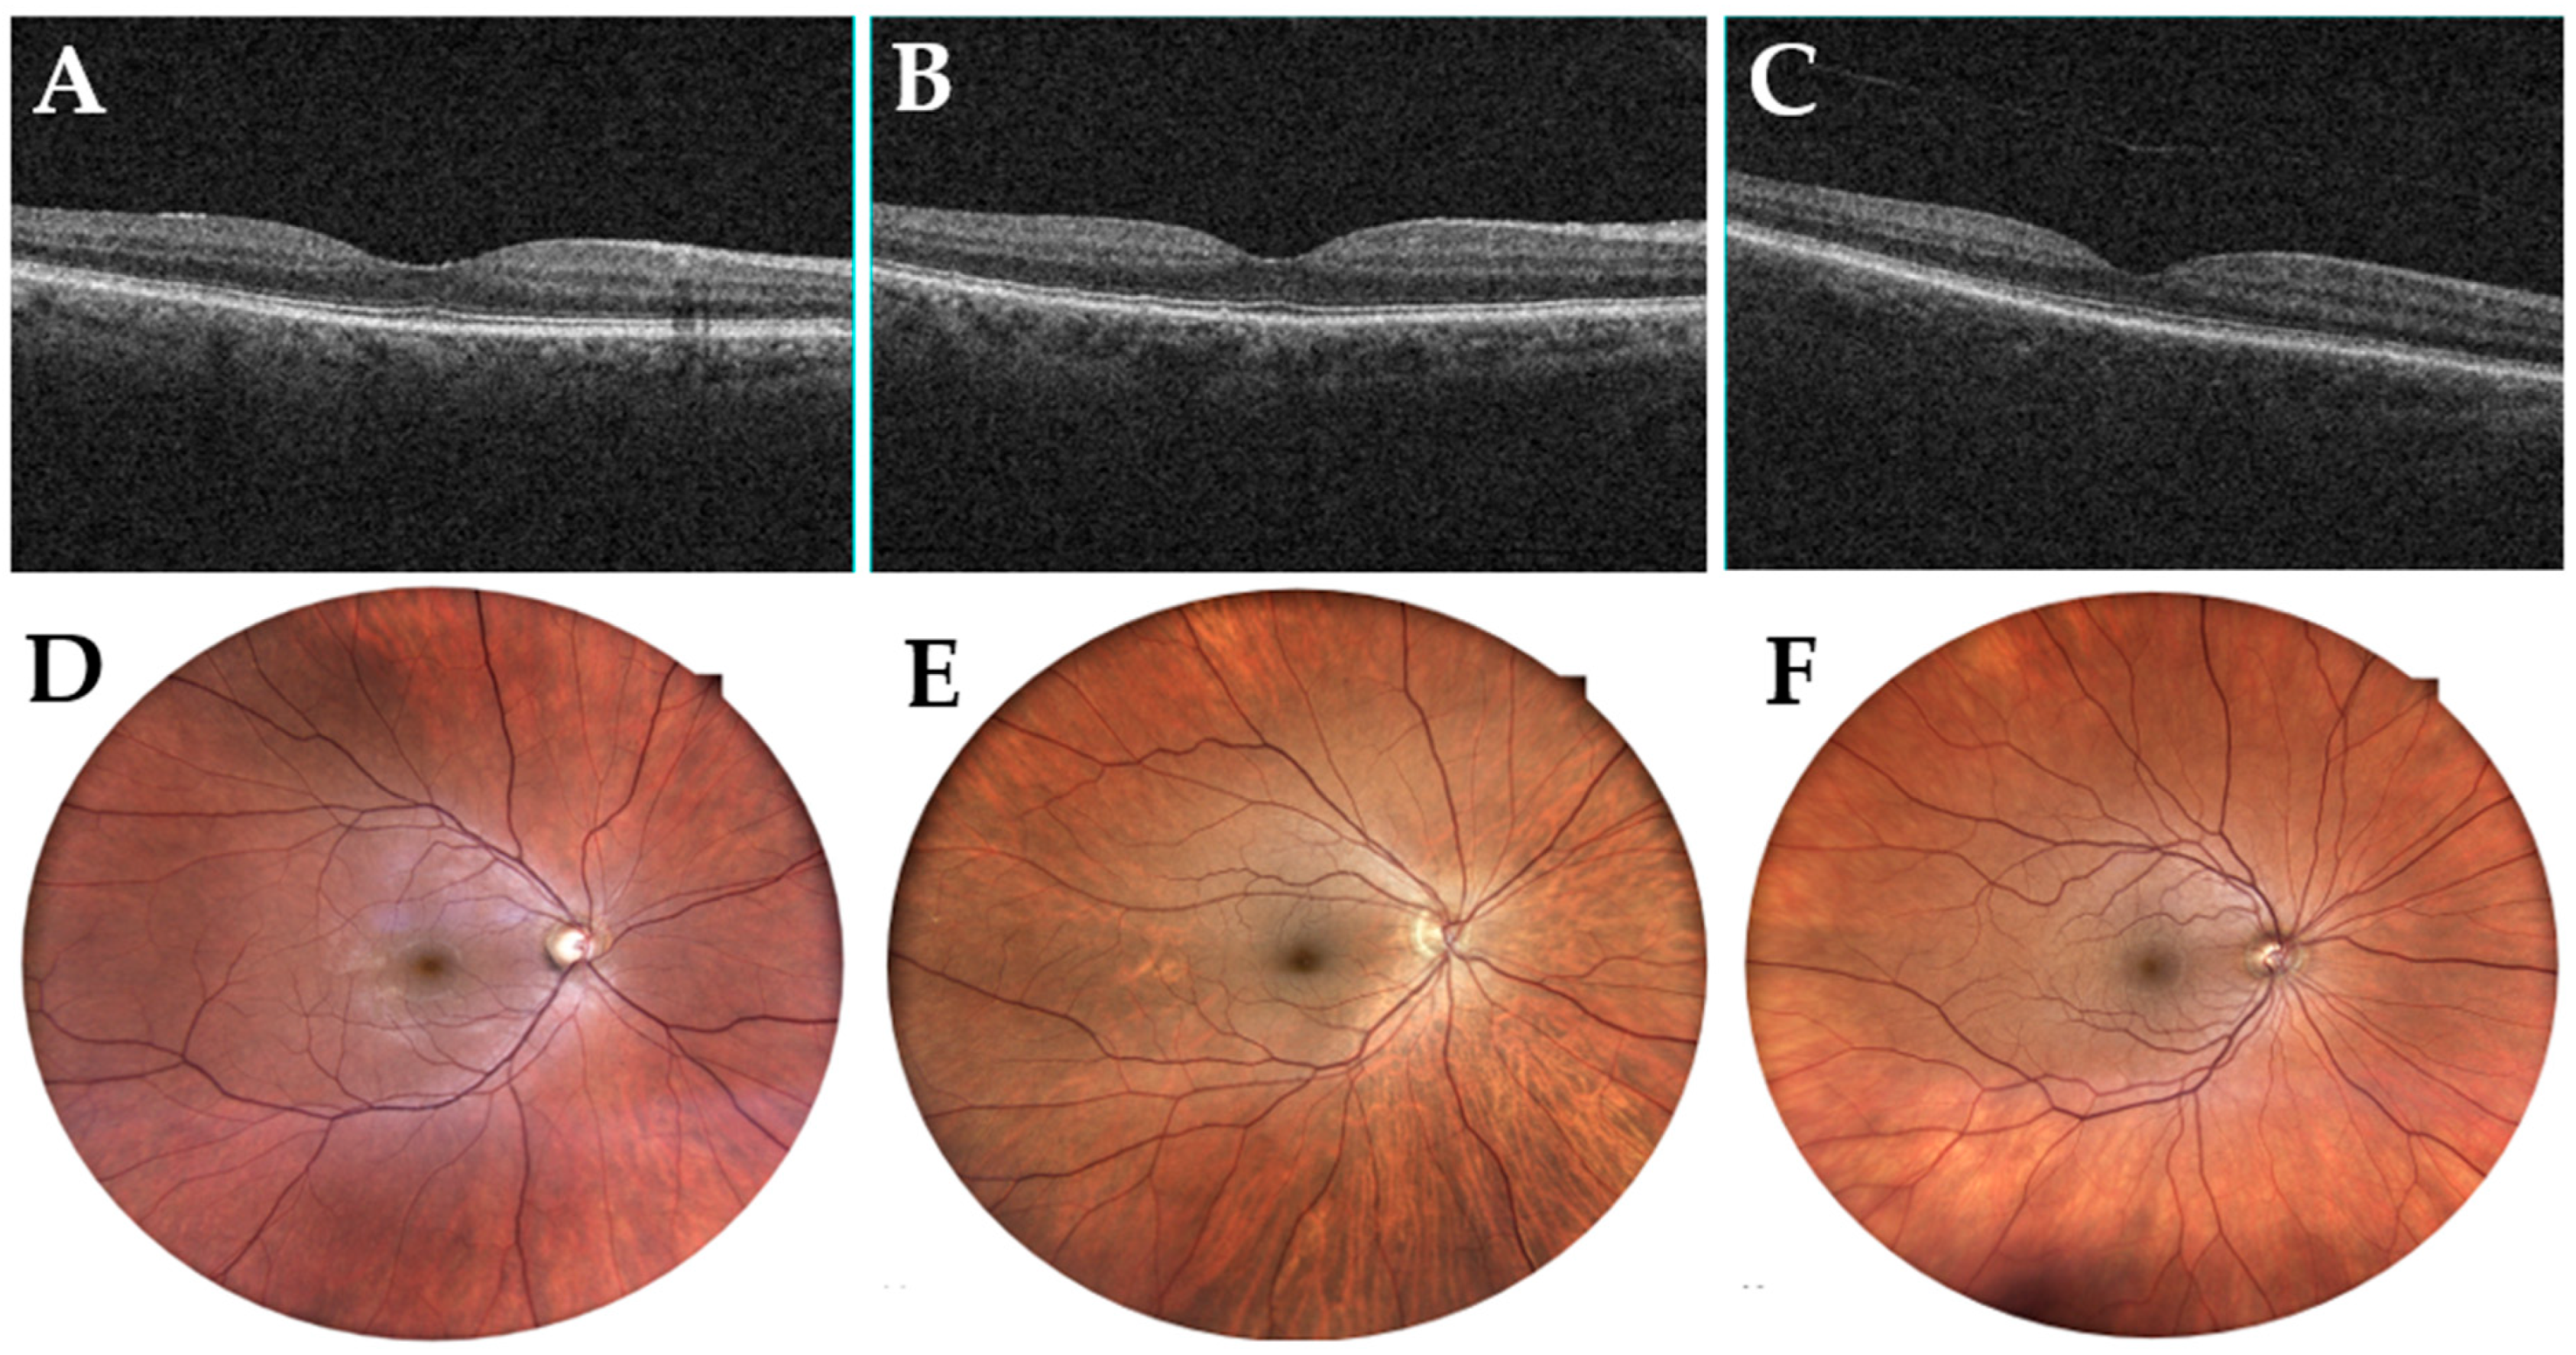
3.3. Optical Coherence Tomography Angiography Data (OCT-A)
3.3.1. Vascular Parameters
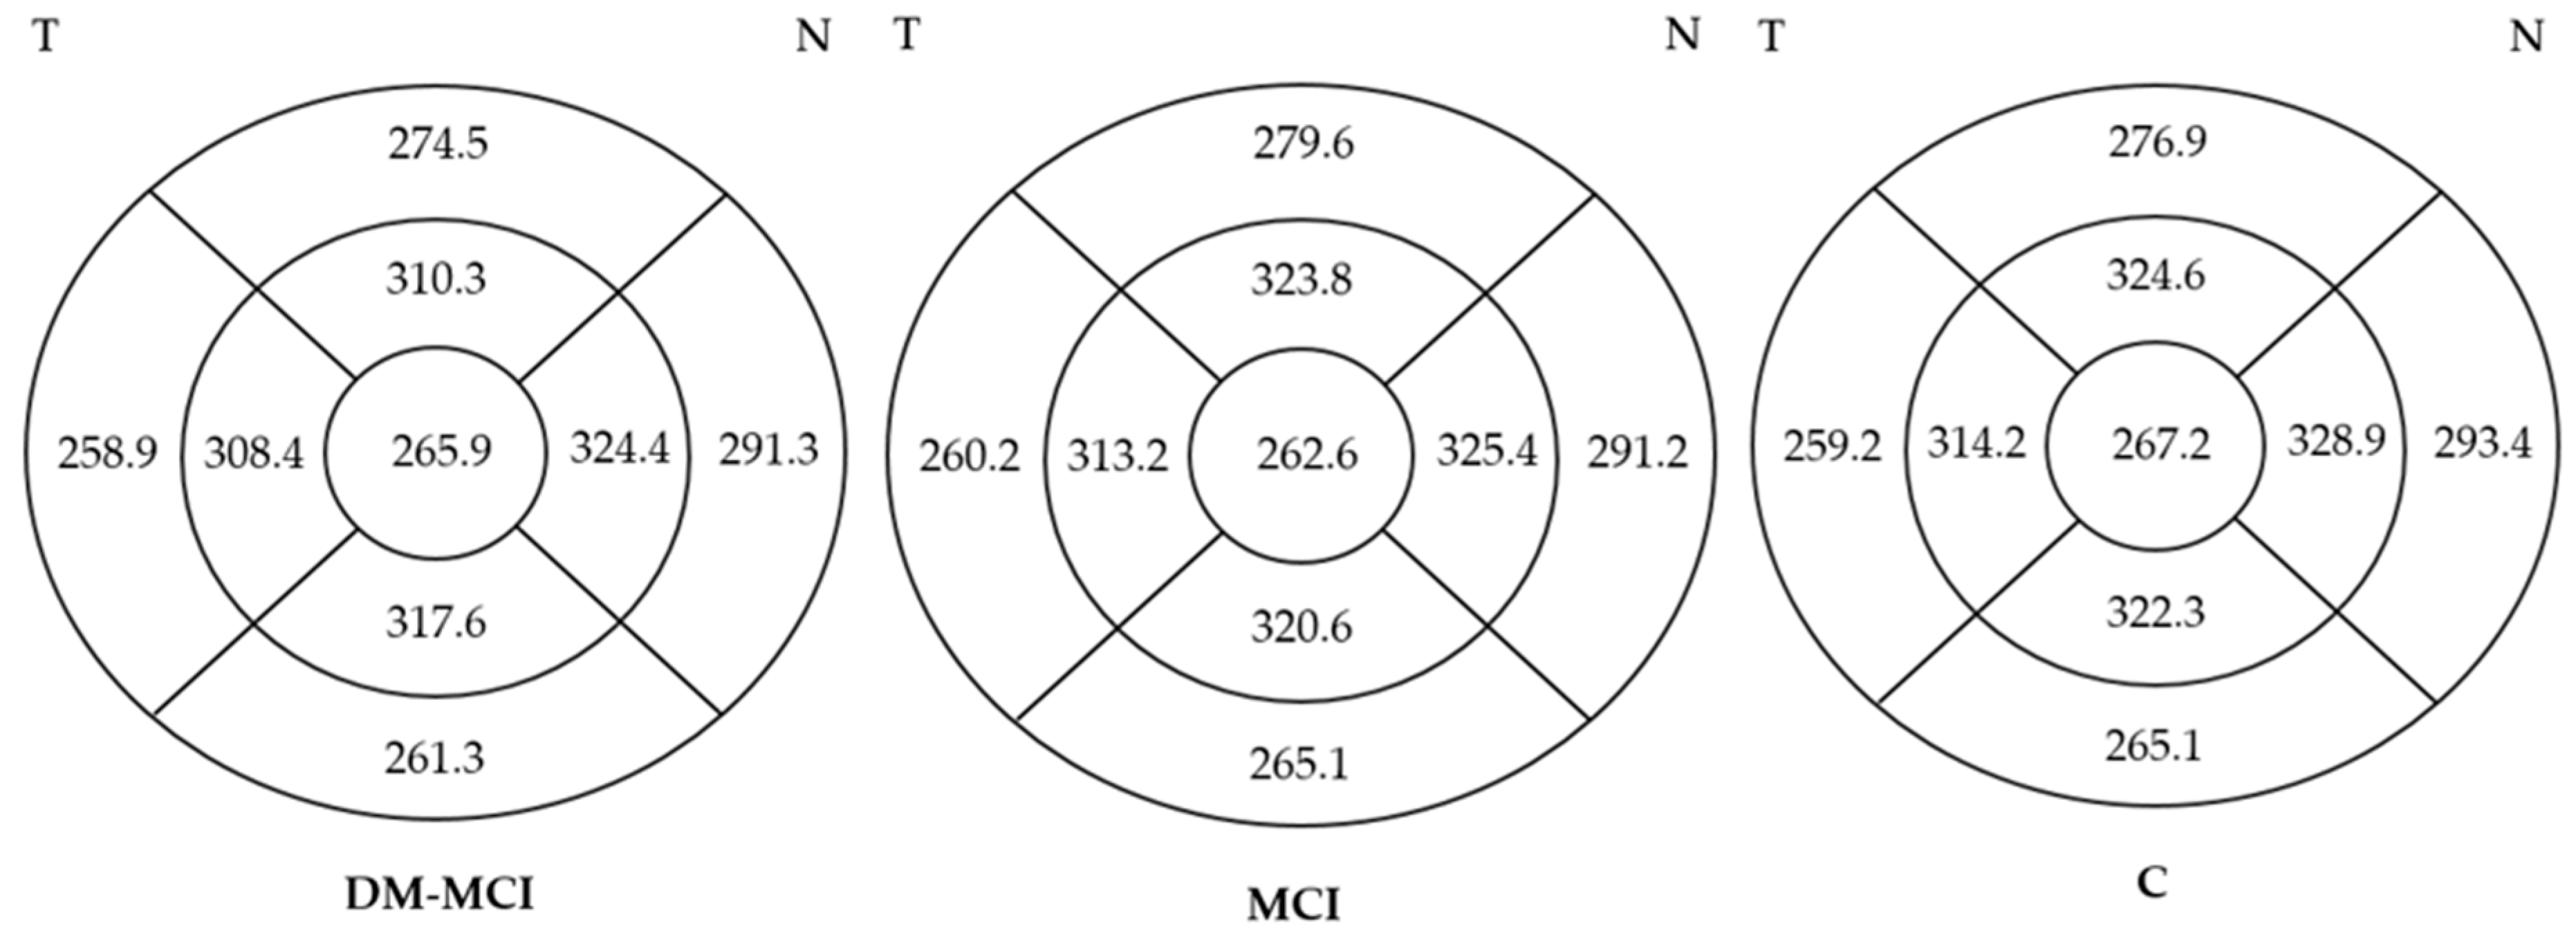
3.3.2. Structural Parameters
4. Discussion
4.1. Microvasculature
4.2. Structural Parameters
5. Conclusions
Author Contributions
Funding
Institutional Review Board Statement
Informed Consent Statement
Data Availability Statement
Conflicts of Interest
References
- Ashraf, G.M.; Chibber, S.; Mohammad Zaidi, S.K.; Tabrez, S.; Ahmad, A.; Shakil, S.; Mushtaq, G.; Baeesa, S.S.; Kamal, M.A. Recent Updates on the Association between Alzheimer’s Disease and Vascular Dementia. Med. Chem. 2016, 12, 226–237. [Google Scholar] [CrossRef]
- Atri, A. The Alzheimer’s Disease Clinical Spectrum: Diagnosis and Management. Med. Clin. N. Am. 2019, 103, 263–293. [Google Scholar] [CrossRef]
- Sperling, R.A.; Aisen, P.S.; Beckett, L.A.; Bennett, D.A.; Craft, S.; Fagan, A.M.; Iwatsubo, T.; Jack, C.R.J.; Kaye, J.; Montine, T.J.; et al. Toward defining the preclinical stages of Alzheimer’s disease: Recommendations from the National Institute on Aging-Alzheimer’s Association workgroups on diagnostic guidelines for Alzheimer’s disease. Alzheimer’s Dement. J. Alzheimer’s Assoc. 2011, 7, 280–292. [Google Scholar] [CrossRef]
- Song, A.; Johnson, N.; Ayala, A.; Thompson, A.C. Optical Coherence Tomography in Patients with Alzheimer’s Disease: What Can It Tell Us? Eye Brain 2021, 13, 1–20. [Google Scholar] [CrossRef]
- Langa, K.M.; Levine, D.A. The diagnosis and management of mild cognitive impairment: A clinical review. JAMA 2014, 312, 2551–2561. [Google Scholar] [CrossRef]
- De Roeck, E.E.; De Deyn, P.P.; Dierckx, E.; Engelborghs, S. Brief cognitive screening instruments for early detection of Alzheimer’s disease: A systematic review. Alzheimers. Res. Ther. 2019, 11, 21. [Google Scholar] [CrossRef]
- Czakó, C.; Kovács, T.; Ungvari, Z.; Csiszar, A.; Yabluchanskiy, A.; Conley, S.; Csipo, T.; Lipecz, A.; Horváth, H.; Sándor, G.L.; et al. Retinal biomarkers for Alzheimer’s disease and vascular cognitive impairment and dementia (VCID): Implication for early diagnosis and prognosis. GeroScience 2020, 42, 1499–1525. [Google Scholar] [CrossRef]
- Handels, R.L.H.; Wimo, A.; Dodel, R.; Kramberger, M.G.; Visser, P.J.; Molinuevo, J.L.; Verhey, F.R.J.; Winblad, B. Cost-Utility of Using Alzheimer’s Disease Biomarkers in Cerebrospinal Fluid to Predict Progression from Mild Cognitive Impairment to Dementia. J. Alzheimer’s Dis. 2017, 60, 1477–1487. [Google Scholar] [CrossRef]
- Ottoy, J.; Niemantsverdriet, E.; Verhaeghe, J.; De Roeck, E.; Struyfs, H.; Somers, C.; Wyffels, L.; Ceyssens, S.; Van Mossevelde, S.; Van den Bossche, T.; et al. Association of short-term cognitive decline and MCI-to-AD dementia conversion with CSF, MRI, amyloid- and (18)F-FDG-PET imaging. NeuroImage Clin. 2019, 22, 101771. [Google Scholar] [CrossRef]
- Berisha, F.; Feke, G.T.; Trempe, C.L.; McMeel, J.W.; Schepens, C.L. Retinal abnormalities in early Alzheimer’s disease. Investig. Ophthalmol. Vis. Sci. 2007, 48, 2285–2289. [Google Scholar] [CrossRef]
- Yamashita, K.-I.; Taniwaki, Y.; Utsunomiya, H.; Taniwaki, T. Cerebral blood flow reduction associated with orientation for time in amnesic mild cognitive impairment and Alzheimer disease patients. J. Neuroimaging 2014, 24, 590–594. [Google Scholar] [CrossRef]
- Hosseinzadeh, S.; Noroozian, M.; Mortaz, E.; Mousavizadeh, K. Plasma microparticles in Alzheimer’s disease: The role of vascular dysfunction. Metab. Brain Dis. 2018, 33, 293–299. [Google Scholar] [CrossRef]
- Jiang, H.; Wei, Y.; Shi, Y.; Wright, C.B.; Sun, X.; Gregori, G.; Zheng, F.; Vanner, E.A.; Lam, B.L.; Rundek, T.; et al. Altered Macular Microvasculature in Mild Cognitive Impairment and Alzheimer Disease. J. Neuro-Ophthalmol. Soc. 2018, 38, 292–298. [Google Scholar] [CrossRef]
- Hui, J.; Zhao, Y.; Yu, S.; Liu, J.; Chiu, K.; Wang, Y. Detection of retinal changes with optical coherence tomography angiography in mild cognitive impairment and Alzheimer’s disease patients: A meta-analysis. PLoS ONE 2021, 16, e0255362. [Google Scholar] [CrossRef]
- Cabrera DeBuc, D.; Gaca-Wysocka, M.; Grzybowski, A.; Kanclerz, P. Identification of Retinal Biomarkers in Alzheimer’s Disease Using Optical Coherence Tomography: Recent Insights, Challenges, and Opportunities. J. Clin. Med. 2019, 8, 996. [Google Scholar] [CrossRef]
- van de Kreeke, J.A.; Nguyen, H.-T.; Konijnenberg, E.; Tomassen, J.; den Braber, A.; Ten Kate, M.; Yaqub, M.; van Berckel, B.; Lammertsma, A.A.; Boomsma, D.I.; et al. Optical coherence tomography angiography in preclinical Alzheimer’s disease. Br. J. Ophthalmol. 2020, 104, 157–161. [Google Scholar] [CrossRef]
- Carazo-Barrios, L.; Archidona-Arranz, A.; Claros-Ruiz, A.; García-Basterra, I.; Garzón-Maldonado, F.J.; Serrano-Castro, V.; Gutiérrez-Bedmar, M.; Barbancho, M.Á.; De la Cruz Cosme, C.; García-Campos, J.M.; et al. Correlation between retinal nerve fibre layer thickness and white matter lesions in Alzheimer’s disease. Int. J. Geriatr. Psychiatry 2021, 36, 935–942. [Google Scholar] [CrossRef]
- Marchesi, N.; Fahmideh, F.; Boschi, F.; Pascale, A.; Barbieri, A. Ocular Neurodegenerative Diseases: Interconnection between Retina and Cortical Areas. Cells 2021, 10, 2394. [Google Scholar] [CrossRef]
- Bulut, M.; Kurtuluş, F.; Gözkaya, O.; Erol, M.K.; Cengiz, A.; Akıdan, M.; Yaman, A. Evaluation of optical coherence tomography angiographic findings in Alzheimer’s type dementia. Br. J. Ophthalmol. 2018, 102, 233–237. [Google Scholar] [CrossRef]
- Battista, M.; Borrelli, E.; Sacconi, R.; Bandello, F.; Querques, G. Optical coherence tomography angiography in diabetes: A review. Eur. J. Ophthalmol. 2020, 30, 411–416. [Google Scholar] [CrossRef]
- Abner, E.L.; Nelson, P.T.; Kryscio, R.J.; Schmitt, F.A.; Fardo, D.W.; Woltjer, R.L.; Cairns, N.J.; Yu, L.; Dodge, H.H.; Xiong, C.; et al. Diabetes is associated with cerebrovascular but not Alzheimer’s disease neuropathology. Alzheimer’s Dementia J. Alzheimer’s Assoc. 2016, 12, 882–889. [Google Scholar] [CrossRef]
- Biessels, G.J.; Staekenborg, S.; Brunner, E.; Brayne, C.; Scheltens, P. Risk of dementia in diabetes mellitus: A systematic review. Lancet. Neurol. 2006, 5, 64–74. [Google Scholar] [CrossRef]
- Palta, P.; Schneider, A.L.C.; Biessels, G.J.; Touradji, P.; Hill-Briggs, F. Magnitude of cognitive dysfunction in adults with type 2 diabetes: A meta-analysis of six cognitive domains and the most frequently reported neuropsychological tests within domains. J. Int. Neuropsychol. Soc. 2014, 20, 278–291. [Google Scholar] [CrossRef]
- Wang, W.; Tam, K.C.; Ng, T.C.; Goit, R.K.; Chan, K.L.S.; Lo, A.C.Y. Long-term lutein administration attenuates retinal inflammation and functional deficits in early diabetic retinopathy using the Ins2(Akita/+) mice. BMJ Open Diabetes Res. Care 2020, 8, e001519. [Google Scholar] [CrossRef]
- Kim, M.; Kim, R.-Y.; Park, W.; Park, Y.-G.; Kim, I.-B.; Park, Y.-H. Electroretinography and retinal microvascular changes in type 2 diabetes. Acta Ophthalmol. 2020, 98, e807–e813. [Google Scholar] [CrossRef]
- Ciudin, A.; Simó, R. New methods for the diagnosis and monitoring of cognitive function in patients with type 2 diabetes. Front. Endocrinol. 2022, 13, 1024794. [Google Scholar] [CrossRef]
- Muñoz, G.; Degen, C.; Schröder, J.; Toro, P. Diabetes Mellitus y su Asociación Con Deterioro Cognitivo y Demencia. Rev. Médica Clínica Las Condes 2016, 27, 266–270. [Google Scholar] [CrossRef]
- Wu, J.; Zhang, X.; Azhati, G.; Li, T.; Xu, G.; Liu, F. Retinal microvascular attenuation in mental cognitive impairment and Alzheimer’s disease by optical coherence tomography angiography. Acta Ophthalmol. 2020, 98, e781–e787. [Google Scholar] [CrossRef]
- Zhang, Y.S.; Zhou, N.; Knoll, B.M.; Samra, S.; Ward, M.R.; Weintraub, S.; Fawzi, A.A. Parafoveal vessel loss and correlation between peripapillary vessel density and cognitive performance in amnestic mild cognitive impairment and early Alzheimer’s Disease on optical coherence tomography angiography. PLoS ONE 2019, 14, e0214685. [Google Scholar] [CrossRef]
- Grewal, D.S.; Polascik, B.W.; Hoffmeyer, G.C.; Fekrat, S. Assessment of Differences in Retinal Microvasculature Using OCT Angiography in Alzheimer’s Disease: A Twin Discordance Report. Ophthalmic Surg. Lasers Imaging Retin. 2018, 49, 440–444. [Google Scholar] [CrossRef]
- Yoon, S.P.; Grewal, D.S.; Thompson, A.C.; Polascik, B.W.; Dunn, C.; Burke, J.R.; Fekrat, S. Retinal Microvascular and Neurodegenerative Changes in Alzheimer’s Disease and Mild Cognitive Impairment Compared with Control Participants. Ophthalmol. Retin. 2019, 3, 489–499. [Google Scholar] [CrossRef]
- O’Bryhim, B.E.; Apte, R.S.; Kung, N.; Coble, D.; Van Stavern, G.P. Association of Preclinical Alzheimer Disease with Optical Coherence Tomographic Angiography Findings. JAMA Ophthalmol. 2018, 136, 1242–1248. [Google Scholar] [CrossRef]
- Kinney, J.W.; Bemiller, S.M.; Murtishaw, A.S.; Leisgang, A.M.; Salazar, A.M.; Lamb, B.T. Inflammation as a central mechanism in Alzheimer’s disease. Alzheimer’s Dement. 2018, 4, 575–590. [Google Scholar] [CrossRef]
- Sousa, D.C.; Leal, I.; Moreira, S.; Dionísio, P.; Abegão Pinto, L.; Marques-Neves, C. Hypoxia challenge test and retinal circulation changes—A study using ocular coherence tomography angiography. Acta Ophthalmol. 2018, 96, e315–e319. [Google Scholar] [CrossRef]
- Marchesi, V.T. Alzheimer’s dementia begins as a disease of small blood vessels, damaged by oxidative-induced inflammation and dysregulated amyloid metabolism: Implications for early detection and therapy. FASEB J. 2011, 25, 5–13. [Google Scholar] [CrossRef]
- Verma, A.; Magesan, K.; Amose, T.; Alagorie, A.R.; Gnanaraj, R.; Sadda, S.R.; Sen, P. Age-related assessment of foveal avascular zone and surrounding capillary networks with swept source optical coherence tomography angiography in healthy eyes. Eye 2022, 36, 1857–1864. [Google Scholar] [CrossRef]
- Zhang, B.; Chou, Y.; Zhao, X.; Yang, J.; Chen, Y. Early Detection of Microvascular Impairments With Optical Coherence Tomography Angiography in Diabetic Patients Without Clinical Retinopathy: A Meta-analysis. Am. J. Ophthalmol. 2021, 222, 226–237. [Google Scholar] [CrossRef]
- Yang, J.Y.; Wang, Q.; Yan, Y.N.; Zhou, W.J.; Wang, Y.X.; Wu, S.L.; Yuan, M.X.; Wei WBin Jonas, J.B. Microvascular retinal changes in pre-clinical diabetic retinopathy as detected by optical coherence tomographic angiography. Graefe’s Arch. Clin. Exp. Ophthalmol. = Albrecht Graefes Arch. Fur Klin. Und Exp. Ophthalmol. 2020, 258, 513–520. [Google Scholar] [CrossRef]
- Park, Y.G.; Kim, M.; Roh, Y.J. Evaluation of Foveal and Parafoveal Microvascular Changes Using Optical Coherence Tomography Angiography in Type 2 Diabetes Patients without Clinical Diabetic Retinopathy in South Korea. J. Diabetes Res. 2020, 2020, 6210865. [Google Scholar] [CrossRef]
- Querques, G.; Borrelli, E.; Sacconi, R.; De Vitis, L.; Leocani, L.; Santangelo, R.; Magnani, G.; Comi, G.; Bandello, F. Functional and morphological changes of the retinal vessels in Alzheimer’s disease and mild cognitive impairment. Sci. Rep. 2019, 9, 63. [Google Scholar] [CrossRef]
- Yoon, S.P.; Thompson, A.C.; Polascik, B.W.; Calixte, C.; Burke, J.R.; Petrella, J.R.; Grewal, D.S.; Fekrat, S. Correlation of OCTA and Volumetric MRI in Mild Cognitive Impairment and Alzheimer’s Disease. Ophthalmic Surg. Lasers Imaging Retin. 2019, 50, 709–718. [Google Scholar] [CrossRef]
- Lad, E.M.; Mukherjee, D.; Stinnett, S.S.; Cousins, S.W.; Potter, G.G.; Burke, J.R.; Farsiu, S.; Whitson, H.E. Evaluation of inner retinal layers as biomarkers in mild cognitive impairment to moderate Alzheimer’s disease. PLoS ONE 2018, 13, e0192646. [Google Scholar] [CrossRef]
- Ferrari, L.; Huang, S.-C.; Magnani, G.; Ambrosi, A.; Comi, G.; Leocani, L. Optical Coherence Tomography Reveals Retinal Neuroaxonal Thinning in Frontotemporal Dementia as in Alzheimer’s Disease. J. Alzheimer’s Dis. 2017, 56, 1101–1107. [Google Scholar] [CrossRef] [PubMed]
- Larrosa, J.M.; Garcia-Martin, E.; Bambo, M.P.; Pinilla, J.; Polo, V.; Otin, S.; Satue, M.; Herrero, R.; Pablo, L.E. Potential new diagnostic tool for Alzheimer’s disease using a linear discriminant function for Fourier domain optical coherence tomography. Investig. Ophthalmol. Vis. Sci. 2014, 55, 3043–3051. [Google Scholar] [CrossRef]
- Polo, V.; Rodrigo, M.J.; Garcia-Martin, E.; Otin, S.; Larrosa, J.M.; Fuertes, M.I.; Bambo, M.P.; Pablo, L.E.; Satue, M. Visual dysfunction and its correlation with retinal changes in patients with Alzheimer’s disease. Eye 2017, 31, 1034–1041. [Google Scholar] [CrossRef]
- Cunha, J.P.; Proença, R.; Dias-Santos, A.; Almeida, R.; Águas, H.; Alves, M.; Papoila, A.L.; Louro, C.; Castanheira-Dinis, A. OCT in Alzheimer’s disease: Thinning of the RNFL and superior hemiretina. Graefe’s Arch. Clin. Exp. Ophthalmol. Albrecht Graefes Arch. Fur Klin. Und Exp. Ophthalmol. 2017, 255, 1827–1835. [Google Scholar] [CrossRef]
- Gao, L.; Liu, Y.; Li, X.; Bai, Q.; Liu, P. Abnormal retinal nerve fiber layer thickness and macula lutea in patients with mild cognitive impairment and Alzheimer’s disease. Arch. Gerontol. Geriatr. 2015, 60, 162–167. [Google Scholar] [CrossRef]
- Chan, V.T.T.; Sun, Z.; Tang, S.; Chen, L.J.; Wong, A.; Tham, C.C.; Wong, T.Y.; Chen, C.; Ikram, M.K.; Whitson, H.E.; et al. Spectral-Domain OCT Measurements in Alzheimer’s Disease: A Systematic Review and Meta-analysis. Ophthalmology 2019, 126, 497–510. [Google Scholar] [CrossRef] [PubMed]
- Eraslan, M.; Çerman, E.; Çekiç, O.; Balci, S.; Dericioğlu, V.; Sahin, Ö.; Süer, D.; Chabou, B.; Tuncer Elmaci, E.N. Neurodegeneration in ocular and central nervous systems: Optical coherence tomography study in normal-tension glaucoma and Alzheimer disease. Turk. J. Med. Sci. 2015, 45, 1106–1114. [Google Scholar] [CrossRef] [PubMed]
- Thomson, K.L.; Yeo, J.M.; Waddell, B.; Cameron, J.R.; Pal, S. A systematic review and meta-analysis of retinal nerve fiber layer change in dementia, using optical coherence tomography. Alzheimer’s Dement. 2015, 1, 136–143. [Google Scholar] [CrossRef]
- Wu, Y.; Wang, X.-N.; Wang, N.; Han, Y.; Ma, D.; Lu, Y. Regularity changes of the retinal nerve fiber layer and macular ganglion cell complex in patients with the amnestic mild cognitive impairment. Int. J. Neurosci. 2018, 128, 849–853. [Google Scholar] [CrossRef] [PubMed]
- Shao, Y.; Jiang, H.; Wei, Y.; Shi, Y.; Shi, C.; Wright, C.B.; Sun, X.; Vanner, E.A.; Rodriguez, A.D.; Lam, B.L.; et al. Visualization of Focal Thinning of the Ganglion Cell-Inner Plexiform Layer in Patients with Mild Cognitive Impairment and Alzheimer’s Disease. J. Alzheimer’s Dis. 2018, 64, 1261–1273. [Google Scholar] [CrossRef] [PubMed]
- van de Kreeke, J.A.; Nguyen, H.T.; Konijnenberg, E.; Tomassen, J.; den Braber, A.; Ten Kate, M.; Yaqub, M.; van Berckel, B.; Lammertsma, A.A.; Boomsma, D.I.; et al. Longitudinal retinal layer changes in preclinical Alzheimer’s disease. Acta Ophthalmol. 2021, 99, 538–544. [Google Scholar] [CrossRef]
- Zhang, Y.; Wang, Y.; Shi, C.; Shen, M.; Lu, F. Advances in retina imaging as potential biomarkers for early diagnosis of Alzheimer’s disease. Transl. Neurodegener. 2021, 10, 6. [Google Scholar] [CrossRef] [PubMed]
- Salobrar-García, E.; de Hoz, R.; Ramírez, A.I.; López-Cuenca, I.; Rojas, P.; Vazirani, R.; Amarante, C.; Yubero, R.; Gil, P.; Pinazo-Durán, M.D.; et al. Changes in visual function and retinal structure in the progression of Alzheimer’s disease. PLoS ONE 2019, 14, e0220535. [Google Scholar] [CrossRef]
- López-Cuenca, I.; de Hoz R de Salobrar-García, E.; Elvira-Hurtado, L.; Rojas, P.; Fernández-Albarral, J.A.; Barabash, A.; Salazar, J.J.; Ramírez, A.I.; Ramírez, J.M. Macular Thickness Decrease in Asymptomatic Subjects at High Genetic Risk of Developing Alzheimer’s Disease: An OCT Study. J. Clin. Med. 2020, 9, 1728. [Google Scholar] [CrossRef]
- van de Kreeke, J.A.; Nguyen, H.-T.; den Haan, J.; Konijnenberg, E.; Tomassen, J.; den Braber, A.; Ten Kate, M.; Collij, L.; Yaqub, M.; van Berckel, B.; et al. Retinal layer thickness in preclinical Alzheimer’s disease. Acta Ophthalmol. 2019, 97, 798–804. [Google Scholar] [CrossRef]


| DM-MCI Group | MCI Group | C Group | DM-MCI vs. MCI | DM-MCI vs. C | MCI vs. C | |
|---|---|---|---|---|---|---|
| n = 39 | n = 39 | n = 39 | n = 78 | n = 78 | n = 78 | |
| Mean (95% CI) | p Value | |||||
| %Gender (Male/Female) | 15/5 (75/15) | 8/12 (40/60) | 9/11 (45/55) | 0.130 b | 0.199 b | 0.421 b |
| Age (years) | 72,654 (74,201–71,107) | 73,720 (75,490–71,950) | 70,440 (71,445–69,435) | 0.010 b | 0.061 b | 0.055 b |
| Visual acuity (decimal) | 0.840 (0.914–0.766) | 0.905 (0.951–0.859) | 0.856 (0.928–0.785) | 0.199 b | 0.554 b | 0.308 b |
| MMSE | 26.93 (28.83–25.03) | 27.23 (28.91–25.55) | 28.44 (29.77–27.11) | 0.420 a | <0.001 a | 0.034 c |
| DM-MCI Group | MCI Group | C Group | p Value | |||
|---|---|---|---|---|---|---|
| n = 39 | n = 39 | n = 39 | n = 78 | n = 78 | n = 78 | |
| Mean (95% CI) | DM-MCI vs. MCI | DM-MCI vs. C | MCI vs. C | |||
| Peripapillary venule diameter | 149.205 (140.50–157.91) | 146.590 (139.699–153.481) | 151.744 (144.236–159.252) | 0.323 a | 0.667 a | 0.838 a |
| Peripapillary arteriole diameter | 121.744 (113.43–130.06) | 110.026 (102.372–117.680) | 114.256 (105.528–120.985) | 0.016 b | 0.100 b | 0.761 a |
| Central SCP | 10.403 (9675–11.130) | 8710 (7835–9586) | 9466 (8590–10.342) | 0.002 a | 0.055 a | 0.882 a |
| Inner SCP | 19.743 (19.050–20.437) | 19.297 (18.367–20.228) | 19.282 (18.634–19.929) | 0.354 b | 0.119 b | 0.345 b |
| Complete SCP | 18.690 (18.034–19.345) | 18.331 (17.645–19.017) | 18.163 (17.522–18.804) | 0.228 b | 0.112 b | 0.439 b |
| FAZ area | 0.233 (0.206–0.260) | 0.278 (0.248–0.309) | 0.253 (0.224–0.283) | 0.983 a | 0.834 a | 0.129 a |
| FAZ perimeter | 2.142 (2.013–2.270) | 2.402 (2.248–2.556) | 2.249 (2.140–2.357) | 0.994 a | 0.891 a | 0.058 b |
| FAZ circularity | 0.631 (0.602–0.659) | 0.600 (0.564–0.637) | 0.608 (0.578–0.639) | 0.101 a | 0.151 a | 0.504 b |
| DM-MCI Group | MCI Group | C Group | p Value | |||
|---|---|---|---|---|---|---|
| n = 39 | n = 39 | n = 39 | n = 78 | n = 78 | n = 78 | |
| Mean (95% CI) | DM-MCI vs. MCI | DM-MCI vs. C | MCI vs. C | |||
| Mean | 77,513 (75,326–79,700) | 78,500 (76,317–80,683) | 76,282 (72,968–79,596) | 0.533 a | 0.530 b | 0.706 b |
| Temporal superior | 27,897 (25,324–30,471) | 29,711 (27,090–32,331) | 31,897 (29,010–34,784) | 0.321 b | 0.019 b | 0.140 b |
| Superior | 16,128 (14,537–17,719) | 17,026 (15,566–18,487) | 16,333 (14,807–17,860) | 0.357 b | 0.428 a | 0.664 b |
| Nasal inferior | 25,769 (23,905–27,634) | 26,763 (24,589–28,938) | 28,463 (24,665–32,258) | 0.173 b | 0.098 b | 0.222 b |
| Nasal superior | 34,872 (33,477–36,266) | 37,105 (35,143–39,068) | 38,897 (35,566–42,229) | 0.099 b | 0.017 c | 0.184 c |
| Inferior | 35,897 (35,838–40,005) | 37,921 (35,838–40,005) | 40,692 (37,342–44,043) | 0.142 a | 0.008 c | 0.087 c |
| Temporal inferior | 37,949 (36,017–39,881) | 39,684 (37,666–41,702) | 42,872 (38,428–45,316) | 0.411 b | 0.028 c | 0.143 c |
| DM-MCI Group | MCI Group | C Group | p Value | |||
|---|---|---|---|---|---|---|
| n = 39 | n = 39 | n = 39 | n = 78 | n = 78 | n = 78 | |
| Mean (95% CI) | DM-MCI vs. MCI | DM-MCI vs. C | MCI vs. C | |||
| Average | 79.11 (73.81–84.41) | 78.85 (72.41–85.21) | 80.00 (72.62–87.38) | 0.482 a | 0.396 a | 0.422 a |
| Temporal superior | 75.85 (70.24–81.47) | 77.00 (70.73–83.27) | 74.41 (59.80–89.63) | 0.662 b | 0.726 c | 0.743 a |
| Superior | 79.07 (73.22–84.92) | 79.80 (73.08–70.73) | 83.10 (69.30–96.90) | 0.029 a | 0.162 c | 0.398 a |
| Nasal inferior | 77.82 (71.86–83.78) | 79.80 (72.35–87.25) | 80.36 (73.60–87.11) | 0.138 b | 0.124 a | 0.407 a |
| Nasal superior | 80.00 (75.25–85.75) | 79.30 (72.16–86.44) | 82.29 (71.49–93.08) | 0.412 b | 0.270 c | 0.224 a |
| Inferior | 80.68 (74.16–87.20) | 81.55 (69.87–92.23) | 79.93 (67.32–92.54) | 0.500 b | 0.556 b | 0.685 a |
| Temporal inferior | 79.18 (72.73–85.63) | 78.85 (72.11–84.99) | 79.64 (71.67–87.62) | 0.391 a | 0.457 a | 0.451 a |
| DM-MCI Group | MCI Group | C Group | p Value | |||
|---|---|---|---|---|---|---|
| n = 39 | n = 39 | n = 39 | n = 78 | n = 78 | n = 78 | |
| Mean (95% CI) | DM-MCI vs. MCI | DM-MCI vs. C | MCI vs. C | |||
| Average | 275.333 (271.165–279.502) | 276.553 (271.507–281.598) | 278.385 (273.492–283.277) | 0.301 b | 0.100 b | 0.303 b |
| Central | 265.974 (259.919–272.030) | 262.632 (254.687–270.576) | 267.154 (259.653–274.655) | 0.180 b | 0.406 a | 0.068 b |
| Temporal inner | 308.410 (303.842–312.979) | 313.184 (308.385–317.983) | 314.179 (309.035–319.324) | 0.101 b | 0.052 a | 0.300 b |
| Temporal outer | 258.897 (254.681–263.114) | 260.216 (256.564–263.869) | 259.154 (255.105–263.203) | 0.454 b | 0.352 b | 0.648 a |
| Nasal inner | 324.359 (319.479–329.239) | 325.447 (320.383–330.512) | 328.872 (323.360–334.384) | 0.325 b | 0.039 b | 0.099 b |
| Nasal outer | 291.282 (285.948–296.616) | 291.211 (286.628–295.793) | 293.385 (287.080–299.689) | 0.592 b | 0.144 b | 0.196 b |
| Superior inner | 310.282 (294.223–326.341) | 323.789 (318.849–328.730) | 324.590 (319.516–329.663) | 0.111 b | 0.040 b | 0.372 b |
| Superior outer | 274.487 (267.902–281.072) | 279.553 (273.285–285.821) | 276.872 (271.325–282.418) | 0.071 b | 0.121 b | 0.781 b |
| Inferior inner | 317.641 (312.996–322.286) | 320.553 (316.364–324.741) | 322.308 (315.972–328.643) | 0.105 b | 0.047 b | 0.192 b |
| Inferior outer | 261.308 (256.609–266.007) | 265.079 (259.824–270.334) | 265.051 (259.469–270.634) | 0.343 b | 0.159 a | 0.262 b |
| Macular volume | 9.915 (9.767–19.064) | 9.955 (9.772–10.138) | 10.026 (9.849–10.202) | 0.366 b | 0.089 b | 0.277 b |
Disclaimer/Publisher’s Note: The statements, opinions and data contained in all publications are solely those of the individual author(s) and contributor(s) and not of MDPI and/or the editor(s). MDPI and/or the editor(s) disclaim responsibility for any injury to people or property resulting from any ideas, methods, instructions or products referred to in the content. |
© 2023 by the authors. Licensee MDPI, Basel, Switzerland. This article is an open access article distributed under the terms and conditions of the Creative Commons Attribution (CC BY) license (https://creativecommons.org/licenses/by/4.0/).
Share and Cite
Santos-Ortega, Á.; Alba-Linero, C.; Urbinati, F.; Rocha-de-Lossada, C.; Orti, R.; Reyes-Bueno, J.A.; Garzón-Maldonado, F.J.; Serrano, V.; de Rojas-Leal, C.; de la Cruz-Cosme, C.; et al. Structural and Functional Retinal Changes in Patients with Mild Cognitive Impairment with and without Diabetes. J. Clin. Med. 2023, 12, 7035. https://doi.org/10.3390/jcm12227035
Santos-Ortega Á, Alba-Linero C, Urbinati F, Rocha-de-Lossada C, Orti R, Reyes-Bueno JA, Garzón-Maldonado FJ, Serrano V, de Rojas-Leal C, de la Cruz-Cosme C, et al. Structural and Functional Retinal Changes in Patients with Mild Cognitive Impairment with and without Diabetes. Journal of Clinical Medicine. 2023; 12(22):7035. https://doi.org/10.3390/jcm12227035
Chicago/Turabian StyleSantos-Ortega, Álvaro, Carmen Alba-Linero, Facundo Urbinati, Carlos Rocha-de-Lossada, Rafael Orti, José Antonio Reyes-Bueno, Francisco Javier Garzón-Maldonado, Vicente Serrano, Carmen de Rojas-Leal, Carlos de la Cruz-Cosme, and et al. 2023. "Structural and Functional Retinal Changes in Patients with Mild Cognitive Impairment with and without Diabetes" Journal of Clinical Medicine 12, no. 22: 7035. https://doi.org/10.3390/jcm12227035
APA StyleSantos-Ortega, Á., Alba-Linero, C., Urbinati, F., Rocha-de-Lossada, C., Orti, R., Reyes-Bueno, J. A., Garzón-Maldonado, F. J., Serrano, V., de Rojas-Leal, C., de la Cruz-Cosme, C., España-Contreras, M., Rodríguez-Calvo-de-Mora, M., & García-Casares, N. (2023). Structural and Functional Retinal Changes in Patients with Mild Cognitive Impairment with and without Diabetes. Journal of Clinical Medicine, 12(22), 7035. https://doi.org/10.3390/jcm12227035