

Automatic Variable Selection Algorithms in Prognostic Factor Research in Neck Pain


Abstract
1. Introduction
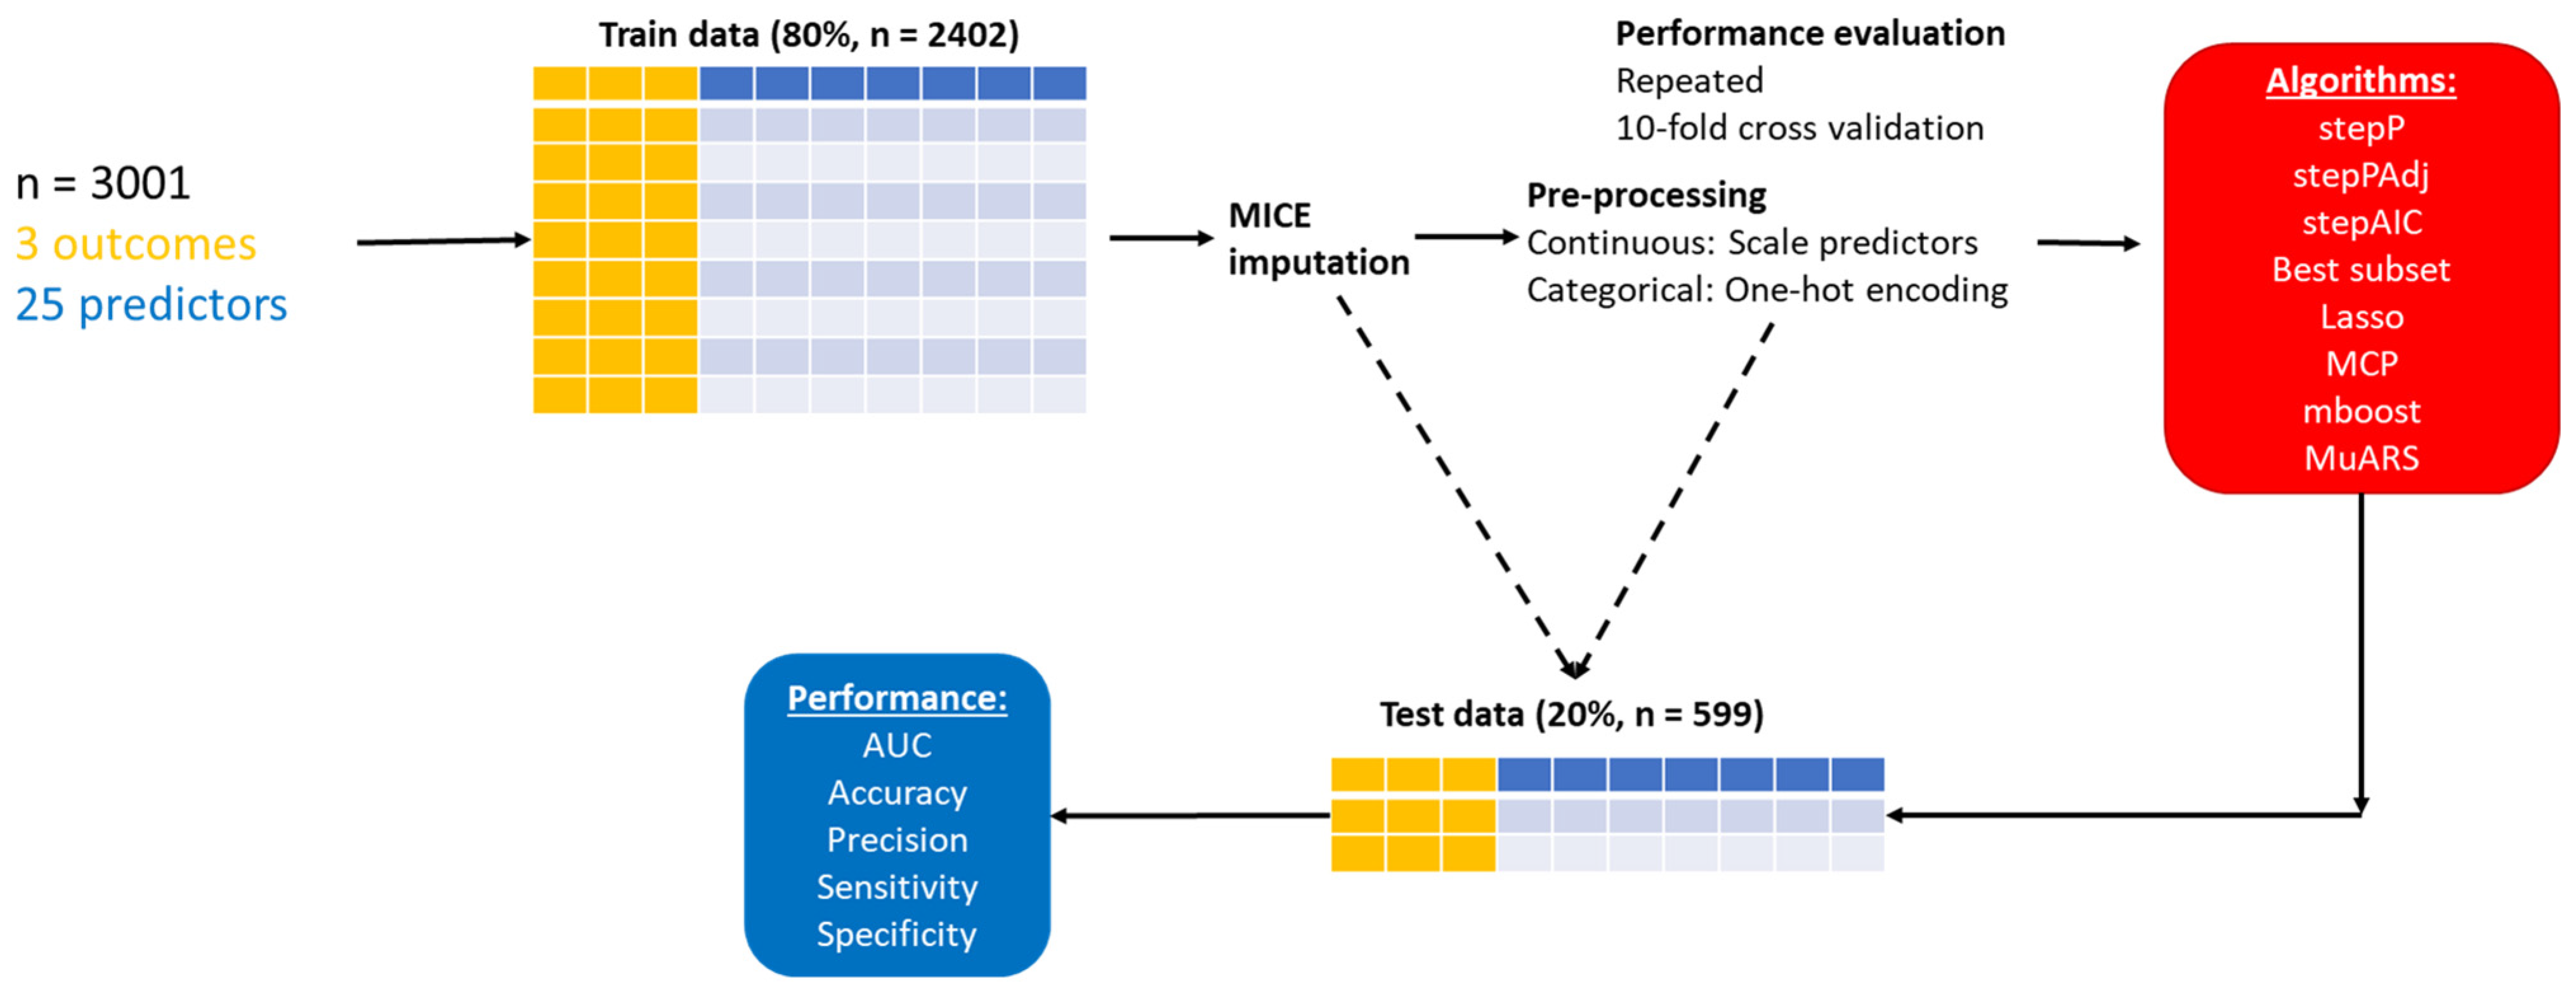
2. Materials and Methods
2.1. Design
2.2. Setting
2.3. Participants
2.4. Sample Size
2.5. Predictor and Outcome Variables
2.6. Preprocessing and Missing Data Handling
2.7. ML Algorithms
2.8. Validation
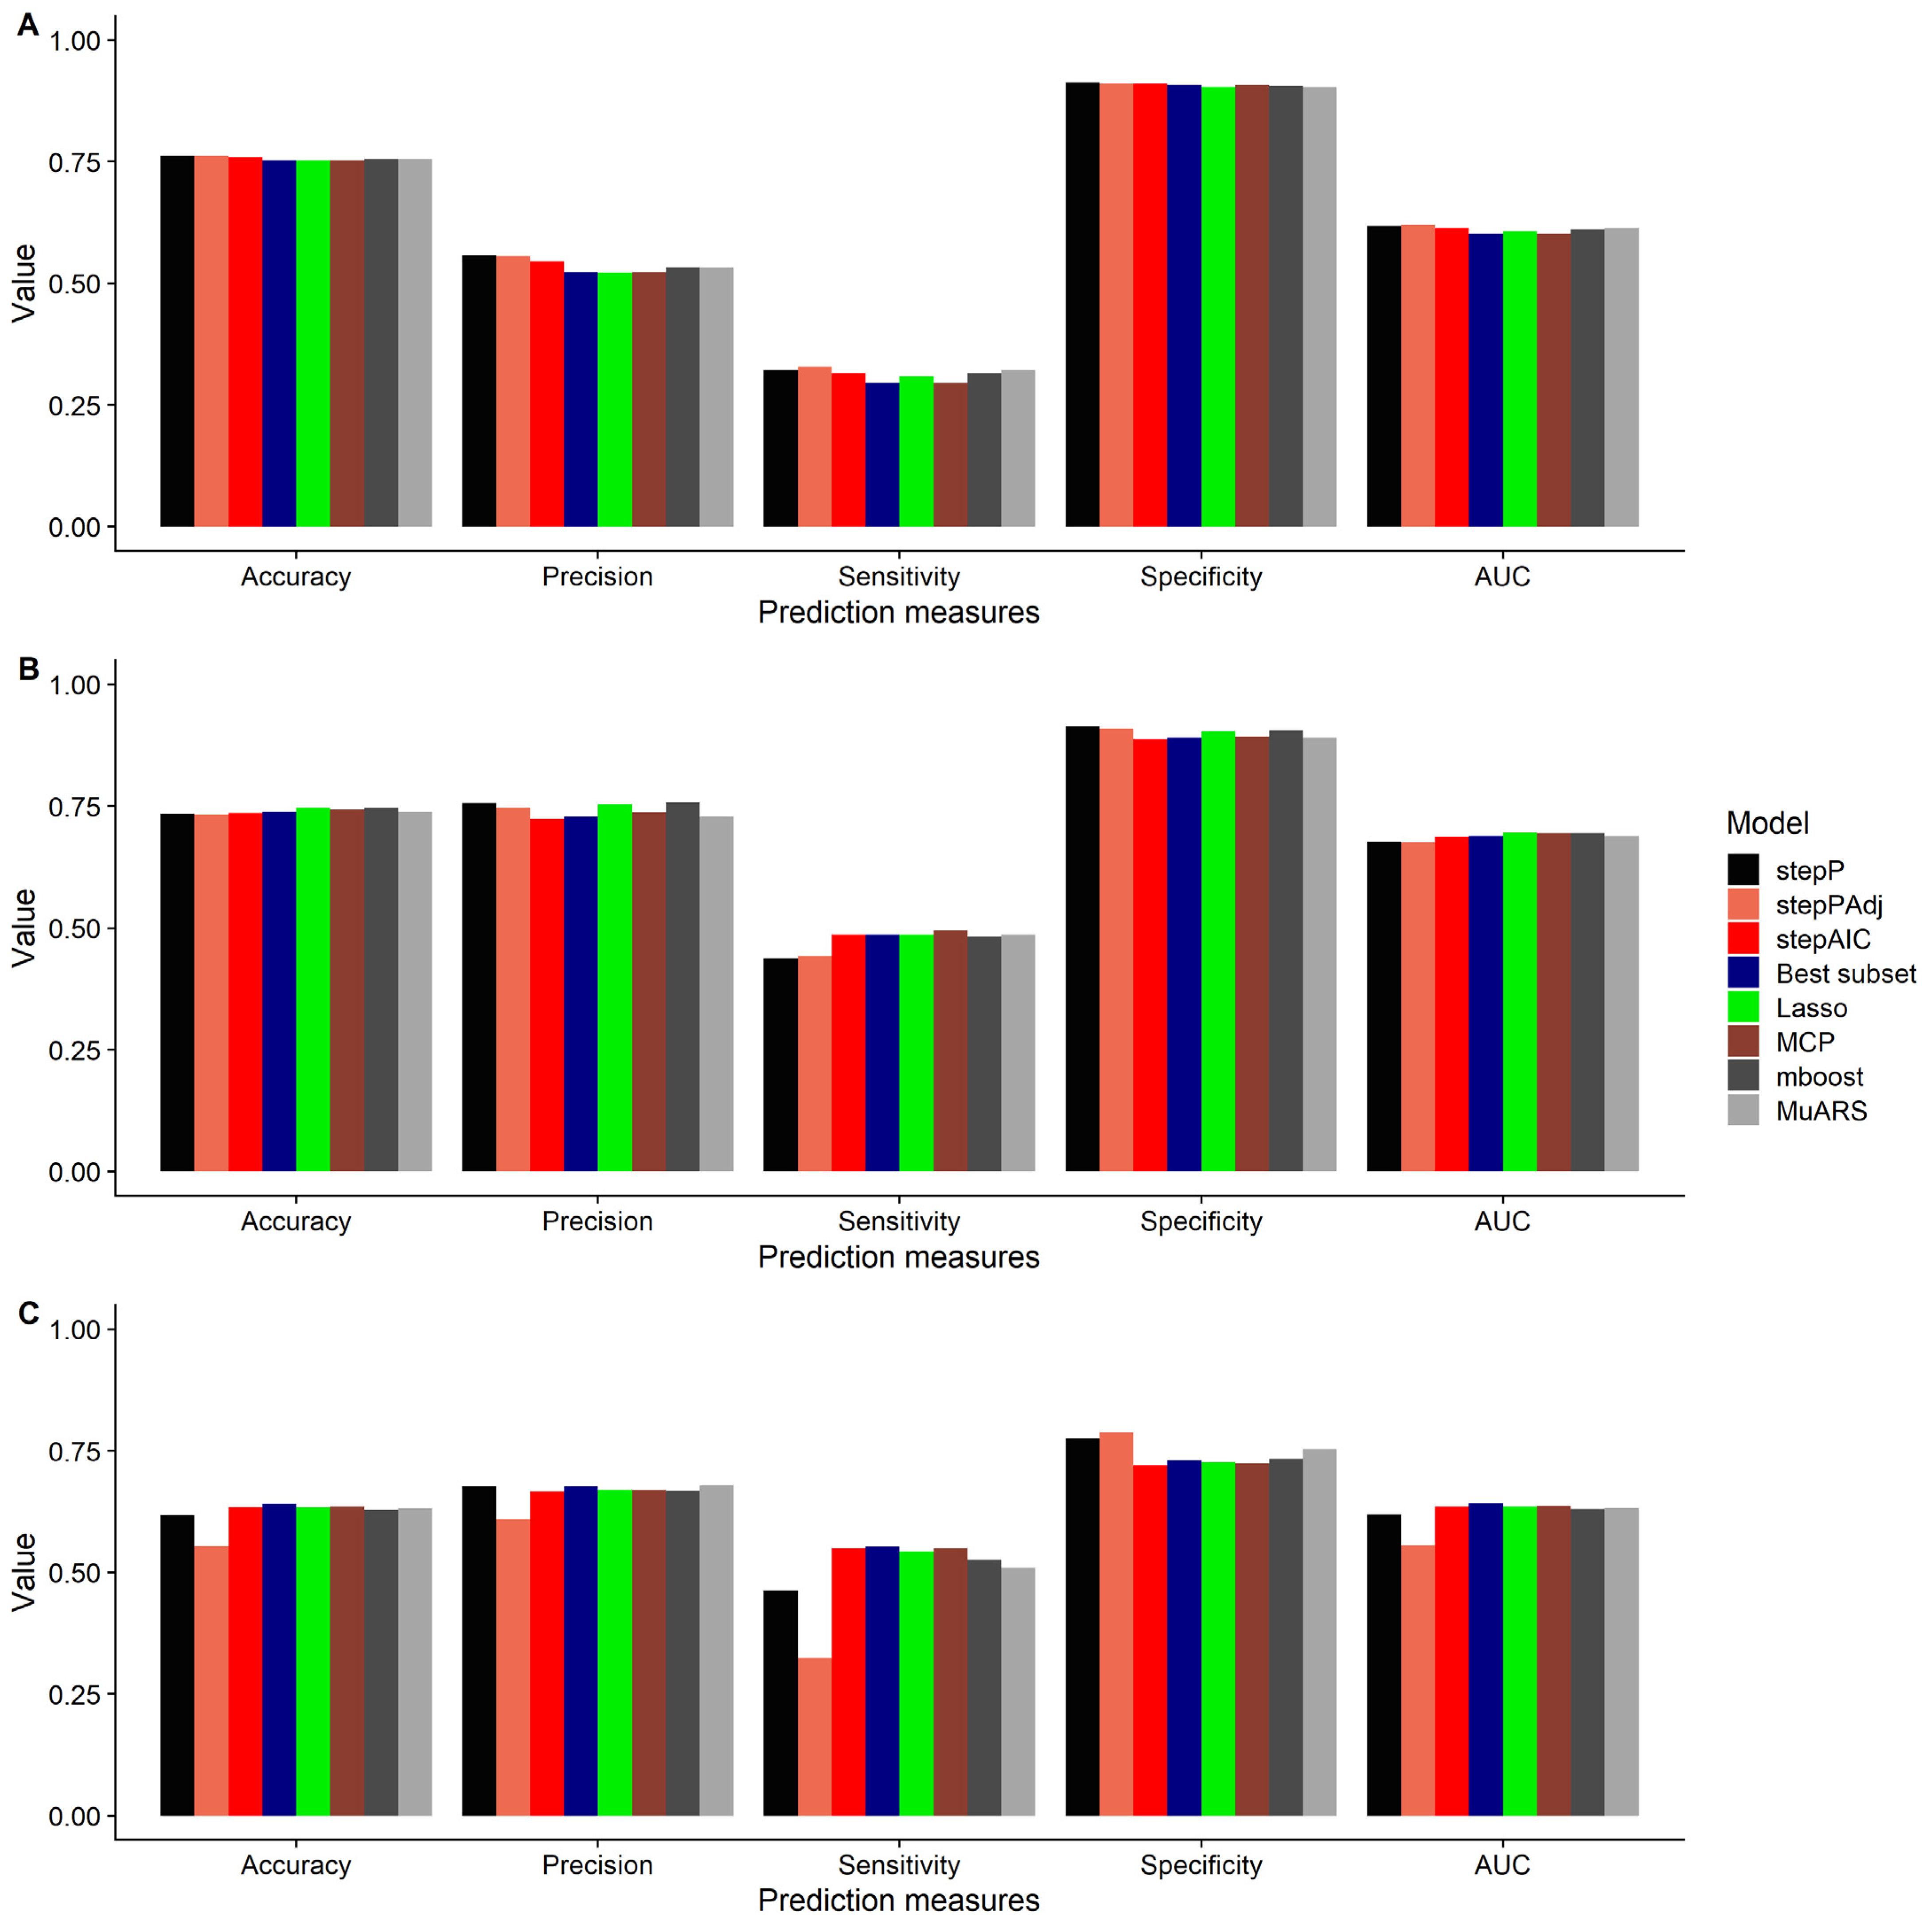
3. Results
4. Discussion
5. Conclusions
Supplementary Materials
Author Contributions
Funding
Institutional Review Board Statement
Informed Consent Statement
Data Availability Statement
Conflicts of Interest
References
- Safiri, S.; Kolahi, A.-A.; Hoy, D.; Buchbinder, R.; Mansournia, M.A.; Bettampadi, D.; Ashrafi-Asgarabad, A.; Almasi-Hashiani, A.; Smith, E.; Sepidarkish, M.; et al. Global, regional, and national burden of neck pain in the general population, 1990-2017: Systematic analysis of the Global Burden of Disease Study 2017. BMJ 2020, 368, m791. [Google Scholar] [CrossRef] [PubMed]
- Borghouts, J.A.J.; Koes, B.W.; Vondeling, H.; Bouter, L.M. Cost-of-illness of neck pain in The Netherlands in 1996. Pain 1999, 80, 629–636. [Google Scholar] [CrossRef] [PubMed]
- Sterling, M. Neck Pain: Much More Than a Psychosocial Condition. J. Orthop. Sports Phys. Ther. 2009, 39, 309–311. [Google Scholar] [CrossRef] [PubMed][Green Version]
- Riley, R.D.; Hayden, J.A.; Steyerberg, E.W.; Moons, K.G.; Abrams, K.; Kyzas, P.A.; Malats, N.; Briggs, A.; Schroter, S.; Altman, D.G.; et al. Prognosis Research Strategy (PROGRESS) 2: Prognostic factor research. PLoS Med. 2013, 10, e1001380. [Google Scholar] [CrossRef] [PubMed]
- Manderlier, A.; de Fooz, M.; Patris, S.; Berquin, A. Modifiable lifestyle-related prognostic factors for the onset of chronic spinal pain: A systematic review of longitudinal studies. Ann. Phys. Rehabil. Med. 2022, 65, 101660. [Google Scholar] [CrossRef] [PubMed]
- Verwoerd, M.; Wittink, H.; Maissan, F.; de Raaij, E.; Smeets, R. Prognostic factors for persistent pain after a first episode of nonspecific idiopathic, non-traumatic neck pain: A systematic review. Musculoskelet Sci. Pr. 2019, 42, 13–37. [Google Scholar] [CrossRef] [PubMed]
- Bruls, V.E.J.; Bastiaenen, C.H.G.; de Bie, R.A. Prognostic factors of complaints of arm, neck, and/or shoulder: A systematic review of prospective cohort studies. Pain 2015, 156, 765–788. [Google Scholar] [CrossRef]
- Kovacs, F.M.; Seco-Calvo, J.; Fernández-Félix, B.M.; Zamora, J.; Royuela, A.; Muriel, A. Predicting the evolution of neck pain episodes in routine clinical practice. BMC Musculoskelet. Disord. 2019, 20, 620. [Google Scholar] [CrossRef]
- Pico-Espinosa, O.J.; Côté, P.; Hogg-Johnson, S.; Jensen, I.; Axén, I.; Holm, L.W.; Skillgate, E. Trajectories of Pain Intensity Over 1 Year in Adults With Disabling Subacute or Chronic Neck Pain. Clin. J. Pain 2019, 35, 678–685. [Google Scholar] [CrossRef]
- Chowdhury, M.Z.I.; Turin, T.C. Variable selection strategies and its importance in clinical prediction modelling. Fam. Med. Community Health 2020, 8, e000262. [Google Scholar] [CrossRef]
- Talbot, D.; Massamba, V.K. A descriptive review of variable selection methods in four epidemiologic journals: There is still room for improvement. Eur. J. Epidemiol. 2019, 34, 725–730. [Google Scholar] [CrossRef] [PubMed]
- Walter, S.; Tiemeier, H. Variable selection: Current practice in epidemiological studies. Eur. J. Epidemiol. 2009, 24, 733–736. [Google Scholar] [CrossRef] [PubMed]
- Pressat-Laffouilhère, T.; Jouffroy, R.; Leguillou, A.; Kerdelhue, G.; Benichou, J.; Gillibert, A. Variable selection methods were poorly reported but rarely misused in major medical journals: Literature review. J. Clin. Epidemiol. 2021, 139, 12–19. [Google Scholar] [CrossRef] [PubMed]
- Smith, G. Step away from stepwise. J. Big Data 2018, 5, 32. [Google Scholar] [CrossRef]
- Lötsch, J.; Ultsch, A. Machine learning in pain research. Pain 2018, 159, 623–630. [Google Scholar] [CrossRef] [PubMed]
- Tagliaferri, S.D.; Angelova, M.; Zhao, X.; Owen, P.J.; Miller, C.T.; Wilkin, T.; Belavy, D.L. Artificial intelligence to improve back pain outcomes and lessons learnt from clinical classification approaches: Three systematic reviews. NPJ Digit. Med. 2020, 3, 93. [Google Scholar] [CrossRef] [PubMed]
- Petch, J.; Di, S.; Nelson, W. Opening the Black Box: The Promise and Limitations of Explainable Machine Learning in Cardiology. Can. J. Cardiol. 2022, 38, 204–213. [Google Scholar] [CrossRef]
- Buhlmann, P.; Hothorn, T. Boosting Algorithms: Regularization, Prediction and Model Fitting. Stat. Sci. 2007, 22, 477–505. [Google Scholar] [CrossRef]
- Tibshirani, R. Regression Shrinkage and Selection via the Lasso. J. R. Stat. Society. Ser. B (Methodol.) 1996, 58, 267–288. [Google Scholar] [CrossRef]
- Friedman, J.H. Multivariate Adaptive Regression Splines. Ann. Statist. 1991, 19, 1–67. [Google Scholar] [CrossRef]
- Rodriguez-Galiano, V.F.; Luque-Espinar, J.A.; Chica-Olmo, M.; Mendes, M.P. Feature selection approaches for predictive modelling of groundwater nitrate pollution: An evaluation of filters, embedded and wrapper methods. Sci. Total Environ. 2018, 624, 661–672. [Google Scholar] [CrossRef] [PubMed]
- Liew, B.X.W.; Kovacs, F.M.; Rügamer, D.; Royuela, A. Machine learning versus logistic regression for prognostic modelling in individuals with non-specific neck pain. Eur. Spine J. 2022, 31, 2082–2091. [Google Scholar] [CrossRef] [PubMed]
- Bagherzadeh-Khiabani, F.; Ramezankhani, A.; Azizi, F.; Hadaegh, F.; Steyerberg, E.W.; Khalili, D. A tutorial on variable selection for clinical prediction models: Feature selection methods in data mining could improve the results. J. Clin. Epidemiol. 2016, 71, 76–85. [Google Scholar] [CrossRef] [PubMed]
- Moons, K.G.M.; Altman, D.G.; Reitsma, J.B.; Ioannidis, J.P.A.; Macaskill, P.; Steyerberg, E.W.; Vickers, A.J.; Ransohoff, D.F.; Collins, G.S. Transparent Reporting of a multivariable prediction model for Individual Prognosis Or Diagnosis (TRIPOD): Explanation and Elaboration. Ann. Intern. Med. 2015, 162, W1–W73. [Google Scholar] [CrossRef]
- Harrell, F. Regression Modeling Strategies with Applications to Linear Models, Logistics Regression, and Survival Analysis; Springer: New York, NY, USA, 2001. [Google Scholar]
- Kovacs, F.M.; Bagó, J.; Royuela, A.; Seco, J.; Giménez, S.; Muriel, A.; Abraira, V.; Martín, J.L.; Peña, J.L.; Gestoso, M.; et al. Psychometric characteristics of the Spanish version of instruments to measure neck pain disability. BMC Musculoskelet. Disord. 2008, 9, 42. [Google Scholar] [CrossRef] [PubMed]
- Kovacs, F.M.; Seco, J.; Royuela, A.; Melis, S.; Sánchez, C.; Díaz-Arribas, M.J.; Meli, M.; Núñez, M.; Martínez-Rodríguez, M.E.; Fernández, C.; et al. Patients with neck pain are less likely to improve if they experience poor sleep quality: A prospective study in routine practice. Clin. J. Pain 2015, 31, 713–721. [Google Scholar] [CrossRef] [PubMed]
- Royuela, A.; Kovacs, F.M.; Campillo, C.; Casamitjana, M.; Muriel, A.; Abraira, V. Predicting outcomes of neuroreflexotherapy in patients with subacute or chronic neck or low back pain. Spine J. 2014, 14, 1588–1600. [Google Scholar] [CrossRef]
- van Buuren, S.; Groothuis-Oudshoorn, K. mice: Multivariate Imputation by Chained Equations in R. J. Stat. Softw. 2011, 45, 1–67. [Google Scholar] [CrossRef]
- Zambom, A.Z.; Kim, J. Consistent significance controlled variable selection in high-dimensional regression. Stat 2018, 7, e210. [Google Scholar] [CrossRef]
- Yoav, B.; Daniel, Y. The control of the false discovery rate in multiple testing under dependency. Ann. Stat. 2001, 29, 1165–1188. [Google Scholar] [CrossRef]
- Akaike, H. A new look at the statistical model identification. IEEE Trans. Autom. Control 1974, 19, 716–723. [Google Scholar] [CrossRef]
- Zhu, J.; Hu, L.; Huang, J.; Jiang, K.; Zhang, Y.; Lin, S.; Zhu, J.; Wang, X. abess: A Fast Best Subset Selection Library in Python and R. arXiv 2021, arXiv:2110.09697. [Google Scholar]
- Ford, J.J.; Richards, M.C.; Surkitt, L.D.; Chan, A.Y.P.; Slater, S.L.; Taylor, N.F.; Hahne, A.J. Development of a Multivariate Prognostic Model for Pain and Activity Limitation in People With Low Back Disorders Receiving Physiotherapy. Arch. Phys. Med. Rehabil. 2018, 99, 2504–2512.e2512. [Google Scholar] [CrossRef] [PubMed]
- Vos, C.J.; Verhagen, A.P.; Passchier, J.; Koes, B.W. Clinical course and prognostic factors in acute neck pain: An inception cohort study in general practice. Pain Med. 2008, 9, 572–580. [Google Scholar] [CrossRef] [PubMed]
- Liew, B.X.W.; Peolsson, A.; Rugamer, D.; Wibault, J.; Löfgren, H.; Dedering, A.; Zsigmond, P.; Falla, D. Clinical predictive modelling of post-surgical recovery in individuals with cervical radiculopathy: A machine learning approach. Sci. Rep. 2020, 10, 16782. [Google Scholar] [CrossRef]
- Zhu, J.; Wen, C.; Zhu, J.; Zhang, H.; Wang, X. A polynomial algorithm for best-subset selection problem. Proc. Natl. Acad. Sci. USA 2020, 117, 33117–33123. [Google Scholar] [CrossRef] [PubMed]
- Desboulets, L.D.D. A Review on Variable Selection in Regression Analysis. Econometrics 2018, 6, 45. [Google Scholar] [CrossRef]
- Sanchez-Pinto, L.N.; Venable, L.R.; Fahrenbach, J.; Churpek, M.M. Comparison of variable selection methods for clinical predictive modeling. Int. J. Med. Inf. 2018, 116, 10–17. [Google Scholar] [CrossRef]
- Hastie, T.; Tibshirani, R.; Tibshirani, R. Best Subset, Forward Stepwise or Lasso? Analysis and Recommendations Based on Extensive Comparisons. Stat. Sci. 2020, 35, 579–592, 514. [Google Scholar] [CrossRef]
- Heinze, G.; Wallisch, C.; Dunkler, D. Variable selection—A review and recommendations for the practicing statistician. Biom. J. 2018, 60, 431–449. [Google Scholar] [CrossRef]
- Trevor, H. Comment: Boosting Algorithms: Regularization, Prediction and Model Fitting. Stat. Sci. 2007, 22, 513–515. [Google Scholar] [CrossRef]
- Hofner, B.; Boccuto, L.; Göker, M. Controlling false discoveries in high-dimensional situations: Boosting with stability selection. BMC Bioinform. 2015, 16, 144. [Google Scholar] [CrossRef] [PubMed]
- Bolón-Canedo, V.; Alonso-Betanzos, A. Ensembles for feature selection: A review and future trends. Inf. Fusion. 2019, 52, 1–12. [Google Scholar] [CrossRef]
- Bertsimas, D.; Dunn, J. Optimal classification trees. Mach. Learn. 2017, 106, 1039–1082. [Google Scholar] [CrossRef]
- Klusowski, J.M. Analyzing cart. arXiv 2019, arXiv:1906.10086. [Google Scholar]
- Berk, R.; Brown, L.; Buja, A.; Zhang, K.; Zhao, L. Valid post-selection inference. Ann. Stat. 2013, 41, 802–837. [Google Scholar] [CrossRef]
- Rügamer, D.; Greven, S. Selective inference after likelihood- or test-based model selection in linear models. Stat. Probab. Lett. 2018, 140, 7–12. [Google Scholar] [CrossRef]
- Cun-Hui, Z. Nearly unbiased variable selection under minimax concave penalty. Ann Stat. 2010, 38, 894–942. [Google Scholar]
- Breheny, P.; Huang, J. Coordinate descent algorithms for nonconvex penalized regression, with applications to biological feature selection. Ann. Appl. Stat. 2011, 5, 232–253. [Google Scholar] [CrossRef]


| Variable | Total |
|---|---|
| Neck pain improvement | |
| N-Miss | 238 |
| No | 757 (27.4) |
| Yes | 2006 (72.6) |
| Arm pain improvement | |
| N-Miss | 1061 |
| No | 568 (29.28) |
| Yes | 1372 (70.72) |
| Disability improvement | |
| N-Miss | 1796 |
| No | 600 (49.79) |
| Yes | 605 (50.21) |
| Sex | |
| N-Miss | 48 |
| Male | 726 (24.59) |
| Female | 2227 (75.41) |
| Age (years) | |
| N-Miss | 21 |
| Mean (SD) | 50.29 (15.86) |
| Employment | |
| N-Miss | 376 |
| Not applicable | 1199 (45.68) |
| Not working | 197 (7.5) |
| Working | 1229 (46.82) |
| Pain duration (days) | |
| N-Miss | 165 |
| Mean (SD) | 493.4 (989.43) |
| Time since first episode (years) | |
| N-Miss | 120 |
| <1 | 648 (22.49) |
| 1–5 | 984 (34.15) |
| 5–10 | 677 (23.5) |
| >10 | 572 (19.85) |
| Chronicity | |
| Acute | 971 (32.36) |
| Chronic | 2030 (67.64) |
| Baseline neck pain | |
| N-Miss | 28 |
| Mean (SD) | 6.56 (2.25) |
| Baseline arm pain | |
| N-Miss | 80 |
| Mean (SD) | 4.47 (3.38) |
| Baseline disability | |
| N-Miss | 1194 |
| Mean (SD) | 30.84 (22.41) |
| Xray diagnosis | |
| No | 2302 (76.71) |
| Yes | 699 (23.29) |
| MRI diagnosis | |
| No | 2399 (79.94) |
| Yes | 602 (20.06) |
| Imaging findings of disc degeneration | |
| No | 1666 (55.51) |
| Yes | 1335 (44.49) |
| Imaging findings of facet degeneration | |
| No | 2771 (92.34) |
| Yes | 230 (7.66) |
| Imaging findings of scoliosis | |
| No | 2866 (95.5) |
| Yes | 135 (4.5) |
| Imaging findings of spinal stenosis | |
| No | 2938 (97.9) |
| Yes | 63 (2.1) |
| Imaging findings of disc protrusion | |
| No | 2731 (91) |
| Yes | 270 (9) |
| Imaging findings of disc herniation | |
| No | 2483 (82.74) |
| Yes | 518 (17.26) |
| Clinical diagnosis | |
| Disc protrusion/herniation | 665 (22.16) |
| Spinal stenosis | 63 (2.1) |
| Non-specific | 2273 (75.74) |
| Pharmacological: analgesics | |
| No | 1042 (34.72) |
| Yes | 1959 (65.28) |
| Pharmacological: NSAIDS | |
| No | 1175 (39.15) |
| Yes | 1826 (60.85) |
| Pharmacological: steroids | |
| No | 2811 (93.67) |
| Yes | 190 (6.33) |
| Pharmacological: muscle relaxants | |
| No | 2265 (75.47) |
| Yes | 736 (24.53) |
| Pharmacological: opioids | |
| No | 2949 (98.27) |
| Yes | 52 (1.73) |
| Pharmacological: other | |
| No | 2328 (77.57) |
| Yes | 673 (22.43) |
| Nonpharmacological treatment | |
| No | 2587 (86.2) |
| Yes | 414 (13.8) |
| Neuroreflexotherapy | |
| No | 421 (14.03) |
| Yes | 2580 (85.97) |
| Variables | stepP | stepPAdj | stepAIC | Best Subset | LASSO | LASSO Refit | MCP | mboost | mboost Refit | MuARS | Number |
|---|---|---|---|---|---|---|---|---|---|---|---|
| Sex—female | −0.244 | −0.200 | −0.198 | −0.149 | −0.210 | −0.198 | −0.128 | −0.210 | 6 | ||
| Age (years) | 0.090 | 0.019 | 0.070 | 0.090 | 0.002 | 0.070 | 4 | ||||
| Employment—not working | −0.461 | −0.521 | −0.538 | −0.497 | −0.437 | −0.495 | −0.498 | −0.416 | −0.495 | −0.531 | 8 |
| Employment—working | 0.150 | 0.127 | 0.163 | 0.210 | 0.141 | 0.180 | 0.210 | 0.125 | 0.180 | 7 | |
| Duration of pain (days) | 0.084 | 0.084 | 0.030 | 0.071 | 0.084 | 0.017 | 0.071 | 5 | |||
| Time since first episode (years)—1–5 | −0.359 | −0.366 | −0.388 | −0.144 | −0.241 | −0.387 | −0.112 | −0.241 | 6 | ||
| Time since first episode (years)—5–10 | −0.233 | −0.234 | −0.270 | −0.269 | 4 | ||||||
| Time since first episode (years)—>10 | −0.569 | −0.599 | −0.648 | −0.314 | −0.469 | −0.648 | −0.260 | −0.469 | −0.312 | 7 | |
| Chronicity—chronic | −0.555 | −0.540 | −0.527 | −0.411 | −0.536 | −0.528 | −0.366 | −0.536 | −0.537 | 7 | |
| Baseline intensity of neck pain | 0.163 | 0.236 | 0.225 | 0.178 | 0.222 | 0.225 | 0.161 | 0.222 | 0.240 | 7 | |
| Baseline intensity of arm pain | −0.165 | −0.163 | −0.115 | −0.162 | −0.163 | −0.099 | −0.162 | −0.182 | 6 | ||
| Baseline disability | −0.247 | −0.237 | −0.224 | −0.217 | −0.201 | −0.216 | −0.217 | −0.193 | −0.216 | −0.270 | 8 |
| Diagnostic procedure: X-ray—yes | 0.211 | 0.212 | 0.167 | 0.205 | 0.212 | 0.153 | 0.205 | 5 | |||
| Diagnostic procedure: MRI-yes | −0.052 | −0.052 | 2 | ||||||||
| Imaging findings: disc degeneration—yes | −0.242 | −0.293 | −0.191 | −0.144 | −0.185 | −0.191 | −0.129 | −0.185 | 6 | ||
| Imaging findings: facet joint degeneration—yes | −0.449 | −0.427 | −0.358 | −0.441 | −0.426 | −0.331 | −0.441 | −0.414 | 6 | ||
| Imaging findings: scoliosis—yes | 0.447 | 0.469 | 0.301 | 0.460 | 0.469 | 0.247 | 0.460 | 5 | |||
| Imaging findings: spinal stenosis—yes | 0.133 | 0.132 | 2 | ||||||||
| Imaging findings: disc protrusion—yes | −0.275 | −0.228 | −0.207 | −0.234 | −0.227 | −0.198 | −0.234 | 5 | |||
| Imaging findings: disc herniation—yes | −0.313 | −0.302 | −0.253 | −0.234 | −0.258 | −0.253 | −0.223 | −0.258 | −0.305 | 7 | |
| Pharmacological treatment: analgesics—yes | 0.007 | 1 | |||||||||
| Pharmacological treatment: NSAIDs—yes | 0.161 | 0.146 | 0.082 | 0.137 | 0.149 | 0.063 | 0.137 | 5 | |||
| Pharmacological treatment: steroids—yes | −0.207 | −0.047 | −0.161 | −0.206 | −0.012 | −0.161 | 4 | ||||
| Pharmacological treatment: muscle relaxants—yes | 0.136 | 0.054 | 0.127 | 0.137 | 0.029 | 0.127 | 4 | ||||
| Pharmacological treatment: opioids—yes | 0.251 | 0.102 | 0.305 | 0.252 | 0.037 | 0.305 | 4 | ||||
| Pharmacological treatment: other treatments—yes | 0.089 | 0.089 | 2 | ||||||||
| Nonpharmacological treatments—yes | −0.059 | −0.059 | 2 | ||||||||
| NRT | 1.987 | 2.343 | 2.239 | 2.186 | 2.031 | 2.136 | 2.186 | 1.987 | 2.136 | 2.296 | 8 |
| Number | 11 | 6 | 18 | 28 | 22 | 22 | 27 | 22 | 22 | 9 |
| Variables | stepP | stepPAdj | stepAIC | Best Subset | LASSO | LASSO Refit | MCP | mboost | mboost Refit | MuARS | Number |
|---|---|---|---|---|---|---|---|---|---|---|---|
| Sex—female | 0 | ||||||||||
| Age (years) | 0 | ||||||||||
| Employment—not working | −0.538 | −0.454 | −0.429 | −0.364 | −0.481 | −0.458 | −0.312 | −0.486 | −0.429 | 7 | |
| Employment—working | 0.189 | −0.008 | 0.026 | −0.025 | 3 | ||||||
| Duration of pain (days) | 0.010 | 0.055 | 0.013 | 2 | |||||||
| Time since first episode (years)—1–5 | −0.261 | −0.064 | −0.273 | −0.262 | −0.003 | −0.260 | 4 | ||||
| Time since first episode (years)—5–10 | −0.533 | −0.350 | −0.314 | −0.559 | −0.538 | −0.238 | −0.539 | −0.350 | 6 | ||
| Time since first episode (years)—>10 | −0.726 | −0.542 | −0.511 | −0.762 | −0.732 | −0.430 | −0.729 | −0.542 | 6 | ||
| Chronicity—chronic | −0.529 | −0.538 | −0.462 | −0.572 | −0.541 | −0.425 | −0.536 | −0.538 | 6 | ||
| Baseline intensity of neck pain | −0.428 | −0.407 | −0.384 | −0.384 | −0.318 | −0.381 | −0.381 | −0.296 | −0.381 | −0.384 | 8 |
| Baseline intensity of arm pain | 0.623 | 0.608 | 0.744 | 0.742 | 0.689 | 0.748 | 0.744 | 0.666 | 0.747 | 0.742 | 8 |
| Baseline disability | −0.336 | −0.339 | −0.334 | −0.363 | −0.346 | −0.321 | −0.360 | −0.339 | 6 | ||
| Diagnostic procedure: X-ray—yes | 0 | ||||||||||
| Diagnostic procedure: MRI—yes | 0 | ||||||||||
| Imaging findings: disc degeneration—yes | −0.307 | −0.317 | −0.271 | −0.280 | −0.300 | −0.260 | −0.293 | −0.317 | 6 | ||
| Imaging findings: facet joint degeneration—yes | −0.038 | −0.068 | −0.029 | −0.071 | 2 | ||||||
| Imaging findings: scoliosis—yes | 0.082 | 0.198 | 0.014 | 0.044 | 0.191 | 3 | |||||
| Imaging findings: spinal stenosis—yes | −0.220 | −0.304 | −0.149 | −0.187 | −0.321 | 3 | |||||
| Imaging findings: disc protrusion—yes | 0.131 | 0.242 | 0.133 | 0.098 | 0.229 | 3 | |||||
| Imaging findings: disc herniation—yes | −0.353 | −0.350 | −0.308 | −0.358 | −0.355 | −0.292 | −0.351 | −0.350 | 6 | ||
| Pharmacological treatment: analgesics—yes | 0.329 | 0.321 | 0.191 | 0.234 | 0.288 | 0.177 | 0.229 | 0.321 | 6 | ||
| Pharmacological treatment: NSAIDs—yes | 0.227 | 0.111 | 0.141 | 0.063 | 0.099 | 0.134 | 4 | ||||
| Pharmacological treatment: steroids—yes | 0 | ||||||||||
| Pharmacological treatment: muscle relaxants—yes | 0.059 | 0.104 | 0.039 | 0.042 | 0.108 | 3 | |||||
| Pharmacological treatment: opioids-yes | 0.792 | 0.793 | 0.605 | 0.792 | 0.731 | 0.547 | 0.796 | 0.793 | 6 | ||
| Pharmacological treatment: other treatments—yes | −0.262 | −0.310 | 2 | ||||||||
| Nonpharmacological treatments—yes | 0.008 | 0.053 | 1 | ||||||||
| NRT | 2.639 | 2.695 | 3.525 | 3.447 | 3.218 | 3.549 | 3.534 | 3.101 | 3.554 | 3.447 | 8 |
| Number | 7 | 4 | 14 | 12 | 21 | 21 | 19 | 20 | 20 | 12 |
| Variables | stepP | stepPAdj | stepAIC | Best Subset | LASSO | LASSO Refit | MCP | mboost | mboost Refit | MuARS | Number |
|---|---|---|---|---|---|---|---|---|---|---|---|
| Sex—female | 0.232 | 0.108 | 0.096 | 0.108 | 0.099 | 0.063 | 0.108 | 5 | |||
| Age (years) | 0.193 | 0.159 | 0.198 | 0.204 | 0.186 | 0.203 | 0.201 | 0.137 | 0.203 | 0.157 | 8 |
| Employment—not working | 0.149 | 0.042 | −0.327 | −0.312 | −0.291 | −0.310 | −0.310 | −0.236 | −0.309 | 7 | |
| Employment—working | 0.422 | 0.397 | 0.276 | 0.276 | 0.264 | 0.278 | 0.278 | 0.223 | 0.278 | 0.252 | 8 |
| Duration of pain (days) | −0.151 | −0.135 | −0.139 | −0.139 | −0.142 | −0.141 | −0.129 | −0.142 | −0.158 | 7 | |
| Time since first episode (years)—1–5 | −0.431 | −0.440 | −0.394 | −0.438 | −0.438 | −0.265 | −0.438 | 5 | |||
| Time since first episode (years)—5–10 | −0.385 | −0.395 | −0.341 | −0.393 | −0.393 | −0.188 | −0.393 | 5 | |||
| Time since first episode (years)—>10 | −0.474 | −0.482 | −0.421 | −0.479 | −0.477 | −0.251 | −0.479 | 5 | |||
| Chronicity—chronic | −0.389 | −0.400 | −0.386 | −0.400 | −0.397 | −0.345 | −0.400 | −0.405 | 6 | ||
| Baseline intensity of neck pain | 0.096 | 0.090 | 0.084 | 0.089 | 0.088 | 0.068 | 0.089 | 5 | |||
| Baseline intensity of arm pain | −0.175 | −0.386 | −0.394 | −0.381 | −0.393 | −0.394 | −0.344 | −0.393 | −0.359 | 7 | |
| Baseline disability | 0.426 | 0.433 | 0.421 | 0.433 | 0.432 | 0.387 | 0.433 | 0.447 | 6 | ||
| Diagnostic procedure: X-ray—yes | 0.357 | 0.305 | 0.296 | 0.289 | 0.299 | 0.298 | 0.257 | 0.300 | 0.294 | 7 | |
| Diagnostic procedure: MRI—yes | 0.270 | 0.000 | 0.011 | 2 | |||||||
| Imaging findings: disc degeneration—yes | −0.338 | −0.319 | −0.303 | −0.318 | −0.322 | −0.256 | −0.319 | −0.296 | 6 | ||
| Imaging findings: facet joint degeneration—yes | −0.820 | −0.756 | −0.770 | −0.790 | −0.766 | −0.790 | −0.786 | −0.699 | −0.790 | −0.776 | 8 |
| Imaging findings: scoliosis—yes | 0.588 | 0.653 | 0.547 | 0.543 | 0.509 | 0.540 | 0.538 | 0.417 | 0.540 | 0.493 | 8 |
| Imaging findings: spinal stenosis—yes | −1.420 | −1.331 | −1.777 | −1.761 | −1.703 | −1.763 | −1.758 | −1.540 | −1.761 | −1.628 | 8 |
| Imaging findings: disc protrusion—yes | −0.640 | −0.654 | −0.676 | −0.679 | −0.669 | −0.683 | −0.684 | −0.631 | −0.682 | −0.692 | 8 |
| Imaging findings: disc herniation—yes | 0.211 | 0.211 | 0.187 | 0.209 | 0.212 | 0.114 | 0.212 | 5 | |||
| Pharmacological treatment: analgesics—yes | −0.075 | −0.030 | −0.039 | −0.001 | −0.039 | 3 | |||||
| Pharmacological treatment: NSAIDs—yes | −0.060 | −0.069 | −0.076 | −0.037 | −0.068 | 3 | |||||
| Pharmacological treatment: steroids—yes | 0.297 | 0.271 | 0.296 | 0.293 | 0.198 | 0.296 | 0.419 | 5 | |||
| Pharmacological treatment: muscle relaxants—yes | 0.373 | 0.227 | 0.227 | 0.225 | 0.239 | 0.235 | 0.180 | 0.239 | 6 | ||
| Pharmacological treatment: opioids—yes | −0.226 | −0.190 | −0.224 | −0.134 | −0.089 | −0.224 | 4 | ||||
| Pharmacological treatment: other treatments—yes | 0.262 | 0.198 | 0.193 | 0.201 | 0.198 | 0.166 | 0.203 | 5 | |||
| Nonpharmacological treatments—yes | −0.203 | −0.225 | −0.200 | −0.222 | −0.223 | −0.141 | −0.220 | 5 | |||
| NRT | 1.200 | 1.254 | 1.224 | 1.252 | 1.253 | 1.141 | 1.253 | 1.238 | 6 | ||
| Number | 12 | 8 | 22 | 26 | 28 | 28 | 26 | 27 | 27 | 14 |
Disclaimer/Publisher’s Note: The statements, opinions and data contained in all publications are solely those of the individual author(s) and contributor(s) and not of MDPI and/or the editor(s). MDPI and/or the editor(s) disclaim responsibility for any injury to people or property resulting from any ideas, methods, instructions or products referred to in the content. |
© 2023 by the authors. Licensee MDPI, Basel, Switzerland. This article is an open access article distributed under the terms and conditions of the Creative Commons Attribution (CC BY) license (https://creativecommons.org/licenses/by/4.0/).
Share and Cite
Liew, B.X.W.; Kovacs, F.M.; Rügamer, D.; Royuela, A. Automatic Variable Selection Algorithms in Prognostic Factor Research in Neck Pain. J. Clin. Med. 2023, 12, 6232. https://doi.org/10.3390/jcm12196232
Liew BXW, Kovacs FM, Rügamer D, Royuela A. Automatic Variable Selection Algorithms in Prognostic Factor Research in Neck Pain. Journal of Clinical Medicine. 2023; 12(19):6232. https://doi.org/10.3390/jcm12196232
Chicago/Turabian StyleLiew, Bernard X. W., Francisco M. Kovacs, David Rügamer, and Ana Royuela. 2023. "Automatic Variable Selection Algorithms in Prognostic Factor Research in Neck Pain" Journal of Clinical Medicine 12, no. 19: 6232. https://doi.org/10.3390/jcm12196232
APA StyleLiew, B. X. W., Kovacs, F. M., Rügamer, D., & Royuela, A. (2023). Automatic Variable Selection Algorithms in Prognostic Factor Research in Neck Pain. Journal of Clinical Medicine, 12(19), 6232. https://doi.org/10.3390/jcm12196232