
Comparison of Corvis ST Parameters between Primary Open-Angle Glaucoma and Primary Angle-Closure Glaucoma

 , ,
, ,  ,
,
Abstract
1. Introduction
2. Materials and Methods
2.1. POAG and PACG Patients
2.2. Corvis ST Tonometer Measurement
2.3. Other Measurements
2.4. Statistical Analysis
3. Results
4. Discussion
5. Conclusions
Author Contributions
Funding
Institutional Review Board Statement
Informed Consent Statement
Data Availability Statement
Conflicts of Interest
References
- Quigley, H.A. Glaucoma. Lancet 2011, 377, 1367–1377. [Google Scholar] [CrossRef] [PubMed]
- Weinreb, R.N.; Khaw, P.T. Primary open-angle glaucoma. Lancet 2004, 363, 1711–1720. [Google Scholar] [CrossRef] [PubMed]
- The Advanced Glaucoma Intervention Study (AGIS): 7. The relationship between control of intraocular pressure and visual field deterioration. The AGIS Investigators. Am. J. Ophthalmol. 2000, 130, 429–440. [Google Scholar] [CrossRef] [PubMed]
- Kingman, S. Glaucoma is second leading cause of blindness globally. Bull. World Health Organ. 2004, 82, 887–888. [Google Scholar] [PubMed]
- Holmin, C.; Thorburn, W.; Krakau, C.E. Treatment versus no treatment in chronic open angle glaucoma. Acta Ophthalmol. 1988, 66, 170–173. [Google Scholar] [CrossRef]
- Jonas, J.B.; Holbach, L. Central corneal thickness and thickness of the lamina cribrosa in human eyes. Investig. Ophthalmol. Vis. Sci. 2005, 46, 1275–1279. [Google Scholar] [CrossRef]
- Matsuura, M.; Hirasawa, K.; Murata, H.; Nakakura, S.; Kiuchi, Y.; Asaoka, R. Using Corvis ST tonometry to assess glaucoma progression. PLoS ONE 2017, 12, e0176380. [Google Scholar] [CrossRef]
- Asaoka, R.; Nakakura, S.; Tabuchi, H.; Murata, H.; Nakao, Y.; Ihara, N.; Rimayanti, U.; Aihara, M.; Kiuchi, Y. The relationship between Corvis ST tonometry measured corneal parameters and intraocular pressure, corneal thickness and corneal curvature. PLoS ONE 2015, 10, e0140385. [Google Scholar]
- Miki, A.; Yasukura, Y.; Weinreb, R.N.; Yamada, T.; Koh, S.; Asai, T.; Ikuno, Y.; Maeda, N.; Nishida, K. Dynamic Scheimpflug ocular biomechanical parameters in healthy and medically controlled glaucoma eyes. J. Glaucoma 2019, 28, 588–592. [Google Scholar] [CrossRef]
- Tham, Y.C.; Li, X.; Wong, T.Y.; Quigley, H.A.; Aung, T.; Cheng, C.Y. Global prevalence of glaucoma and projections of glaucoma burden through 2040: A systematic review and meta-analysis. Ophthalmology 2014, 121, 2081–2090. [Google Scholar] [CrossRef]
- Salowe, R.; Salinas, J.; Farbman, N.H.; Mohammed, A.; Warren, J.Z.; Rhodes, A.; Brucker, A.; Regina, M.; Miller-Ellis, E.; Sankar, P.S.; et al. Primary Open-Angle Glaucoma in Individuals of African Descent: A Review of Risk Factors. J. Clin. Exp. Ophthalmol. 2015, 6, 450. [Google Scholar] [PubMed]
- Actis, A.G.; Dall’Orto, L.; Penna, R.; Brogliatti, B.; Rolle, T. An internal medicine perspective review of risk factors for assessing and progression of primary open angle glaucoma. Minerva Med. 2013, 104, 471–485. [Google Scholar] [PubMed]
- Omoti, A.E.; Edema, O.T. A review of the risk factors in primary open angle glaucoma. Niger. J. Clin. Pract. 2007, 10, 79–82. [Google Scholar]
- Sun, X.; Dai, Y.; Chen, Y.; Yu, D.-Y.; Cringle, S.J.; Chen, J.; Kong, X.; Wang, X.; Jiang, C. Primary angle closure glaucoma: What we know and what we don’t know. Prog. Retin. Eye Res. 2017, 57, 26–45. [Google Scholar] [CrossRef] [PubMed]
- Gazzard, G.; Foster, P.J.; Viswanathan, A.C.; Devereux, J.G.; Oen, F.T.; Chew, P.T.; Khaw, P.T.; Seah, S.K. The severity and spatial distribution of visual field defects in primary glaucoma: A comparison of primary open-angle glaucoma and primary angle-closure glaucoma. Arch. Ophthalmol. 2002, 120, 1636–1643. [Google Scholar] [CrossRef]
- Qu, W.; Li, Y.; Song, W.; Zhou, X.; Kang, Y.; Yan, L.; Sui, H.; Yuan, H. Prevalence and risk factors for angle-closure disease in a rural Northeast China population: A population-based survey in Bin County, Harbin. Acta Ophthalmol. 2011, 89, 515–520. [Google Scholar] [CrossRef]
- Prasad, S.; Kamath, G.G.; Clearkin, L.G. Primary angle-closure glaucoma in India. Lancet 1998, 352, 146. [Google Scholar] [CrossRef]
- Shen, L.; Melles, R.B.; Metlapally, R.; Barcellos, L.; Schaefer, C.; Risch, N.; Herrinton, L.J.; Wildsoet, C.; Jorgenson, E. The Association of Refractive Error with Glaucoma in a Multiethnic Population. Ophthalmology 2016, 123, 92–101. [Google Scholar] [CrossRef]
- Quigley, H.A.; Broman, A.T. The number of people with glaucoma worldwide in 2010 and 2020. Br. J. Ophthalmol. 2006, 90, 262–267. [Google Scholar] [CrossRef]
- Friedman, D.S.; Foster, P.J.; Aung, T.; He, M. Angle closure and angle-closure glaucoma: What we are doing now and what we will be doing in the future. Clin. Exp. Ophthalmol. 2012, 40, 381–387. [Google Scholar]
- Lichter, P.R.; Musch, D.C.; Gillespie, B.W.; Guire, K.E.; Janz, N.K.; Wren, P.A.; Mills, R.P.; CIGTS Study Group. Interim clinical outcomes in the Collaborative Initial Glaucoma Treatment Study comparing initial treatment randomized to medications or surgery. Ophthalmology 2001, 108, 1943–1953. [Google Scholar] [CrossRef]
- Heijl, A.; Leske, M.C.; Bengtsson, B.; Hyman, L.; Bengtsson, B.; Hussein, M.; Early Manifest Glaucoma Trial Group. Reduction of intraocular pressure and glaucoma progression: Results from the Early Manifest Glaucoma Trial. Arch. Ophthalmol. 2002, 120, 1268–1279. [Google Scholar] [CrossRef]
- Brubaker, R.F. Delayed functional loss in glaucoma. LII Edward Jackson Memorial Lecture. Am. J. Ophthalmol. 1996, 121, 473–483. [Google Scholar] [CrossRef] [PubMed]
- Uchida, H.; Yamamoto, T.; Tomita, G.; Kitazawa, Y. Peripapillary atrophy in primary angle-closure glaucoma: A comparative study with primary open-angle glaucoma. Am. J. Ophthalmol. 1999, 127, 121–128. [Google Scholar] [CrossRef] [PubMed]
- Yousefi, S.; Sakai, H.; Murata, H.; Fujino, Y.; Garway-Heath, D.; Weinreb, R.; Asaoka, R. Asymmetric patterns of visual field defect in primary open-angle and primary angle-closure glaucoma. Investig. Ophthalmol. Vis. Sci. 2018, 59, 1279–1287. [Google Scholar] [CrossRef]
- Boland, M.V.; Zhang, L.; Broman, A.T.; Jampel, H.D.; Quigley, H.A. Comparison of optic nerve head topography and visual field in eyes with open-angle and angle-closure glaucoma. Ophthalmology 2008, 115, 239–245. [Google Scholar] [CrossRef]
- Ngo, C.S.; Aquino, M.C.; Noor, S.; Loon, S.C.; Sng, C.C.; Gazzard, G.; Wong, W.L.; Chew, P.T. A prospective comparison of chronic primary angle-closure glaucoma versus primary open-angle glaucoma in Singapore. Singap. Med. J. 2013, 54, 140–145. [Google Scholar] [CrossRef] [PubMed]
- Koprowski, R. Automatic method of analysis and measurement of additional parameters of corneal deformation in the Corvis tonometer. Biomed. Eng. Online 2014, 13, 150. [Google Scholar] [CrossRef] [PubMed]
- Baayen, R.H.; Davidson, D.J.; Bates, D.M. Mixed-effects modeling with crossed random effects for subjects and items. J. Mem. Lang. 2008, 59, 390–412. [Google Scholar] [CrossRef]
- Bates, D.; Mächler, M.; Bolker, B.M.; Walker, S.C. Fitting linear mixed-effects models using lme4. J. Stat. Softw. 2015, 67, 1–48. [Google Scholar] [CrossRef]
- Kiuchi, Y.; Kaneko, M.; Mochizuki, H.; Takenaka, J.; Yamada, K.; Tanaka, J. Corneal displacement during tonometry with a noncontact tonometer. Jpn. J. Ophthalmol. 2012, 56, 273–279. [Google Scholar] [CrossRef]
- Moghimi, S.; Torabi, H.; Hashemian, H.; Amini, H.; Lin, S. Central corneal thickness in primary angle closure and open angle glaucoma. J. Ophthalmic. Vis. Res. 2014, 9, 439–443. [Google Scholar] [PubMed]
- Muhsen, S.; Alkhalaileh, F.; Hamdan, M.; AlRyalat, S.A. Central corneal thickness in a Jordanian population and its association with different types of Glaucoma: Cross-sectional study. BMC Ophthalmol. 2018, 18, 279. [Google Scholar] [CrossRef]
- Pang, C.E.; Lee, K.Y.; Su, D.H.; Htoon, H.M.; Ng, J.Y.; Kumar, R.S.; Aung, T. Central corneal thickness in Chinese subjects with primary angle closure glaucoma. J. Glaucoma 2011, 20, 401–404. [Google Scholar] [CrossRef]
- Juliano, J.; Burkemper, B.; Lee, J.; Nelson, A.; LeTran, V.; Chu, Z.; Zhou, G.; Jiang, X.; Wang, R.K.; Varma, R.; et al. Longer Axial Length Potentiates Relationship of Intraocular Pressure and Peripapillary Vessel Density in Glaucoma Patients. Investig. Ophthalmol. Vis. Sci. 2021, 62, 37. [Google Scholar] [CrossRef] [PubMed]
- Miki, A.; Maeda, N.; Ikuno, Y.; Asai, T.; Hara, C.; Nishida, K. Factors associated with corneal deformation responses measured with a dynamic Scheimpflug analyzer. Investig. Ophthalmol. Vis. Sci. 2017, 58, 538–544. [Google Scholar] [CrossRef] [PubMed]
- Anderson, A.J.; Chaurasia, A.K.; Sharma, A.; Gupta, A.; Gupta, S.; Khanna, A.; Gupta, V. Comparison of rates of fast and catastrophic visual field loss in three glaucoma subtypes. Investig. Ophthalmol. Vis. Sci. 2019, 60, 161–167. [Google Scholar] [CrossRef]
- Zhong, Y.; Shen, X.; Yu, J.; Tan, H.; Cheng, Y. The comparison of the effects of latanoprost, travoprost, and bimatoprost on central corneal thickness. Cornea 2011, 30, 861–864. [Google Scholar] [CrossRef]
- Wu, N.; Chen, Y.; Yang, Y.; Sun, X. The changes of corneal biomechanical properties with long-term treatment of prostaglandin analogue measured by Corvis ST. BMC Ophthalmol. 2020, 20, 422. [Google Scholar] [CrossRef]
- Wu, N.; Chen, Y.; Yu, X.; Li, M.; Wen, W.; Sun, X. Changes in Corneal Biomechanical Properties after Long-Term Topical Prostaglandin Therapy. PLoS ONE 2016, 17, e0155527. [Google Scholar] [CrossRef]
- Shen, S.R.; Fleming, G.P.; Jain, S.G.; Roberts, C.J. A Review of Corneal Biomechanics and Scleral Stiffness in Topical Prostaglandin Analog Therapy for Glaucoma. Curr. Eye Res. 2023, 48, 172–181. [Google Scholar] [CrossRef] [PubMed]

| Parameters | POAG | PACG | p-Value |
|---|---|---|---|
| Patients | 54 | 51 | - |
| Eyes | 89 | 83 | - |
| Age (years) | 72.02 (5.91) | 72.52 (9.95) | 0.85 |
| Sex (% female) | 26/28 (51.8%) | 13 /38 (74.5%) | 0.008 |
| AL (mm) | 24.78 (1.41) | 23.05 (1.08) | <0.001 |
| IOP (mmHg) | 15.45 (3.36) | 16.1 (3.74) | 0.32 |
| CCT (μm) | 530.39 (29.92) | 538.94 (32.51) | 0.12 |
| Parameters | POAG | PACG | p-Value |
|---|---|---|---|
| A1 time | 7.41 (0.35) | 7.36 (0.34) | 0.36 |
| A1 velocity | 0.15 (0.02) | 0.15 (0.02) | 0.47 |
| A1 length | 2.3 (0.17) | 2.38 (0.14) | 0.053 |
| A1 deformation amplitude | 0.13 (0.01) | 0.14 (0.01) | 0.17 |
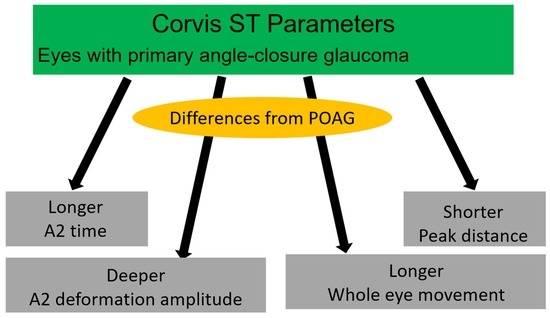
| A2 time | 21.51 (0.55) | 21.76 (0.49) | 0.012 |
| A2 velocity | −0.27 (0.04) | −0.26 (0.03) | 0.068 |
| A2 length | 2.97 (0.61) | 2.92 (0.50) | 0.79 |
| A2 deformation amplitude | 0.43 (0.09) | 0.51 (0.09) | <0.001 |
| HC time | 16.98 (0.60) | 17.08 (0.46) | 0.24 |
| HC length | 6.39 (0.63) | 6.24 (0.56) | 0.14 |
| HC deformation amplitude | 1.10 (0.10) | 1.11 (0.10) | 0.58 |
| Peak distance | 4.98 (0.33) | 4.84 (0.33) | 0.03 |
| Radius | 6.83 (0.67) | 6.79 (0.84) | 0.76 |
| Whole eye movement | 0.33 (0.09) | 0.40 (0.09) | <0.001 |
| Whole eye movement time | 21.74 (0.87) | 22.17 (0.84) | 0.004 |
| Parameters | r | p-Value |
|---|---|---|
| A1 time | 0.04 | 0.53 |
| A1 velocity | −0.02 | 0.72 |
| A1 length | −0.18 | 0.004 |
| A1 deformation amplitude | −0.25 | <0.001 |
| A2 time | −0.16 | 0.01 |
| A2 velocity | −0.27 | <0.001 |
| A2 length | −0.18 | 0.005 |
| A2 deformation amplitude | −0.61 | <0.001 |
| HC time | −0.30 | <0.001 |
| HC length | 0.35 | <0.001 |
| HC deformation amplitude | −0.02 | 0.73 |
| Peak distance | 0.41 | <0.001 |
| Radius | 0.10 | 0.11 |
| Whole eye movement | −0.60 | <0.001 |
| Whole eye movement time | −0.31 | <0.001 |
Disclaimer/Publisher’s Note: The statements, opinions and data contained in all publications are solely those of the individual author(s) and contributor(s) and not of MDPI and/or the editor(s). MDPI and/or the editor(s) disclaim responsibility for any injury to people or property resulting from any ideas, methods, instructions or products referred to in the content. |
© 2023 by the authors. Licensee MDPI, Basel, Switzerland. This article is an open access article distributed under the terms and conditions of the Creative Commons Attribution (CC BY) license (https://creativecommons.org/licenses/by/4.0/).
Share and Cite
Nakaniida, Y.; Tokumo, K.; Onoe, H.; Okada, N.; Nakakura, S.; Asaoka, R.; Kiuchi, Y. Comparison of Corvis ST Parameters between Primary Open-Angle Glaucoma and Primary Angle-Closure Glaucoma. J. Clin. Med. 2023, 12, 5108. https://doi.org/10.3390/jcm12155108
Nakaniida Y, Tokumo K, Onoe H, Okada N, Nakakura S, Asaoka R, Kiuchi Y. Comparison of Corvis ST Parameters between Primary Open-Angle Glaucoma and Primary Angle-Closure Glaucoma. Journal of Clinical Medicine. 2023; 12(15):5108. https://doi.org/10.3390/jcm12155108
Chicago/Turabian StyleNakaniida, Yuta, Kana Tokumo, Hiromitsu Onoe, Naoki Okada, Shunsuke Nakakura, Ryo Asaoka, and Yoshiaki Kiuchi. 2023. "Comparison of Corvis ST Parameters between Primary Open-Angle Glaucoma and Primary Angle-Closure Glaucoma" Journal of Clinical Medicine 12, no. 15: 5108. https://doi.org/10.3390/jcm12155108
APA StyleNakaniida, Y., Tokumo, K., Onoe, H., Okada, N., Nakakura, S., Asaoka, R., & Kiuchi, Y. (2023). Comparison of Corvis ST Parameters between Primary Open-Angle Glaucoma and Primary Angle-Closure Glaucoma. Journal of Clinical Medicine, 12(15), 5108. https://doi.org/10.3390/jcm12155108