
Association between Biomarkers of Inflammation and 10-Year Changes in Aortic Stiffness: The Multi-Ethnic Study of Atherosclerosis

Abstract
1. Introduction
2. Methods
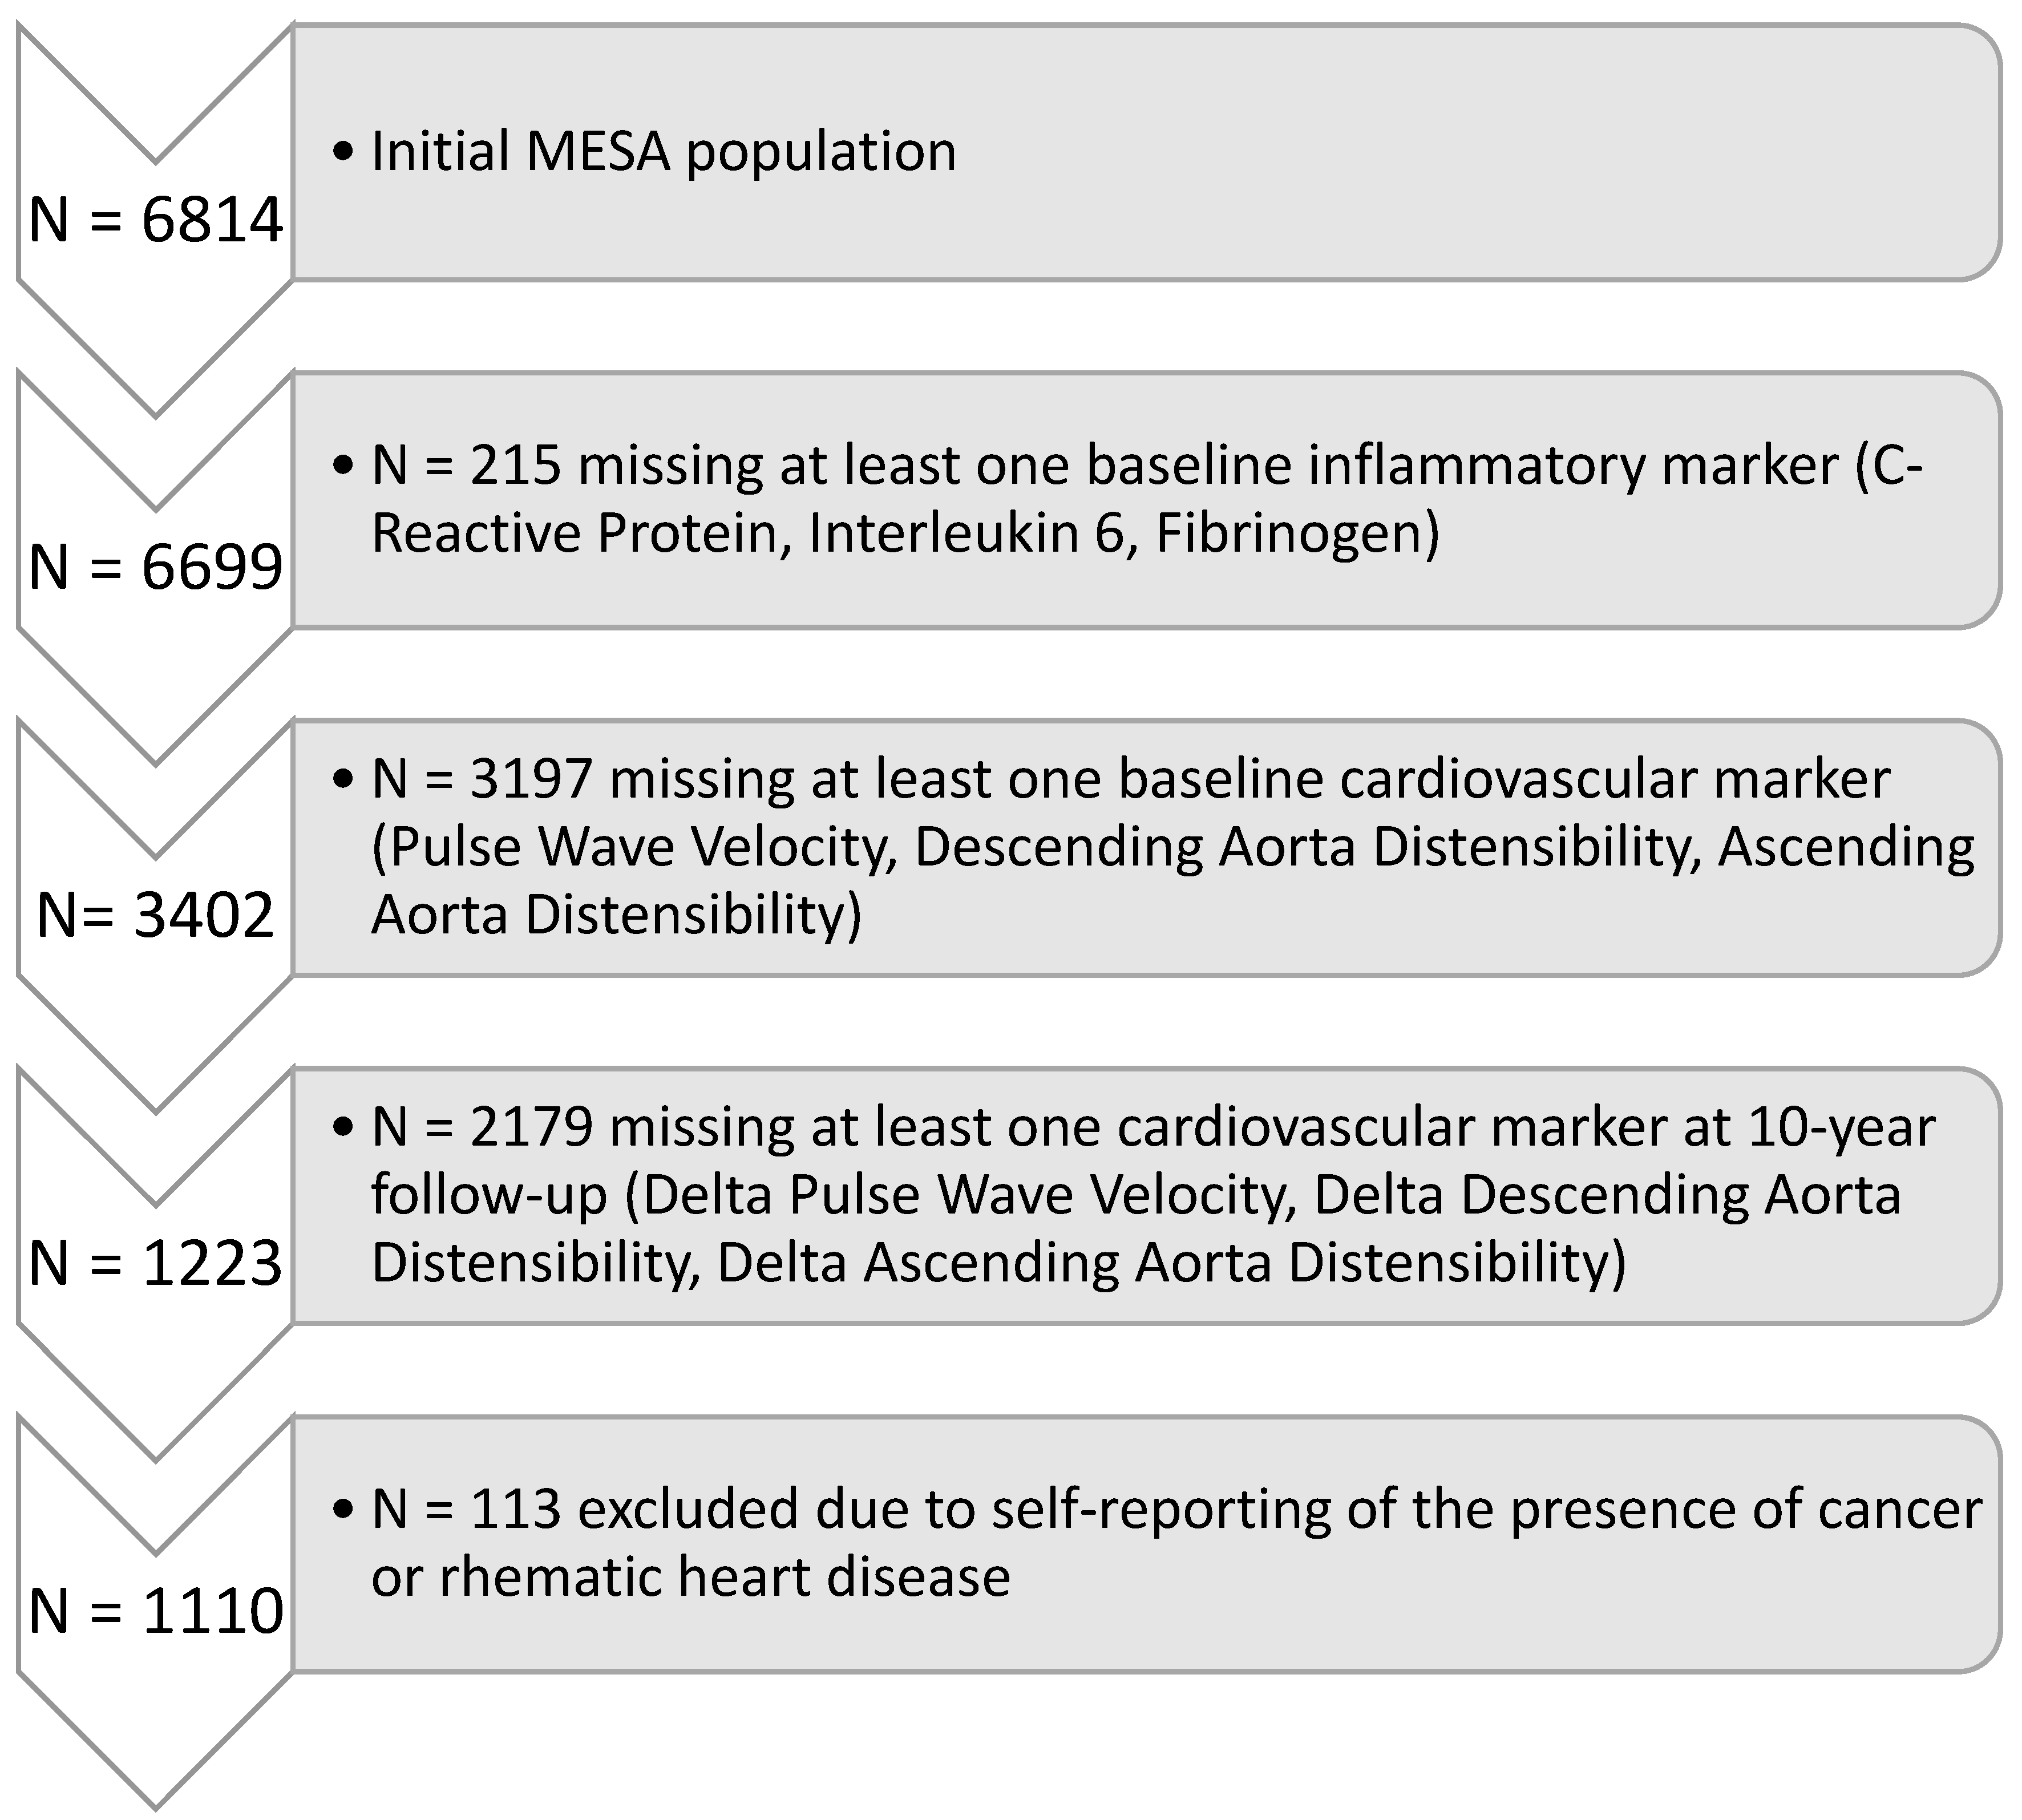
2.1. Population
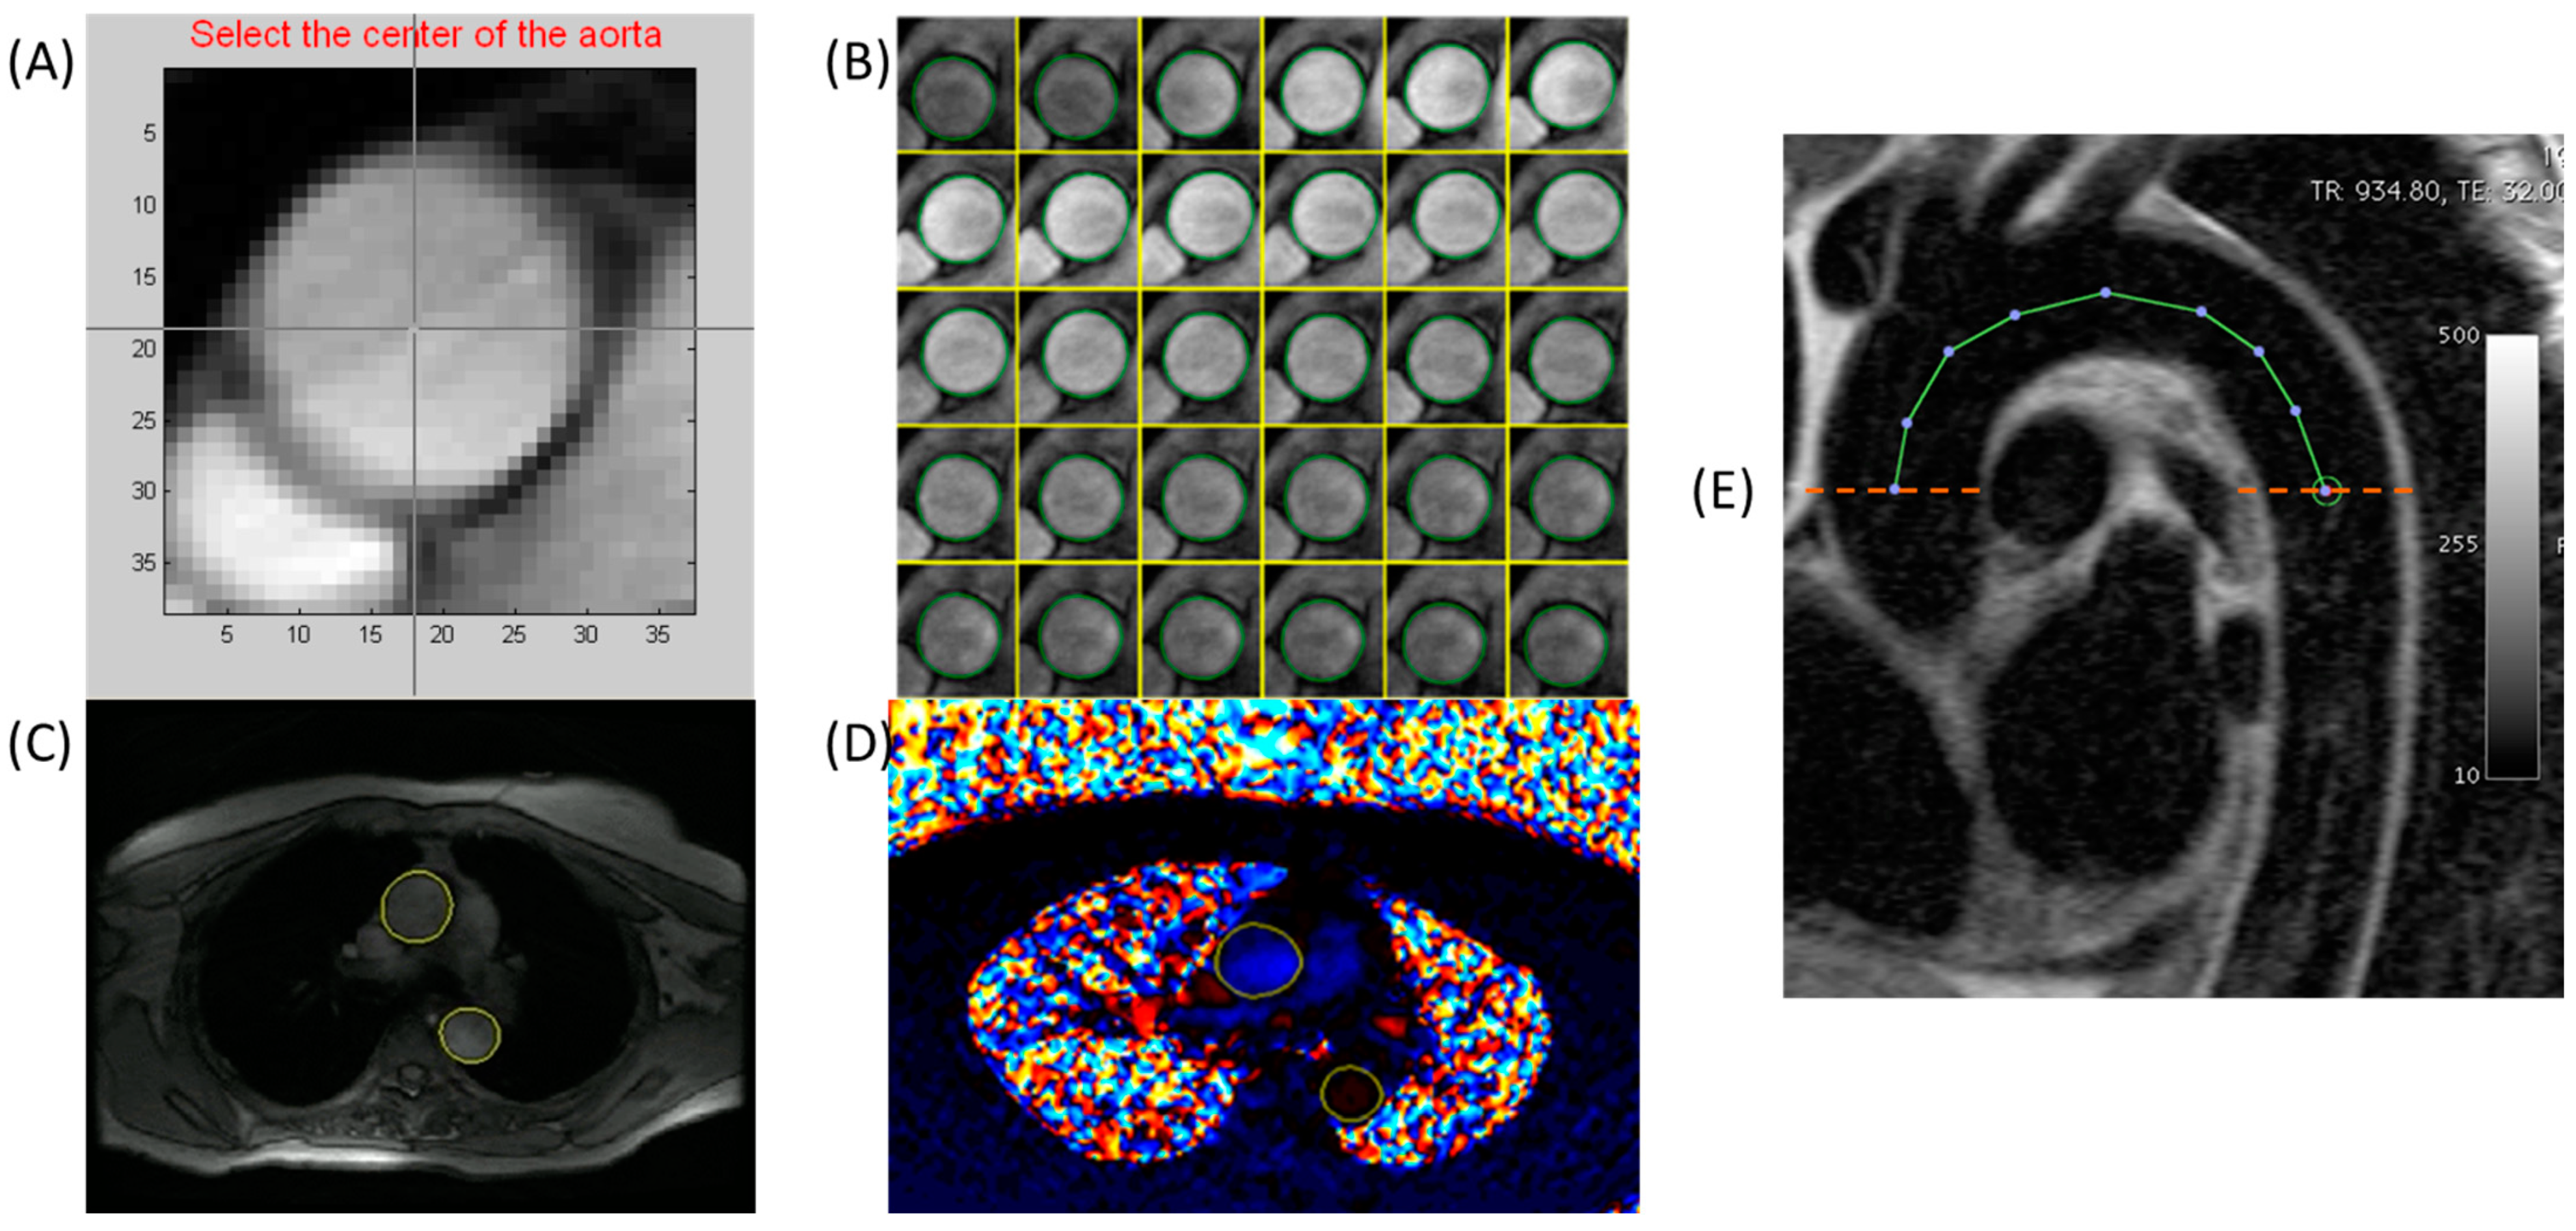
2.2. Magnetic Resonance Imaging
2.3. Inflammatory Biomarker Measurement
2.4. Statistical Analysis
3. Results
4. Discussion
Author Contributions
Funding
Institutional Review Board Statement
Informed Consent Statement
Data Availability Statement
Conflicts of Interest
Abbreviations
| AAD | Ascending Aortic Distensibility |
| ARTFUN | Arterial Function Software |
| BMI | Body Mass Index |
| CRP | C-reactive protein |
| CVD | Cardiovascular Disease |
| DAD | Descending Aortic Distensibility |
| Fib | Fibrinogen |
| HDL | High-density Lipoprotein |
| IL-6 | Interleukin 6 |
| IRB | Institutional Review Board |
| LDL | Low-density Lipoprotein |
| MESA | Multi-Ethnic Study of Atherosclerosis |
| MRI | Magnetic Resonance Imaging |
| PP | Pulse Pressure |
| PWV | Pulse Wave Velocity |
References
- Arnett, D.K.; McClelland, R.L.; Bank, A.; Bluemke, D.A.; Cushman, M.; Szalai, A.J.; Jain, N.; Gomes, A.S.; Heckbert, S.R.; Hundley, W.G.; et al. Biomarkers of inflammation and hemostasis associated with left ventricular mass: The Multiethnic Study of Atherosclerosis (MESA). Int. J. Mol. Epidemiol. Genet. 2011, 2, 391–400. [Google Scholar]
- Marques, M.D.; Nauffal, V.; Ambale-Venkatesh, B.; Vasconcellos, H.D.; Wu, C.; Bahrami, H.; Tracy, R.P.; Cushman, M.; Bluemke, D.A.; Lima, J.A.C. Association Between Inflammatory Markers and Myocardial Fibrosis. Hypertension 2018, 72, 902–908. [Google Scholar] [CrossRef] [PubMed]
- Ohyama, Y.; Ambale-Venkatesh, B.; Noda, C.; Kim, J.-Y.; Tanami, Y.; Teixido-Tura, G.; Chugh, A.R.; Redheuil, A.; Liu, C.-Y.; Wu, C.O.; et al. Aortic Arch Pulse Wave Velocity Assessed by Magnetic Resonance Imaging as a Predictor of Incident Cardiovascular Events. Hypertension 2017, 70, 524–530. [Google Scholar] [CrossRef] [PubMed]
- Mozos, I.; Malainer, C.; Horbańczuk, J.; Gug, C.; Stoian, D.; Luca, C.T.; Atanasov, A.G. Inflammatory Markers for Arterial Stiffness in Cardiovascular Diseases. Front. Immunol. 2017, 8, 1058. [Google Scholar] [CrossRef]
- Sattar, N.; Murray, H.M.; McConnachie, A.; Blauw, G.J.; Bollen, E.L.E.M.; Buckley, B.M.; Cobbe, S.M.; Ford, I.; Gaw, A.; Hyland, M.; et al. C-Reactive Protein and Prediction of Coronary Heart Disease and Global Vascular Events in the Prospective Study of Pravastatin in the Elderly at Risk (PROSPER). Circulation 2007, 115, 981–989. [Google Scholar] [CrossRef]
- Suzuki, T.; Bossone, E.; Sawaki, D.; Jánosi, R.A.; Erbel, R.; Eagle, K.; Nagai, R. Biomarkers of aortic diseases. Am. Heart J. 2013, 165, 15–25. [Google Scholar] [CrossRef] [PubMed]
- McCabe, J.J.; Walsh, C.; Gorey, S.; Harris, K.; Hervella, P.; Iglesias-Rey, R.; Jern, C.; Li, L.; Miyamoto, N.; Montaner, J.; et al. C-Reactive Protein, Interleukin-6, and Vascular Recurrence After Stroke: An Individual Participant Data Meta-Analysis. Stroke 2023, 54, 1289–1299. [Google Scholar] [CrossRef]
- di Gioia, C.R.T.; Ascione, A.; Carletti, R.; Giordano, C. Thoracic Aorta: Anatomy and Pathology. Diagnostics 2023, 13, 2166. [Google Scholar] [CrossRef]
- Nilsson, P.M.; Khalili, P.; Franklin, S.S. Blood pressure and pulse wave velocity as metrics for evaluating pathologic ageing of the cardiovascular system. Blood Press. 2014, 23, 17–30. [Google Scholar] [CrossRef]
- Ohyama, Y.; Ambale-Venkatesh, B.; Noda, C.; Chugh, A.R.; Teixido-Tura, G.; Kim, J.-Y.; Donekal, S.; Yoneyama, K.; Gjesdal, O.; Redheuil, A.; et al. Association of Aortic Stiffness With Left Ventricular Remodeling and Reduced Left Ventricular Function Measured by Magnetic Resonance Imaging. Circ. Cardiovasc. Imaging 2018, 9, e004426. [Google Scholar] [CrossRef]
- Herment, A.; Kachenoura, N.; Lefort, M.; Bensalah, M.; Dogui, A.; Frouin, F.; Mousseaux, E.; Cesare, A.D. Automated segmentation of the aorta from phase contrast MR images: Validation against expert tracing in healthy volunteers and in patients with a dilated aorta. J. Magn. Reason. Imaging 2010, 31, 881–888. [Google Scholar] [CrossRef]
- Herment, A.; Lefort, M.; Kachenoura, N.; Cesare, A.D.; Taviani, V.; Graves, M.J.; Pellot-Barakat, C.; Frouin, F.; Mousseaux, E. Automated estimation of aortic strain from steady-state free-precession and phase contrast MR images. Magn. Reason. Med. 2011, 65, 986–993. [Google Scholar] [CrossRef]
- Redheuil, A.; Yu, W.-C.; Wu, C.O.; Mousseaux, E.; de Cesare, A.; Yan, R.; Kachenoura, N.; Bluemke, D.; Lima, J.A.C. Reduced Ascending Aortic Strain and Distensibility. Hypertension 2010, 55, 319–326. [Google Scholar] [CrossRef]
- Nettleton, J.A.; Steffen, L.M.; Mayer-Davis, E.J.; Jenny, N.S.; Jiang, R.; Herrington, D.M.; Jacobs, D.R. Dietary patterns are associated with biochemical markers of inflammation and endothelial activation in the Multi-Ethnic Study of Atherosclerosis (MESA). Am. J. Clin. Nutr. 2006, 83, 1369–1379. [Google Scholar] [CrossRef]
- Lutsey, P.L.; Cushman, M.; Steffen, L.M.; Green, D.; Barr, R.G.; Herrington, D.; Ouyang, P.; Folsom, A.R. Plasma hemostatic factors and endothelial markers in four racial/ethnic groups: The MESA study. J. Thromb. Haemost. 2006, 4, 2629–2635. [Google Scholar] [CrossRef]
- Cushman, M.; Cornell, E.S.; Howard, P.R.; Bovill, E.G.; Tracy, R.P. Laboratory methods and quality assurance in the Cardiovascular Health Study. Clin. Chem. 1995, 41, 264–270. [Google Scholar] [CrossRef]
- Jain, S.; Khera, R.; Corrales–Medina, V.F.; Townsend, R.R.; Chirinos, J.A. Inflammation and arterial stiffness in humans. Atherosclerosis 2014, 237, 381–390. [Google Scholar] [CrossRef]
- Johansen, N.B.; Vistisen, D.; Brunner, E.J.; Tabák, A.G.; Shipley, M.J.; Wilkinson, I.B.; McEniery, C.M.; Roden, M.; Herder, C.; Kivimäki, M.; et al. Determinants of Aortic Stiffness: 16-Year Follow-Up of the Whitehall II Study. PLoS ONE 2012, 7, e37165. [Google Scholar] [CrossRef] [PubMed]
- McEniery, C.M.; Spratt, M.; Munnery, M.; Yarnell, J.; Lowe, G.D.; Rumley, A.; Gallacher, J.; Ben-Shlomo, Y.; Cockcroft, J.R.; Wilkinson, I.B. An Analysis of Prospective Risk Factors for Aortic Stiffness in Men. Hypertension 2010, 56, 36–43. [Google Scholar] [CrossRef] [PubMed]
- van Bussel, B.C.; Schouten, F.; Henry, R.M.; Schalkwijk, C.G.; de Boer, M.R.; Ferreira, I.; Smulders, Y.M.; Twisk, J.W.; Stehouwer, C.D. Endothelial Dysfunction and Low-Grade Inflammation Are Associated With Greater Arterial Stiffness Over a 6-Year Period. Hypertension 2011, 58, 588–595. [Google Scholar] [CrossRef] [PubMed]
- Jae, S.Y.; Heffernan, K.S.; Yoon, E.S.; Park, S.H.; Choi, Y.-H.; Fernhall, B.; Park, J.B. Pulsatile Stress, Inflammation and Change in Arterial Stiffness. J. Atheroscler. Thromb. 2012, 19, 1035–1042. [Google Scholar] [CrossRef] [PubMed][Green Version]
- Tomiyama, H.; Hashimoto, H.; Tanaka, H.; Matsumoto, C.; Odaira, M.; Yamada, J.; Yoshida, M.; Shiina, K.; Nagata, M.; Yamashina, A. Continuous Smoking and Progression of Arterial Stiffening A Prospective Study. J. Am. Coll. Cardiol. 2010, 55, 1979–1987. [Google Scholar] [CrossRef] [PubMed]
- Jabati, S.; Fareed, J.; Liles, J.; Otto, A.; Hoppensteadt, D.; Bontekoe, J.; Phan, T.; Walborn, A.; Syed, M. Biomarkers of Inflammation, Thrombogenesis, and Collagen Turnover in Patients With Atrial Fibrillation. Clin. Appl. Thromb./Hemost. 2018, 24, 718–723. [Google Scholar] [CrossRef]
- Ridker, P.M. From C-Reactive Protein to Interleukin-6 to Interleukin-1. Circ. Res. 2016, 118, 145–156. [Google Scholar] [CrossRef]
- Wirtz, D.C.; Heller, K.-D.; Miltner, O.; Zilkens, K.-W.; Wolff, J.M. Interleukin-6, a potential inflammatory marker after total joint replacement. Int. Orthop. 2000, 24, 194–196. [Google Scholar] [CrossRef] [PubMed]
- Sesso, H.D.; Wang, L.; Buring, J.E.; Ridker, P.M.; Gaziano, J.M. Comparison of Interleukin-6 and C-Reactive Protein for the Risk of Developing Hypertension in Women. Hypertension 2007, 49, 304–310. [Google Scholar] [CrossRef]
- Ridker, P.M.; Everett, B.M.; Thuren, T.; MacFadyen, J.G.; Chang, W.H.; Ballantyne, C.; Fonseca, F.; Nicolau, J.; Koenig, W.; Anker, S.D.; et al. Antiinflammatory Therapy with Canakinumab for Atherosclerotic Disease. N. Engl. J. Med. 2017, 377, 1119–1131. [Google Scholar] [CrossRef]
- Redheuil, A.; Yu, W.-C.; Mousseaux, E.; Harouni, A.A.; Kachenoura, N.; Wu, C.O.; Bluemke, D.; Lima, J.A.C. Age-Related Changes in Aortic Arch Geometry Relationship With Proximal Aortic Function and Left Ventricular Mass and Remodeling. J. Am. Coll. Cardiol. 2011, 58, 1262–1270. [Google Scholar] [CrossRef]
- Nwabuo, C.C.; Moreira, H.T.; Vasconcellos, H.D.; Ambale-Venkatesh, B.; Yoneyama, K.; Ohyama, Y.; Sharma, R.K.; Armstrong, A.C.; Ostovaneh, M.R.; Lewis, C.E.; et al. Association of Aortic Root Dilation from Early Adulthood to Middle Age with Cardiac Structure and Function: The CARDIA Study. J. Am. Soc. Echocardiog. 2017, 30, 1172–1179. [Google Scholar] [CrossRef]
- Ohyama, Y.; Redheuil, A.; Kachenoura, N.; Venkatesh, B.A.; Lima, J.A.C. Imaging Insights on the Aorta in Aging. Circ. Cardiovasc. Imaging 2018, 11, e005617. [Google Scholar] [CrossRef]


| Full Sample | Selected Sample (Year 1) | Selected Sample (Year 10) | |
|---|---|---|---|
| N | 6814 | 1110 (16.2) | 1098 (16.1) |
| Age (years) | 62 ± 10 | 59 ± 9 | 69 ± 9 |
| Male | 3213 (47.2) | 531 (47.8) | 531 (47.8) |
| Race: | |||
| Caucasian | 2622 (38.5) | 448 (40.4) | 448 (40.4) |
| Chinese | 804 (11.8) | 240 (21.6) | 240 (21.6) |
| Black | 1892 (27.8) | 316 (28.5) | 316 (28.5) |
| Hispanic | 1496 (21.9) | 106 (9.5) | 106 (9.5) |
| Body Mass Index (kg/m2) | 28.3 ± 5.5 | 27.5 ± 5.0 | 28.5 ± 5.7 |
| Obese (BMI > 30 kg/m2) | 2196 (32.2) | 302 (27.2) | 319 (28.7) |
| Systolic Blood Pressure (mmHg) | 126.6 ± 21.5 | 132.6 ± 20.0 | 126.1 ± 16.8 |
| Diastolic Blood Pressure (mmHg) | 71.9 ± 10.3 | 77.5 ± 11.0 | 71.4 ± 11.7 |
| Pulse Pressure (mmHg) | 54.7 ± 31.8 | 55.1 ± 31.0 | 54.7 ± 28.5 |
| Antihypertensive medication | 2536 (37.2) | 362 (32.6) | 553 (55.4) |
| Controlled Hypertension | 1547 (22.7) | 234 (21.1) | 445 (40.1) |
| Low-Density Lipoprotein cholesterol (mg/dL) | 117.2 ± 31.5 | 117.0 ± 30 | 105.4 ± 32.6 |
| High-Density Lipoprotein cholesterol (mg/dL) | 50.1 ± 14.8 | 51.2 ± 14.8 | 56.0 ± 16.8 |
| Lipid-lowering Medication | 1105 (16.3) | 172 (15.5) | 428 (39.0) |
| Smoking status | |||
| Never | 3418 (50.3) | 646 (58.5) | 576 (52.5) |
| Former | 2487 (36.6) | 340 (30.7) | 436 (39.7) |
| Current | 887 (13.1) | 119 (10.8) | 86 (7.8) |
| Diabetes | 859 (12.6) | 95 (7.6) | 220 (20.0) |
| Interleukin-6 (pg/mL) | 1.56 ± 1.23 | 1.35 ± 1.04 | xx |
| C-Reactive Protein (mg/L) | 3.78 ± 5.89 | 3.33 ± 5.26 | xx |
| Fibrinogen (mg/dL) | 346.8 ± 74.0 | 332.4 ± 66.7 | xx |
| Pulse Wave Velocity (m/s) | 8.10 ± 4.94 | 8.99 ± 4.22 | |
| Ascending Aortic Distensibility (10−3 mmHg−1) | 1.73 ± 1.35 | 1.57 ± 1.10 | |
| Descending Aortic Distensibility (10−3 mmHg−1) | 2.19 ± 1.52 | 1.99 ± 1.32 |
| Log PWV (m/s) | Log AAD (10−3 mmHg−1) | Log DAD (10−3 mmHg−1) | |||||||
|---|---|---|---|---|---|---|---|---|---|
| Model 1 | Model 2 | Model 3 | Model 1 | Model 2 | Model 3 | Model 1 | Model 2 | Model 3 | |
| Log CRP (mg/L) | 0.022 (0.07) | 0.014 (0.23) | 0.011 (0.39) | −0.047 (0.01) | −0.020 (0.27) | −0.014 (0.47) | −0.068 (<0.01) | −0.033 (0.04) | −0.007 (0.68) |
| Log IL-6 (pg/mL) | 0.054 (0.01) | −0.0023 (0.91) | −0.010 (0.66) | −0.098 (<0.01) | −0.003 (0.92) | 0.016 (0.63) | −0.142 (<0.01) | −0.032 (0.25) | 0.021 (0.49) |
| Log Fib (mg/dl) | 0.13 (0.06) | −0.029 (0.67) | −0.025 (0.71) | −0.174 (0.10) | 0.013 (0.20) | 0.158 (0.13) | −0.334 (<0.01) | −0.025 (0.78) | 0.080 (0.38) |
| dPWV (m/s) | dAAD (10−3 mmHg−1) | dDAD (10−3 mmHg−1) | |||||||
|---|---|---|---|---|---|---|---|---|---|
| Model 1 | Model 2 | Model 3 | Model 1 | Model 2 | Model 3 | Model 1 | Model 2 | Model 3 | |
| Log CRP (mg/L) | −0.03 (0.78) | −0.05 (0.67) | −0.08 (0.55) | −0.05 (0.07) | −0.05 (0.09) | −0.06 (0.08) | −0.08 (0.028) | −0.09 (0.013) | −0.08 (0.044) |
| Log IL-6 (pg/mL) | 0.040 (0.04) | 0.06 (0.76) | 0.08 (0.73) | −0.10 (0.07) | −0.06 (0.25) | −0.08 (0.20) | −0.09 (0.16) | −0.07 (0.25) | −0.05 (0.50) |
| Log Fib (mg/dl) | −0.34 (0.61) | −1.47 (0.03) | −1.27 (0.06) | −0.15 (0.39) | 0.01 (0.97) | −0.04 (0.84) | −0.05 (0.77) | −0.01 (0.97) | 0.18 (0.62) |
Disclaimer/Publisher’s Note: The statements, opinions and data contained in all publications are solely those of the individual author(s) and contributor(s) and not of MDPI and/or the editor(s). MDPI and/or the editor(s) disclaim responsibility for any injury to people or property resulting from any ideas, methods, instructions or products referred to in the content. |
© 2023 by the authors. Licensee MDPI, Basel, Switzerland. This article is an open access article distributed under the terms and conditions of the Creative Commons Attribution (CC BY) license (https://creativecommons.org/licenses/by/4.0/).
Share and Cite
Swamynathan, R.; Varadarajan, V.; Nguyen, H.; Wu, C.O.; Liu, K.; Bluemke, D.A.; Kachenoura, N.; Redheuil, A.; Lima, J.A.C.; Ambale-Venkatesh, B. Association between Biomarkers of Inflammation and 10-Year Changes in Aortic Stiffness: The Multi-Ethnic Study of Atherosclerosis. J. Clin. Med. 2023, 12, 5062. https://doi.org/10.3390/jcm12155062
Swamynathan R, Varadarajan V, Nguyen H, Wu CO, Liu K, Bluemke DA, Kachenoura N, Redheuil A, Lima JAC, Ambale-Venkatesh B. Association between Biomarkers of Inflammation and 10-Year Changes in Aortic Stiffness: The Multi-Ethnic Study of Atherosclerosis. Journal of Clinical Medicine. 2023; 12(15):5062. https://doi.org/10.3390/jcm12155062
Chicago/Turabian StyleSwamynathan, Rithvik, Vinithra Varadarajan, Hieu Nguyen, Colin O. Wu, Kiang Liu, David A. Bluemke, Nadjia Kachenoura, Alban Redheuil, João A. C. Lima, and Bharath Ambale-Venkatesh. 2023. "Association between Biomarkers of Inflammation and 10-Year Changes in Aortic Stiffness: The Multi-Ethnic Study of Atherosclerosis" Journal of Clinical Medicine 12, no. 15: 5062. https://doi.org/10.3390/jcm12155062
APA StyleSwamynathan, R., Varadarajan, V., Nguyen, H., Wu, C. O., Liu, K., Bluemke, D. A., Kachenoura, N., Redheuil, A., Lima, J. A. C., & Ambale-Venkatesh, B. (2023). Association between Biomarkers of Inflammation and 10-Year Changes in Aortic Stiffness: The Multi-Ethnic Study of Atherosclerosis. Journal of Clinical Medicine, 12(15), 5062. https://doi.org/10.3390/jcm12155062