

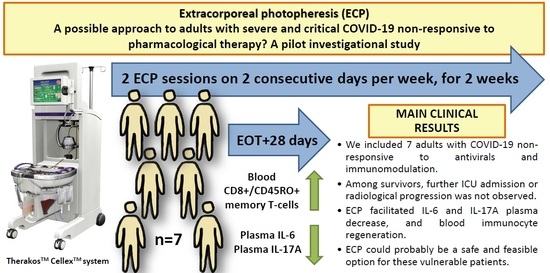
Extracorporeal Photopheresis as a Possible Therapeutic Approach for Adults with Severe and Critical COVID-19 Non-Responsive to Standard Treatment: A Pilot Investigational Study
 , ,
, ,
Abstract
:
1. Introduction
2. Methods
2.1. Study Design
2.2. Patient Enrollment
2.3. Data Collection
2.4. Diagnostic and Therapeutic Strategies, Follow-Up
2.5. Protocol of Extracorporeal Photopheresis
2.6. Outcomes and Statistical Analysis
3. Results
3.1. Demographic Characteristics of Patients
3.2. Clinical Characteristics of Patients
3.3. Laboratory Characteristics of Patients
3.4. Immune Biomarker Profiling of Patients
3.5. Outcome Characteristics of Patients
3.6. ECP MNC Apoptosis Assessment
4. Discussion
4.1. Main Study Findings
4.2. Previous Literature Findings
4.3. Limitations
5. Conclusions
Supplementary Materials
Author Contributions
Funding
Institutional Review Board Statement
Informed Consent Statement
Data Availability Statement
Acknowledgments
Conflicts of Interest
Abbreviations
| ANA | anti-nuclear antibody |
| ANCA | anti-neutrophil cytoplasmic antibody |
| ARDS | acute respiratory distress syndrome |
| C | complement |
| CD | cluster of differentiation |
| COVID-19 | coronavirus disease 2019 |
| CT | computed tomography |
| ECP | extracorporeal photopheresis |
| ENA | extractable nuclear antigen |
| EOT | end of treatment |
| FACS | fluorescence-activated cell sorting |
| FiO2 | fraction of inspired oxygen |
| ICU | intensive care unit |
| IFN | interferon |
| Ig | immunoglobulin |
| IL | interleukin |
| LDH | lactate dehydrogenase |
| LOS | length of stay |
| NK | natural killer |
| MNC | mononuclear cell collection |
| PaO2 | partial arterial oxygen tension |
| RNA | ribonucleic acid |
| RT-PCR | real-time polymerase chain reaction |
| SARS-CoV-2 | severe acute respiratory syndrome coronavirus 2 |
References
- World Health Organization. Living Guidance for Clinical Management of COVID-19; World Health Organization: Geneva, Switzerland, 2021.
- Huang, S.; Vignon, P.; Mekontso-Dessap, A.; Tran, S.; Prat, G.; Chew, M.; Balik, M.; Sanfilippo, F.; Banauch, G.; Clau-Terre, F.; et al. Echocardiography findings in COVID-19 patients admitted to intensive care units: A multi-national observational study (the ECHO-COVID study). Intensive Care Med. 2022, 48, 667–678. [Google Scholar] [CrossRef] [PubMed]
- La Via, L.; Dezio, V.; Santonocito, C.; Astuto, M.; Morelli, A.; Huang, S.; Vieillard-Baron, A.; Sanfilippo, F. Full and simplified assessment of left ventricular diastolic function in COVID-19 patients admitted to ICU: Feasibility, incidence, and association with mortality. Echocardiography 2022, 39, 1391–1400. [Google Scholar] [CrossRef] [PubMed]
- Gibson, P.G.; Qin, L.; Puah, S.H. COVID-19 acute respiratory distress syndrome (ARDS): Clinical features and differences from typical pre-COVID-19 ARDS. Med. J. Aust. 2020, 213, 54–56.e1. [Google Scholar] [CrossRef] [PubMed]
- Ahmadian, E.; Khatibi, S.M.H.; Soofiyani, S.R.; Abediazar, S.; Shoja, M.M.; Ardalan, M.; Vahed, S.Z. COVID-19 and kidney injury: Pathophysiology and molecular mechanisms. Rev. Med. Virol. 2021, 31, e2176. [Google Scholar] [CrossRef] [PubMed]
- Qin, R.; He, L.; Yang, Z.; Jia, N.; Chen, R.; Xie, J.; Fu, W.; Chen, H.; Lin, X.; Huang, R.; et al. Identification of Parameters Representative of Immune Dysfunction in Patients with Severe and Fatal COVID-19 Infection: A Systematic Review and Meta-analysis. Clin. Rev. Allergy Immunol. 2023, 64, 33–65. [Google Scholar] [CrossRef]
- Swenson, K.E.; Swenson, E.R. Pathophysiology of Acute Respiratory Distress Syndrome and COVID-19 Lung Injury. Crit. Care Clin. 2021, 37, 749–776. [Google Scholar] [CrossRef]
- Asgharpour, M.; Mehdinezhad, H.; Bayani, M.; Zavareh, M.S.H.; Hamidi, S.H.; Akbari, R.; Ghadimi, R.; Bijani, A.; Mouodi, S. Effectiveness of extracorporeal blood purification (hemoadsorption) in patients with severe coronavirus disease 2019 (COVID-19). BMC Nephrol. 2020, 21, 356. [Google Scholar] [CrossRef]
- Sanfilippo, F.; Martucci, G.; La Via, L.; Cuttone, G.; Dimarco, G.; Pulizzi, C.; Arcadipane, A.; Astuto, M. Hemoperfusion and blood purification strategies in patients with COVID-19: A systematic review. Artif. Organs 2021, 45, 1466–1476. [Google Scholar] [CrossRef]
- Dai, X.; Zhang, Y.; Yu, L.; Jiang, Y.; Chen, L.; Chen, Y.; Li, M.; Gao, C.; Shang, J.; Xiang, S.; et al. Effect of artificial liver blood purification treatment on the survival of critical ill COVID-19 patients. Artif. Organs 2021, 45, 762–769. [Google Scholar] [CrossRef]
- Cho, A.; Jantschitsch, C.; Knobler, R. Extracorporeal Photopheresis-An Overview. Front. Med. 2018, 5, 236. [Google Scholar] [CrossRef]
- Yang, A.P.; Li, H.M.; Tao, W.Q.; Yang, X.J.; Wang, M.; Yang, W.J.; Liu, J.P. Infection with SARS-CoV-2 causes abnormal laboratory results of multiple organs in patients. Aging 2020, 12, 10059–10069. [Google Scholar] [CrossRef] [PubMed]
- Deng, Z.; Zhang, M.; Zhu, T.; Zhili, N.; Liu, Z.; Xiang, R.; Zhang, W.; Xu, Y. Dynamic changes in peripheral blood lymphocyte subsets in adult patients with COVID-19. Int. J. Infect. Dis. 2020, 98, 353–358. [Google Scholar] [CrossRef] [PubMed]
- Essa, S.; Shamsah, M.; Alsarraf, A.H.; Esmaeil, A.; Al-Shammasi, A.; Raghupathy, R. Influence of SARS-CoV-2 Infection on Cytokine Production by Mitogen-Stimulated Peripheral Blood Mononuclear Cells and Neutrophils in COVID-19 Intensive Care Unit Patients. Microorganisms 2022, 10, 2194. [Google Scholar] [CrossRef]
- European Centre for Disease Prevention and Control. Case Definition for Coronavirus Disease 2019 (COVID-19), as of 3 December 2020. 2020. Available online: https://www.ecdc.europa.eu/en/covid-19/surveillance/case-definition (accessed on 30 January 2023).
- ARDS Definition of Task Force; Ranieri, V.M.; Rubenfeld, G.D.; Thompson, B.T.; Ferguson, N.D.; Caldwell, E.; Fan, E.; Camporota, L.; Slutsky, A.S. Acute respiratory distress syndrome: The Berlin Definition. JAMA 2012, 307, 2526–2533. [Google Scholar] [CrossRef]
- Fajgenbaum, D.C.; June, C.H. Cytokine Storm. N. Engl. J. Med. 2020, 383, 2255–2273. [Google Scholar] [CrossRef]
- Lakatos, B.; Szabó, B.G.; Bobek, I.; Kiss-Dala, N.; Gáspár, Z.; Riczu, A.; Petrik, B.; Farkas, B.F.; Sebestyén, G.; Gopcsa, L.; et al. Baricitinib vs tocilizumab treatment for hospitalized adult patients with severe COVID-19 and associated cytokine storm: A prospective, investigational, real-world study. Int. J. Infect. Dis. 2022, 125, 233–240. [Google Scholar] [CrossRef]
- Babarczy, B.; Bertókné, T.; Biró, K.; Bobek, I.; Bognár, Z.; Bogos, K. Hungarian Coronavirus Handbook; Hungarian Ministry of Human Resources: Budapest, Hungary, 2020. [Google Scholar]
- Bartoletti, M.; Azap, O.; Barac, A.; Bussini, L.; Ergonul, O.; Krause, R.; Paño-Pardo, J.R.; Power, N.R.; Sibani, M.; Szabo, B.G.; et al. ESCMID COVID-19 living guidelines: Drug treatment and clinical management. Clin. Microbiol. Infect. 2022, 28, 222–238. [Google Scholar] [CrossRef]
- Liu, J.; Li, S.; Liu, J.; Liang, B.; Wang, X.; Wang, H.; Li, W.; Tong, Q.; Yi, J.; Zhao, L.; et al. Longitudinal characteristics of lymphocyte responses and cytokine profiles in the peripheral blood of SARS-CoV-2 infected patients. EBioMedicine 2020, 55, 102763. [Google Scholar] [CrossRef]
- Luo, M.; Liu, J.; Jiang, W.; Yue, S.; Liu, H.; Wei, S. IL-6 and CD8+ T cell counts combined are an early predictor of in-hospital mortality of patients with COVID-19. JCI Insight 2020, 5, e139024. [Google Scholar] [CrossRef]
- Arcanjo, A.; Pinto, K.G.; Logullo, J.; Leite, P.E.C.; Menezes, C.C.B.; Freire-de-Lima, L.; Diniz-Lima, I.; Decoté-Ricardo, D.; Rodrigues-DA-Silva, R.N.; Freire-De-Lima, C.G.; et al. Critically Ill Coronavirus Disease 2019 Patients Exhibit Hyperactive Cytokine Responses Associated with Effector Exhausted Senescent T Cells in Acute Infection. J. Infect. Dis. 2021, 224, 1672–1683. [Google Scholar] [CrossRef]
- Luo, Y.; Mao, L.; Yuan, X.; Xue, Y.; Lin, Q.; Tang, G.; Song, H.; Wang, F.; Sun, Z. Prediction Model Based on the Combination of Cytokines and Lymphocyte Subsets for Prognosis of SARS-CoV-2 Infection. J. Clin. Immunol. 2020, 40, 960–969. [Google Scholar] [CrossRef]
- Schub, D.; Klemis, V.; Schneitler, S.; Mihm, J.; Lepper, P.M.; Wilkens, H.; Bals, R.; Eichler, H.; Gärtner, B.C.; Becker, S.L.; et al. High levels of SARS-CoV-2-specific T cells with restricted functionality in severe courses of COVID-19. JCI Insight 2020, 5, e142167. [Google Scholar] [CrossRef]
- Frisoni, P.; Neri, M.; D’errico, S.; Alfieri, L.; Bonuccelli, D.; Cingolani, M.; Di Paolo, M.; Gaudio, R.M.; Lestani, M.; Marti, M.; et al. Cytokine storm and histopathological findings in 60 cases of COVID-19-related death: From viral load research to immunohistochemical quantification of major players IL-1beta, IL-6, IL-15 and TNF-alpha. Forensic Sci. Med. Pathol. 2022, 18, 4–19. [Google Scholar] [CrossRef]
- He, S.; Zhou, C.; Lu, D.; Yang, H.; Xu, H.; Wu, G.; Pan, W.; Zhu, R.; Jia, H.; Tang, X.; et al. Relationship between chest CT manifestations and immune response in COVID-19 patients. Int. J. Infect. Dis. 2020, 98, 125–129. [Google Scholar] [CrossRef]
- Wan, S.; Yi, Q.; Fan, S.; Lv, J.; Zhang, X.; Guo, L.; Lang, C.; Xiao, Q.; Xiao, K.; Yi, Z.; et al. Relationships among lymphocyte subsets, cytokines, and the pulmonary inflammation index in coronavirus (COVID-19) infected patients. Br. J. Haematol. 2020, 189, 428–437. [Google Scholar] [CrossRef]
- Shi, W.; Liu, X.; Cao, Q.; Ma, P.; Le, W.; Xie, L.; Ye, J.; Wen, W.; Tang, H.; Su, W.; et al. High-dimensional single-cell analysis reveals the immune characteristics of COVID-19. Am. J. Physiol. Lung Cell Mol. Physiol. 2021, 320, L84–L98. [Google Scholar] [CrossRef]
- Han, H.; Ma, Q.; Li, C.; Liu, R.; Zhao, L.; Wang, W.; Zhang, P.; Liu, X.; Gao, G.; Liu, F.; et al. Profiling serum cytokines in COVID-19 patients reveals IL-6 and IL-10 are disease severity predictors. Emerg. Microbes Infect. 2020, 9, 1123–1130. [Google Scholar] [CrossRef]
- Azmy, V.; Kaman, K.; Tang, D.; Zhao, H.; Cruz, C.D.; Topal, J.E.; Malinis, M.; Price, C.C. Cytokine Profiles Before and After Immune Modulation in Hospitalized Patients with COVID-19. J. Clin. Immunol. 2021, 41, 738–747. [Google Scholar] [CrossRef]
- Lakatos, B.; Szabo, B.G.; Bobek, I.; Gopcsa, L.; Beko, G.; Kiss-Dala, N.; Petrik, B.; Gaspar, Z.; Farkas, B.F.; Sinko, J.; et al. Laboratory parameters predicting mortality of adult in-patients with COVID-19 associated cytokine release syndrome treated with high-dose tocilizumab. Acta Microbiol. Immunol. Hung. 2021, 68, 145–152. [Google Scholar] [CrossRef]
- Pirabe, A.; Heber, S.; Schrottmaier, W.C.; Schmuckenschlager, A.; Treiber, S.; Pereyra, D.; Santol, J.; Pawelka, E.; Traugott, M.; Schörgenhofer, C.; et al. Age Related Differences in Monocyte Subsets and Cytokine Pattern during Acute COVID-19-A Prospective Observational Longitudinal Study. Cells 2021, 10, 3373. [Google Scholar] [CrossRef]
- Vu, D.-L.; Martinez-Murillo, P.; Pigny, F.; Vono, M.; Meyer, B.; Eberhardt, C.S.; Lemeille, S.; Von Dach, E.; Blanchard-Rohner, G.; Eckerle, I.; et al. Longitudinal Analysis of Inflammatory Response to SARS-CoV-2 in the Upper Respiratory Tract Reveals an Association with Viral Load, Independent of Symptoms. J. Clin. Immunol. 2021, 41, 1723–1732. [Google Scholar] [CrossRef]
- Anderberg, S.B.; Luther, T.; Berglund, M.; Larsson, R.; Rubertsson, S.; Lipcsey, M.; Larsson, A.; Frithiof, R.; Hultström, M. Increased levels of plasma cytokines and correlations to organ failure and 30-day mortality in critically ill COVID-19 patients. Cytokine 2021, 138, 155389. [Google Scholar] [CrossRef]
- Henry, B.M.; Benoit, S.W.; Vikse, J.; Berger, B.A.; Pulvino, C.; Hoehn, J.; Rose, J.; de Oliveira, M.H.S.; Lippi, G.; Benoit, J.L. The anti-inflammatory cytokine response characterized by elevated interleukin-10 is a stronger predictor of severe disease and poor outcomes than the pro-inflammatory cytokine response in coronavirus disease 2019 (COVID-19). Clin. Chem. Lab. Med. 2021, 59, 599–607. [Google Scholar] [CrossRef] [PubMed]

| Patient Identification | Pt. 1. | Pt. 2. | Pt. 3. | Pt. 4. | Pt. 5. | Pt. 6. | Pt. 7. | Total |
|---|---|---|---|---|---|---|---|---|
| Age (years) | 55 | 65 | 32 | 54 | 51 | 41 | 72 | 54 ± 14 (32–72) |
| Gender (n, %) | M | M | M | M | M | F | F | M: 5/7 (71.4) F: 2/7 (28.6) |
| Comorbidities (n, %) | AC | HT OB | CCD CHD CRD CVD HT | CPD HEM TOB | CPD HT OB | AID CHD CPD CVD HT TOB | AID CHD CRD CVD HEM HT | AC: 1/7 (14.3) AID: 2/7 (28.6) CCD: 1/7 (14.3) CHD: 3/7 (42.9) CPD: 3/7 (42.9) CRD: 2/7 (28.6) CVD: 3/7 (42.9) HEM: 2/7 (28.6) HT: 5/7 (71.4) OB: 2/7 (28.6) TOB: 2/7 (28.6) |
| COVID-19 vaccination status: | ||||||||
| - Primary series (n, %) | N | 2 × AZ | 2 × Sp | 2 × Pf | 2 × Pf | 2 × Pf | 2 × Pf | Y: 6/7 (85.7) |
| - Booster vaccination (n, %) | n.a. | 1 × Pf | N | N | N | N | 1 × Pf | Y: 2/6 (33.3) |
| - Time since last vaccine (months) | n.a. | 1 | 8 | 7 | 6 | 6 | 2 | 6 ± 5 (1–8) |
| Symptom duration before COVID-19 diagnosis (days) | 7 | 6 | 1 | 1 | 2 | 2 | 4 | 2 ± 4 (1–7) |
| Therapies against COVID-19 (n, %): | ||||||||
| - Remdesivir | Y | Y | Y | Y | Y | Y | Y | Y: 7/7 (100) |
| - Dexamethasone | Y | Y | Y | Y | Y | Y | Y | Y: 7/7 (100) |
| - Tocilizumab | Y | Y | Y | N | N | Y | N | Y: 4/7 (57.1) |
| - Baricitinib | Y | Y | N | N | Y | N | Y | Y: 4/7 (57.1) |
| - Ruxolitinib | N | N | N | Y | N | N | N | Y: 1/7 (14.3) |
| - Reconvalescent plasmatherapy | Y | N | Y | Y | Y | Y | Y | Y: 6/7 (85.7) |
| Clinical outcomes (n, %): | ||||||||
| - All-cause death | N | N | N | N | N | Y | Y | Y: 2/7 (28.6) |
| - Invasive mechanical ventilation | Y | N | Y | N | N | N * | N * | Y: 2/7 (28.6) |
| - ICU admission | Y | N | Y | N | Y | N * | Y * | Y: 4/7 (57.1) |
| Virological outcomes (n, %): | ||||||||
| - Respiratory SARS-CoV-2 RT-PCR positivity | N | Y | N | N | Y | Y * | Y * | Y: 4/7 (57.1) |
| - Blood SARS-CoV-2 RT-PCR positivity | N | N | N | N | N | N * | N * | Y: 0 (0) |
| Radiological outcomes (n, %) | ||||||||
| - Radiological progression on chest CT scan | N | N | N | N | N | Y * | Y * | Y: 2/7 (28.6) |
| - Radiological regression on chest CT scan | N | Y | N | Y | Y | N | N | Y: 3/7 (42.9) |
| - Fixed infiltration on chest CT scan | Y | N | Y | N | N | N | N | Y: 2/7 (28.6) |
| Hospital ward length of stay (days) ** | 86 | 45 | 0 | 30 | 51 | 24 | 0 | 45 ± 42 (24–86) |
| Intensive care unitlength of stay (days) | 69 | 0 | 91 | 0 | 48 | 0 | 22 | 59 ± 45 (22–91) |
| Time to death from hospital admission (days) | n.a. | n.a. | n.a. | n.a. | n.a. | 24 | 22 | 23 ± n.a. (22–24) |
| Patient Identification | Pt. 1. | Pt. 2. | Pt. 3. | Pt. 4. | Pt. 5. | Pt. 6. | Pt. 7. | Total | p Value ** | ||||||||
|---|---|---|---|---|---|---|---|---|---|---|---|---|---|---|---|---|---|
| Time of Assessment | Baseline | Inclusion | Baseline | Inclusion | Baseline | Inclusion | Baseline | Inclusion | Baseline | Inclusion | Baseline | Inclusion | Baseline | Inclusion | Baseline | Inclusion | |
| COVID-19 severity | C | C | C | C | C | C | S | S | C | C | S | C | S | S | C: 4/7 (57.1) S: 3/7 (42.9) | C: 5/7 (71.4) S: 2/7 (28.6) | 1.0 |
| Infiltrate extension on chest CT (%) * | 80 | 80 | 50 | 50 | 80 | 80 | 20 | 30 | 80 | 80 | 20 | 80 | 20 | 50 | 50 ± 60 (20–80) | 80 ± 30 (30–80) | 0.37 |
| Partial arterial oxygen tension per fraction of inspired oxygen (mmHg/%) * | 95 | 85 | 175 | 80 | 115 | 90 | 300 | 200 | 55 | 90 | 205 | 85 | 300 | 200 | 175 ± 205 (55–300) | 90 ± 115 (80–200) | 0.16 |
| ARDS | Y | Y | N | N | Y | Y | N | N | Y | Y | N | N | N | N | Y: 3/7 (42.9) | Y: 3/7 (42.9) | 1.0 |
| Cytokine storm | Y | Y | Y | Y | Y | Y | Y | Y | Y | Y | N | Y | Y | Y | Y: 6/7 (85.7) | Y: 7/7 (100%) | 1.0 |
| Respiratory SARS-CoV-2 RT-PCR positivity | Y | Y | Y | Y | Y | Y | Y | Y | Y | Y | Y | Y | Y | Y | Y: 7/7 (100%) | Y: 7/7 (100%) | 1.0 |
| Blood SARS-CoV-2 RT-PCR positivity | Y | Y | N | Y | Y | Y | N | Y | Y | Y | N | N | N | Y | Y: 3/7 (42.9) | Y: 6/7 (85.7) | 0.31 |
| ICU admission | N | Y | N | N | Y | Y | N | N | Y | Y | N | N | N | Y | Y: 2/7 (28.6) | Y: 4/7 (57.1) | 0.59 |
| Invasive mechanical ventilation | N | Y | N | N | Y | Y | N | N | Y | Y | N | N | N | N | Y: 2/7 (28.6) | Y: 3/7 (42.9) | 1.0 |
| Parameter | Baseline | Inclusion | Post-ECP Follow-Up | p Value * | |||
|---|---|---|---|---|---|---|---|
| +3 Days | +7 Days | +14 Days | +28 Days | ||||
| Blood absolute white blood cell count (×109/L) | 8.1 ± 3.2 (2.1–10.5) | 8.9 ± 7.4 (1.9–21.3) | 14.3 ± 7.4 (3.7–23.5) | 8.1 ± 2.4 (4.5–21.4) | 6.4 ± 6.4 (2.3–19.7) | 8.1 ± 2.5 (3.7–9.2) | 0.97 |
| Blood absolute neutrophil granulocyte count (×109/L) | 4.7 ± 2.0 (1.8–9.2) | 6.2 ± 7.9 (1.4–16.9) | 8.2 ± 6.9 (2.5–20.1) | 6.1 ± 4.6 (3.0–17.7) | 3.8 ± 5.1 (1.1–15.5) | 4.4 ± 1.9 (2.1–6.1) | 0.46 |
| Blood absolute lymphocyte count (×109/L) | 0.8 ± 1.7 (0.1–4.1) | 1.5 ± 1.3 (0.2–3.3) | 1.3 ± 1.1 (0.4–5.4) | 1.4 ± 1.7 (0.5–3.6) | 1.4 ± 1.2 (0.3–2.6) | 1.8 ± 1.6 (0.4–6.0) | 0.52 |
| Blood absolute monocyte count (×109/L) | 0.3 ± 0.2 (0.1–0.8) | 0.3 ± 0.3 (0.2–1.5) | 0.6 ± 0.5 (0.1–1.4) | 0.4 ± 0.3 (0.1–1.7) | 0.5 ± 0.7 (0.3–2.0) | 0.7 ± 0.6 (0.3–0.9) | 0.7 |
| Blood hemoglobin (g/L) | 113 ± 18 (96–141) | 136 ± 40 (86–140) | 111 ± 31 (76–142) | 98 ± 19 (82–131) | 96 ± 13 (84–133) | 85 ± 12 (75–139) | 0.07 |
| Blood platelet count (×109/L) | 177 ± 113 (49–368) | 302 ± 208 (43–853) | 230 ± 233 (26–432) | 167 ± 220 (30–498) | 111 ± 126 (43–705) | 156 ± 368 (35–783) | 0.87 |
| Serum lactate dehydrogenase (IU/L) | 943 ± 283 (400–1168) | 1096 ± 379 (530–1802) | 807 ± 200 (586–2020) | 693 ± 166 (505–847) | 473 ± 88 (389–626) | 522 ± 214 (274–626) | 0.02 |
| Serum glutamic pyruvate transaminase (IU/L) | 34 ± 16 (11–48) | 31 ± 39 (18–76) | 75 ± 41 (19–395) | 85 ± 71 (16–253) | 119 ± 192 (19–338) | 38 ± 56 (16–117) | 0.62 |
| Serum creatinine (μmol/L) | 117 ± 134 (64–364) | 127 ± 97 (61–315) | 93 ± 38 (46–371) | 113 ± 178 (33–317) | 98 ± 80 (35–281) | 68 ± 57 (29–120) | 0.1 |
| Serum ferritin (μg/L) | 1107 ± 1340 (35–2478) | 1488 ± 1110 (249–6241) | 1185 ± 2122 (284–4034) | 1709 ± 1895 (470–3052) | 822 ± 1247 (444–2439) | 715 ± 505 (324–3753) | 0.74 |
| Serum C-reactive protein (mg/L) | 114 ± 142 (33–279) | 39 ± 128 (1–245) | 30 ± 50 (4–94) | 44 ± 59 (2–192) | 43 ± 160 (0–338) | 35 ± 3 (0–46) | 0.28 |
| Serum procalcitonin (ng/mL) | 0.1 ± 0.1 (0–0.1) | 0.1 ± 0.1 (0–1.2) | 0 ± 0.1 (0–1.3) | 0.1 ± 0.1 (0–2.1) | 0.2 ± 0.6 (0–0.7) | 0 ± 0 (0–2.4) | 0.92 |
| Plasma D-dimer (ng/mL) | 1184 ± 568 (642–2128) | 1254 ± 1601 (659–3581) | 1145 ± 327 (799–1473) | 1411 ± 672 (496–2384) | 1592 ± 1108 (261–13920) | 763 ± 250 (597–965) | 0.21 |
| Parameter | Baseline | Inclusion | Post-ECP Follow-Up | p Value * | |||
|---|---|---|---|---|---|---|---|
| +3 Days | +7 Days | +14 Days | +28 Days | ||||
| Serum interferon-α (pg/mL) | 33.6 ± 25.8 (8.0–60.4) | 14.8 ± 11.8 (1.5–34.7) | 9.0 ± 3.3 (1.5–47.3) | 9.0 ± 10.5 (8.0–60.4) | 8.0 ± 0.3 (8.0–9.0) | 8.0 ± 0.1 (8.0–14.8) | 0.14 |
| Serum interferon-γ (pg/mL) | 7.7 ± 25.5 (1.3–48.6) | 1.3 ± 34.5 (1.3–37.7) | 10.0 ± 16.0 (1.3–44.7) | 1.3 ± 31.6 (1.3–148.3) | 7.4 ± 20.0 (1.3–44.9) | 6.0 ± 4.9 (1.3–22.1) | 0.33 |
| Plasma interleukin-1α (pg/mL) | 40.7 ± 23.6 (4.8–67.4) | 23.3 ± 16.3 (4.8–91.9) | 55.7 ± 45.0 (4.8–68.2) | 34.9 ± 48.0 (4.8–68.2) | 20.4 ± 156.1 (4.8–535.2) | 8.2 ± 55.9 (4.8–60.7) | 0.18 |
| Plasma interleukin-1β (pg/mL) | 7.2 ± 9.0 (1.6–11.9) | 1.6 ± 3.8 (1.6–9.2) | 4,2 ± 5,8 (1.6–10.6) | 1.6 ± 4.6 (1.6–40.1) | 1.9 ± 1.6 (1.6–6.2) | 1.6 ± 0.1 (1.6–1.7) | 0.12 |
| Plasma interleukin-2 (pg/mL) | 1.0 ± 1.1 (0.6–10.6) | 0.6 ± 0.7 (0.6–2.2) | 0.6 ± 0.8 (0.6–6.9) | 0.6 ± 0.1 (0.6–16.8) | 0.8 ± 1.1 (0.6–4.5) | 0.6 ± 0.3 (0.6–1.7) | 1.0 |
| Plasma interleukin-4 (pg/mL) | 2.2 ± 6.3 (0.9–15.2) | 3.2 ± 2.8 (0.6–10.1) | 1.7 ± 4.6 (0.6–6.2) | 1.0 ± 10.5 (0.6–45.2) | 2.6 ± 5.9 (0.6–12.6) | 1.3 ± 2.1 (0.6–8.4) | 0.44 |
| Plasma interleukin-5 (pg/mL) | 4.7 ± 21.7 (0.6–44.9) | 2.7 ± 1.4 (0.6–3.0) | 1.2 ± 0.7 (1.0–5.0) | 1.6 ± 129.5 (0.6–494.3) | 3.7 ± 19.0 (1.1–63.9) | 6.3 ± 21.1 (1.0–23.6) | 0.44 |
| Plasma interleukin-6 (pg/mL) | 38.0 ± 38.0 (11.5–168.0) | 203.5 ± 1688.0 (8.5–2776.0) | 134.5 ± 398.5 (7.5–904.0) | 84.0 ± 461.5 (20.5–1952.0) | 751.0 ± 1907.0 (12.5–4381.0) | 6.5 ± 24.0 (3.0–634.5) | 0.04 |
| Plasma interleukin-8 (pg/mL) | 28.9 ± 12.6 (5.2–94.0) | 14.3 ± 31.9 (11.3–66.6) | 22.6 ± 8.1 (9.7–68.1) | 34.2 ± 25.1 (8.3 ± 107.3) | 30.0 ± 12.5 (7.0–36.3) | 26.5 ± 21.7 (11.9–44.0) | 0.41 |
| Plasma interleukin-10 (pg/mL) | 20.9 ± 10.6 (2.6–26.2) | 8.5 ± 18.5 (2.6–39.6) | 35.7 ± 17.5 (2.6 ± 86.3) | 21.9 ± 90.1 (5.0–135.1) | 4.4 ± 160.7 (2.6–634.7) | 18.0 ± 36.3 (2.6–70.3) | 0.64 |
| Plasma interleukin-12 (pg/mL) | 4.0 ± 3.5 (3.0–93.8) | 3.0 ± 4.3 (3.0–57.8) | 3.0 ± 0.1 (3.0–71.9) | 3.0 ± 0.9 (3.0–247.8) | 3.0 ± 15.2 (3.0–63.7) | 3.0 ± 0.3 (3.0–32.2) | 0.11 |
| Plasma interleukin-13 (pg/mL) | 32.2 ± 62.2 (6.4–274.5) | 20.7 ± 100.2 (6.4–264.1) | 18.5 ± 76.5 (6.4–111.1) | 10.6 ± 109.7 (6.4–408.7) | 30.5 ± 68.8 (6.4 ± 137.2) | 19.7 ± 30.5 (6.4–79.9) | 0.59 |
| Plasma interleukin-15 (pg/mL) | 13.8 ± 7.5 (6.9–21.6) | 9.7 ± 8.2 (7.9–26.3) | 13.5 ± 6.9 (6.4–25.6) | 7.6 ± 3.3 (5.3–32.9) | 4.3 ± 1.0 (3.0–5.9) | 7.2 ± 5.9 (4.0 ± 12.9) | 0.68 |
| Plasma interleukin-17A (pg/mL) | 6.5 ± 5.9 (1.3–11.1) | 4.1 ± 3.8 (1.3–9.2) | 4.7 ± 2.8 (1.3–7.4) | 1.3 ± 1.4 (1.3–8.3) | 1.3 ± 0.1 (1.3–1.3) | 1.3 ± 0.1 (1.3–1.3) | <0.01 |
| Serum IP-10 (pg/mL) | 1732.8 ± 2939.5 (205.0–5024.9) | 120.7 ± 587.7 (101.8–1071.0) | 166.3 ± 357.7 (63.9–583.4) | 216.3 ± 230.3 (79.9–374.1) | 104.9 ± 135.3 (73.6–488.9) | 135.5 ± 193.9 (95.0–310.1) | 0.5 |
| Serum MCP-1 (pg/mL) | 972.8 ± 2068.9 (362.9–4650.5) | 761.2 ± 680.3 (255.9–1886.2) | 600.5 ± 204.6 (372.0–1484.6) | 682.2 ± 123.7 (296.5–4010.7) | 526.6 ± 432.9 (337.5–1512.0) | 468.3 ± 18.8 (335.4–1408.2) | 0.5 |
| Serum MIP-1α (pg/mL) | 22.7 ± 17.2 (3.0–43.5) | 15.1 ± 6.6 (3.0–47.9) | 15.1 ± 11.8 (3.0–47.9) | 13.1 ± 39.0 (3.0–87.5) | 9.8 ± 31.4 (3.0–87.9) | 11.3 ± 10.6 (3.0–33.8) | 0.4 |
| Serum RANTES (pg/mL) | 2416.4 ± 2479.9 (831.1–6169.0) | 4172.3 ± 1419.0 (1125.9–17271.7) | 3523.7 ± 1976.1 (320.7–7093.2) | 2576.8 ± 1186.9 (624.5–3021.3) | 2040.4 ± 589.2 (1068.8–2959.3) | 1834.2 ± 1262.6 (619.7–2887.7) | 0.85 |
| Serum TNF-α (pg/mL) | 59.9 ± 44.0 (24.7–155.6) | 38.5 ± 33.3 (18.5–80.2) | 39.6 ± 16.8 (28.8–60.2) | 39.6 ± 152.4 (6.4–244.0) | 32.0 ± 37.3 (13.4–100.3) | 26.3 ± 18.7 (8.0–47.6) | 0.86 |
| Serum TNF-β (pg/mL) | 22.0 ± 54.2 (2.2–69.2) | 18.5 ± 35.4 (1.6–71.0) | 10.8 ± 13.0 (1.6–39.7) | 5.3 ± 56.7 (1.6–72.7) | 9.2 ± 15.8 (1.6–25.8) | 4.6 ± 11.6 (1.6–15.3) | 0.33 |
| Serum IgG (g/L) | 7.8 ± 3.8 (1.3–15.4) | 8.0 ± 1.9 (4.8–12.0) | 7.7 ± 0.7 (6.7–8.0) | 6.1 ± 1.8 (4.9–11.9) | 7.6 ± 0.1 (7.0–9.5) | 7.6 ± 2.4 (7.2–9.8) | 0.05 |
| Serum IgA (g/L) | 1.9 ± 0.9 (0.5–5.1) | 2.1 ± 0.8 (0.3–3.3) | 1.4 ± 1.0 (0.5–2.6) | 2.0 ± 1.8 (0.4–3.0) | 1.9 ± 0.1 (1.9–1.9) | 1.9 ± 0.7 (0.5–2.0) | 0.97 |
| Serum IgM (g/L) | 1.3 ± 1.1 (0.1–2.4) | 0.8 ± 0.6 (0–1.9) | 0.8 ± 1.7 (0–3.5) | 1.0 ± 1.2 (0–2.6) | 0.9 ± 0.1 (0–0.9) | 0.9 ± 0.1 (0.1–3.1) | 0.9 |
| Serum electrophoresis/immunofixation | Normal/negative | Normal/negative | Normal/negative | Normal/negative | Normal/negative | Normal/negative | n.a. |
| Serum C3 (g/L) | 1.3 ± 0.3 (0.6–1.7) | 1.1 ± 0.3 (1.0–1.6) | 1.3 ± 0.8 (0.9–2.0) | 1.7 ± 0.4 (0.9–1.7) | 0.9 ± 0.1 (0.8–1.0) | 1.0 ± 0.1 (0.8–1.8) | 1 |
| Serum C4 (g/L) | 0.3 ± 0.1 (0.2–0.5) | 0.3 ± 0.1 (0.1–0.4) | 0.3 ± 0.2 (0–0.4) | 0.3 ± 0.3 (0–0.4) | 0.1 ± 0.1 (0.1–0.2) | 0.2 ± 0.1 (0.1–0.5) | 0.97 |
| Serum ENA ELISA | Below c/o | Below c/o | Below c/o | Below c/o | Below c/o | Below c/o | n.a. |
| Serum anti-dsDNA (IU/mL) | 4.0 ± 7.5 (1.0–16.0) | 3.0 ± 0.8 (1.0–4.0) | 2.5 ± 3.0 (1.0–10.0) | 4.0 ± 1.0 (3.0–5.0) | 6.5 ± 0.5 (6.0–7.0) | 3.0 ± 4.0 (1.0–7.0) | 0.46 |
| Serum ANCA IF | Below c/o | Below c/o | Below c/o | Below c/o | Below c/o | Below c/o | n.a. |
| Serum ANA IF | Below c/o | Below c/o | Below c/o | Below c/o | Below c/o | Below c/o | n.a. |
| Parameter | Baseline | Inclusion | Post-ECP Follow-Up | p Value * | |||
|---|---|---|---|---|---|---|---|
| +3 Days | +7 Days | +14 Days | +28 Days | ||||
| Regulatory T-cell ratio (%) | 0.1 ± 0.1 (0.1–0.3) | 0.1 ± 0.1 (0–0.3) | 0.4 ± 0.1 (0.4–0.5) | 0.1 ± 0.5 (0.1–1.0) | 0.3 ± 0.1 (0.3–0.3) | 0.2 ± 0.3 (0.1–0.3) | 0.74 |
| CD3+ T-cell count (cells/μL) | 656 ± 654 (277–2377) | 367 ± 473 (321–1267) | 469 ± 113 (382–609) | 802 ± 560 (445–1990) | 1987 ± 447 (1536–2430) | 1888 ± 789 (1454–4324) | 0.28 |
| CD3+/CD8+ T-cell count (cells/μL) | 215 ± 164 (158–630) | 117 ± 71 (97–318) | 193 ± 47 (119–213) | 194 ± 31 (150–246) | 189 ± 77 (89–244) | 287 ± 125 (112–361) | 0.87 |
| CD3+/CD4+ T-cell count (cells/μL) | 406 ± 542 (213–1834) | 203 ± 677 (96–2187) | 481 ± 796 (342–1934) | 711 ± 741 (282–1766) | 1286 ± 889 (397–2175) | 1159 ± 1946 (61–3954) | 0.46 |
| CD3-/CD16+/CD56+ NK-cell count (cells/μL) | 90 ± 33 (65–162) | 38 ± 77 (11–245) | 56 ± 48 (26–124) | 42 ± 24 (20–68) | 35 ± 5 (29–39) | 59 ± 25 (33–84) | 0.88 |
| CD19+ B-cell count (cells/μL) | 126 ± 69 (59–198) | 44 ± 97 (6.0–191.7) | 136 ± 213 (96–523) | 188 ± 47 (107–202) | 235 ± 111 (43–267) | 212 ± 197 (59–453) | 0.2 |
| Double-negative T-cell ratio (%) | 1.0 ± 0.7 (0–3.4) | 1.7 ± 2.1 (0.2–7.5) | 0.8 ± 2.5 (0.6–5.6) | 1.1 ± 0.8 (0.5–2.0) | 1.1 ± 0.7 (0.4–1.9) | 0.4 ± 2.0 (0.2–4.1) | 0.28 |
| Double-positive T-cell ratio (%) | 0.1 ± 0.3 (0.01–0.8) | 0.1 ± 0.4 (0.04–1.2) | 0.1 ± 0.1 (0.03–0.2) | 0.1 ± 0.1 (0.01–0.2) | 0.1 ± 0.1 (0.05–0.12) | 0.2 ± 0.1 (0.1–0.2) | 1.0 |
| Counts within the CD3+ gate: | |||||||
| CD3+/TCRαβ+ T-cell (cells/μL) | 949 ± 221 (687–1546) | 601 ± 631 (212–2368) | 489 ± 83 (435–601) | 906 ± 774 (434–1982) | 567 ± 1128 (164–2421) | 1440 ± 2067 (172–4301) | 1.0 |
| CD3+/TCRγδ+ T-cell (cells/μL) | 23.5 ± 19.6 (14.3–53.7) | 43.1 ± 37.3 (7.1–77.3) | 27.6 ± 21.9 (6.7–45.6) | 10.2 ± 2.5 (6.0–11.0) | 14.1 ± 4.3 (9.7–18.4) | 13.1 ± 3.1 (11.0–17.3) | 0.23 |
| CD3+/CD25+ T-cell (cells/μL) | 54.3 ± 26.5 (14.2–67.1) | 19.3 ± 9.9 (2.8–26.6) | 63.5 ± 23.4 (42.1–88.9) | 77.9 ± 148.0 (21.9–317.9) | 48.0 ± 33.5 (14.6–81.5) | 60.5 ± 108.6 (12.7–229.8) | 0.14 |
| CD3+/HLA-DR+ T-cell (cells/μL) | 146.6 ± 211.5 (23.1–524.8) | 89.6 ± 203.2 (44.7–615.8) | 304.9 ± 297.1 (49.1–682.4) | 56.1 ± 333.8 (45.0–712.6) | 358.9 ± 307.4 (51.2–666.1) | 98.1 ± 375.0 (41.7–1370.8) | 0.56 |
| Counts within the CD4+ gate: | |||||||
| CD4+/CD45RA+ naive T-cell (cells/μL) | 162.3 ± 487.3 (86.2–1548.2) | 105.8 ± 599.3 (11.9–2045.4) | 152.4 ± 110.1 (29.4–249.6) | 335.6 ± 767.6 (102.4–1637.5) | 1056.0 ± 869.6 (186.4–1925.6) | 547.1 ± 1807.0 (16.2–3630.1) | 0.69 |
| CD4+/CD45RO+ memory T-cell (cells/μL) | 89.9 ± 53.9 (26.5–112.2) | 113.4 ± 60.8 (52.0–140.0) | 206.1 ± 21.9 (184.2–227.9) | 178.2 ± 121.1 (129.0–371.2) | 229.4 ± 16.4 (213.0–245.9) | 286.7 ± 195.7 (45.3–602.7) | 0.2 |
| Counts within the CD8+ gate: | |||||||
| CD8+/CD45RA+ naive T-cell (cells/μL) | 167.2 ± 34.3 (147.8–216.4) | 175.0 ± 171.3 (46.6–506.6) | 173.5 ± 186.5 (65.3–438.1) | 102.2 ± 21.1 (65.2–107.6) | 74.0 ± 24.1 (49.9–98.1) | 90.5 ± 29.5 (78.5–136.9) | 0.93 |
| CD8+/CD45RO+ memory T-cell (cells/μL) | 42.5 ± 24.8 (12.8–62.4) | 76.2 ± 94.1 (20.9–136.4) | 51.2 ± 2.2 (48.7–53.1) | 90.0 ± 53.3 (41.6–147.7) | 159.5 ± 33.1 (126.4–192.6) | 144.4 ± 127.0 (21.6–275.7) | 0.03 |
Disclaimer/Publisher’s Note: The statements, opinions and data contained in all publications are solely those of the individual author(s) and contributor(s) and not of MDPI and/or the editor(s). MDPI and/or the editor(s) disclaim responsibility for any injury to people or property resulting from any ideas, methods, instructions or products referred to in the content. |
© 2023 by the authors. Licensee MDPI, Basel, Switzerland. This article is an open access article distributed under the terms and conditions of the Creative Commons Attribution (CC BY) license (https://creativecommons.org/licenses/by/4.0/).
Share and Cite
Szabó, B.G.; Reményi, P.; Tasnády, S.; Korózs, D.; Gopcsa, L.; Réti, M.; Várkonyi, A.; Sinkó, J.; Lakatos, B.; Szlávik, J.; et al. Extracorporeal Photopheresis as a Possible Therapeutic Approach for Adults with Severe and Critical COVID-19 Non-Responsive to Standard Treatment: A Pilot Investigational Study. J. Clin. Med. 2023, 12, 5000. https://doi.org/10.3390/jcm12155000
Szabó BG, Reményi P, Tasnády S, Korózs D, Gopcsa L, Réti M, Várkonyi A, Sinkó J, Lakatos B, Szlávik J, et al. Extracorporeal Photopheresis as a Possible Therapeutic Approach for Adults with Severe and Critical COVID-19 Non-Responsive to Standard Treatment: A Pilot Investigational Study. Journal of Clinical Medicine. 2023; 12(15):5000. https://doi.org/10.3390/jcm12155000
Chicago/Turabian StyleSzabó, Bálint Gergely, Péter Reményi, Szabolcs Tasnády, Dorina Korózs, László Gopcsa, Marienn Réti, Andrea Várkonyi, János Sinkó, Botond Lakatos, János Szlávik, and et al. 2023. "Extracorporeal Photopheresis as a Possible Therapeutic Approach for Adults with Severe and Critical COVID-19 Non-Responsive to Standard Treatment: A Pilot Investigational Study" Journal of Clinical Medicine 12, no. 15: 5000. https://doi.org/10.3390/jcm12155000
APA StyleSzabó, B. G., Reményi, P., Tasnády, S., Korózs, D., Gopcsa, L., Réti, M., Várkonyi, A., Sinkó, J., Lakatos, B., Szlávik, J., Bekő, G., Bobek, I., & Vályi-Nagy, I. (2023). Extracorporeal Photopheresis as a Possible Therapeutic Approach for Adults with Severe and Critical COVID-19 Non-Responsive to Standard Treatment: A Pilot Investigational Study. Journal of Clinical Medicine, 12(15), 5000. https://doi.org/10.3390/jcm12155000