

Sodium Glucose Cotransporter-2 Inhibitor Empagliflozin Increases Antioxidative Capacity and Improves Renal Function in Diabetic Rats


Abstract
1. Introduction
2. Methods
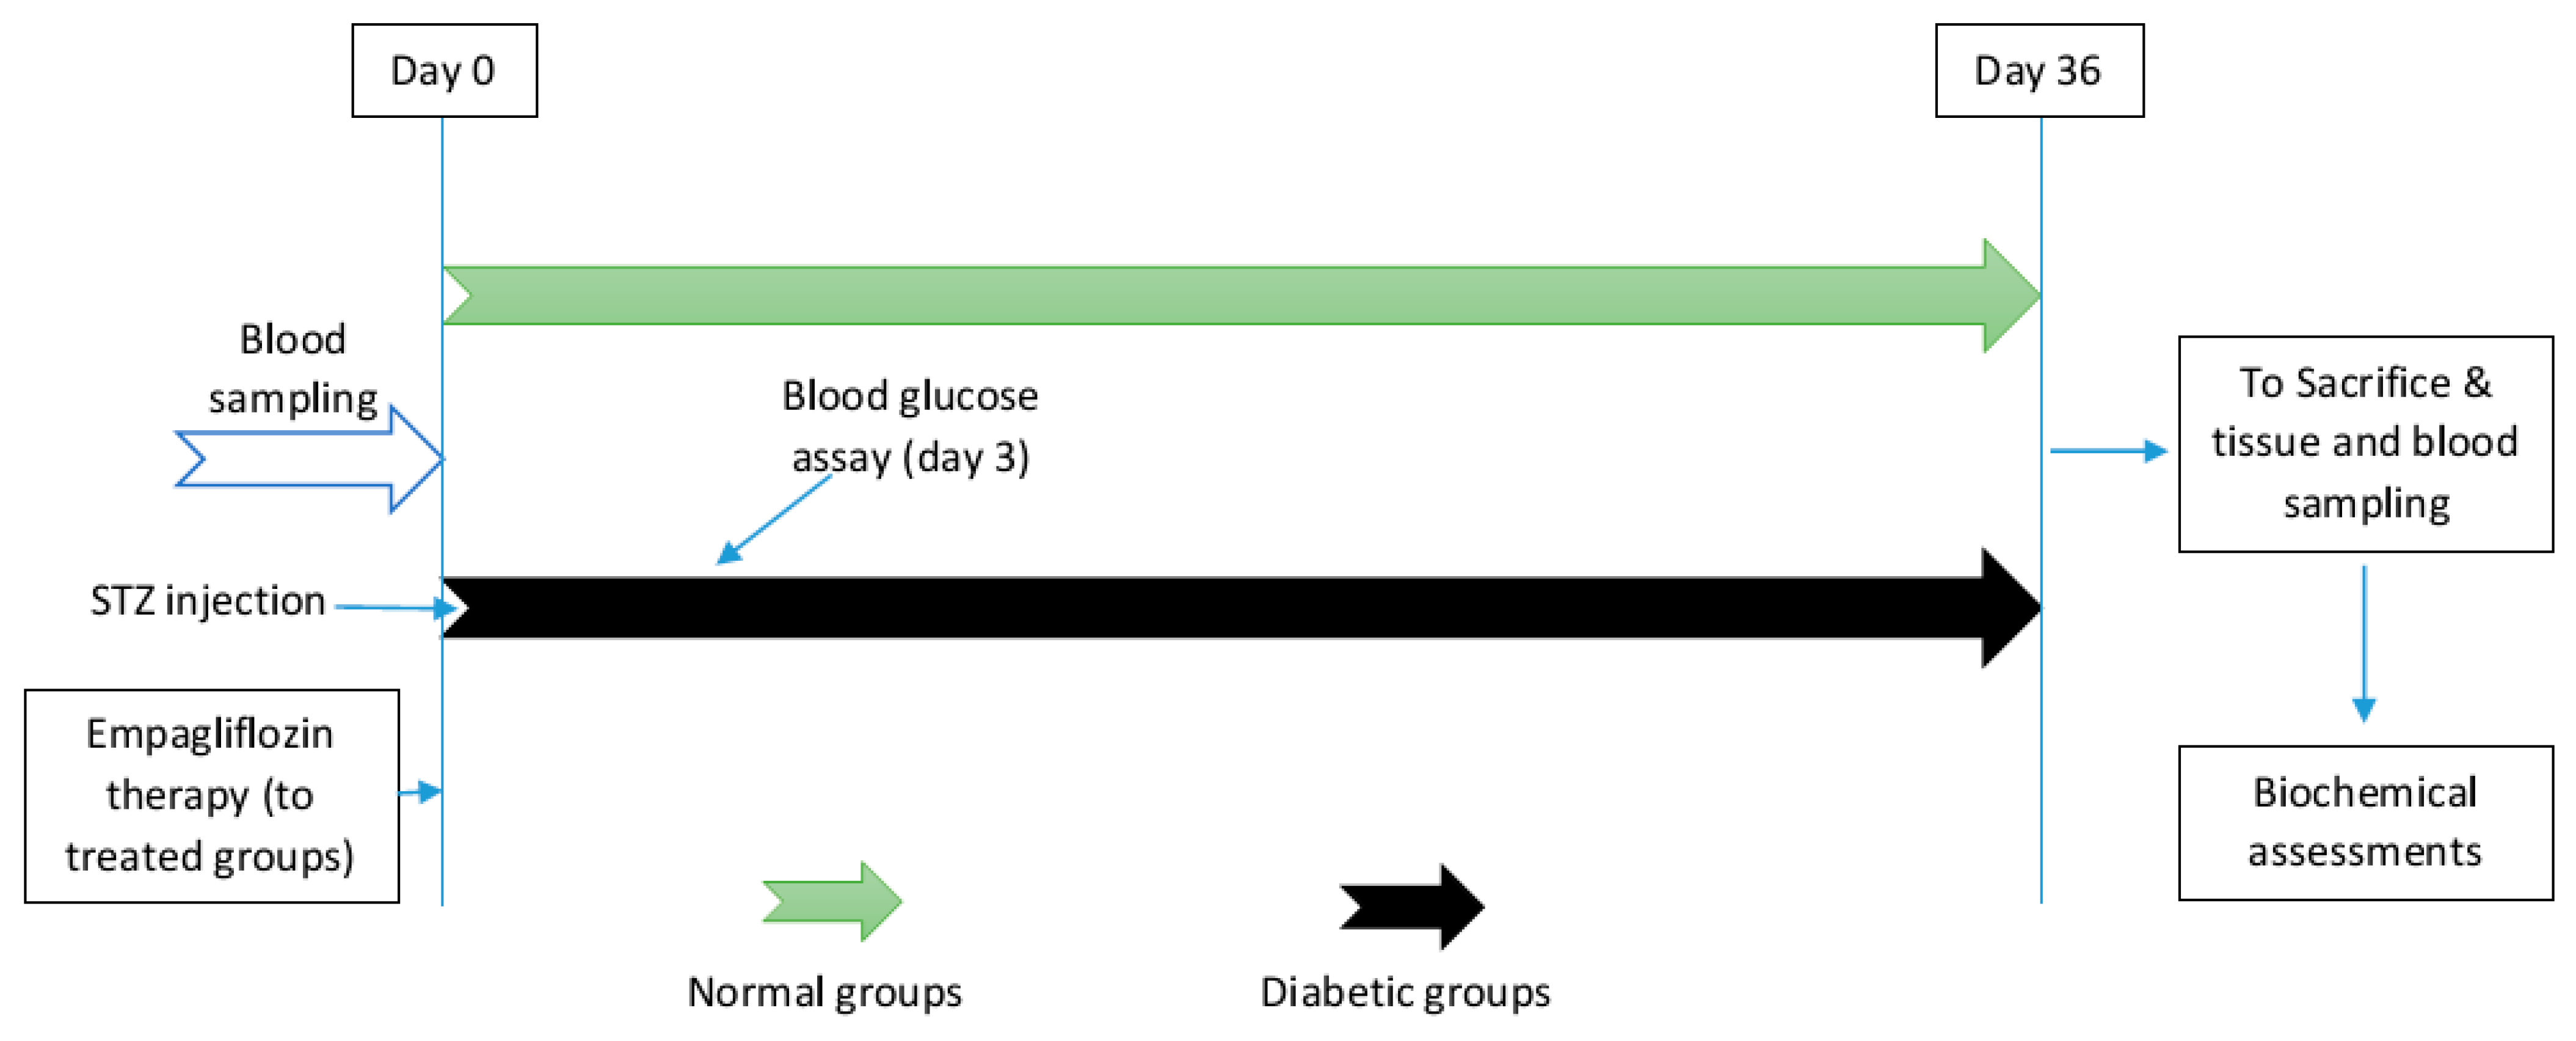
2.1. Animals
2.2. Diabetes Induction and Treatment
2.3. Blood and Tissue Sampling
2.4. Tissue Preparation
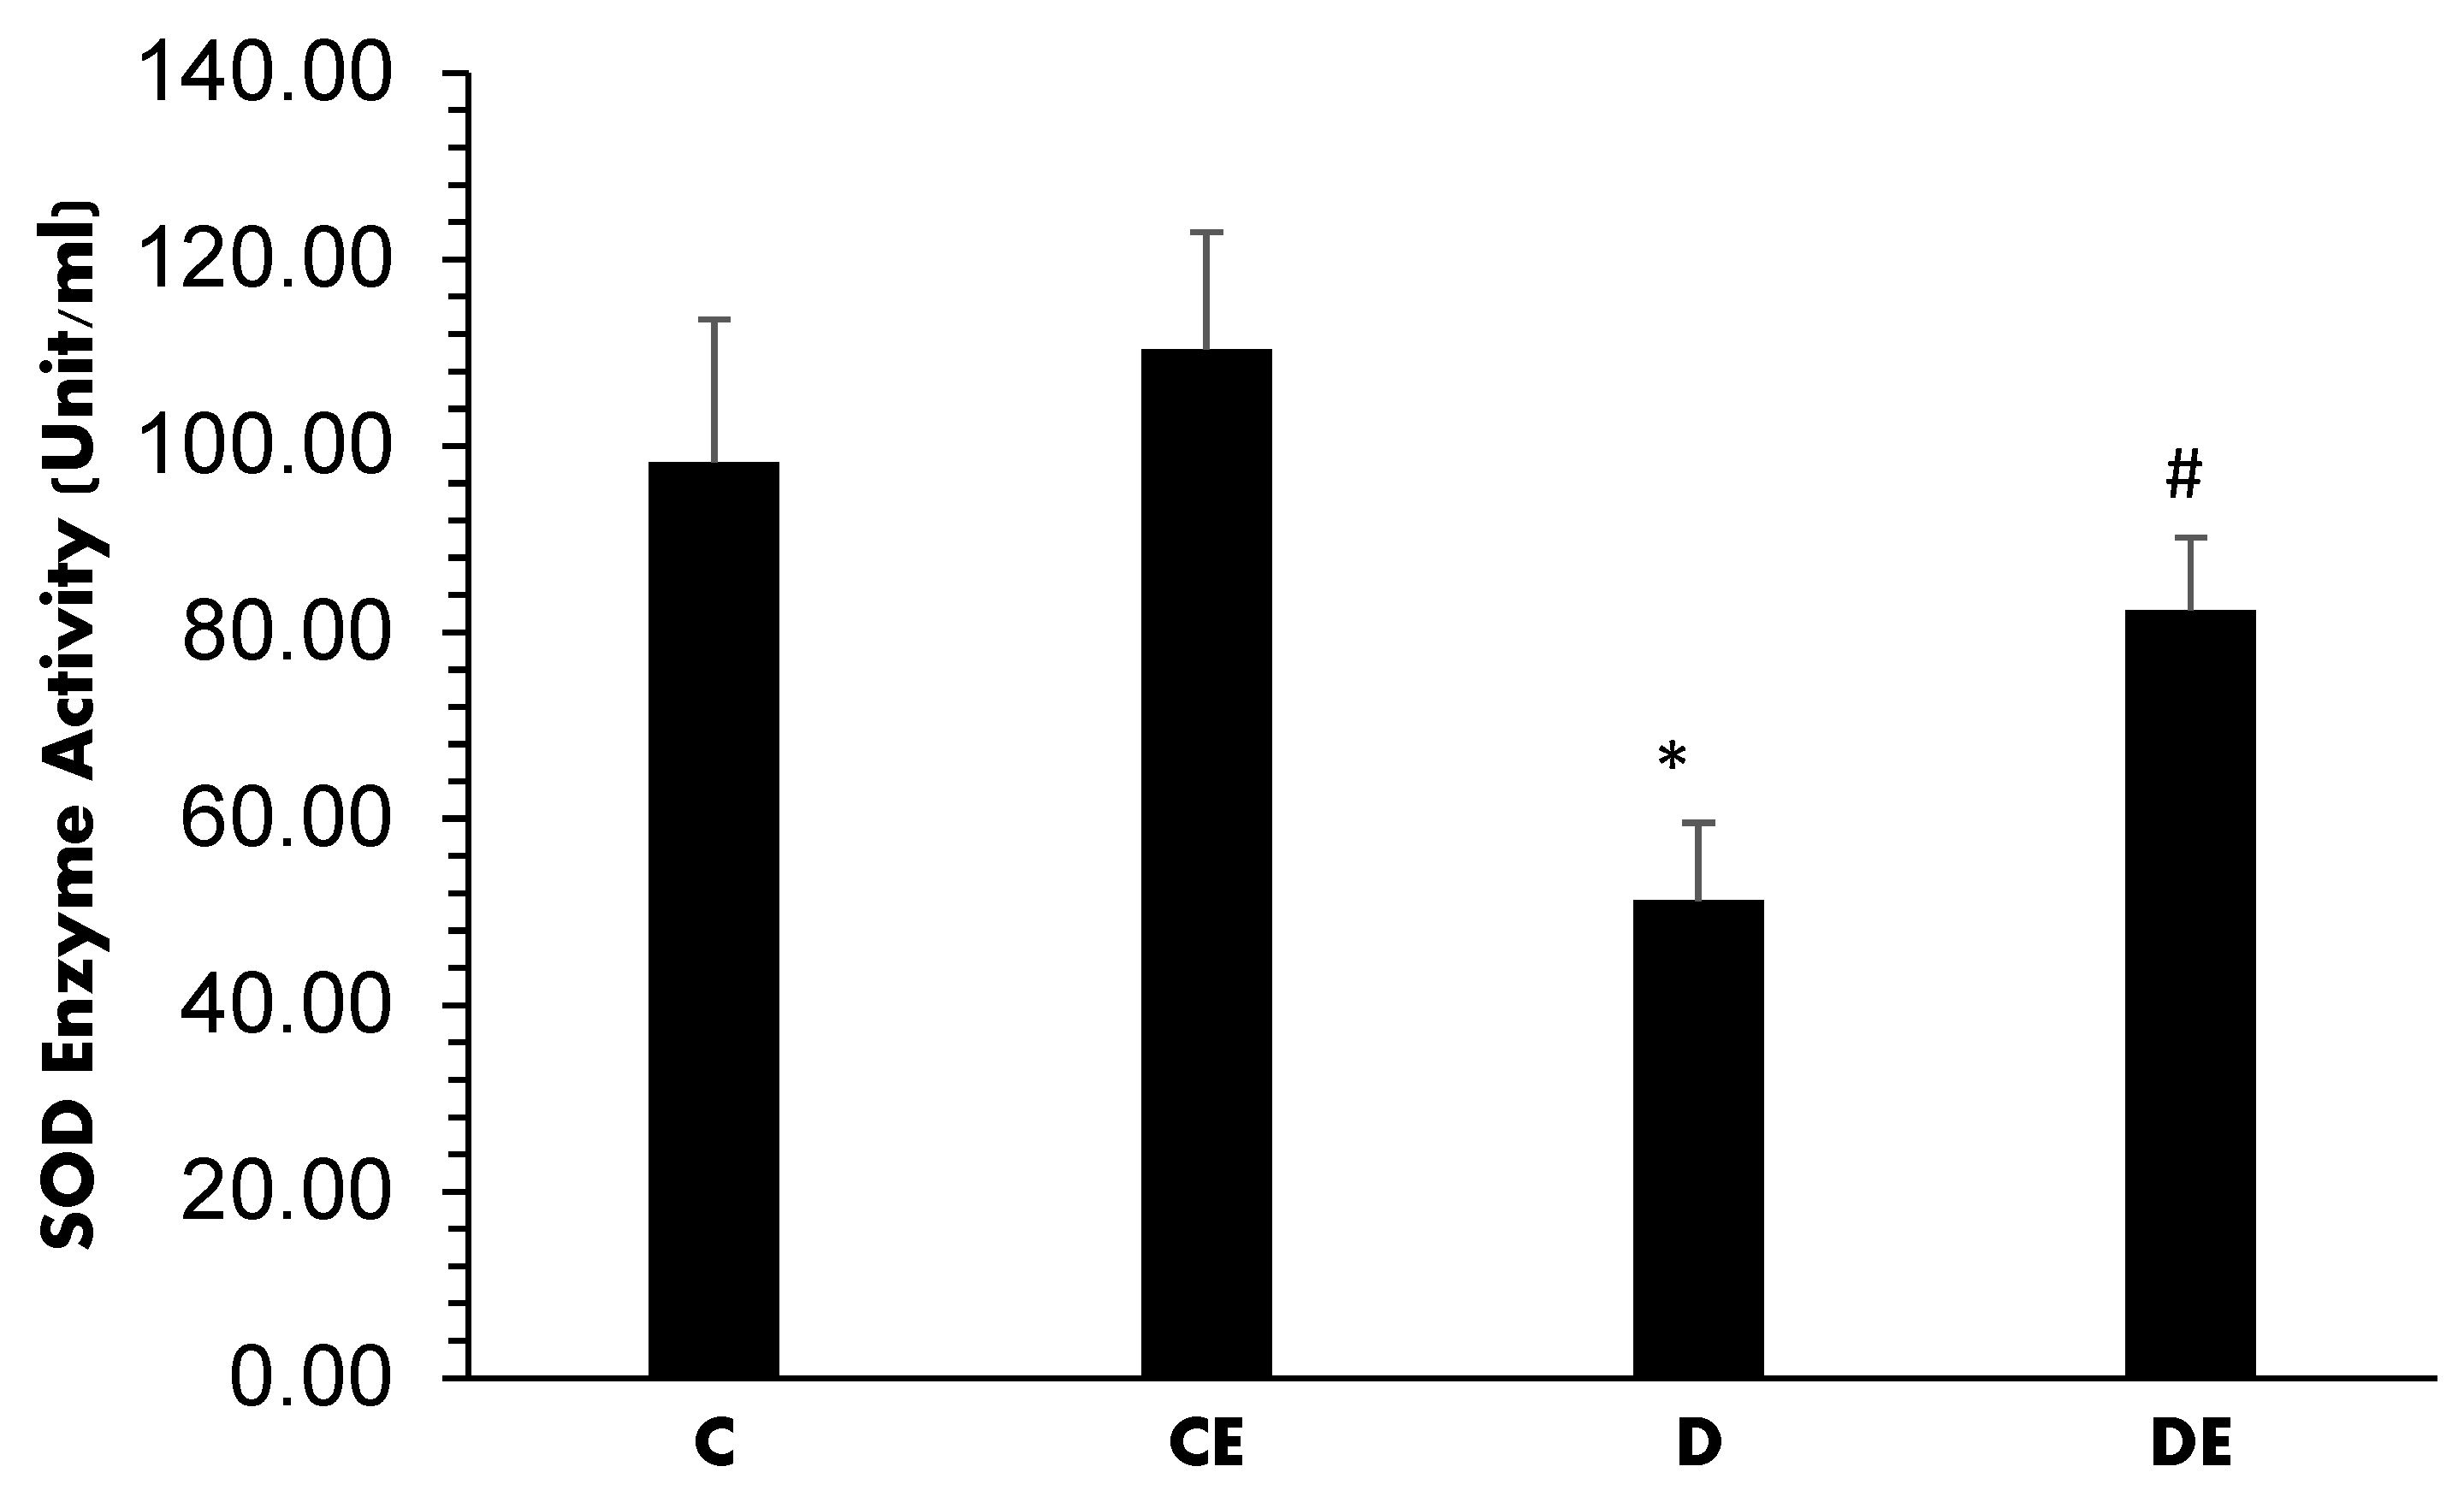
2.4.1. Superoxide Dismutase (SOD) Activity
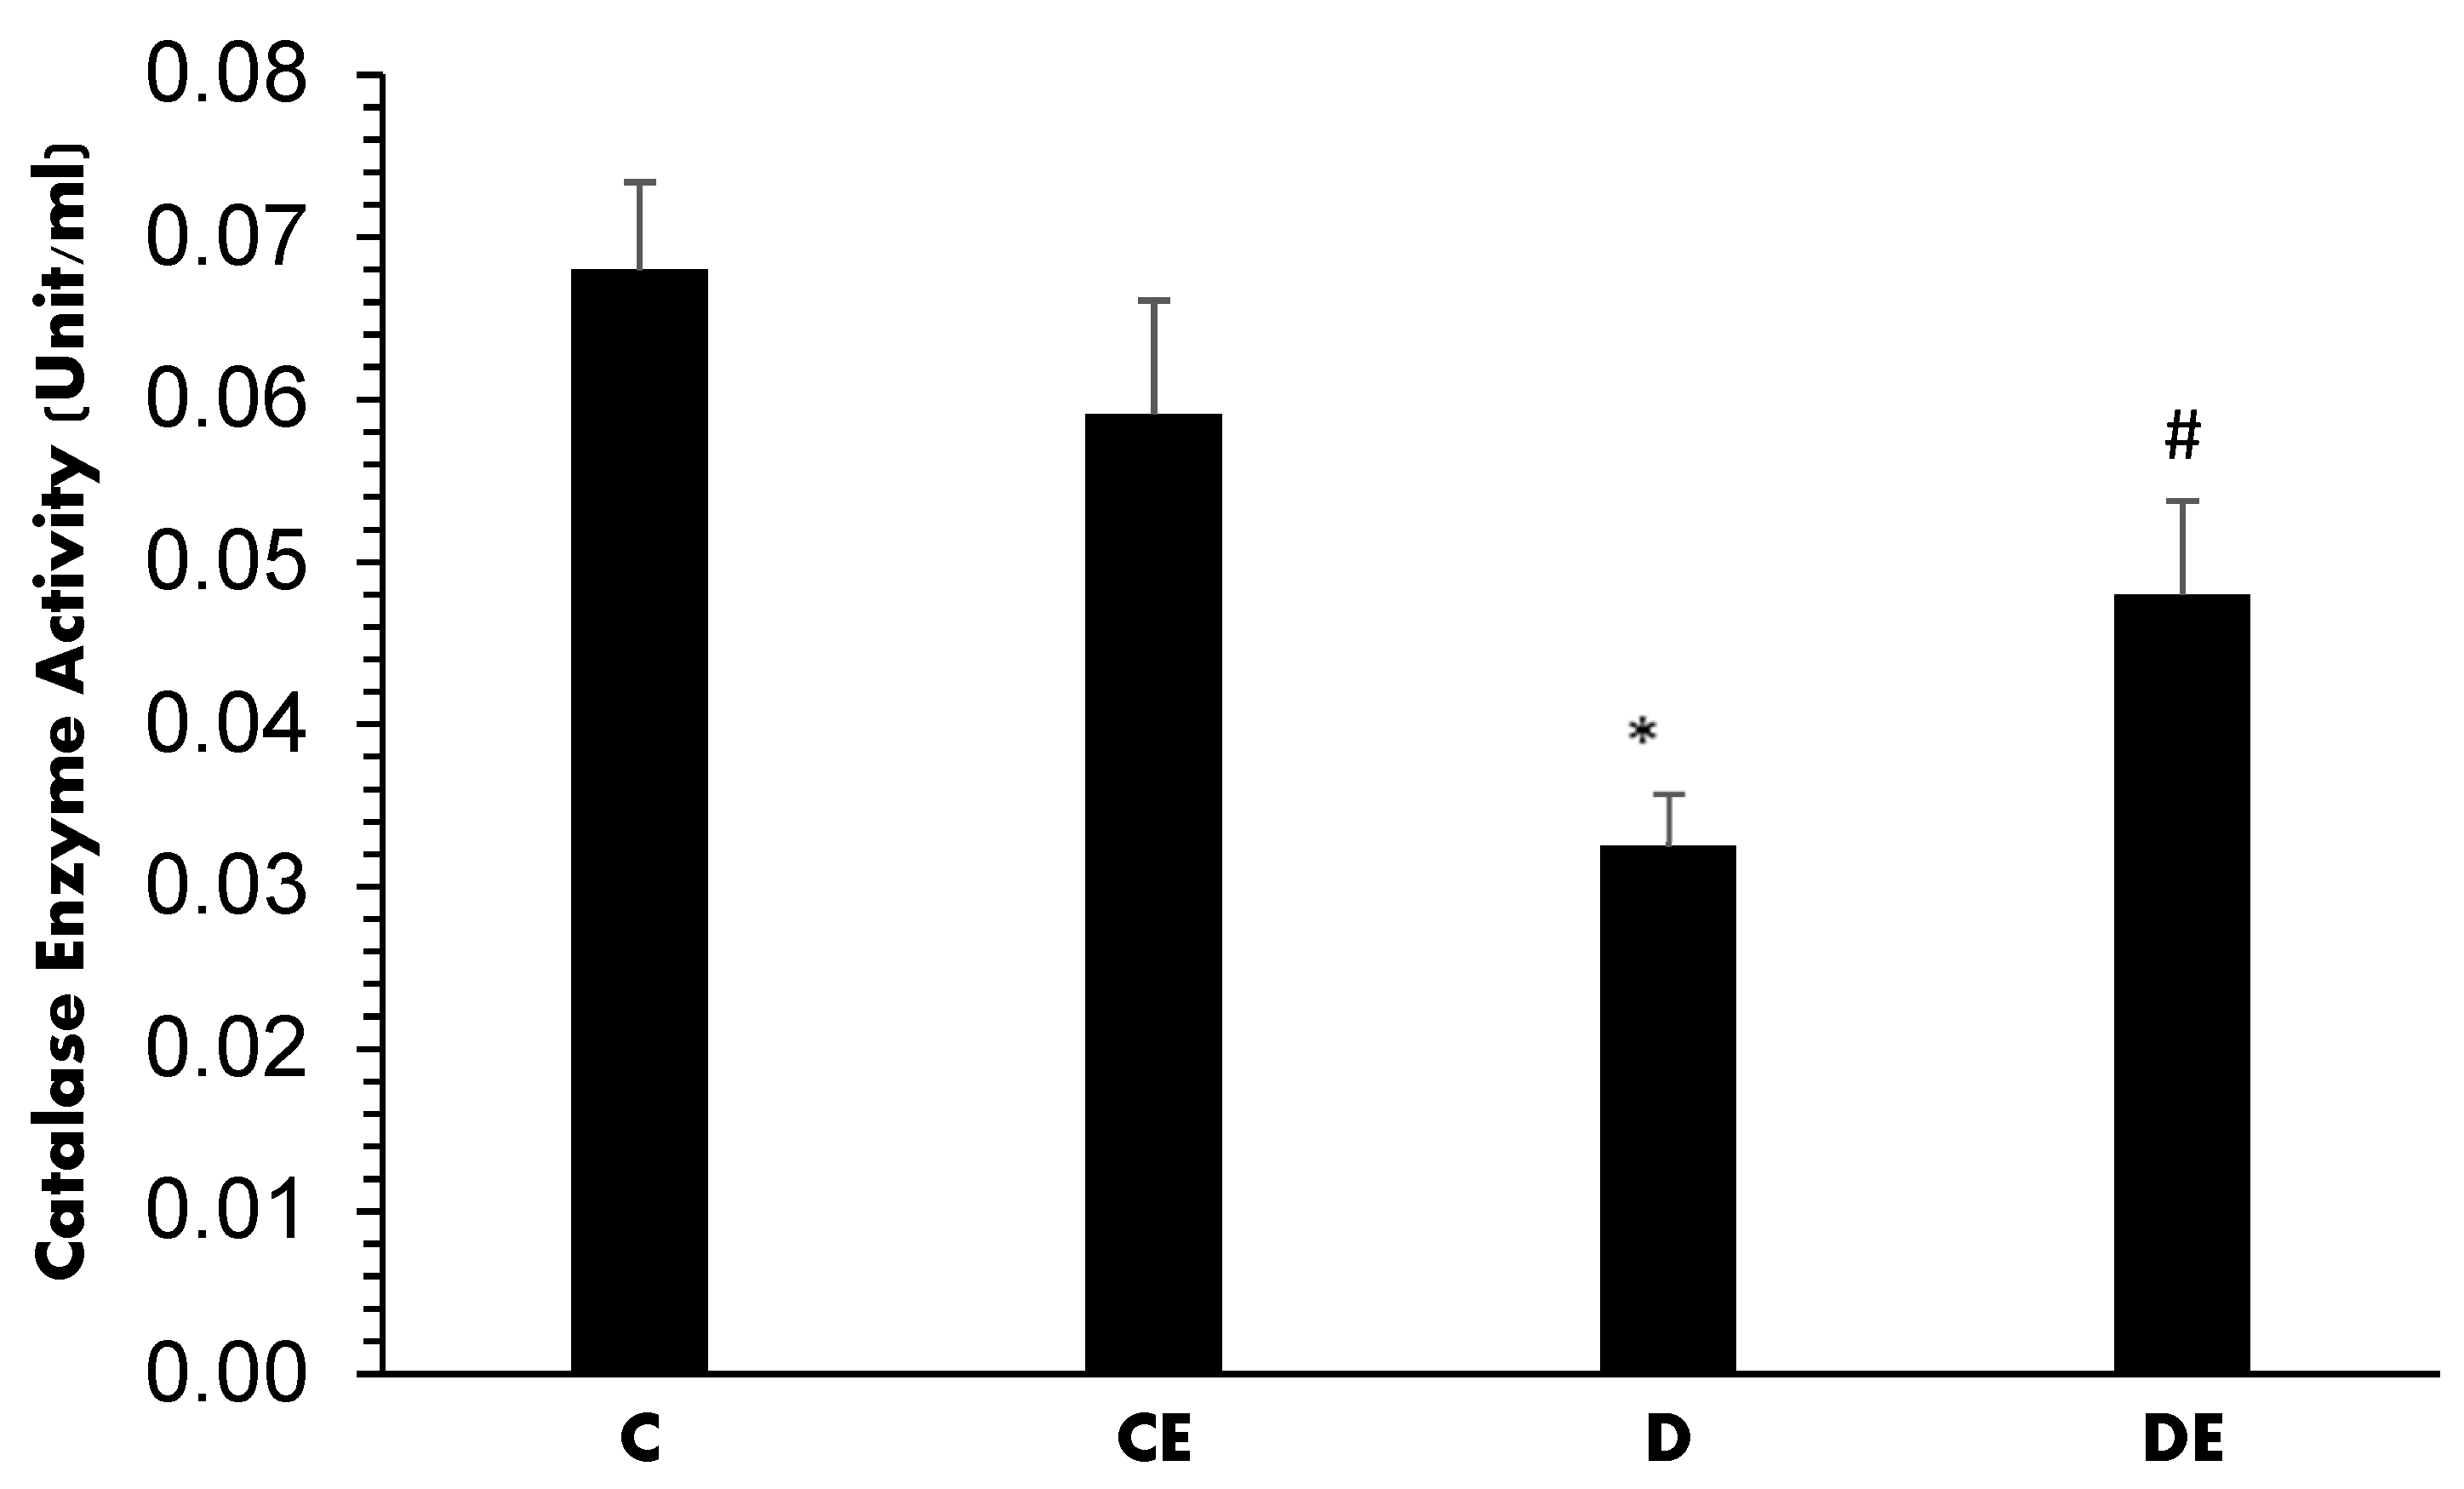
2.4.2. Catalase (CAT) Activity
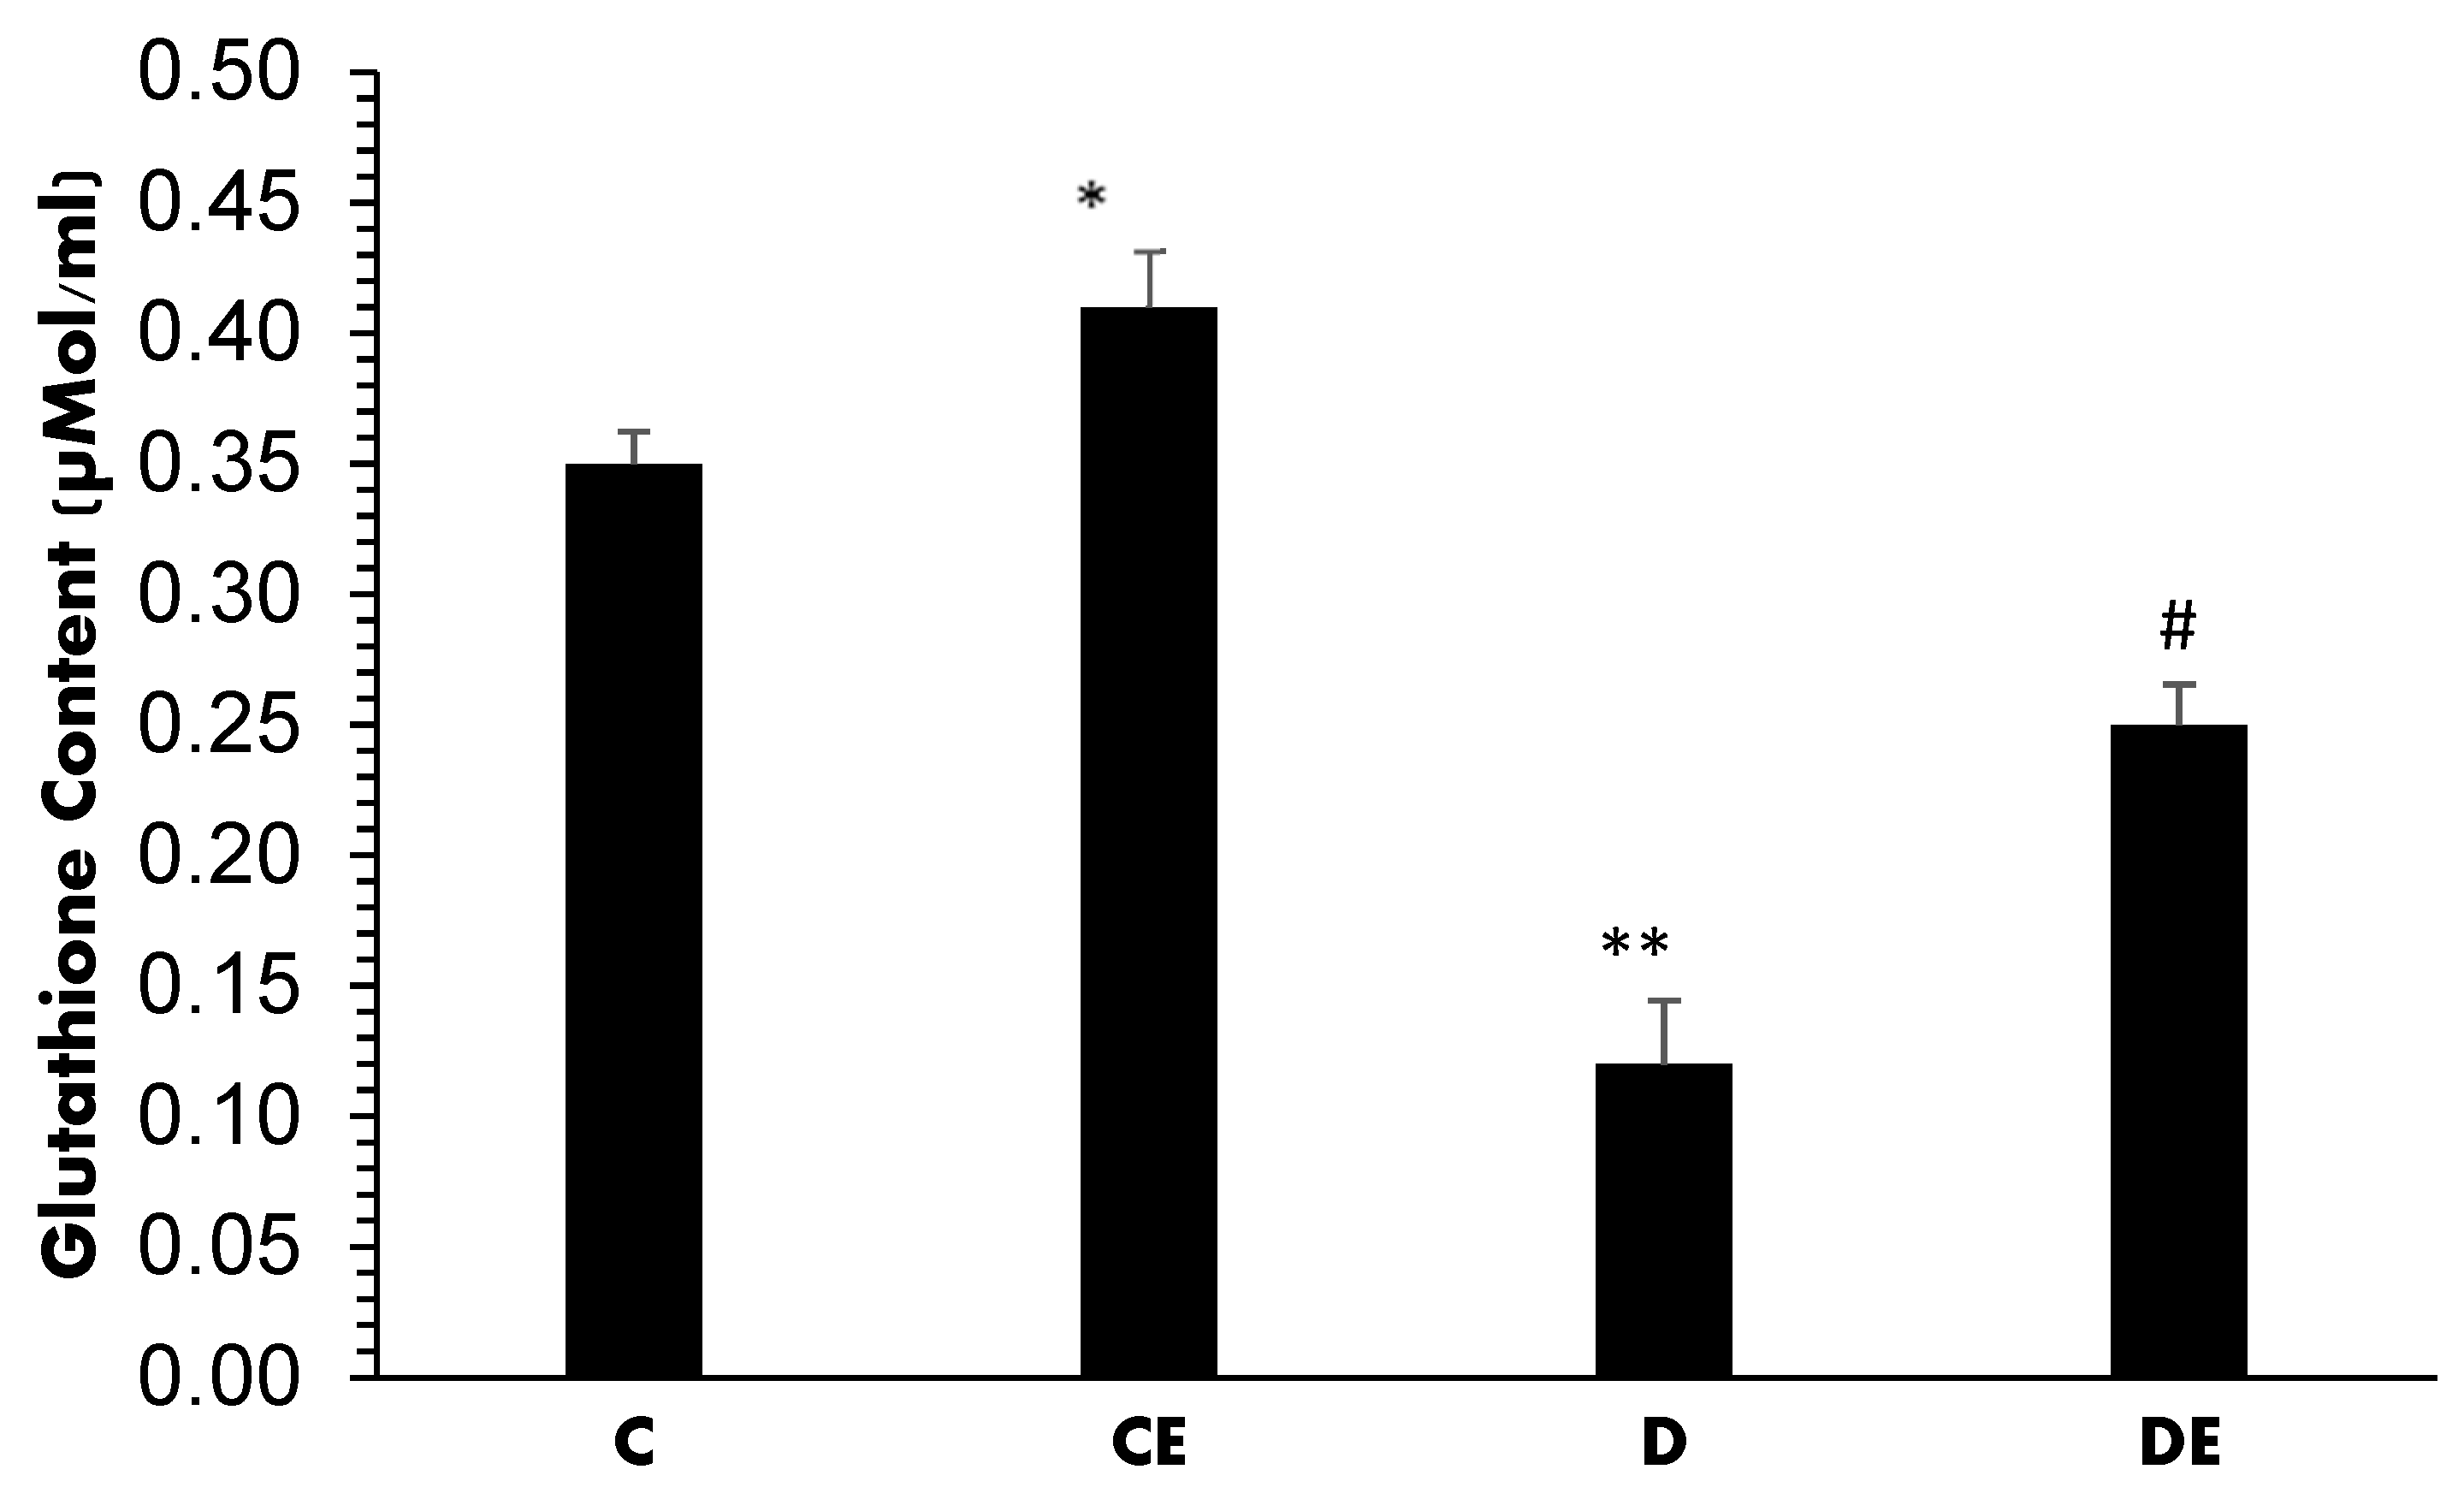
2.4.3. Glutathione (GLT) Content
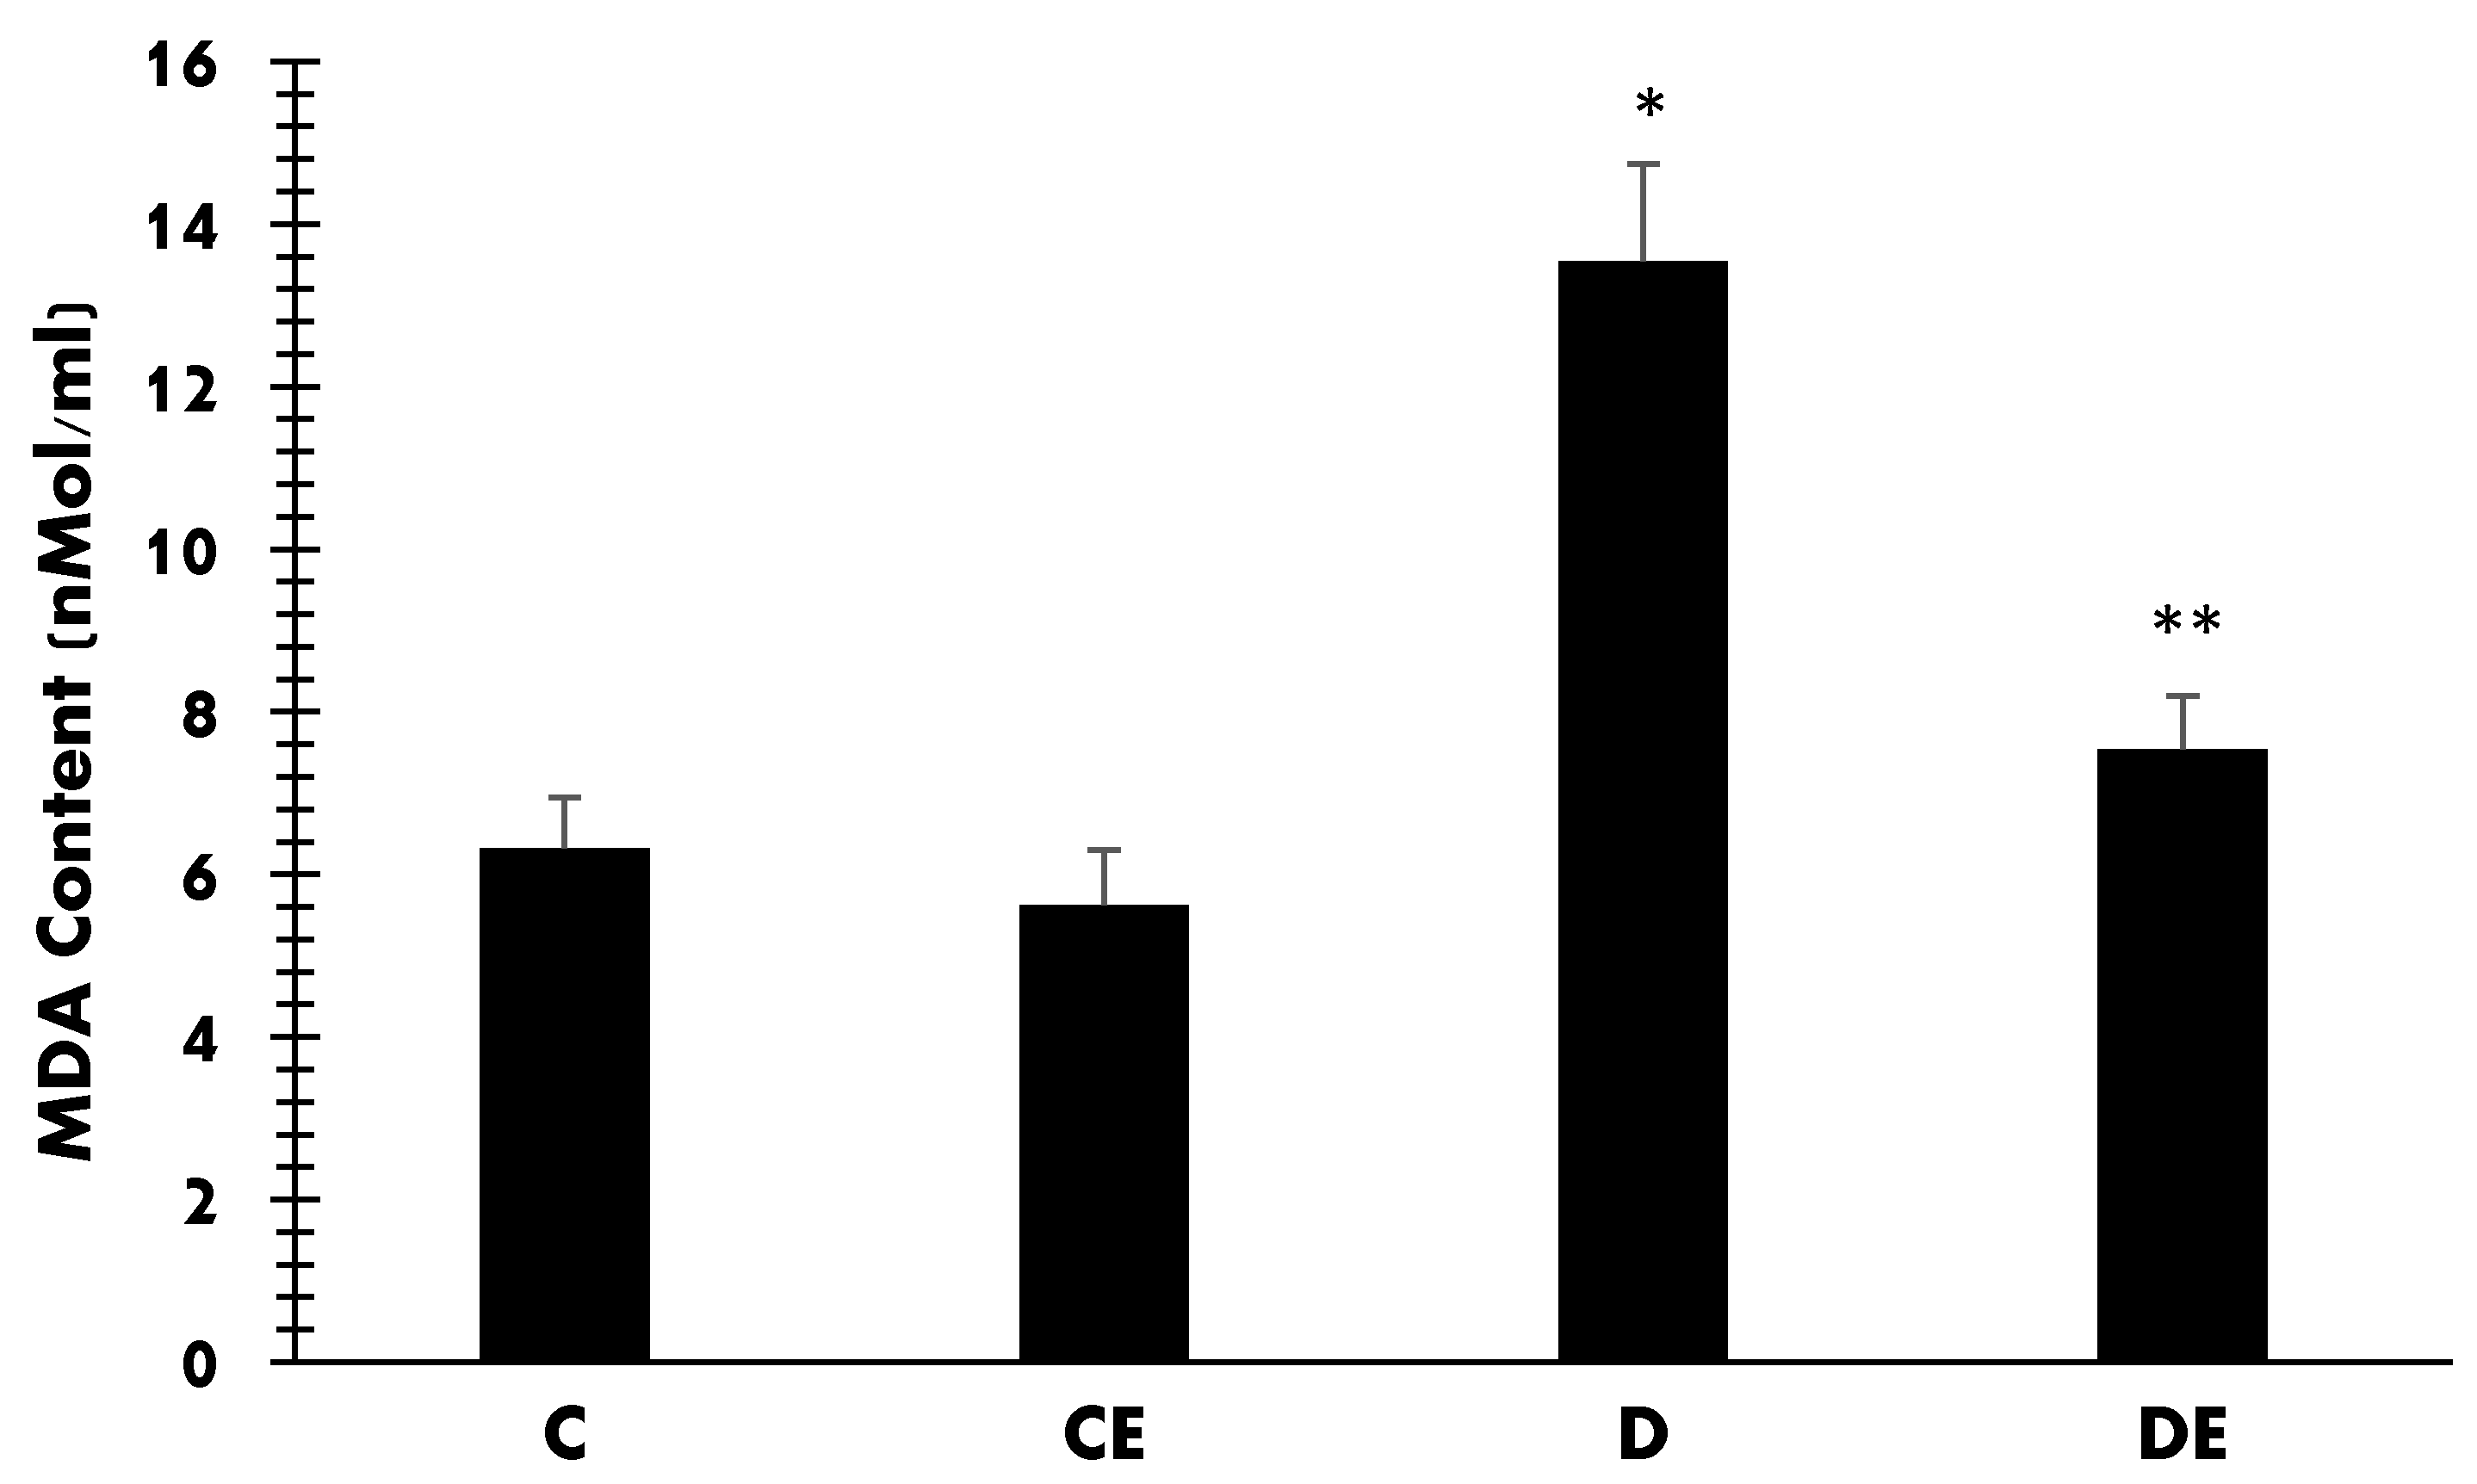
2.4.4. Malondialdehyde (MDA) Content
2.5. Data Analyses
2.6. Ethical Considerations
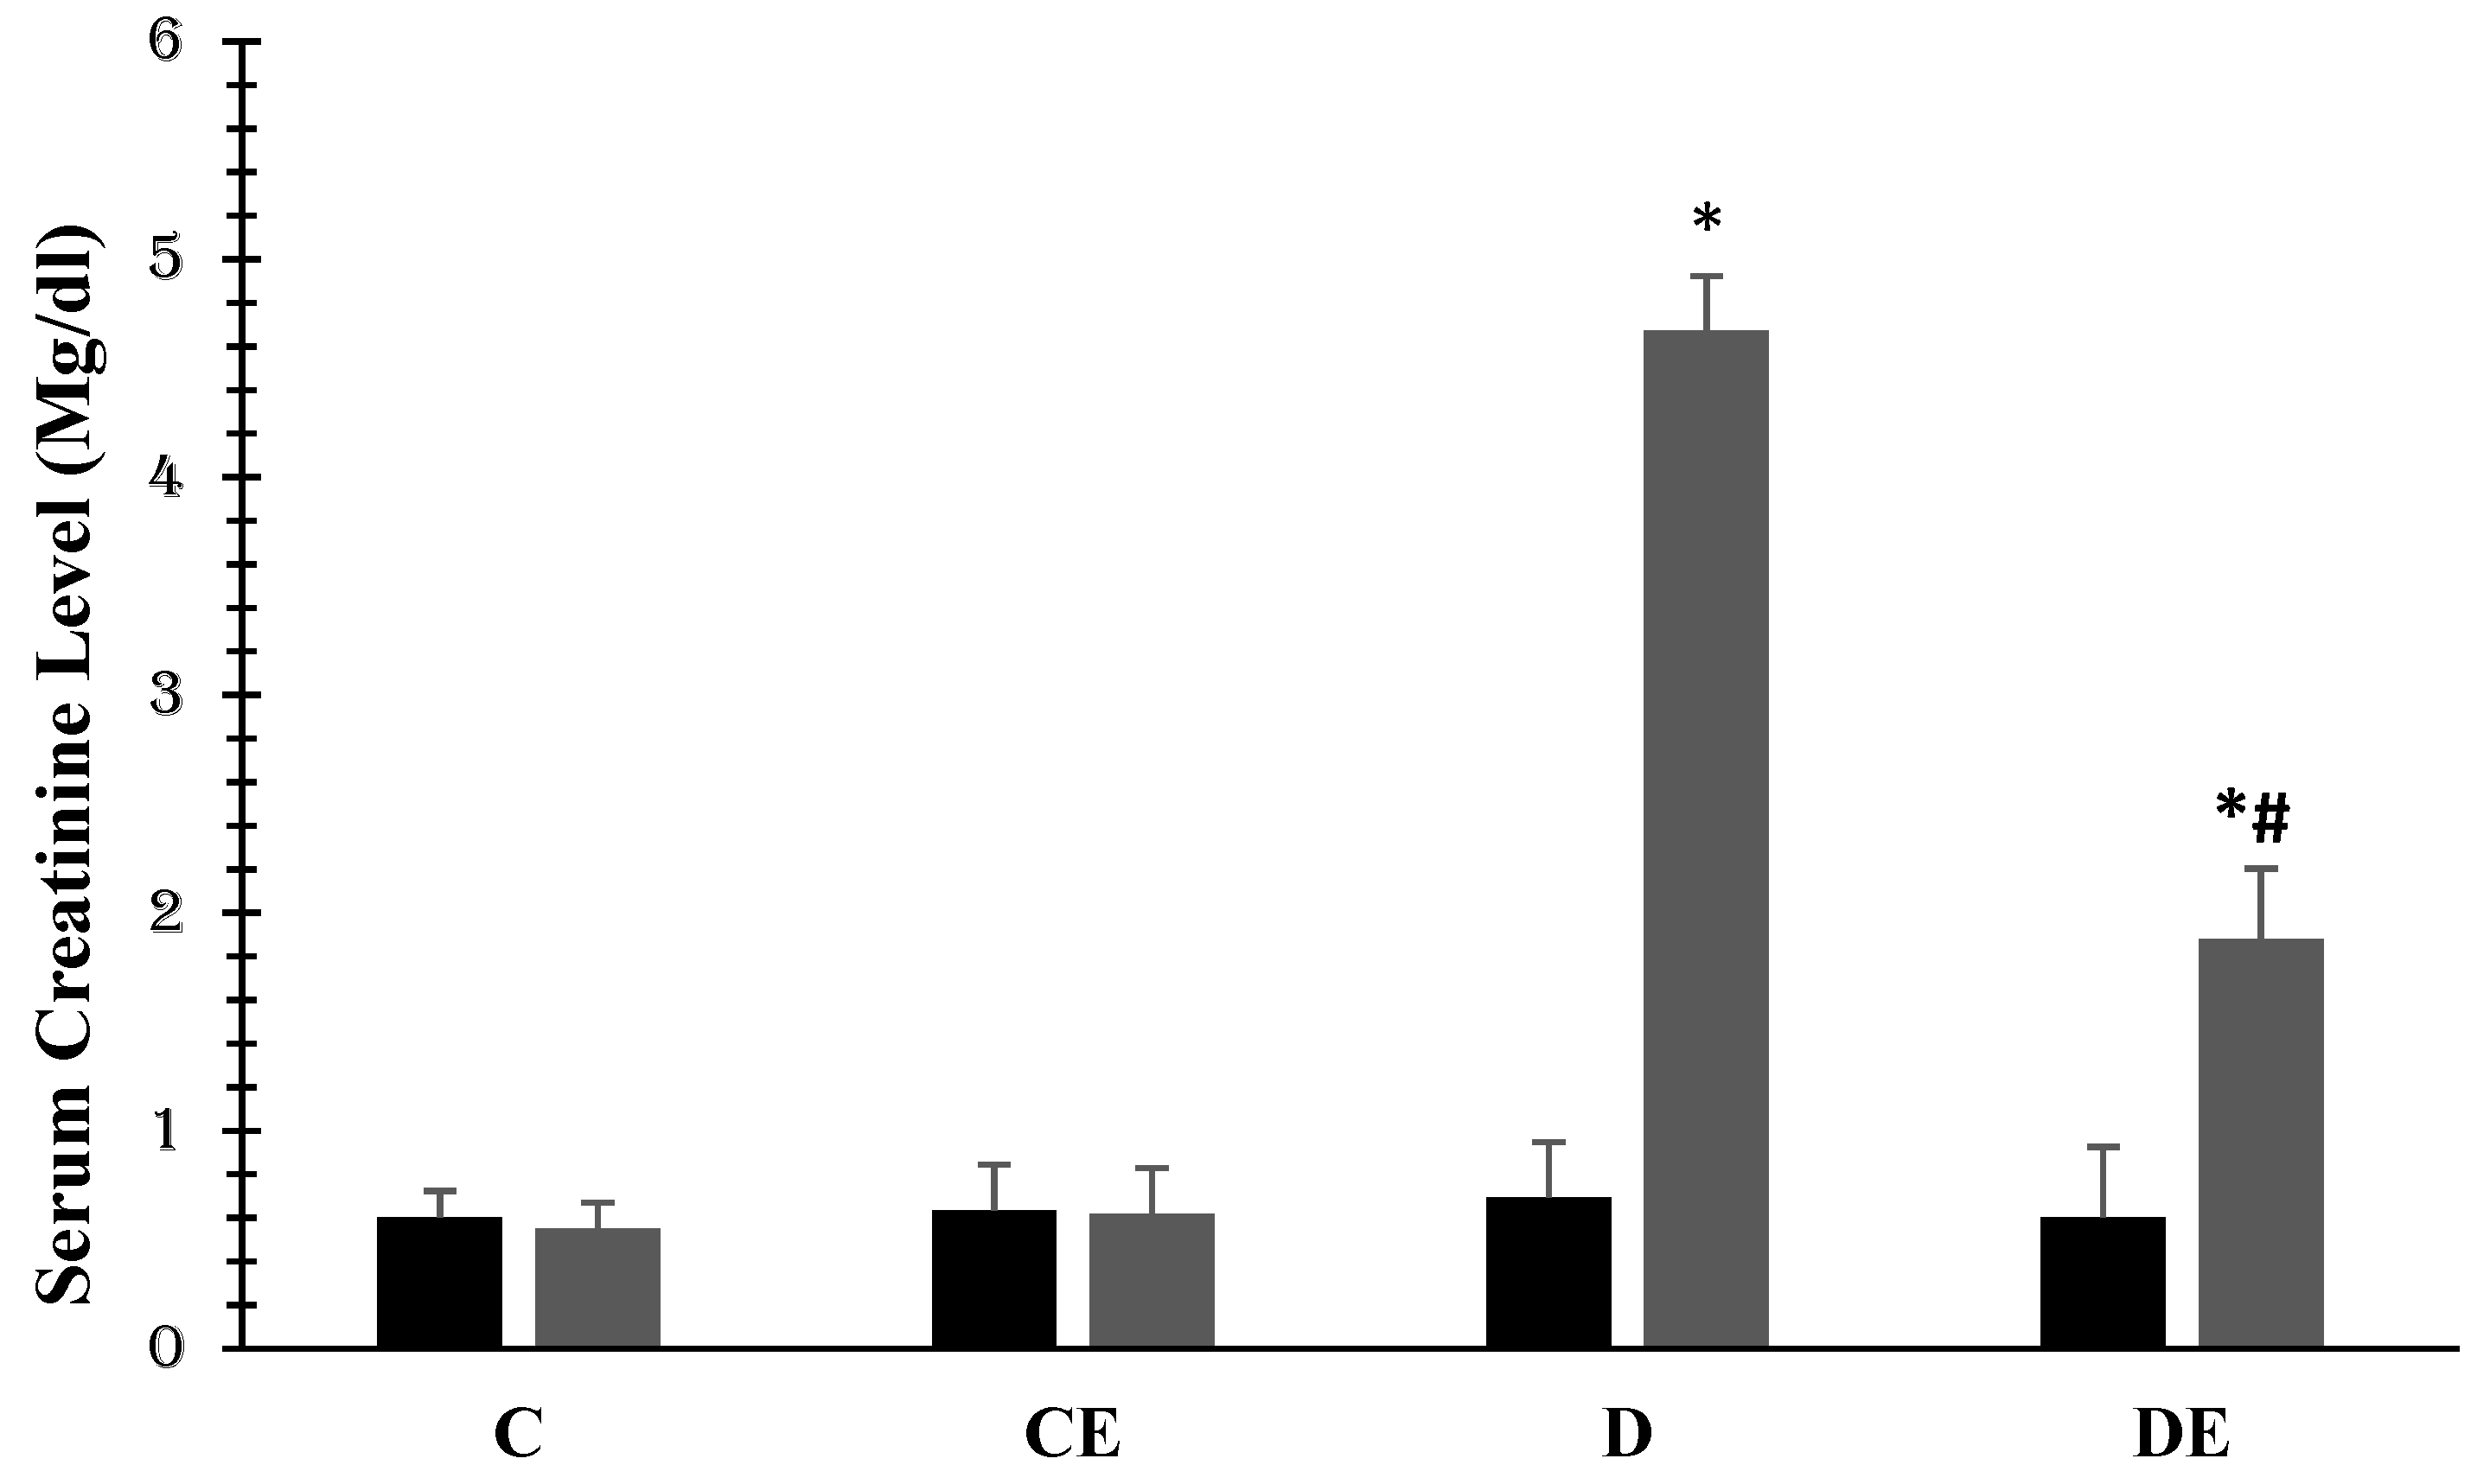
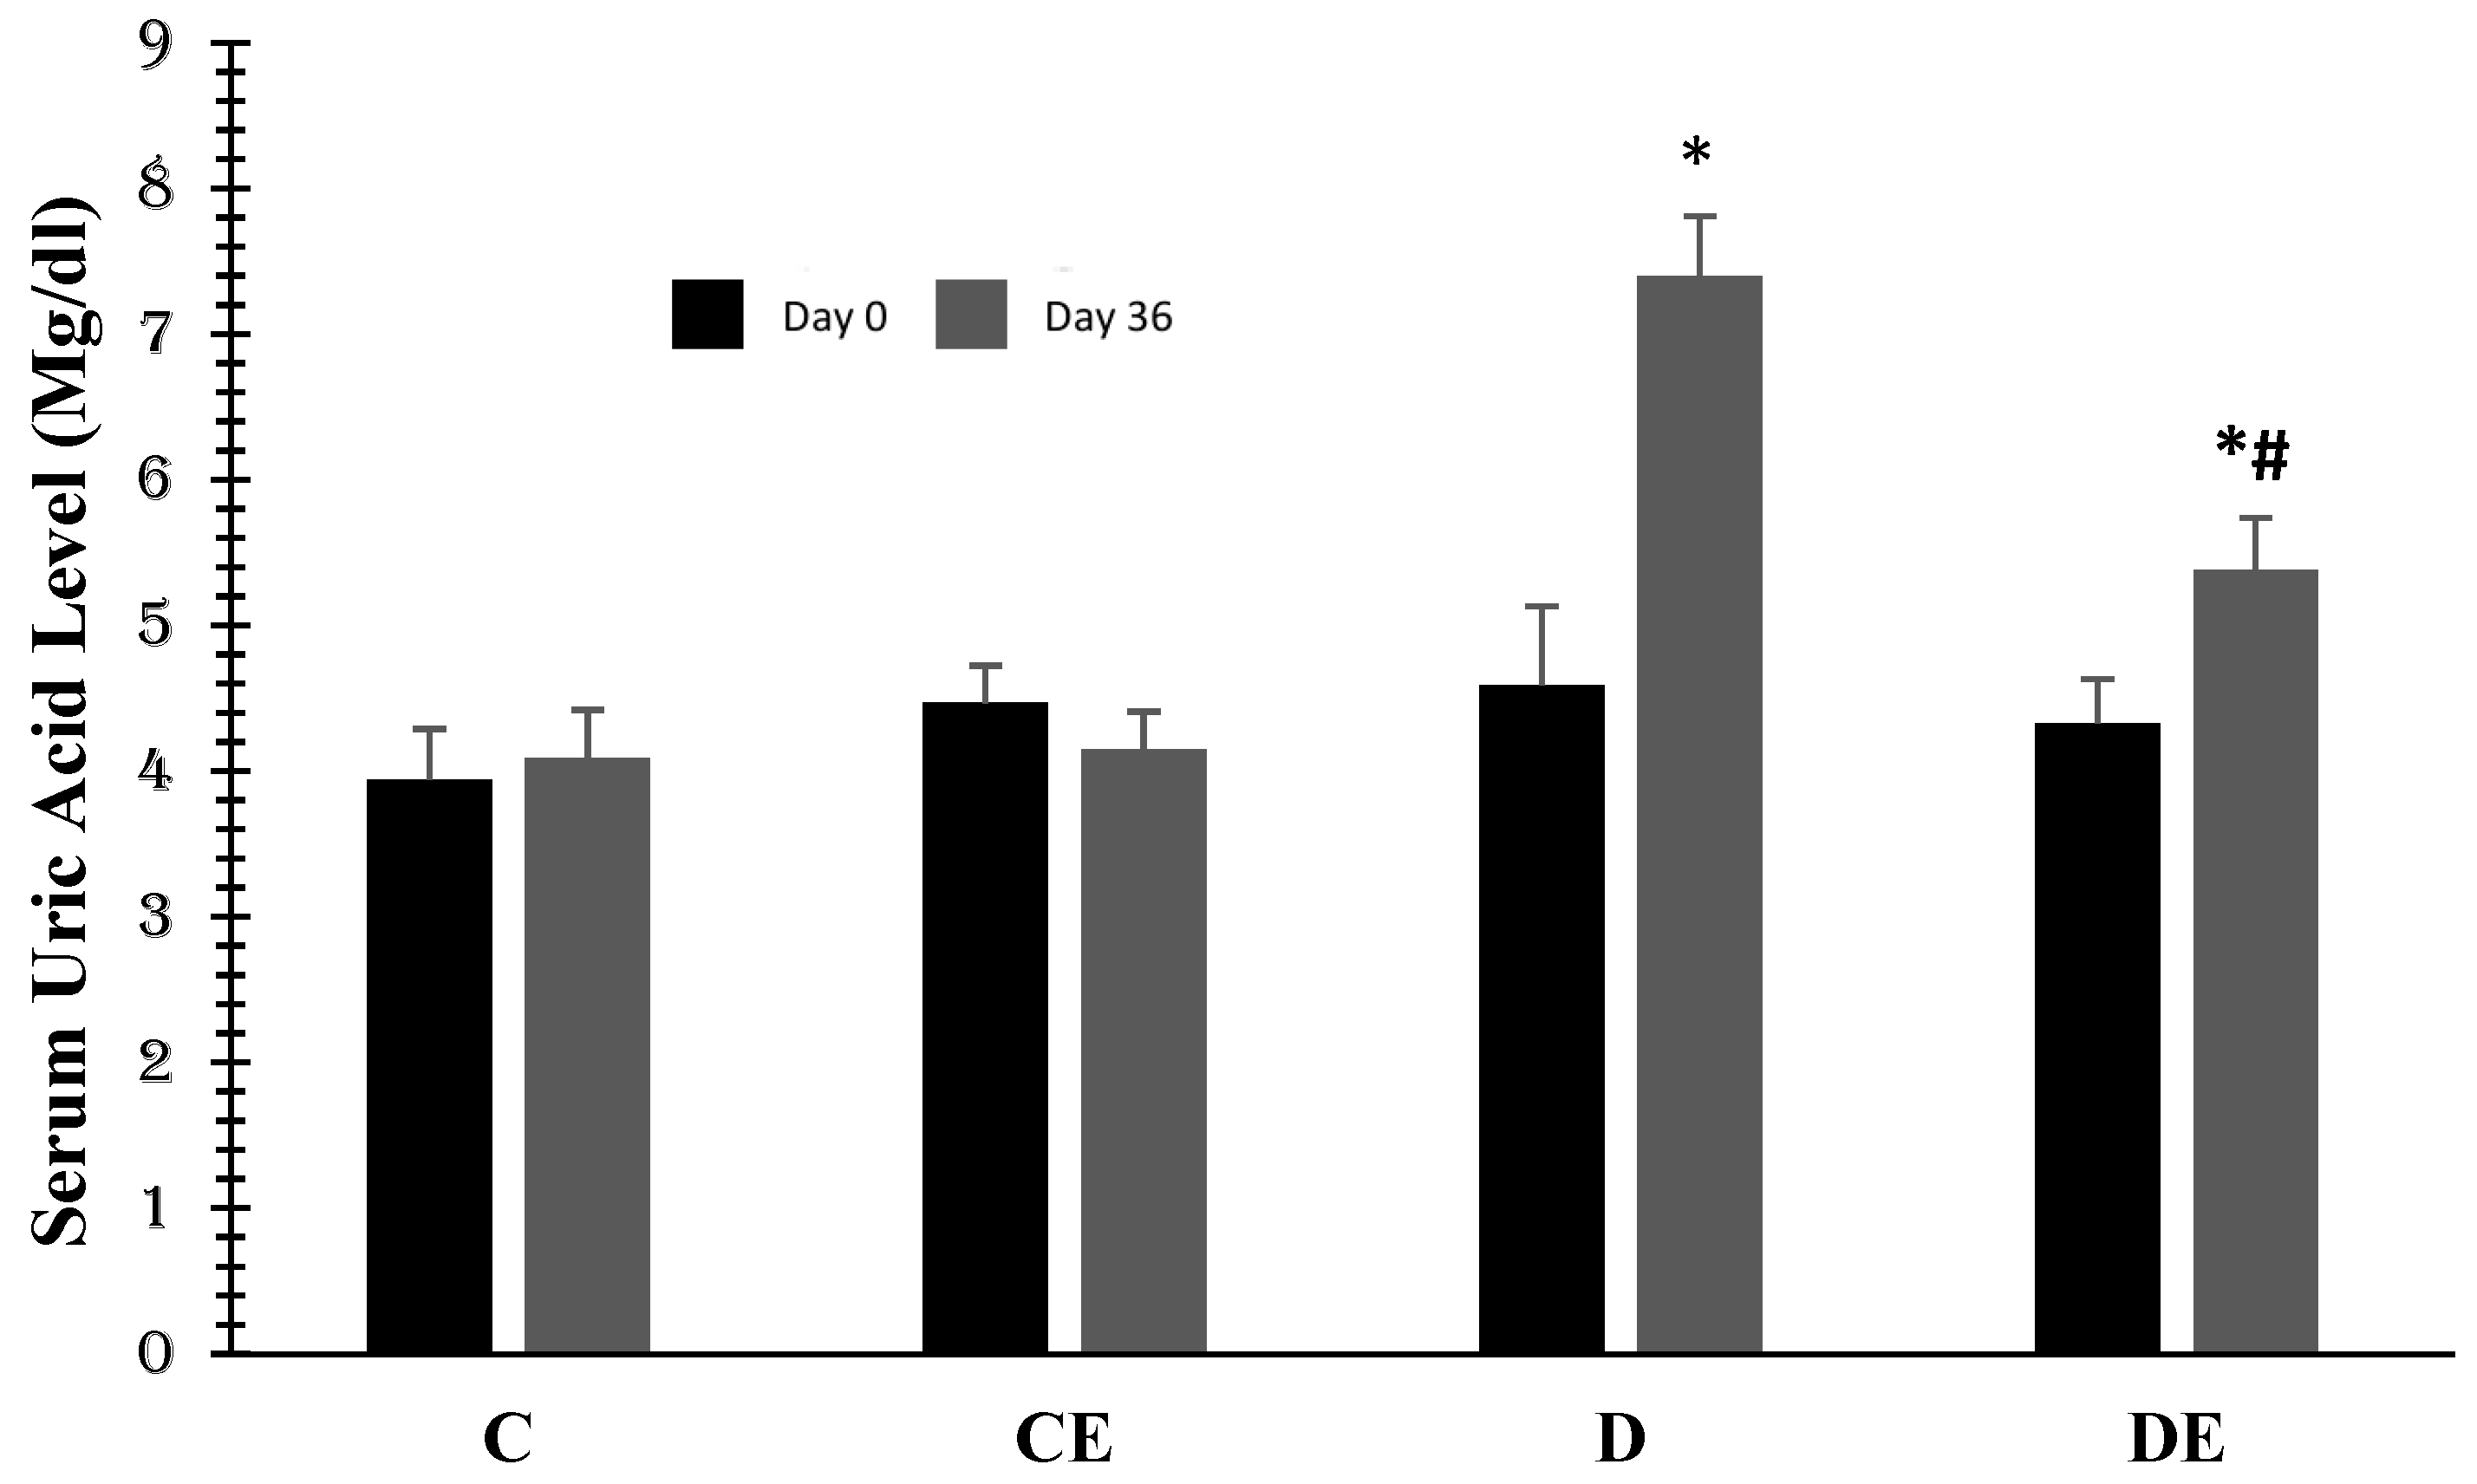
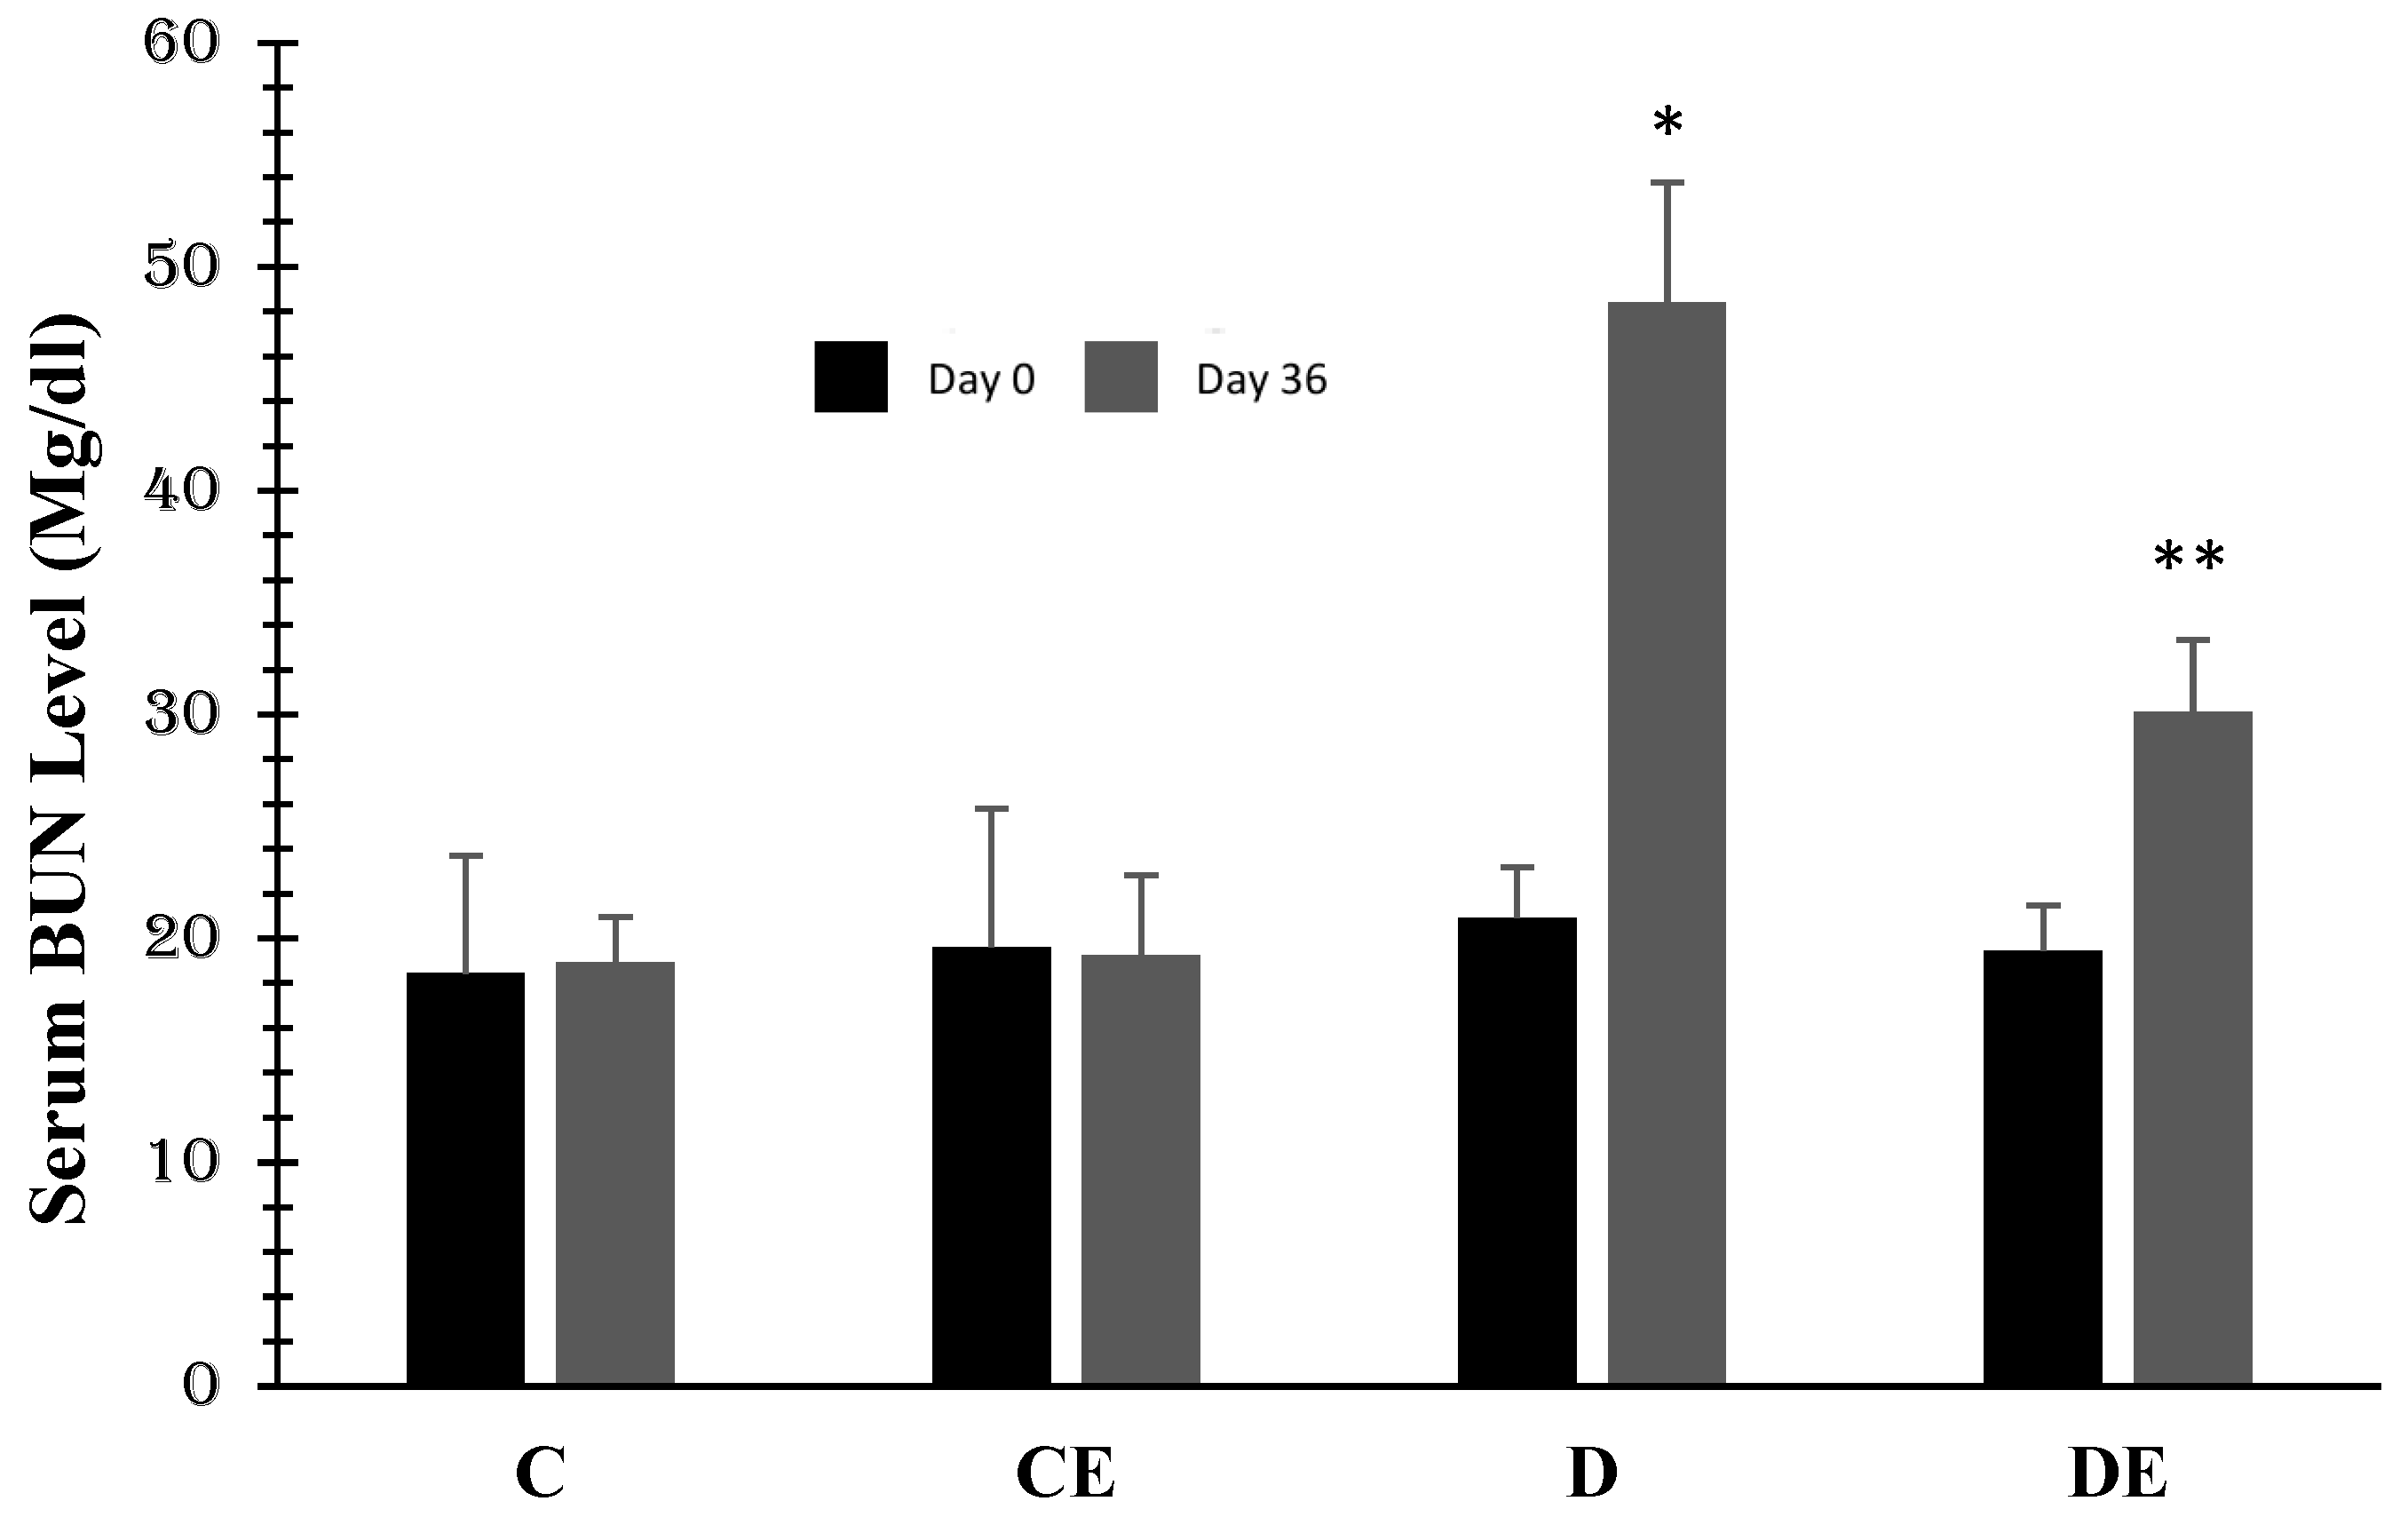
3. Results
4. Discussion
5. Conclusions
Author Contributions
Funding
Institutional Review Board Statement
Informed Consent Statement
Data Availability Statement
Conflicts of Interest
References
- Mobasseri, M.; Shirmohammadi, M.; Amiri, T.; Vahed, N.; Fard, H.H.; Ghojazadeh, M. Prevalence and incidence of type 1 diabetes in the world: A systematic review and meta-analysis. Health Promot. Perspect. 2020, 10, 98–115. [Google Scholar] [CrossRef] [PubMed]
- Forbes, J.M.; Cooper, M.E. Mechanisms of Diabetic Complications. Physiol. Rev. 2013, 93, 137–188. [Google Scholar] [CrossRef] [PubMed]
- Donate-Correa, J.; Luis-Rodríguez, D.; Martín-Núñez, E.; Tagua, V.G.; Hernández-Carballo, C.; Ferri, C.; Rodríguez-Rodríguez, A.E.; Mora-Fernández, C.; Navarro-González, J.F. Inflammatory Targets in Diabetic Nephropathy. J. Clin. Med. 2020, 9, 458. [Google Scholar] [CrossRef] [PubMed]
- Jorsal, A.; Tarnow, L.; Frystyk, J.; Lajer, M.; Flyvbjerg, A.; Parving, H.-H.; Vionnet, N.; Rossing, P. Serum adiponectin predicts all-cause mortality and end stage renal disease in patients with type I diabetes and diabetic nephropathy. Kidney Int. 2008, 74, 649–654. [Google Scholar] [CrossRef] [PubMed]
- Yaribeygi, H.; Farrokhi, F.R.; Rezaee, R.; Sahebkar, A. Oxidative stress induces renal failure: A review of possible molecular pathways. J. Cell. Biochem. 2018, 119, 2990–2998. [Google Scholar] [CrossRef] [PubMed]
- Capellini, V.K.; Celotto, A.C.; Baldo, C.F.; Olivon, V.C.; Viaro, F.; Rodrigues, A.J.; Evora, P.R.B. Diabetes and vascular disease: Basic concepts of nitric oxide physiology, endothelial dysfunction, oxidative stress and therapeutic possibilities. Curr. Vasc. Pharmacol. 2010, 8, 526–544. [Google Scholar] [CrossRef]
- Mućka, S.; Miodońska, M.; Jakubiak, G.K.; Starzak, M.; Cieślar, G.; Stanek, A. Endothelial Function Assessment by Flow-Mediated Dilation Method: A Valuable Tool in the Evaluation of the Cardiovascular System. Int. J. Environ. Res. Public Health 2022, 19, 11242. [Google Scholar] [CrossRef]
- Yaribeygi, H.; Sathyapalan, T.; Atkin, S.L.; Sahebkar, A. Molecular Mechanisms Linking Oxidative Stress and Diabetes Mellitus. Oxidative Med. Cell. Longev. 2020, 2020, 8609213. [Google Scholar] [CrossRef]
- Yaribeygi, H.; Atkin, S.L.; Sahebkar, A. A review of the molecular mechanisms of hyperglycemia-induced free radical generation leading to oxidative stress. J. Cell. Physiol. 2019, 234, 1300–1312. [Google Scholar] [CrossRef]
- Jakubiak, G.K.; Osadnik, K.; Lejawa, M.; Osadnik, T.; Goławski, M.; Lewandowski, P.; Pawlas, N. “Obesity and Insulin Resistance” Is the Component of the Metabolic Syndrome Most Strongly Associated with Oxidative Stress. Antioxidants 2021, 11, 79. [Google Scholar] [CrossRef]
- Tavafi, M. Diabetic nephropathy and antioxidants. J. Nephropathol. 2013, 2, 20–27. [Google Scholar] [CrossRef] [PubMed]
- Salvatore, T.; Galiero, R.; Caturano, A.; Rinaldi, L.; Di Martino, A.; Albanese, G.; Di Salvo, J.; Epifani, R.; Marfella, R.; Docimo, G.; et al. An Overview of the Cardiorenal Protective Mechanisms of SGLT2 Inhibitors. Int. J. Mol. Sci. 2022, 23, 3651. [Google Scholar] [CrossRef]
- Winiarska, A.; Knysak, M.; Nabrdalik, K.; Gumprecht, J.; Stompór, T. Inflammation and Oxidative Stress in Diabetic Kidney Disease: The Targets for SGLT2 Inhibitors and GLP-1 Receptor Agonists. Int. J. Mol. Sci. 2021, 22, 10822. [Google Scholar] [CrossRef] [PubMed]
- Yaribeygi, H.; Ashrafizadeh, M.; Henney, N.C.; Sathyapalan, T.; Jamialahmadi, T.; Sahebkar, A. Neuromodulatory effects of an-ti-diabetes medications: A mechanistic review. Pharmacol. Res. 2020, 152, 104611. [Google Scholar] [CrossRef]
- Yaribeygi, H.; Atkin, S.L.; Butler, A.E.; Sahebkar, A. Sodium–glucose cotransporter inhibitors and oxidative stress: An update. J. Cell. Physiol. 2019, 234, 3231–3237. [Google Scholar] [CrossRef] [PubMed]
- Yaribeygi, H.; Atkin, S.L.; Jamialahmadi, T.; Sahebkar, A. A review on the effects of new anti-diabetic drugs on platelet function. Endocr. Metab. Immune Disord.-Drug Targets (Former. Curr. Drug Targets-Immune Endocr. Metab. Disord.) 2020, 20, 328–334. [Google Scholar] [CrossRef]
- Yaribeygi, H.; Maleki, M.; Butler, A.E.; Jamialahmadi, T.; Sahebkar, A. Sodium-glucose cotransporter 2 inhibitors and mitochondrial functions: State of the art. EXCLI J. 2023, 22, 53–66. [Google Scholar]
- Yaribeygi, H.; Maleki, M.; Butler, A.E.; Jamialahmadi, T.; Sahebkar, A. Sodium-glucose co-transporter-2 inhibitors and epicardial adiposity. Eur. J. Pharm. Sci. 2022, 180, 106322. [Google Scholar] [CrossRef]
- Yaribeygi, H.; Maleki, M.; Nasimi, F.; Butler, A.E.; Jamialahmadi, T.; Sahebkar, A. Sodium-glucose co-transporter 2 inhibitors and hematopoiesis. J. Cell. Physiol. 2022, 237, 3778–3787. [Google Scholar] [CrossRef]
- Botros, S.R.; Matouk, A.I.; Anter, A.; Khalifa, M.M.; Heeba, G.H. Protective effect of empagliflozin on gentamicin-induced acute renal injury via regulation of SIRT1/NF-κB signaling pathway. Environ. Toxicol. Pharmacol. 2022, 94, 103907. [Google Scholar] [CrossRef]
- Kolkhof, P.; Hartmann, E.; Freyberger, A.; Pavkovic, M.; Mathar, I.; Sandner, P.; Droebner, K.; Joseph, A.; Hüser, J.; Eitner, F. Effects of finerenone combined with empagliflozin in a model of hypertension-induced end-organ damage. Am. J. Nephrol. 2021, 52, 1–11. [Google Scholar] [CrossRef] [PubMed]
- Winterbourn, C.C.; E Hawkins, R.; Brian, M.; Carrell, R.W. The estimation of red cell superoxide dismutase activity. Transl. Res. 1975, 85, 337–341. [Google Scholar]
- Aebi, H. Catalase in vitro. In Methods in Enzymology; Academic Press: Cambridge, MA, USA, 1984; Volume 105, pp. 121–126. [Google Scholar]
- Tietze, F. Enzymic method for quantitative determination of nanogram amounts of total and oxidized glutathione: Applications to mammalian blood and other tissues. Anal. Biochem. 1969, 27, 502–522. [Google Scholar] [CrossRef] [PubMed]
- Satoh, M.; Fujimoto, S.; Haruna, Y.; Arakawa, S.; Horike, H.; Komai, N.; Sasaki, T.; Tsujioka, K.; Makino, H.; Kashihara, N. NAD(P)H oxidase and uncoupled nitric oxide synthase are major sources of glomerular superoxide in rats with experimental diabetic nephropathy. Am. J. Physiol. Physiol. 2005, 288, F1144–F1152. [Google Scholar] [CrossRef]
- Kakio, Y.; A Uchida, H.; Takeuchi, H.; Okuyama, Y.; Okuyama, M.; Umebayashi, R.; Wada, K.; Sugiyama, H.; Sugimoto, K.; Rakugi, H.; et al. Diabetic nephropathy is associated with frailty in patients with chronic hemodialysis. Geriatr. Gerontol. Int. 2018, 18, 1597–1602. [Google Scholar] [CrossRef]
- Sagoo, M.K.; Gnudi, L. Diabetic Nephropathy: An Overview. Diabet. Nephrop. 2019, 2067, 3–7. [Google Scholar] [CrossRef]
- Retnakaran, R.; Cull, C.A.; Thorne, K.I.; Adler, A.I.; Holman, R.R.; UKPDS Study Group. Risk factors for renal dysfunction in type 2 diabetes: UK Prospective Diabetes Study 74. Diabetes 2006, 55, 1832–1839. [Google Scholar] [CrossRef]
- Hussain, S.; Jamali, M.C.; Habib, A.; Hussain, S.; Akhtar, M.; Najmi, A.K. Diabetic kidney disease: An overview of prevalence, risk factors, and biomarkers. Clin. Epidemiology Glob. Health 2020, 9, 2–6. [Google Scholar] [CrossRef]
- Idowu, A.A.; Ajose, A.O.; Adedeji, A.T.; Adegoke, A.O.; Jimoh, K.A. Microalbuminuria, other markers of nephropathy and biochemical derangements in type 2 diabetes mellitus: Relationships and determinants. Ghana Med. J. 2017, 51, 56–63. [Google Scholar]
- Schleicher, E.D. Biochemical aspects of diabetic nephropathy. In The Kidney and Hypertension in Diabetes Mellitus; Springer: Berlin/Heidelberg, Germany, 1998; pp. 269–279. [Google Scholar]
- Kamiyama, M.; Urushihara, M.; Morikawa, T.; Konishi, Y.; Imanishi, M.; Nishiyama, A.; Kobori, H. Oxidative Stress/Angiotensinogen/Renin-Angiotensin System Axis in Patients with Diabetic Nephropathy. Int. J. Mol. Sci. 2013, 14, 23045–23062. [Google Scholar] [CrossRef]
- Yaribeygi, H.; Mohammadi, M.T.; Sahebkar, A. Crocin potentiates antioxidant defense system and improves oxidative damage in liver tissue in diabetic rats. Biomed. Pharmacother. 2018, 98, 333–337. [Google Scholar] [CrossRef]
- Yaribeygi, H.; Mohammadi, M.T.; Sahebkar, A. PPAR-α Agonist Improves Hyperglycemia-Induced Oxidative Stress in Pancreatic Cells by Potentiating Antioxidant Defense System. Drug Res. 2018, 68, 355–360. [Google Scholar] [CrossRef]
- Yaribeygi, H.; Mohammadi, M.T.; Rezaee, R.; Sahebkar, A. Crocin improves renal function by declining Nox-4, IL-18, and p53 expression levels in an experimental model of diabetic nephropathy. J. Cell. Biochem. 2018, 119, 6080–6093. [Google Scholar] [CrossRef] [PubMed]
- Gilani, S.J.; Bin-Jumah, M.N.; Al-Abbasi, F.A.; Nadeem, M.S.; Afzal, M.; Sayyed, N.; Kazmi, I. Fustin ameliorates hyperglycemia in streptozotocin induced type-2 diabetes via modulating glutathione/Superoxide dismutase/Catalase expressions, suppress lipid peroxidation and regulates histopathological changes. Saudi J. Biol. Sci. 2021, 28, 6963–6971. [Google Scholar] [CrossRef] [PubMed]
- Sanad, F.A.-A.; Ahmed, S.F.; El-Tantawy, W.H. Antidiabetic and hypolipidemic potentials of Solidago virgaurea extract in alloxan-induced diabetes type 1. Arch. Physiol. Biochem. 2022, 128, 716–723. [Google Scholar] [CrossRef] [PubMed]
- Sadi, G.; Yılmaz; Güray, T.; Yilmaz, O. Effect of vitamin C and lipoic acid on streptozotocin-induced diabetes gene expression: mRNA and protein expressions of Cu–Zn SOD and catalase. Mol. Cell. Biochem. 2008, 309, 109–116. [Google Scholar] [CrossRef] [PubMed]
- Sindhu, R.K.; Koo, J.R.; Roberts, C.K.; Vaziri, N.D. Dysregulation of hepatic superoxide dismutase, catalase and glutathione peroxidase in diabetes: Response to insulin and antioxidant therapies. Clin. Exp. Hypertens. 2004, 26, 43–53. [Google Scholar] [CrossRef]
- Lutchmansingh, F.K.; Hsu, J.W.; Bennett, F.I.; Badaloo, A.; McFarlane-Anderson, N.; Gordon-Strachan, G.M.; Wright-Pascoe, R.A.; Jahoor, F.; Boyne, M.S. Glutathione metabolism in type 2 diabetes and its relationship with microvascular complications and glycemia. PLoS ONE 2018, 13, e0198626. [Google Scholar] [CrossRef]
- Darmaun, D.; Smith, S.D.; Sweeten, S.; Sager, B.K.; Welch, S.; Mauras, N. Evidence for Accelerated Rates of Glutathione Utilization and Glutathione Depletion in Adolescents With Poorly Controlled Type 1 Diabetes. Diabetes 2005, 54, 190–196. [Google Scholar] [CrossRef]
- Jigheh, Z.A.; Haghjo, A.G.; Argani, H.; Roshangar, L.; Rashtchizadeh, N.; Sanajou, D.; Ahmad, S.N.S.; Rashedi, J.; Dastmalchi, S.; Abbasi, M.M. Empagliflozin alleviates renal inflammation and oxidative stress in streptozotocin-induced diabetic rats partly by repressing HMGB1-TLR4 receptor axis. Iran J. Basic Med. Sci 2019, 22, 384–390. [Google Scholar] [CrossRef]
- Iannantuoni, F.M.; De Marañon, A.; Diaz-Morales, N.; Falcon, R.; Bañuls, C.; Abad-Jimenez, Z.; Victor, V.M.; Hernandez-Mijares, A.; Rovira-Llopis, S. The SGLT2 inhibitor empagliflozin ameliorates the inflammatory profile in type 2 diabetic patients and promotes an antioxidant response in leukocytes. J. Clin. Med. 2019, 8, 1814. [Google Scholar] [CrossRef] [PubMed]
- Nevola, R.; Alfano, M.; Pafundi, P.C.; Brin, C.; Gragnano, F.; Calabrò, P.; Adinolfi, L.E.; Rinaldi, L.; Sasso, F.C.; Caturano, A. Cardiorenal Impact of SGLT-2 Inhibitors: A Conceptual Revolution in The Management of Type 2 Diabetes, Heart Failure and Chronic Kidney Disease. Rev. Cardiovasc. Med. 2022, 23, 0106. [Google Scholar] [CrossRef] [PubMed]
- Oelze, M.; Kröller-Schön, S.; Welschof, P.; Jansen, T.; Hausding, M.; Mikhed, Y.; Stamm, P.; Mader, M.; Zinßius, E.; Agdauletova, S.; et al. The sodium-glucose co-transporter 2 inhibitor empagliflozin improves diabetes-induced vascular dysfunction in the strepto-zotocin diabetes rat model by interfering with oxidative stress and glucotoxicity. PLoS ONE 2014, 9, e112394. [Google Scholar] [CrossRef]
- Steven, S.; Oelze, M.; Hanf, A.; Kröller-Schön, S.; Kashani, F.; Roohani, S.; Welschof, P.; Kopp, M.; Gödtel-Armbrust, U.; Xia, N.; et al. The SGLT2 inhibitor empagliflozin improves the primary diabetic complications in ZDF rats. Redox Biol. 2017, 13, 370–385. [Google Scholar] [CrossRef] [PubMed]


| Groups | Serum Glucose | |
|---|---|---|
| Day 0 | Day 36 | |
| Control | 97 ± 11 | 103 ± 8 |
| Control + Empagliflozin | 96 ± 12 | 100 ± 9 |
| Diabetes | 268 ± 22 | 160 ± 13 |
| Diabetes + Empagliflozin | 268 ± 22 | 131 ± 11 |
Disclaimer/Publisher’s Note: The statements, opinions and data contained in all publications are solely those of the individual author(s) and contributor(s) and not of MDPI and/or the editor(s). MDPI and/or the editor(s) disclaim responsibility for any injury to people or property resulting from any ideas, methods, instructions or products referred to in the content. |
© 2023 by the authors. Licensee MDPI, Basel, Switzerland. This article is an open access article distributed under the terms and conditions of the Creative Commons Attribution (CC BY) license (https://creativecommons.org/licenses/by/4.0/).
Share and Cite
Yaribeygi, H.; Hemmati, M.A.; Nasimi, F.; Maleki, M.; Jamialahmadi, T.; Reiner, I.; Reiner, Ž.; Sahebkar, A. Sodium Glucose Cotransporter-2 Inhibitor Empagliflozin Increases Antioxidative Capacity and Improves Renal Function in Diabetic Rats. J. Clin. Med. 2023, 12, 3815. https://doi.org/10.3390/jcm12113815
Yaribeygi H, Hemmati MA, Nasimi F, Maleki M, Jamialahmadi T, Reiner I, Reiner Ž, Sahebkar A. Sodium Glucose Cotransporter-2 Inhibitor Empagliflozin Increases Antioxidative Capacity and Improves Renal Function in Diabetic Rats. Journal of Clinical Medicine. 2023; 12(11):3815. https://doi.org/10.3390/jcm12113815
Chicago/Turabian StyleYaribeygi, Habib, Mohammad Amin Hemmati, Fatemeh Nasimi, Mina Maleki, Tannaz Jamialahmadi, Ivan Reiner, Željko Reiner, and Amirhossein Sahebkar. 2023. "Sodium Glucose Cotransporter-2 Inhibitor Empagliflozin Increases Antioxidative Capacity and Improves Renal Function in Diabetic Rats" Journal of Clinical Medicine 12, no. 11: 3815. https://doi.org/10.3390/jcm12113815
APA StyleYaribeygi, H., Hemmati, M. A., Nasimi, F., Maleki, M., Jamialahmadi, T., Reiner, I., Reiner, Ž., & Sahebkar, A. (2023). Sodium Glucose Cotransporter-2 Inhibitor Empagliflozin Increases Antioxidative Capacity and Improves Renal Function in Diabetic Rats. Journal of Clinical Medicine, 12(11), 3815. https://doi.org/10.3390/jcm12113815